Meru couples planar cell polarity with apical-basal polarity during asymmetric cell division
- The Francis Crick Institute, United Kingdom
- ETH Zürich, Switzerland
- Competence Center Personalized Medicine UZH/ETH, Switzerland
Figures
Figure 1 with 1 supplement

Meru localizes asymmetrically in SOP cells and loss of meru causes bristle defects in adult flies.
(A–A’) Third instar wing imaginal disc stained for Meru (red) and E-cadherin (blue). Meru localizes exclusively in SOP cells. Scale bar = 50 µm. (B–B’) Higher magnification view of the same disc showing the presumptive wing margin region. Meru localizes asymmetrically to one side of the cell cortex in SOP cells. Scale bar = 10 µm. (C–C’) Pupal notum at 15 hr APF stained for E-cadherin (red), Hindsight (blue) and expressing the GFP-Meru knock-in (green). Scale bar = 5 µm. In this and all subsequent notal images, anterior is to the top. (C’’) Diagram of the pupal notum showing the distribution of the SOP cells (grey circles). (C’’’) Diagram outlining the asymmetric division of SOPs (pI), which divide along the anterior-posterior axis into two daughter cells (pIIa and pIIb) of different fates (cell fate determinants are highlighted in turquoise). (D–D’) Time-lapse of GFP-Meru (green) and DNA (red, (D’) localization in a dividing SOP cell. Apical (D) and basolateral projections (D’) are shown for each time point. Time is given in (min:sec) relative to the onset of mitosis (00:00). Scale bar = 5 µm. (E–H’’) Images of adult meru1 mutant (F, H–H’’) and wild type control flies (E, G). meru1 mutants have duplicated stout bristles on the wing margin (F), missing thoracic macrochaetes (H), split thoracic (H’) and abdominal (H’’) microchaetes (defects are indicated by white and black arrows). (I) Quantification of duplicated stout bristles for the indicated genotype (n = 100). The average duplication per wing is written above the chart. (I’) Quantification of missing thoracic macrochaetes (n = 50). (I–I’) Bristle defects in different meru mutants (meru1 and meru2; Df: Df(3L)BSC575, deficiency line for meru). Expression of ubi-GFP-meru rescues the bristle defects of meru1. See Supplementary file 1 for statistics.
-
Figure 1—source data 1
Source data Figure 1.
Related to Figure 1I,I’.
- https://doi.org/10.7554/eLife.25014.003
Figure 1—figure supplement 1
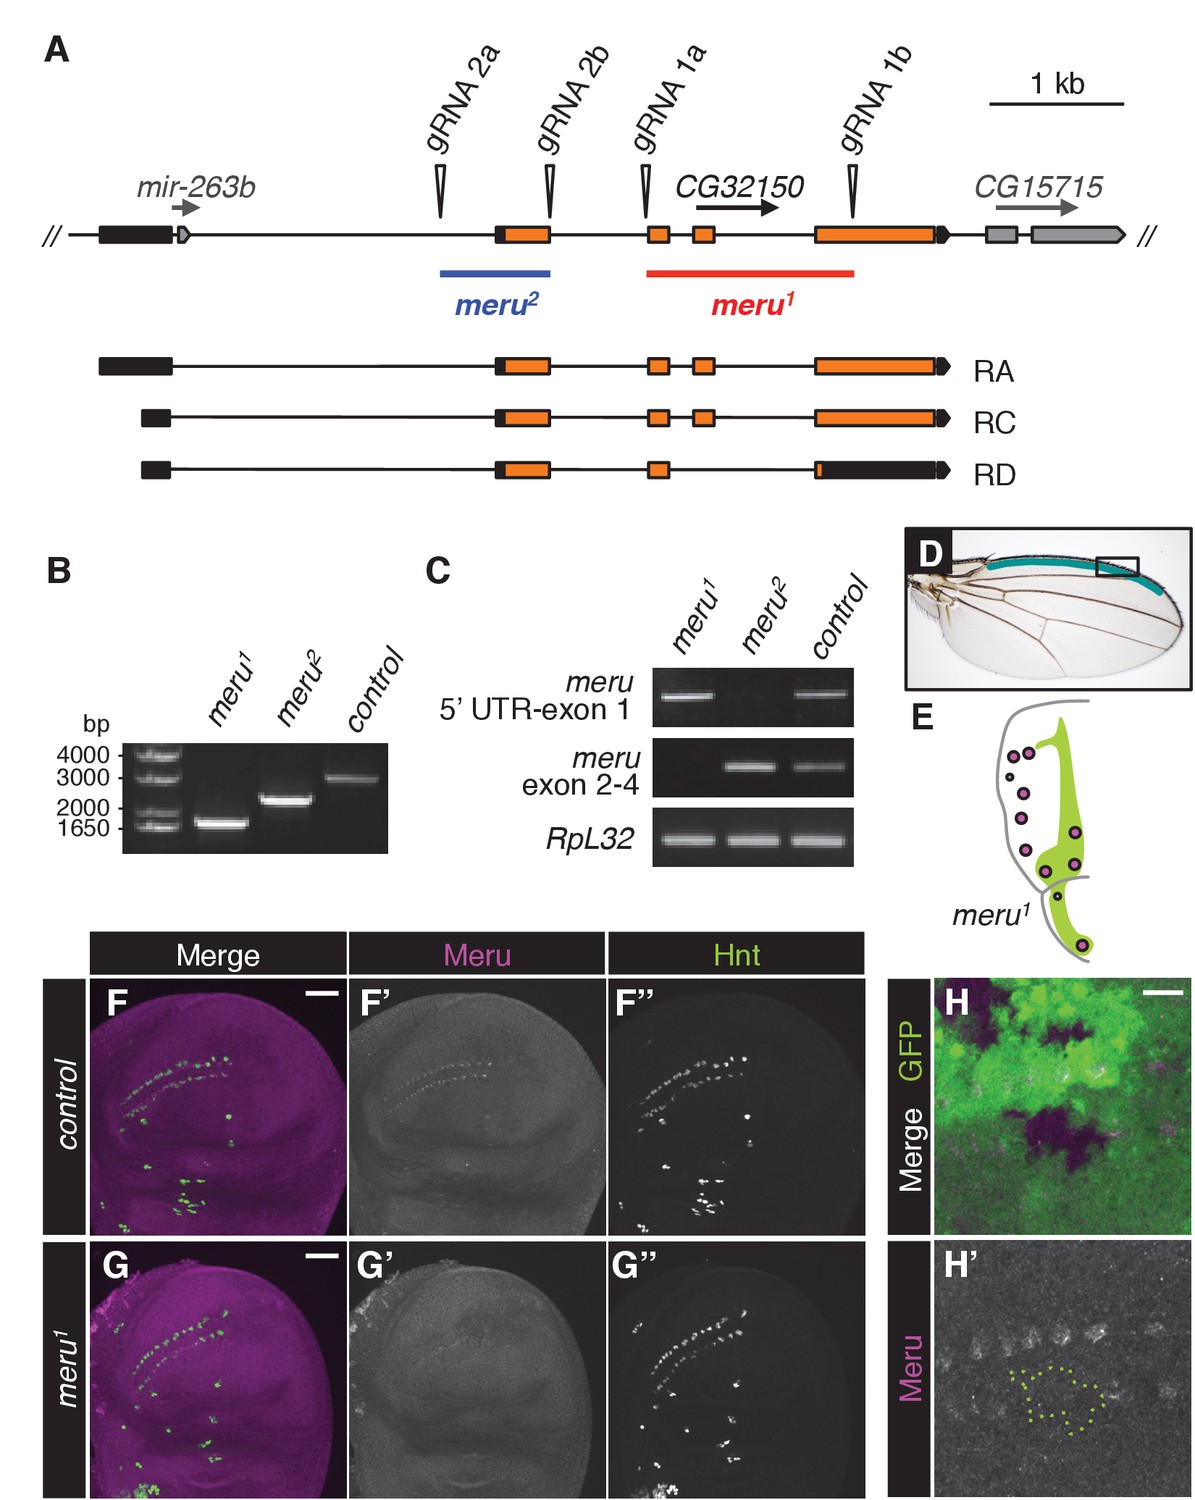
Disruption of meru using the CRISPR/Cas9 system.
(A) Map of the meru (CG32150) locus, showing the predicted cut sites of the two gRNA pairs (1 and 2) used to generate two different deletions, and the three predicted meru transcripts (RA, RC and RD). meru coding sequences are highlighted in orange, untranslated regions in black, the neighboring gene, CG15715 and the micro RNA mir-263b within the first intron of meru in grey. meru1, derived from gRNA pair 1 (marked in red), has exons 2, 3 and part of exon 4 excised. meru2, derived from gRNA pair 2 (marked in blue), lacks exon 1. (B) Genomic PCRs with primers flanking the meru locus performed on DNA from meru mutants or control flies confirming the length of the deletions. (C) RT-PCR on mRNA from meru mutants or control flies showing that truncated transcripts are still expressed for both deletions. meru1 was positive for transcript expression of the 5’ UTR and exon 1, and meru2 for expression of exons 2 to 4. (D) Wing of an adult fly outlining the stout bristle region on the anterior wing margin (highlighted in teal). The black box outlines the region of the close-up images from Figure 1 and Figure 3. (E) Schematic of the affected macrochaetes (highlighted in purple) in meru1 mutants. The Wingless expression pattern is highlighted in green, adapted from (Simpson, 2007). (F–G’’) Third instar wing imaginal discs stained for Meru (purple) and Hindsight (green). Meru is found exclusively in SOP cells (F–F’’) and not detectable in wing discs of meru1 mutants (G–G’’). Scale bar = 50 µm. (H–H’) hsFLP-induced mitotic clones of meru1 stained for Meru (purple). Wild type tissue is GFP positive and meru1 mutant tissue GFP negative (outlined with a green dashed line in H’). Scale bar = 10 µm.
Figure 2 with 1 supplement
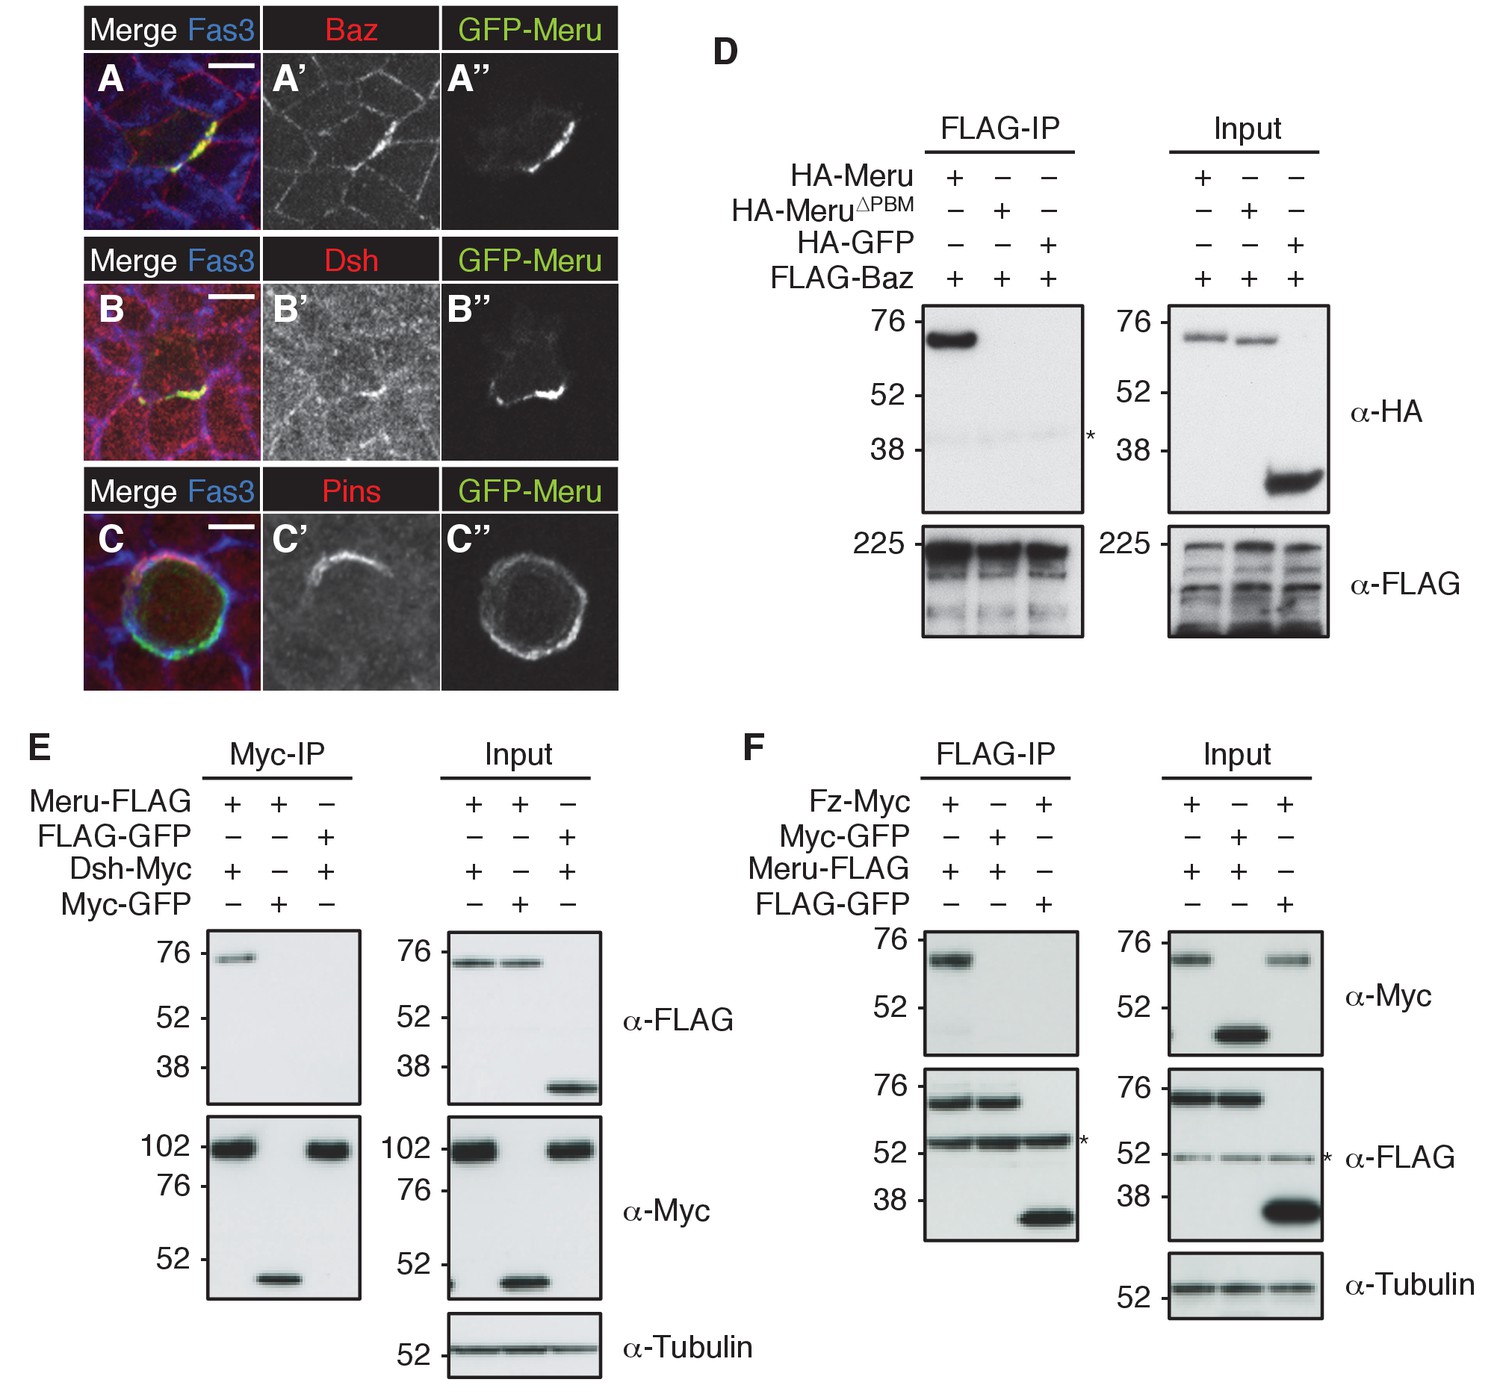
Meru co-localizes and associates with posterior SOP polarity components.
(A–A’’) Pupal notum of a GFP-meru knock-in animal at 15–16 hr APF stained for Baz (red) and Fas3 (blue). Endogenous GFP-Meru (green) co-localizes with Baz at interphase in SOP cells. (B–B’’) Pupal notum of a GFP-meru knock-in animal at 15–16 hr APF stained for Dsh (red) and Fas3 (blue). GFP-Meru (green) co-localizes with Dsh at interphase in SOP cells. (C–C’’) Pupal notum of a GFP-meru knock-in animal at 15–16 hr APF stained for Pins (red) and Fas3 (blue). GFP-Meru (green) localizes opposite Pins in mitotic SOP cells. (A–C’’) Scale bar = 5 µm. (D–F) Meru co-immunoprecipitates with Baz (D), Dsh (E) and Fz (F) and deletion of the Meru PDZ binding motif (Meru∆PBM) disrupts the interaction with Baz (D). S2 cells were transfected with the indicated tagged constructs, followed by co-immunoprecipitation and immunoblot analysis. Cross-reacting, non-specific bands are labeled with an asterisk.
Figure 2—figure supplement 1

Meru co-localizes and associates with SOP polarity components.
(A) Model of an SOP cell showing the asymmetric organization during division (along the anterior-posterior axis). Polarity groups and cell fate determinants are highlighted in different colors. (B–C’’) Late third instar or white prepupal wing imaginal discs (anterior wing margin region) stained for Meru (red) and E-cadherin (blue). Meru co-localizes with Baz-GFP (B-B’’, knock-in) and Fz-GFP (C-C’’, arm-fz-GFP) in wing disc SOP cells. Scale bar = 5 µm. (D–E’’) Late third instar or white prepupal wing imaginal discs (anterior wing margin region) stained for Meru (red), Arm (blue) and either Dsh or Vang (green). Meru co-localizes with Dsh (D–D’’), but not with Vang (E–E’’) in wing disc SOP cells. Scale bar = 5 µm. (F) The interaction of Fz and Meru is independent of Dsh in co-immunoprecipitation experiments. Endogenous Dsh (black arrow) was depleted by dsh dsRNA treatment. The last two lanes of the input samples show the depletion of Myc-tagged Dsh as a control (white arrow). (G) Meru∆PBM retains the ability to associate with Dsh and Fz, but not Baz, in co-immunoprecipitation experiments. (F–G) S2 cells were transfected with the indicated tagged constructs and, where indicated, treated with dsRNA prior to transfection, followed by co-immunoprecipitation experiments and immunoblot analysis. Cross-reacting, non-specific bands are labeled with an asterisk.
Figure 3 with 1 supplement
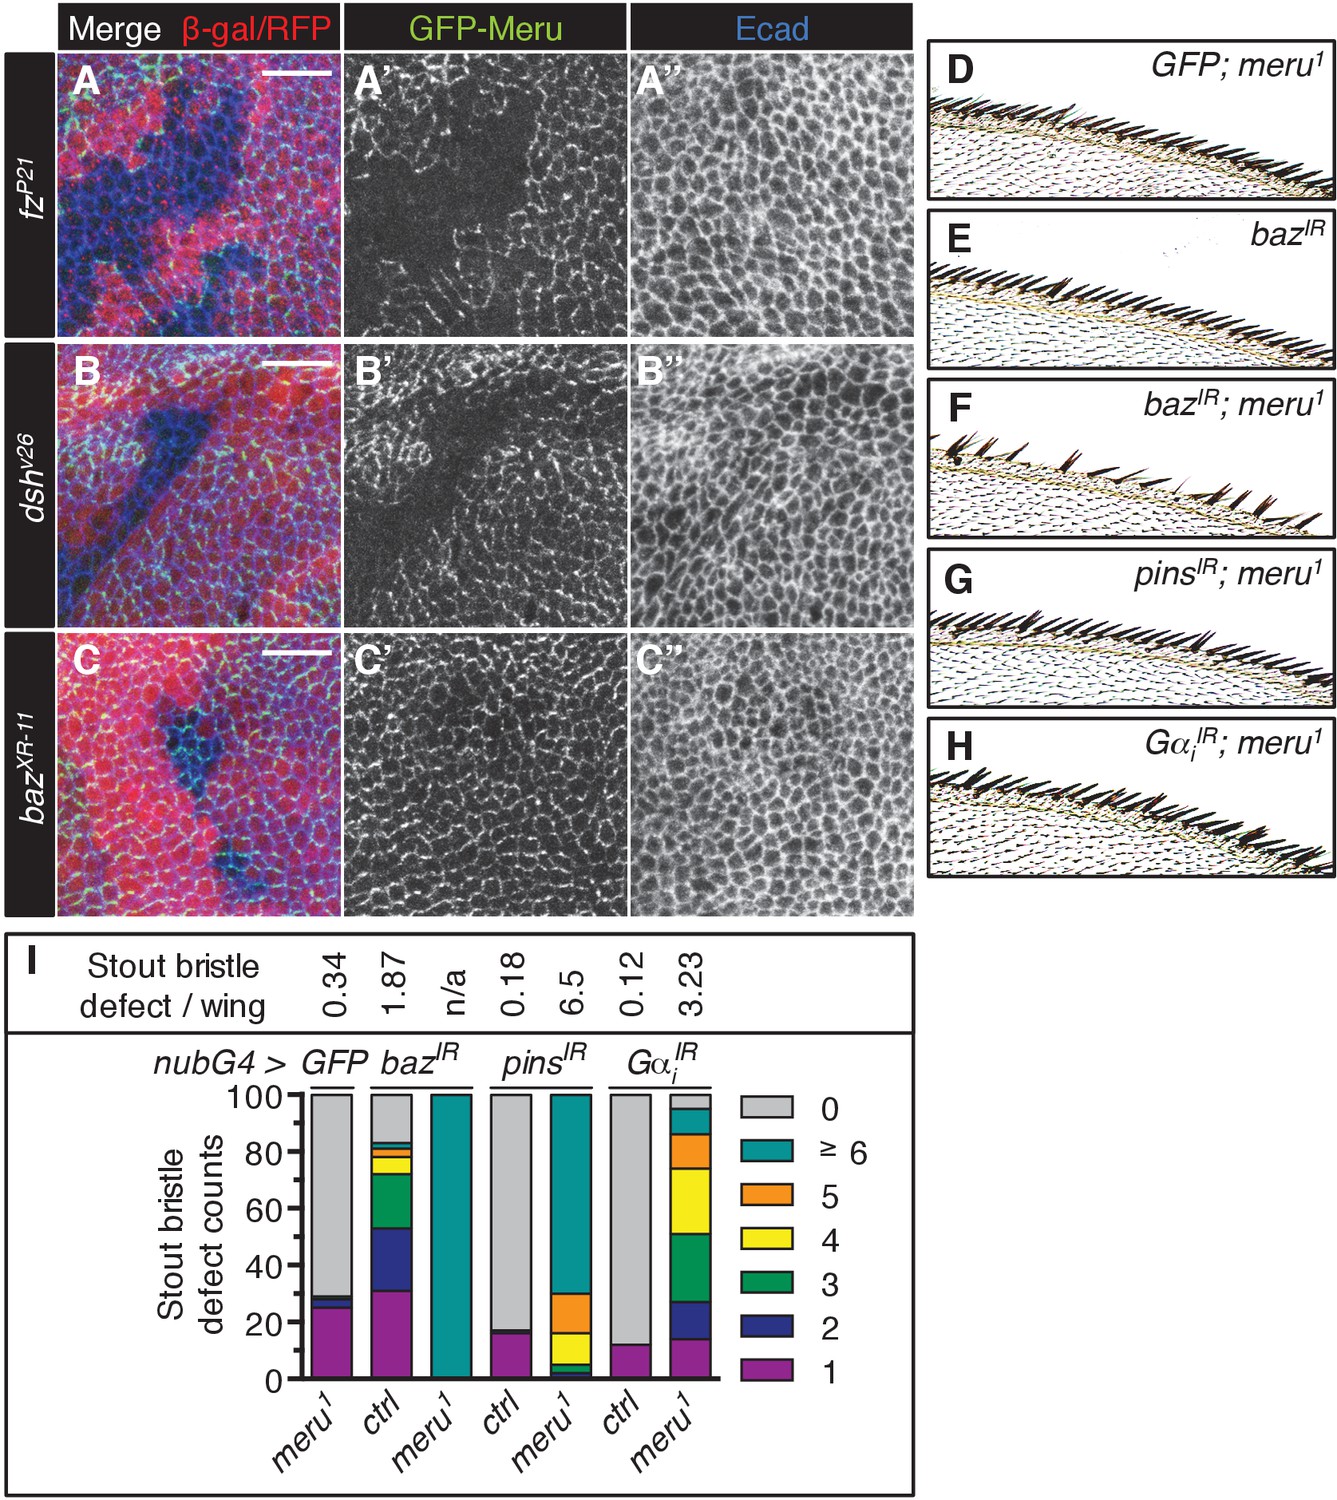
Meru cortical localization requires Fz and Dsh and meru genetically interacts with different SOP polarity determinants.
(A–C’’) Third instar wing imaginal discs stained for E-cadherin. Mitotic clones were induced with UbxFlp for fzP21 and hsFlp for dshv26 and bazXR-11. Wild type tissue is lacZ positive (stained with anti-β-galactosidase in A-A’’) or RFP positive (B–C’’). GFP-meru was expressed under the control of the Ubi-p63E promoter. Scale bar = 10 µm. Cortical GFP-Meru disappears in fzP21 (A–A’’) and dshv26 (B–B’’) clones, but is not affected in bazXR-11 (C–C’’) clones. (D–H) Images of the anterior wing margin of adult flies expressing the indicated RNAi lines with nubbin-Gal4 in wild type (E) or meru1 mutants. Expression of GFP (as a control) in meru1 mutants (D), bazIR on its own (E) and bazIR (F), pinsIR (G) and GαiIR (H) in combination with meru1. (I) Knockdown of baz, pins or Gαi all cause duplicated stout bristles on their own and strongly increase the defect in meru1 mutants (n = 100). See Supplementary file 1 for statistics.
-
Figure 3—source data 1
Source data Figure 3.
Related to Figure 3I.
- https://doi.org/10.7554/eLife.25014.008
Figure 3—figure supplement 1
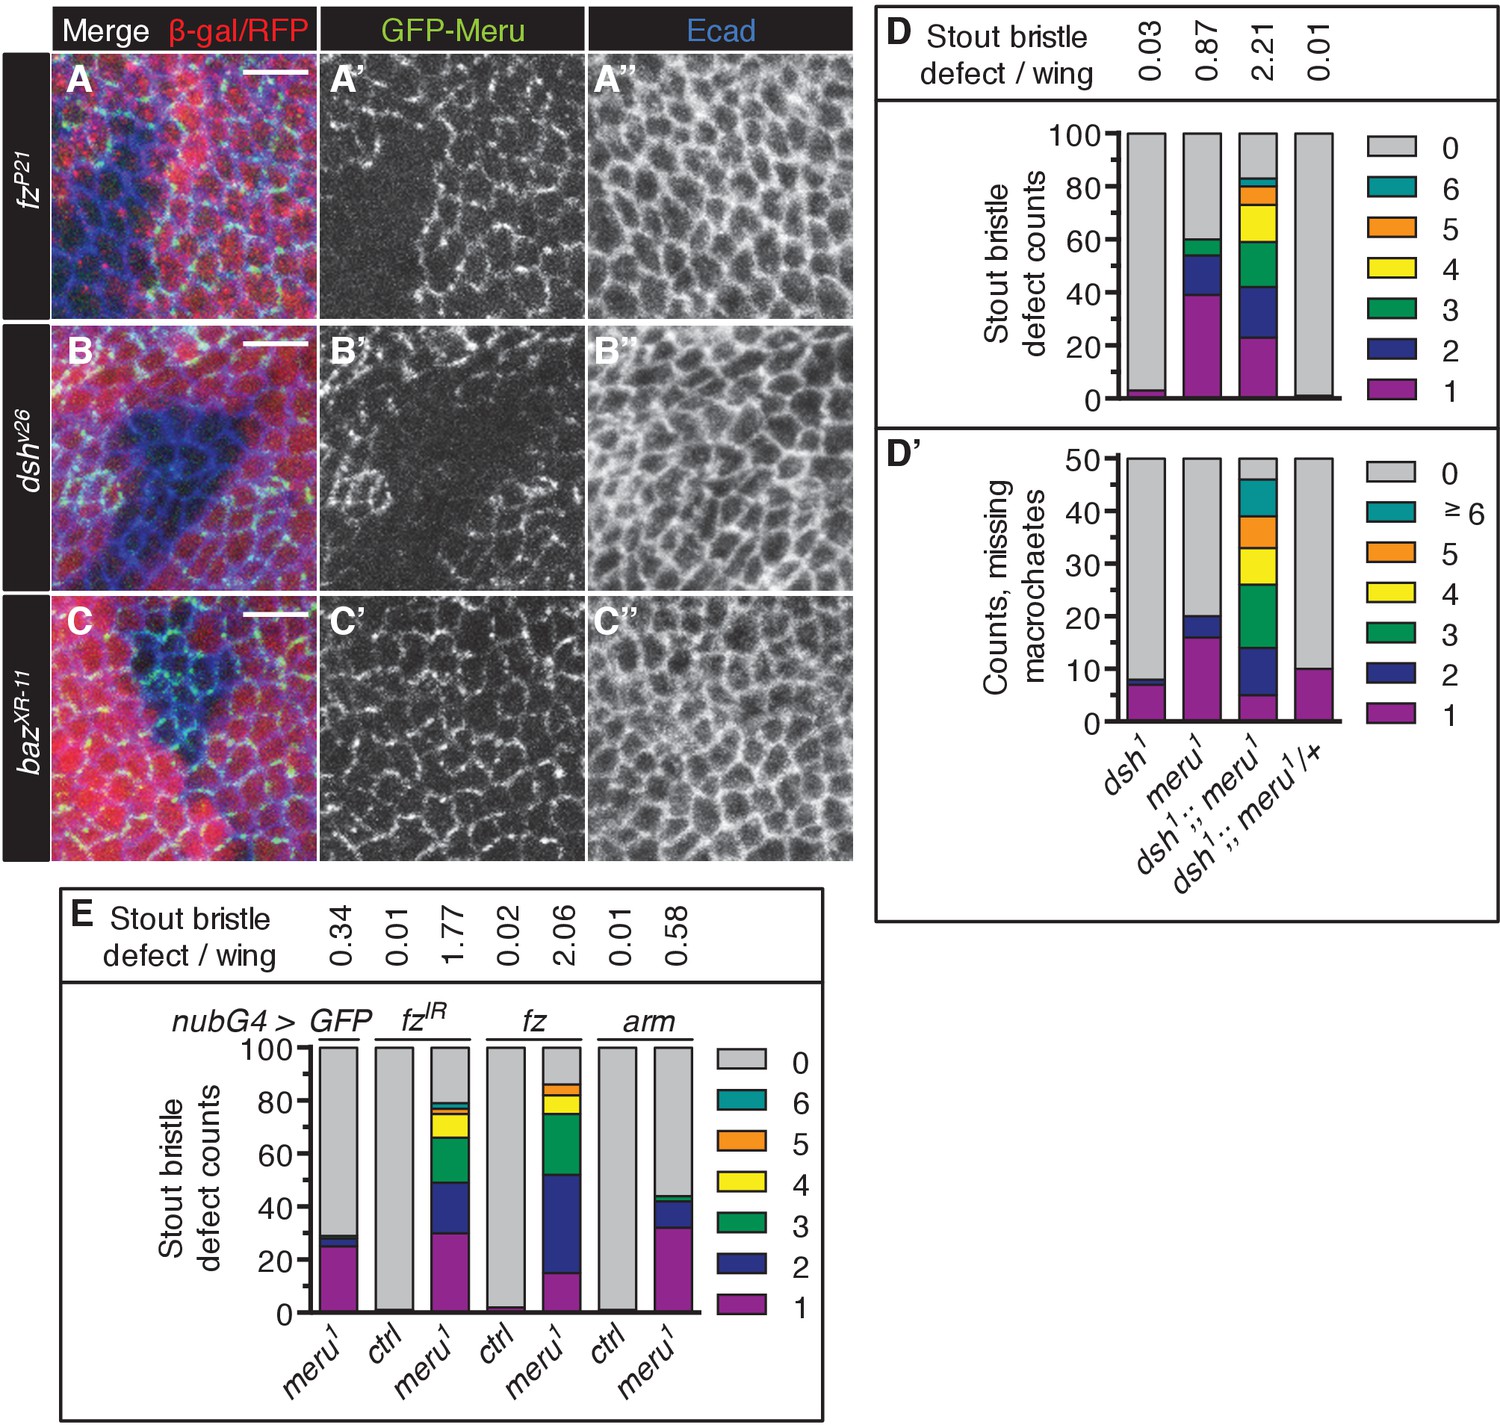
Genetic interactions of meru mutants with dsh and fz.
(A–C’’) Higher magnification view of the stainings shown in Figure 3A–C’’ (see Figure 3 for details). Scale bar = 5 µm. (D–D’) The meru1 stout bristle defect (A, n = 100) and missing macrochaete defect (A’, n = 50) both worsen in combination with dsh1. The meru1 quantifications are identical to those in Figure 1I–I’. (E) Knockdown of fz and ectopic fz expression both increase the stout bristle defect in meru1 mutants (compared to GFP expression), while ectopic arm expression has no significant effect. Quantification of the duplicated stout bristle defect (n = 100). fzIR, UAS-fz and UAS-arm were expressed with nubbin-Gal4 in wild type or meru1 mutants. The Quantification of the GFP meru1 control is identical to Figure 3I. See Supplementary file 1 for statistics.
-
Figure 3—figure supplement 1—source data 1
Source data Figure 3—figure supplement 1.
Related to Figure 3—figure supplement 1D–E.
- https://doi.org/10.7554/eLife.25014.010
Figure 4
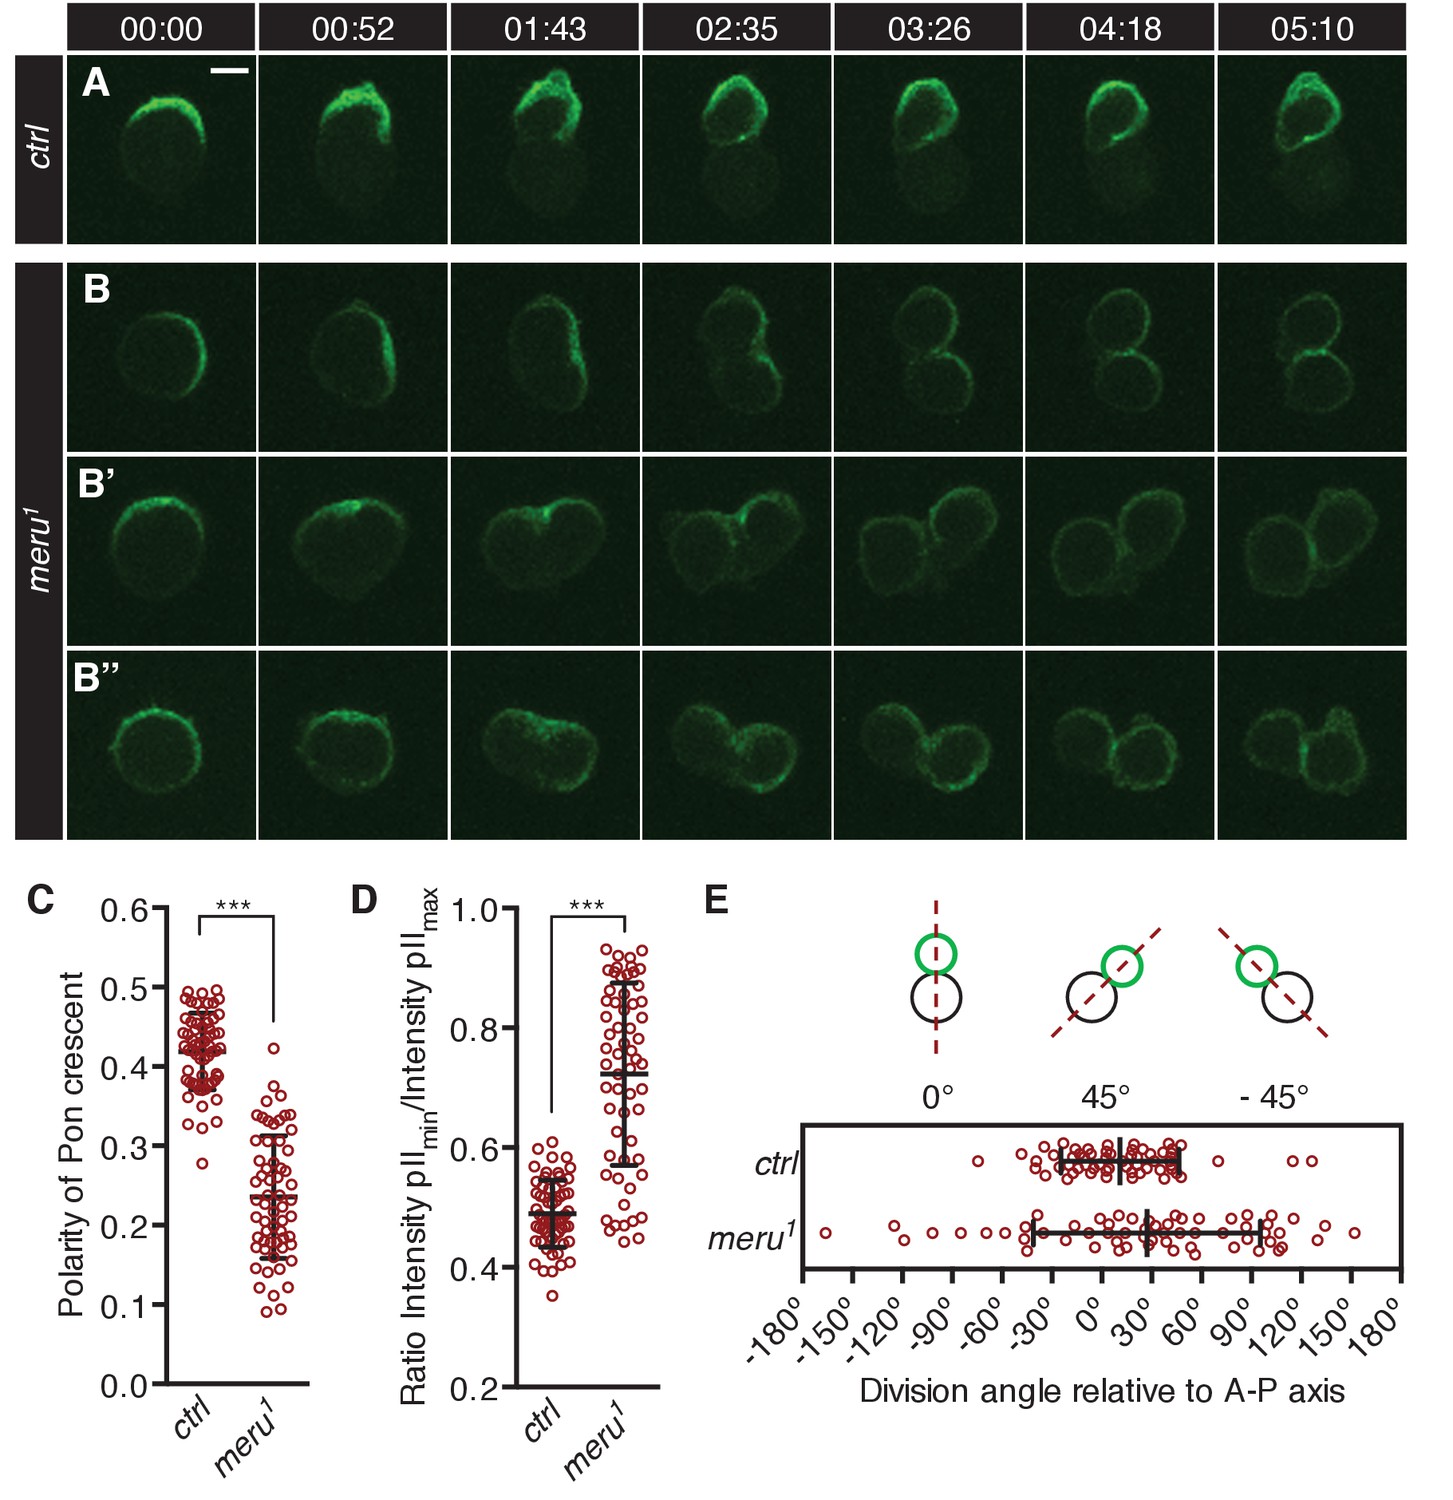
meru mutants show defects in Pon segregation and spindle orientation.
(A–B’’) Time-lapse analysis of the localization of Pon-GFP during the asymmetric division of a single SOP cell in the pupal notum at 15–17 hr APF. Pon-GFP was expressed under the control of neuralized-Gal4 and time is given in (min:sec). Scale bar = 5 µm. (A) In wild type pupae, Pon-GFP localizes asymmetrically to the anterior side of the pI cell and is distributed into the pIIb cell. (B–B’’) Examples of SOP divisions in meru1 mutants all resulting in mis-segregation of Pon-GFP into both daughter cells. (C) Quantification of the polarization coefficient of the Pon crescent in pI cells (uniform distribution = 0). The Pon crescent is significantly less polarized in meru1 mutants compared to control pupae (Mann-Whitney test: ***p<0.001). (D) Relative distribution of Pon-GFP into the two daughter cells (ratios will be approaching one for equal segregations). The Pon segregation is significantly altered in meru1 mutants compared to control pupae (Mann-Whitney test: ***p<0.001). (E) The angle of asymmetric SOP divisions relative to the anterior-posterior axis (A-P axis) is randomized in meru1 mutants compared to control pupae. (C–E) n = 60 from three pupae for each genotype and error bars represent the mean ± standard deviation.
-
Figure 4—source data 1
Source data Figure 4.
Related to Figure 4C–E.
- https://doi.org/10.7554/eLife.25014.012
Figure 5 with 1 supplement
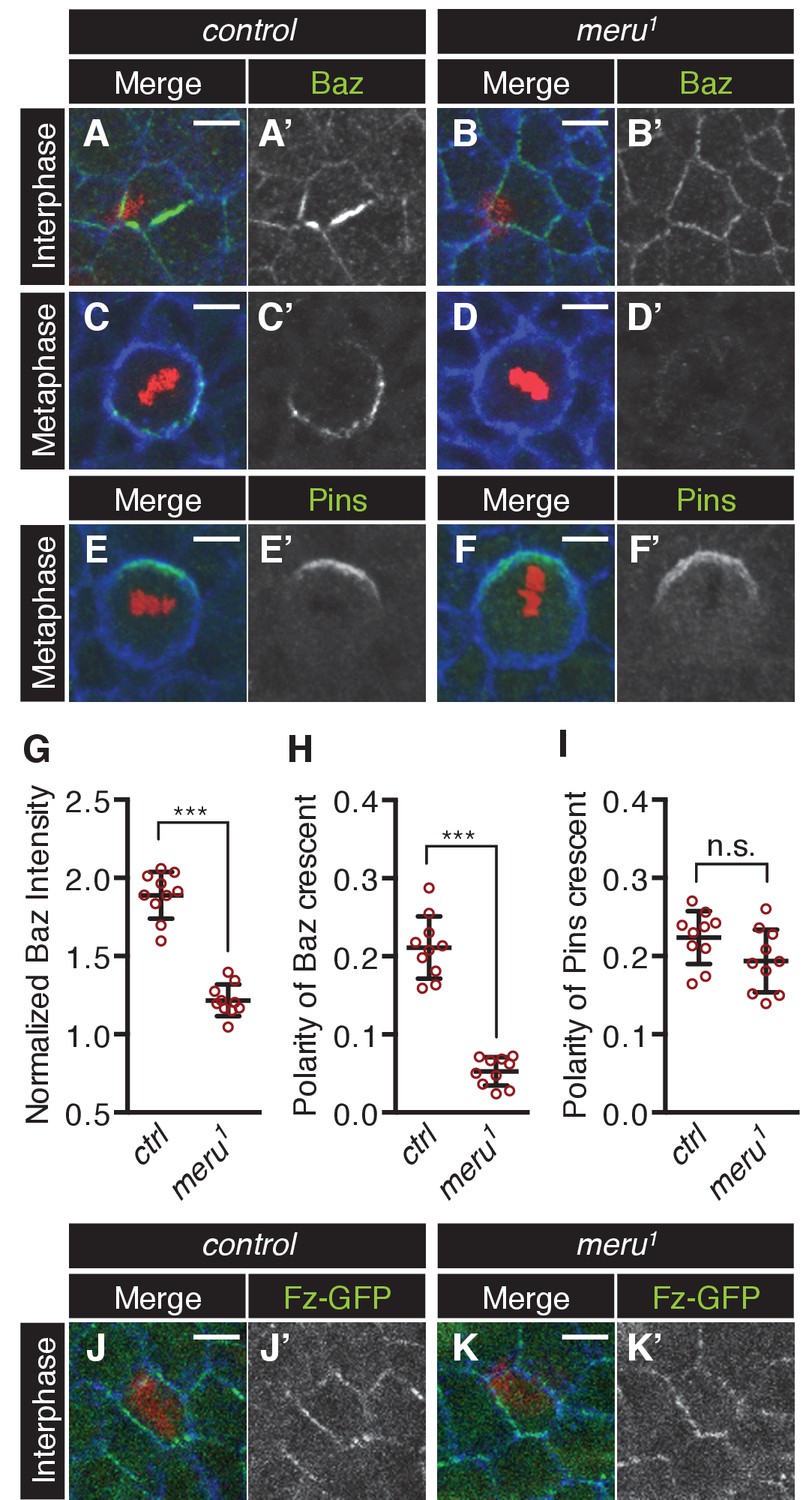
The effect of meru loss on polarity determinants in SOP cells.
(A–D’) Pupal nota stained for Baz (green) and E-cadherin (blue) (A-B’, 15–16 hr APF) or Fas3 (blue) (C-D’, 16–17 hr APF) of control (A–A’, C–C’) and meru1 (B–B’, D–D’) pupae (DNA in red). At interphase, Baz appears less asymmetrically enriched in meru mutant SOPs (B–B’) compared to control (A–A’). In metaphase, loss of meru leads to a strong decrease in Baz levels (D–D’) compared to control SOPs (C–C’). (E–F’) Pupal nota at 16–17 hr APF stained for Pins (green) and Fas3 (blue) of control (E–E’) and meru1 (F–F’) pupae (DNA in red). Pins is still polarized in meru mutant metaphase SOP cells. (G) Quantification of the intensity of the Baz crescent of metaphase SOP cells for control and meru1 nota. The normalized Baz intensity was calculated by dividing the mean grey value intensity at the cell cortex by the mean grey value intensity of the cytoplasm (n = 10). (H–I) Quantification of the polarization coefficient of the Baz crescent (n = 10, same cells as G) (H) or the Pins crescent (n = 10) (I) of metaphase pI cells. While the Baz crescents (H) are significantly less polarized in meru1 mutants compared to control pupae, the Pins crescents are not affected (I). (G–I) Mann-Whitney test: ***p<0.001, n.s. (not significant)=0.0753. Error bars represent the mean ± standard deviation. (J–K’) Pupal nota at 15–16 hr APF stained for E-cadherin (blue) of control (J–J’) and meru1 pupae (K–K’) expressing arm-fz-GFP (DNA in red). The Fz-GFP signal of interphase SOP cells in meru1 mutants (K–K’) is comparable to control pupae (J–J’). For quantification, see Figure 5—figure supplement 1C.
-
Figure 5—source data 1
Source data Figure 5.
Related to Figure 5G–I.
- https://doi.org/10.7554/eLife.25014.014
Figure 5—figure supplement 1
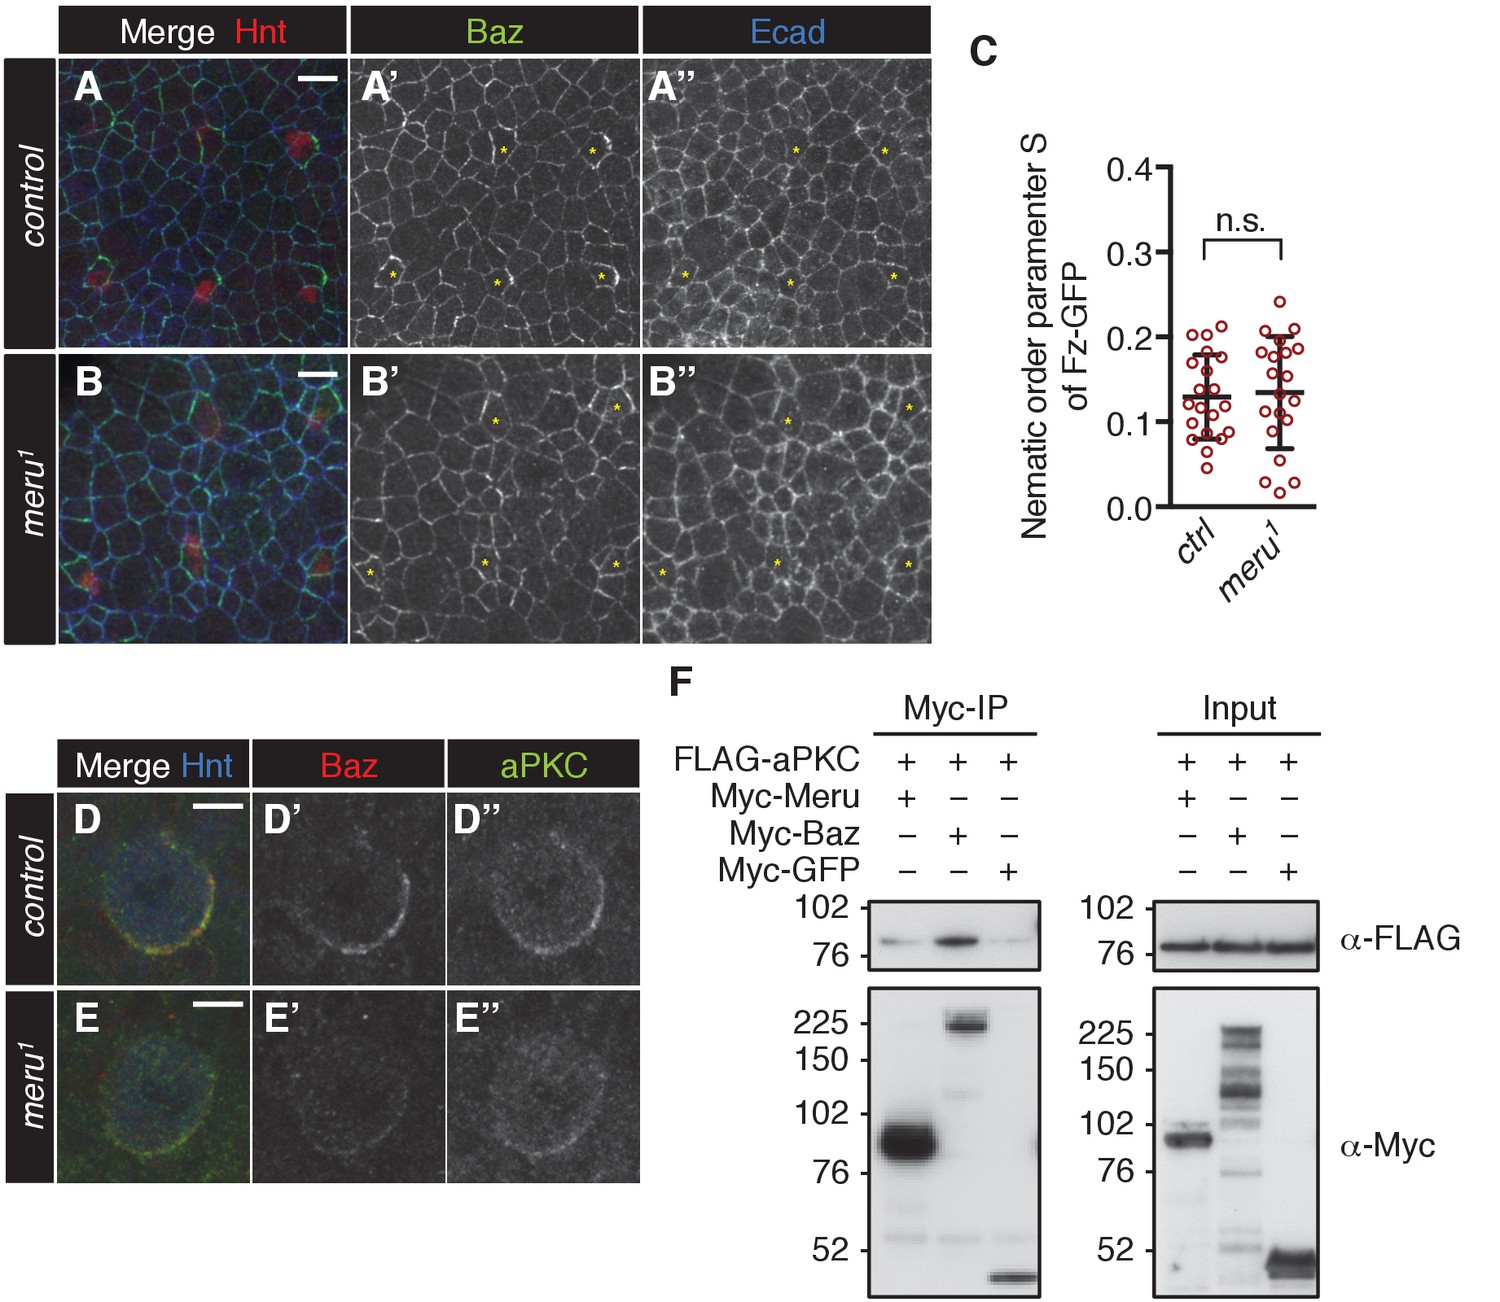
The effect of loss of meru on polarity determinants in SOP cells.
(A–B’’) Pupal nota at 15 hr APF stained for Baz (green), Hindsight (red) and E-cadherin (blue). SOP cells are labeled with yellow asterisks. Baz is asymmetrically enriched in SOP cells of control nota (A–A’’). In meru1 mutant SOPs the asymmetric localization of Baz is less pronounced (B–B’’). Scale bar = 10 µm. (C) Quantification of the nematic order parameter S of Fz-GFP in interphase SOP cells (uniform distribution = 0). The polarization of Fz-GFP in control pupae and meru1 mutants is similar (Mann-Whitney test: n.s.=0.6395). n = 20 from four pupae for each genotype and error bars represent the mean ± standard deviation. (D–E’’) Pupal nota at 16 hr APF stained for Baz (red), aPKC (green) and Hindsight (blue). Similarly to Baz, cortical aPKC levels are reduced in mitotic SOP cells of meru1 mutant (E–E’’) compared to control nota (D–D’’). Scale bar = 5 µm. (F) aPKC does not co-immunoprecipitate with Meru (Baz was used as a positive control). S2 cells were transfected with the indicated tagged constructs, followed by co-immunoprecipitation and analysis by immunoblot with the indicated antibodies.
-
Figure 5—figure supplement 1—source data 1
Source data Figure 5—figure supplement 1.
Related to Figure 5—figure supplement 1C.
- https://doi.org/10.7554/eLife.25014.016
Figure 6 with 1 supplement
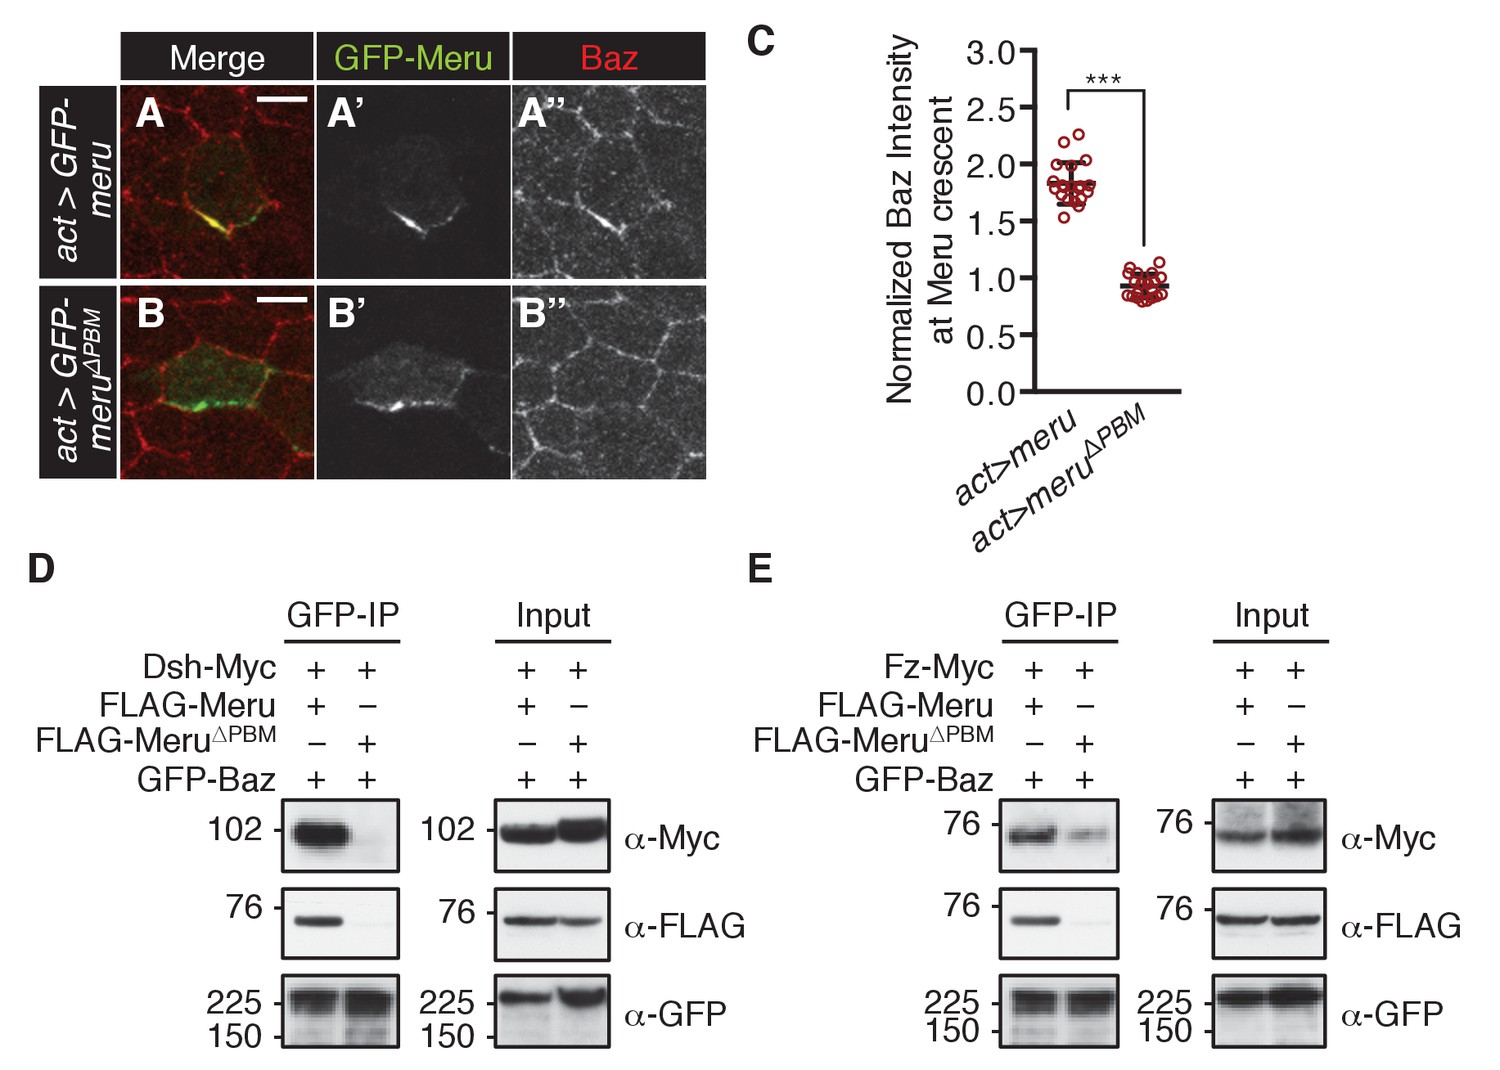
Meru has the ability to recruit Baz via its PBM.
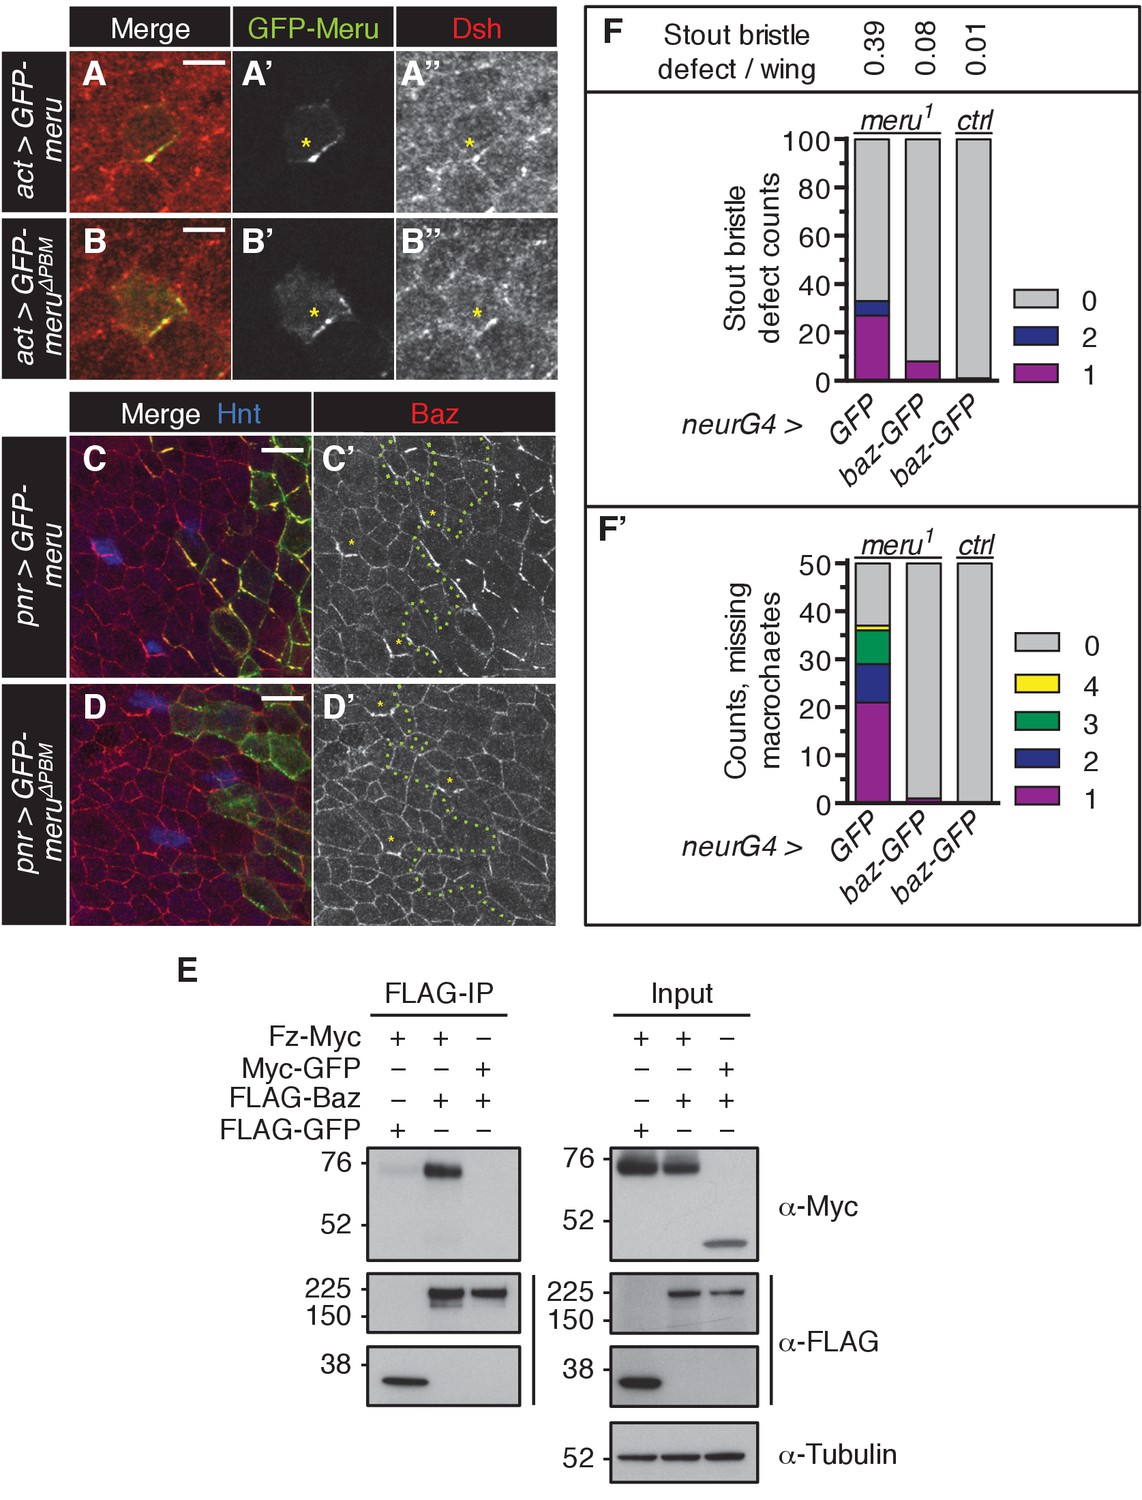
(A–B’’) Pupal nota at 15–16 hr APF stained for Baz (red). FLPout clones expressing GFP-meru (A–A’’) or GFP-meru∆PBM (B–B’’) under control of actin-Gal4 were induced with hsFLP. GFP-Meru (A–A’’) can asymmetrically enrich Baz in non-SOP epithelial cells, whereas Baz-binding deficient GFP-Meru∆PBM cannot (B–B’’). Scale bar = 5 µm. (C) Quantification of Baz intensity at the Meru (full-length and ∆PBM) crescent. Baz intensities are significantly increased at Meru crescents compared to Meru∆PBM crescents (n = 20, Mann-Whitney test: ***p<0.001). Error bars represent the mean ± standard deviation. (D–E) Meru can bridge the binding between Baz and Dsh (D) and Baz and Fz (E) in co-immunoprecipitation experiments. Meru∆PBM served as a negative control. S2 cells were transfected with the indicated constructs followed by co-immunoprecipitation and analysis by immunoblot with the indicated antibodies.
-
Figure 6—source data 1
Source data Figure 6.
Related to Figure 6C.
- https://doi.org/10.7554/eLife.25014.018
Figure 6—figure supplement 1
Meru has the ability to recruit and asymmetrically enrich Baz.
(A–B’’) Pupal nota at 15–16 hr APF stained for Dsh (red). FLPout clones expressing GFP-meru (A–A’’) or GFP-meru∆PBM (B–B’’) under control of actin-Gal4 were induced with hsFLP. Both GFP-Meru (A–A’’) and GFP-Meru∆PBM (B–B’’) co-localize with Dsh in non-SOP epithelial cells. Yellow asterisks mark the relevant cells. Scale bar = 5 µm. (C–D’) Pupal nota at 16 hr APF stained for Baz (red) and Hindsight (blue) expressing GFP-meru (C–C’) or GFP-meru∆PBM (D–D’) under the pannier-Gal4 (pnr-Gal4) driver. GFP-Meru (C–C’) - but not GFP-Meru∆PBM (D–D’) - has the ability to recruit and asymmetrically enrich Baz in non-SOP epithelial cells (SOPs are labeled with Hnt and marked by yellow asterisks). The GFP-meru expression zone is marked with a green dashed line. Scale bar = 10 µm. (E) Fz co-immunoprecipitates with Baz. S2 cells were transfected with the indicated tagged constructs, followed by co-immunoprecipitation and analysis by immunoblot with the indicated antibodies. (F–F’) Ectopic expression of baz-GFP rescues the meru1 bristle phenotype. UAS-GFP and UAS-baz-GFP were expressed under neuralized-Gal4 in meru1 or control flies. Quantification of duplicated stout bristle (F, n = 100) and missing macrochaete defects (F’, n = 50). See Supplementary file 1 for statistics.
-
Figure 6—figure supplement 1—source data 1
Source data Figure 6—figure supplement 1.
Related to Figure 6—figure supplement 1F,F’.
- https://doi.org/10.7554/eLife.25014.020
Additional files
-
Supplementary file 1
Test of significance for mechanoreceptor defects between genotypes using Fisher’s exact test (Freeman-Halton extension) (related to Figures 1,3 and Figure 3—figure supplement 1; Figure 6—figure supplement 1).
- https://doi.org/10.7554/eLife.25014.021
Download links
A two-part list of links to download the article, or parts of the article, in various formats.
Downloads (link to download the article as PDF)
Open citations (links to open the citations from this article in various online reference manager services)
Cite this article (links to download the citations from this article in formats compatible with various reference manager tools)
Meru couples planar cell polarity with apical-basal polarity during asymmetric cell division
eLife 6:e25014.
https://doi.org/10.7554/eLife.25014


