On the mechanistic nature of epistasis in a canonical cis-regulatory element
- Institute of Science and Technology Austria, Austria
- University of Liverpool, United Kingdom
Figures
Figure 1
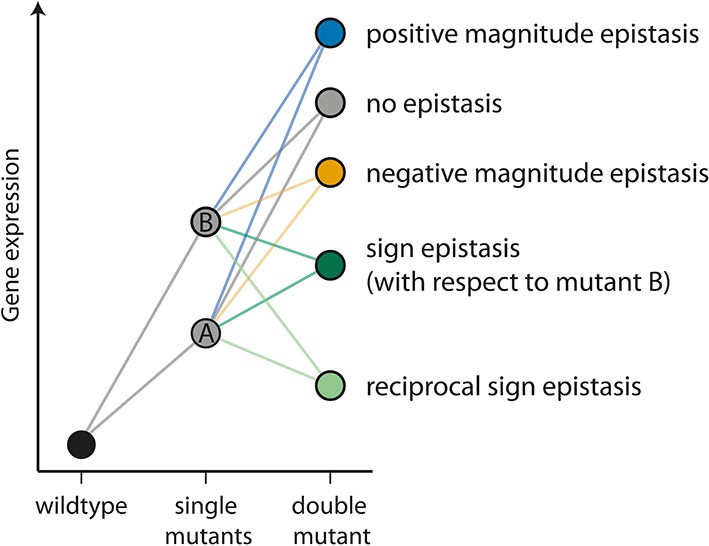
The different types of epistasis between two point mutations.
Two point mutations, A and B (grey), individually increase the measured quantitative phenotype (gene expression, for example) compared to the wildtype. In this study, we use the multiplicative expectation of how the phenotypic effects of two mutations contribute to the double mutant phenotype, according to which epistasis = fm12 / (fm1fm2), where fm12 is the relative fluorescence of a double mutant (m12), and fm1 and fm2 the relative fluorescence of the two corresponding single mutants (m1 and m2), respectively. An alternative to the multiplicative assumption would be the additive one, in which the effect of the double mutant in the absence of epistasis is the sum of the effects of single mutants. The multiplicative model is a better assumption for gene expression data, as there is a lower limit on this trait (Cordell, 2002). In the absence of an interaction between mutations (‘no epistasis’ scenario, represented by a grey circle), the phenotype of the double mutant is the product of the individual mutation. If the effect of the double mutant is greater or lower than the multiplicative expectation, the two mutations are said to be in positive (blue) or negative (orange) magnitude epistasis, respectively. Sign epistasis (dark green) occurs when one mutation has the opposite effect in the presence of the other (as for mutation B above). Reciprocal sign epistasis (light green) indicates a situation when both mutations have the opposite effect when in the presence of the other, compared to when they occur independently on the wildtype background.
Figure 2
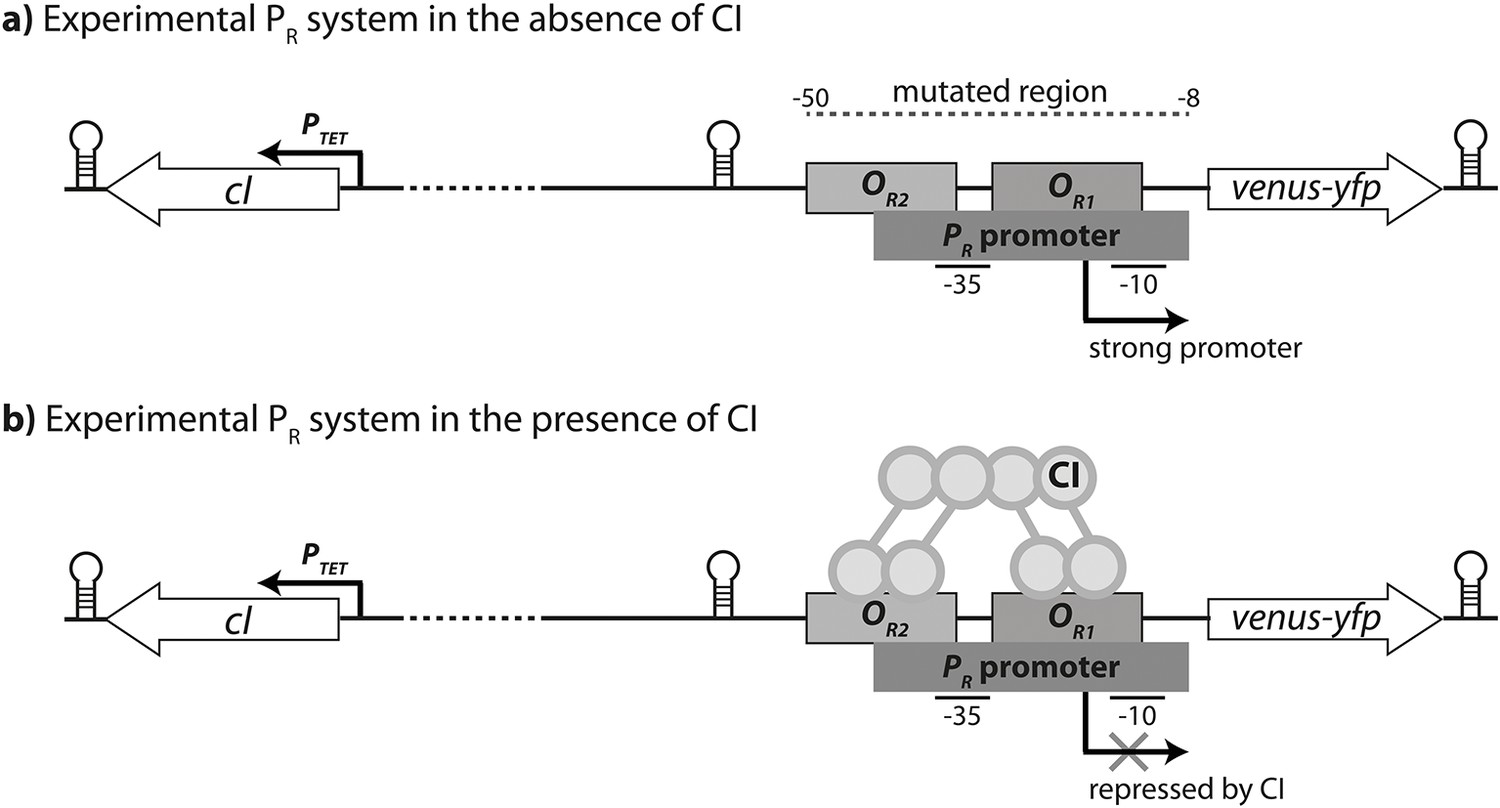
Experimental system.
The PR promoter system used in the empirical measurements consists of a strong lambda phage PR promoter (RNAP-binding site) and two CI operator sites (transcription factor binding sites OR1 and OR2), which control the expression of a venus-yfp reporter gene. cI is encoded on the opposite strand, separated by a terminator and 500 bp of random sequence, and under the control of an inducible promoter PTET. Both venus-yfp and cI genes are followed by a terminator sequence. (a) In the absence of CI, the promoter is fully expressed. (b) CI binds cooperatively to two operators in order to repress the promoter.
Figure 3 with 2 supplements
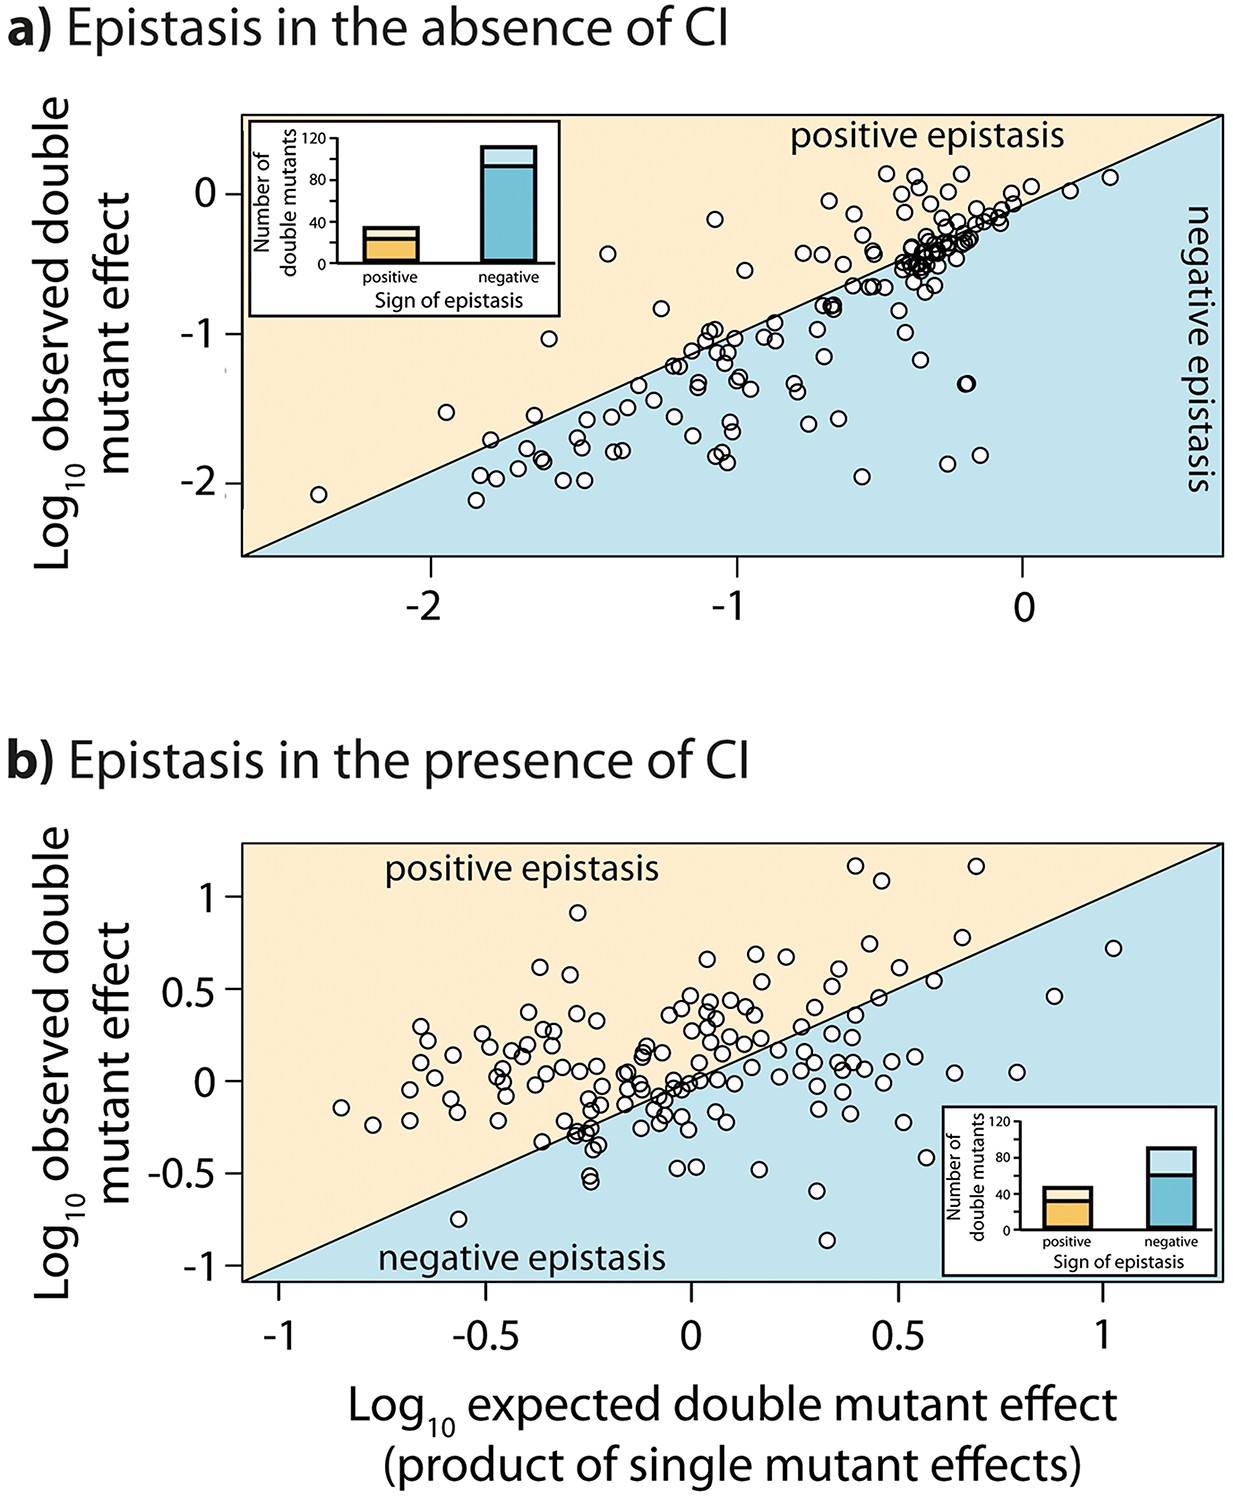
Epistasis in the absence and in the presence of CI.
Points show log10 of expected versus log10 of observed double mutant effects (each relative to wildtype fluorescence) for all 141 double mutants, in the (a) absence; and (b) presence of the CI repressor. The solid line represents no epistasis (expected equal to the observed double mutant expression). Six replicates of each mutant were measured. Bar charts show total number of double mutants exhibiting positive (orange) and negative (blue) epistasis, while the darker areas represent the number that are significantly different from the null expectation of the model (no epistasis). The data presented in this figure can be found in Figure 3—figure supplement 1, Figure 3—figure supplement 2, and Figure 3—source data 1.
-
Figure 3—source data 1
Fluorescence measurements of single and double mutants, and the calculated values for epistasis for the random mutant library.
Multiplicative epistasis, both in the absence and in the presence of the repressor CI, for each double mutant from the random mutant library is provided along with the standard deviation for the measurement, the t-test value (5 degrees of freedom), and the FDR-corrected p value. Double mutants that do not exhibit a significant epistatic interaction are marked in green. Wildtype normalized fluorescence measurement of each single and double mutant, from which the epistasis values were calculated, is also provided for both environments.
- https://doi.org/10.7554/eLife.25192.006
Figure 3—figure supplement 1

Relative fluorescence of single mutants.
Bars are mean fluorescence relative to wildtype in the a) absence and b) presence of the repressor CI. Mean fluorescence shown in ascending order. The dotted line shows the wildtype fluorescence. Error bars are standard deviations.
Figure 3—figure supplement 2
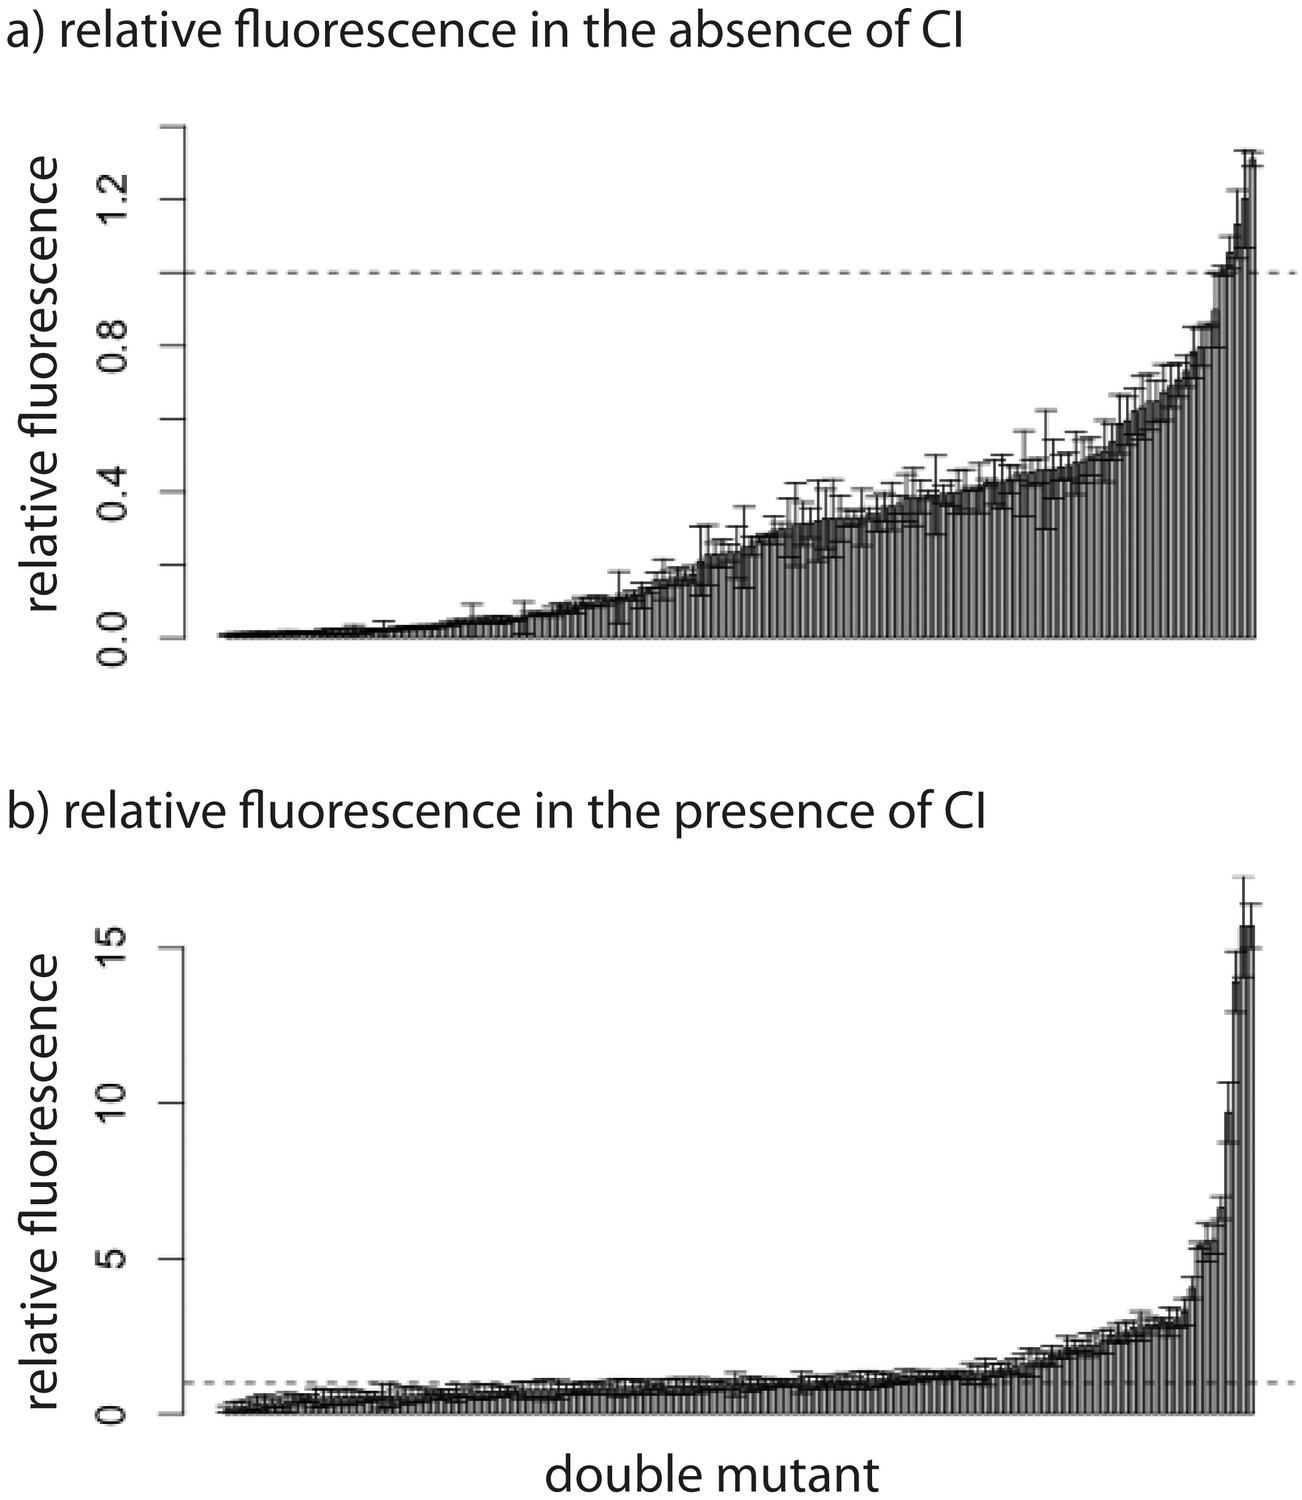
Relative fluorescence of double mutants.
Bars are mean fluorescence relative to wildtype in the a) absence and b) presence of the repressor CI. Mean fluorescence shown in ascending order. The dotted line shows the wildtype fluorescence. Error bars are standard deviations.
Figure 4
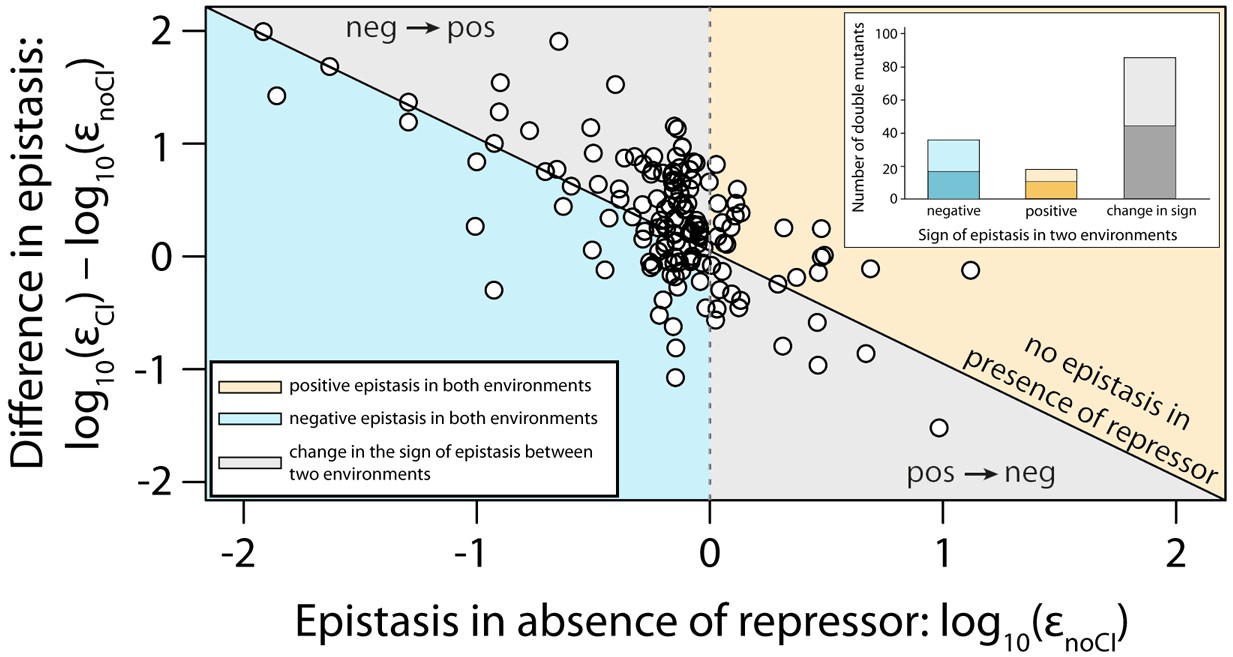
Sign of epistasis changes with the environment for most double mutants.
Points show the log10 value of epistasis in the absence of repressor, and the difference in the log10 value of epistasis in the presence and the absence of repressor: log10 (εCI) – log10 (εnoCI), for all 141 double mutants. Points above the solid diagonal line exhibit positive, while points below exhibit negative epistasis in the presence of the CI repressor. Most mutants have a different sign of epistasis between the two environments (gray area). Bar chart shows total number of double mutants that are always in positive (orange) or in negative (blue) epistasis, and the total number that changes sign between the two environments (gray). The darker areas in the bars represent the number that are significantly different from the null expectation of the model (no epistasis) in both environments. Six replicates of each mutant were measured. The data presented in this figure is calculated from Figure 3—source data 1.
Figure 5

Overview of the generic model.
The theoretical approach used in this study, originally developed to describe gene regulation by the lambda bacteriophage repressor CI (Ackers et al., 1982), relies on statistical thermodynamics assumptions to model initiation of transcription. (a) In this framework, each DNA-binding protein is assigned a binding energy (Ei) to an arbitrary stretch of DNA. Given a set of DNA-binding proteins (a generic RNAP-like and a generic repressor-like TF, in this case) and a promoter sequence, a Boltzmann weight can be assigned to any configuration of these TFs on the promoter. By assigning a Boltzmann weight to all configurations, one can calculate the probability of finding the system in a configuration that leads to the initiation of transcription. (b) When considering only the binding of a single protein to DNA (for example ‘RNAP’ only), if mutations have a negative effect on protein-DNA binding, the model predicts negative epistasis between them in terms of expression. This prediction arises from the non-linear relationship between binding energy and gene expression pon (dotted line). In this illustration, we show a relative change in binding energy compared to the sequence with highest possible binding, in kT. (c) By generalizing the properties of the relationship between binding and gene expression, we conclude that the sign of epistasis depends only on the sign of individual mutation effects (p1 and p2) upon binding. When both ‘RNAP’ and ‘repressor’ are present in the system, epistasis depends on the ‘repressor’ concentration and the magnitude of single mutation effects on ‘RNAP’ and ‘repressor’ binding (d,e,f,g). (d) One point mutation negatively affects only ‘RNAP’ binding, while the other only ‘repressor’ binding. (e) Under such circumstances, the system shows no epistasis at low ‘repressor’ concentrations, but is in positive epistasis when ‘repressor’ concentration increases. Finally, at very high repressor concentrations, epistasis approaches 0. (f) Point mutations negatively affect both ‘RNAP’ and ‘repressor’ binding. (g) Under such conditions, epistasis changes the sign from negative to positive as repressor concentration increases.
Figure 6 with 1 supplement
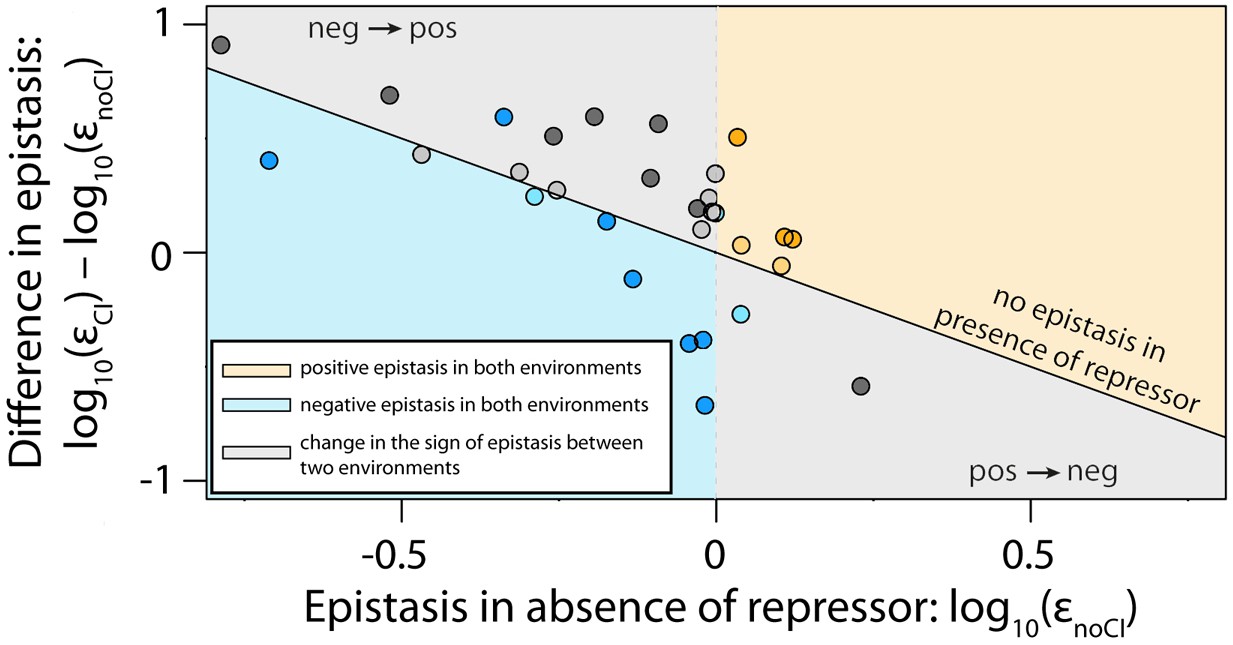
The thermodynamic model accurately predicts sign of epistasis and its environment-dependence.
In order to conduct an independent test of the assumptions of the generic model, we expanded the generic model to include specific information about the two TFs relevant to the experimental system – namely, the energy matrices for RNAP (Kinney et al., 2010) and CI (Sarai and Takeda, 1989). We could not use the 141 random mutants to validate the model, as most of them contained mutations that were in the regions of the CRE that were poorly characterized by the energy matrices. Therefore, using the energy matrices, we had to create a new library consisting of five random double mutants for each category from Table 1. As we could not identify any single point mutations that simultaneously improved the binding of both RNAP and repressor, we tested if empirical measurements of epistasis conformed to model predictions in 30 mutants. The model predictions of the sign of epistasis and its environment dependence were based only on the sign of individual mutation effects on RNAP and repressor binding. The location of points corresponds to the experimental measurement of epistasis for each mutant, while the color indicates the model prediction: (i) blue - double mutants predicted to be in negative epistasis both in the absence and in the presence of the repressor CI; (ii) orange - double mutants that are always in positive epistasis; (iii) grey - double mutants predicted to change the sign of epistasis in the two environments. The color intensity indicates significance – lighter shades represent non-significant, darker shades represent significant epistasis in both environments (see ‘Empirical verification of the thermodynamic model’ section in Online Methods). Six replicates of each mutant were measured. The data underlying this figure is presented in Figure 6—source data 1. The quantitative test of how well the thermodynamic model predicts the magnitude of epistasis in this dataset is presented in Figure 6—figure supplement 1.
-
Figure 6—source data 1
Fluorescence measurements of single and double mutants, and the calculated values for epistasis for the validation mutant library.
Multiplicative epistasis, both in the absence and in the presence of the repressor CI, for each double mutant from the 30-mutant validation library, is provided along with the standard deviation for the measurement, the t-test value (5 degrees of freedom), and the FDR-corrected p value. Double mutants that do not exhibit a significant epistatic interaction are marked in green. Wildtype normalized fluorescence measurement of each single and double mutant, from which the epistasis values were calculated, is also provided for both environments.
- https://doi.org/10.7554/eLife.25192.014
Figure 6—figure supplement 1
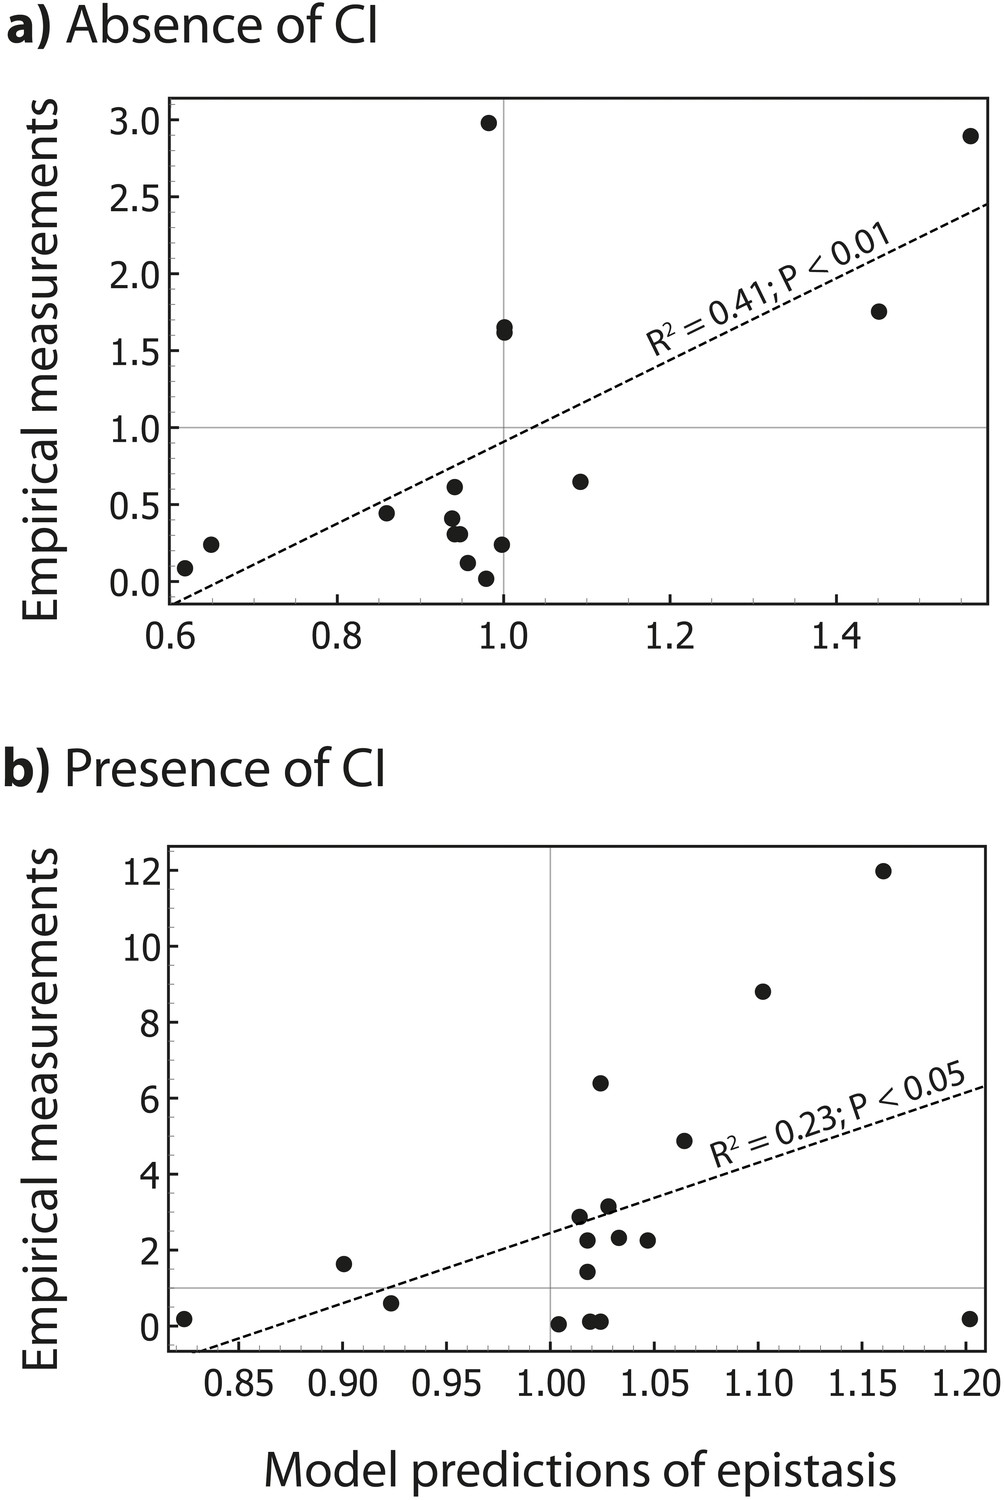
The thermodynamic model predicts the magnitude of epistasis.
By incorporating specific information about the biological system studied, in the form of energy matrices for RNAP (Kinney et al., 2010) and CI (Sarai and Takeda, 1989), we could test if the model predicts not only the sign, but also the magnitude of epistasis. Linear regression between empirical measurements and the model predictions of epistasis is shown (dashed line) for all mutants in Figure 5 that exhibited significant epistasis. Epistasis was estimated in the (a) absence; and (b) presence of CI. Grey lines show no epistasis (epistasis value of 1).
Tables
Table 1
Sign of epistasis in a simple CRE depends on the environment and the sign of individual mutation effects. We consider two environments, one without repressor when mutations affect only RNAP binding, and the other with high repressor concentration. In the first environment, sign of epistasis is determined only by the sign of individual mutation effects on RNAP binding, while in the second environment it is the sign of individual mutation effect on the repressor that matters. For each mutation, the signs (‘+’ and ‘-‘) represent the sign of its effect on the binding of RNAP (p) and repressor (r), respectively. ‘neg -> pos’ and ‘pos -> neg’ represent combinations that display transitions from negative to positive, or positive to negative epistasis, respectively. Certain combinations of mutations are always in negative or always in positive epistasis. The extended version of this table, which does not assume a constant ‘RNAP’ concentration in the cell, is provided in Table 1—source data 1.
| | −− | +− | −+ | ++ | |
| ++ | pos→neg neg→pos | neg→pos | pos→neg | neg→pos | |
| −+ | pos→neg | always positive | always negative | ||
| +− | pos→neg | always negative | |||
| −− | neg→pos | ||||
-
Table 1—source data 1
General conditions for the sign of epistasis in two environments.
- https://doi.org/10.7554/eLife.25192.012
Additional files
-
Supplementary file 1
Identity of randomly generated double mutants.
- https://doi.org/10.7554/eLife.25192.016
-
Supplementary file 2
Types of epistasis in two environments.
- https://doi.org/10.7554/eLife.25192.017
-
Supplementary file 3
Identity of mutants used for verification of the model.
- https://doi.org/10.7554/eLife.25192.018
Download links
A two-part list of links to download the article, or parts of the article, in various formats.
Downloads (link to download the article as PDF)
Open citations (links to open the citations from this article in various online reference manager services)
Cite this article (links to download the citations from this article in formats compatible with various reference manager tools)
On the mechanistic nature of epistasis in a canonical cis-regulatory element
eLife 6:e25192.
https://doi.org/10.7554/eLife.25192


