Uncoupling of dynamin polymerization and GTPase activity revealed by the conformation-specific nanobody dynab
- University of Geneva, Switzerland
- Universidad de Valencia, Spain
- Institut Curie, PSL Research University, France
- Institut Curie, France
- Swiss National Centre for Competence in Research Programme Chemical Biology, Switzerland
Figures
Figure 1 with 6 supplements
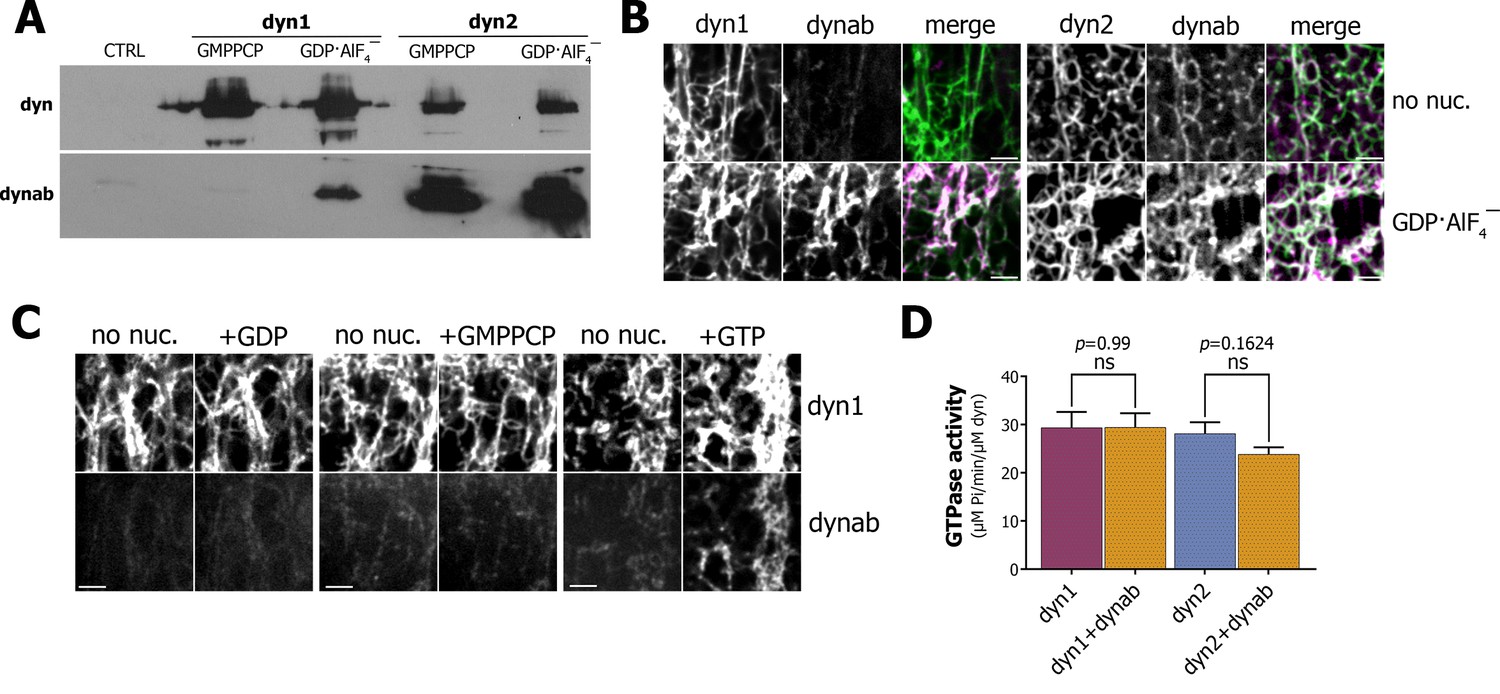
Characterization of dynab, conformation-specific nanobody.
(A) Western blot analysis of dynamin-coated magnetic SUPER templates used as bait for pulling down of dynab. (B) Maximum projections of Z-stacks images depicting membrane sheets with different staining pattern of dynab on dynamin-1 and dynamin-2 tubules without nucleotide or coupled with GDP·AlF4‾. Scale bars 3 µm. (C) Frames from time-lapse images of dynamin-1 tubulated membrane sheets with dynab before and after the injection of 1 µl of 1 mM GDP, GMPPCP or GTP. Scale bars 3 µm (D) GTPase activity of dynamin-1 and 2 with or without dynab, (bars are averages of values from five replicates ±SEM, unpaired t-test, ns = p value>0.05). Source files and statistical report for panel D are available in Figure 1—source data 1.
-
Figure 1—source data 1
(panel D) Malachite Green Assay.
- https://doi.org/10.7554/eLife.25197.009
Figure 1—figure supplement 1
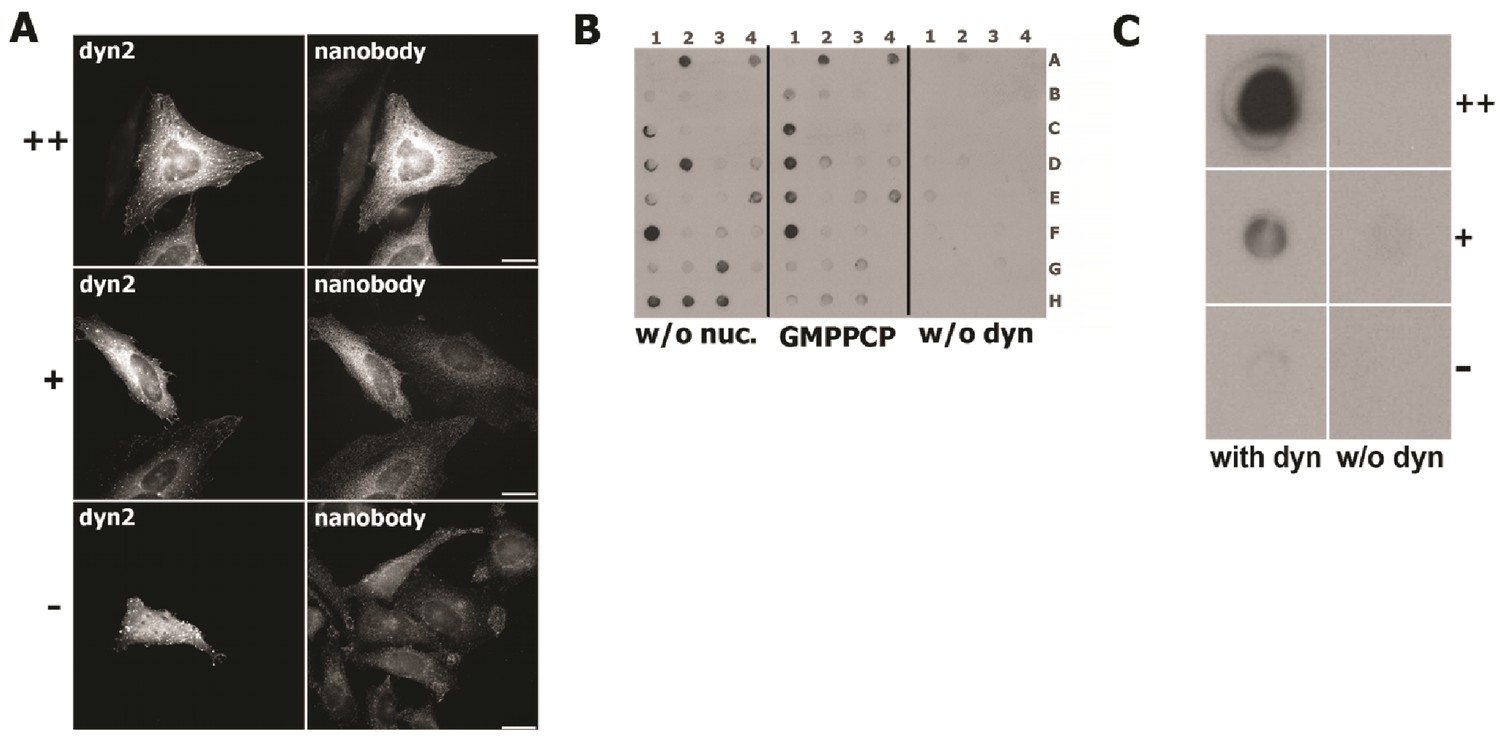
Validation of dynamin-2 positive nanobodies.
(A) Immunofluorescence results performed on HeLa cells with different levels of dynamin- two expressions showing three different clones with different abilities to bind dynamin-2; the very strong positive clone (++) and the positive clone (+) bind more cells overexpressing dynamin-2, the negative clone (-) has a background staining of the cells regardless of the level of dynamin-2. (B) Example of dot blot experiment in which it is possible to observe the difference in dynamin-2 binding of different clones, the plate is divided by dynamin-2 without nucleotide, dynamin-2 coupled with GMPPCP and the control without dynamin-2. (C) Magnifications of dot blot spots that confirm the ability of positive and negative clones to bind dynamin-2.
Figure 1—figure supplement 2
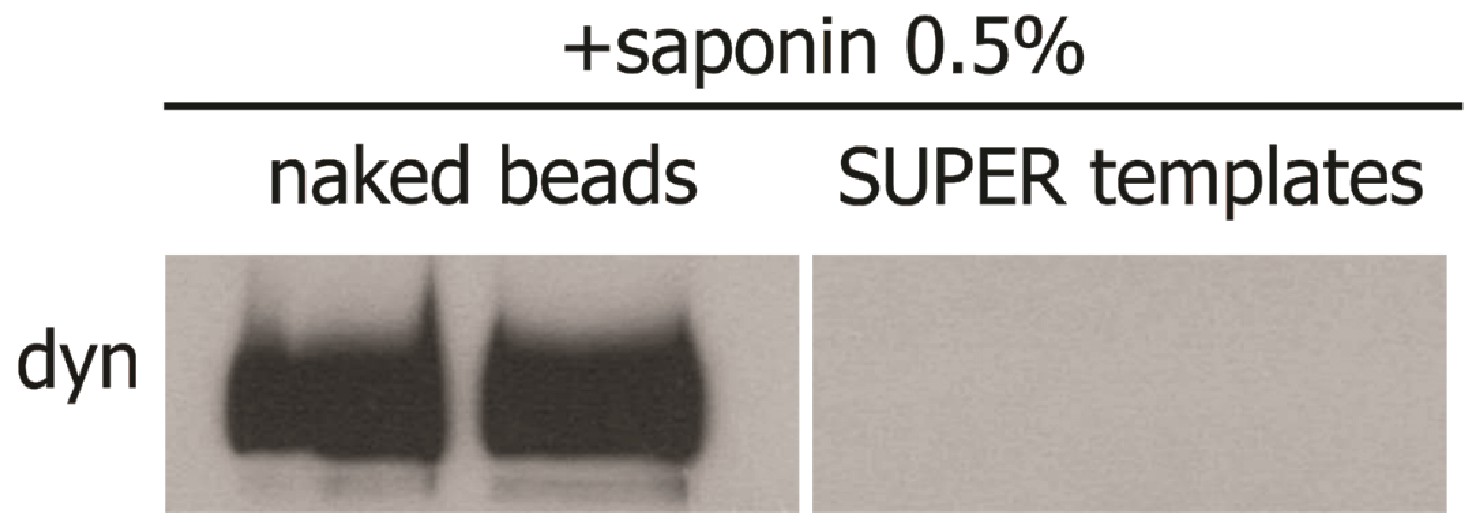
SUPER templates pull-down assay control.
Western blot of dynamin-1 on magnetic SUPER templates and magnetic silica beads treated with saponin 0.5% showing the strong binding of dynamin on naked beads and the absence of dynamin on SUPER templates when treated with saponin.
Figure 1—figure supplement 3
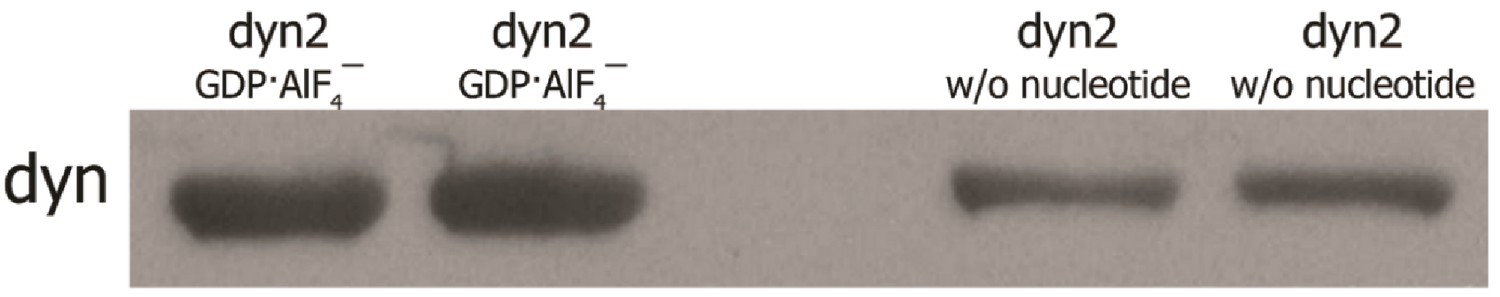
Dynamin binding on SUPER templates with and without nucleotides.
Western blot of magnetic SUPER templates pull-down assay with dynamin-2 nucleotide-free and GDP·AlF4‾-coupled showing the stronger binding of dynamin to SUPER templates when coupled with nucleotide.
Figure 1—figure supplement 4
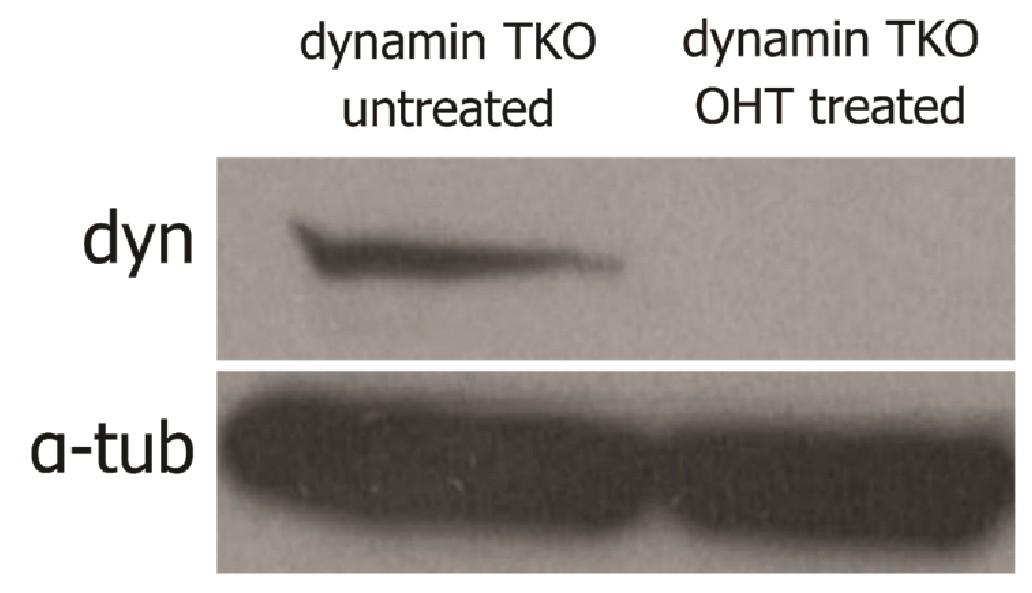
Verification of the knock-out procedure for dynamin triple KO cells.
Western blot of dynamin TKO fibroblasts whole cell lysates (100 µg total proteins loaded) OHT treated or untreated immunoblotted for dynamin and α-tubulin as loading control.
Figure 1—figure supplement 5
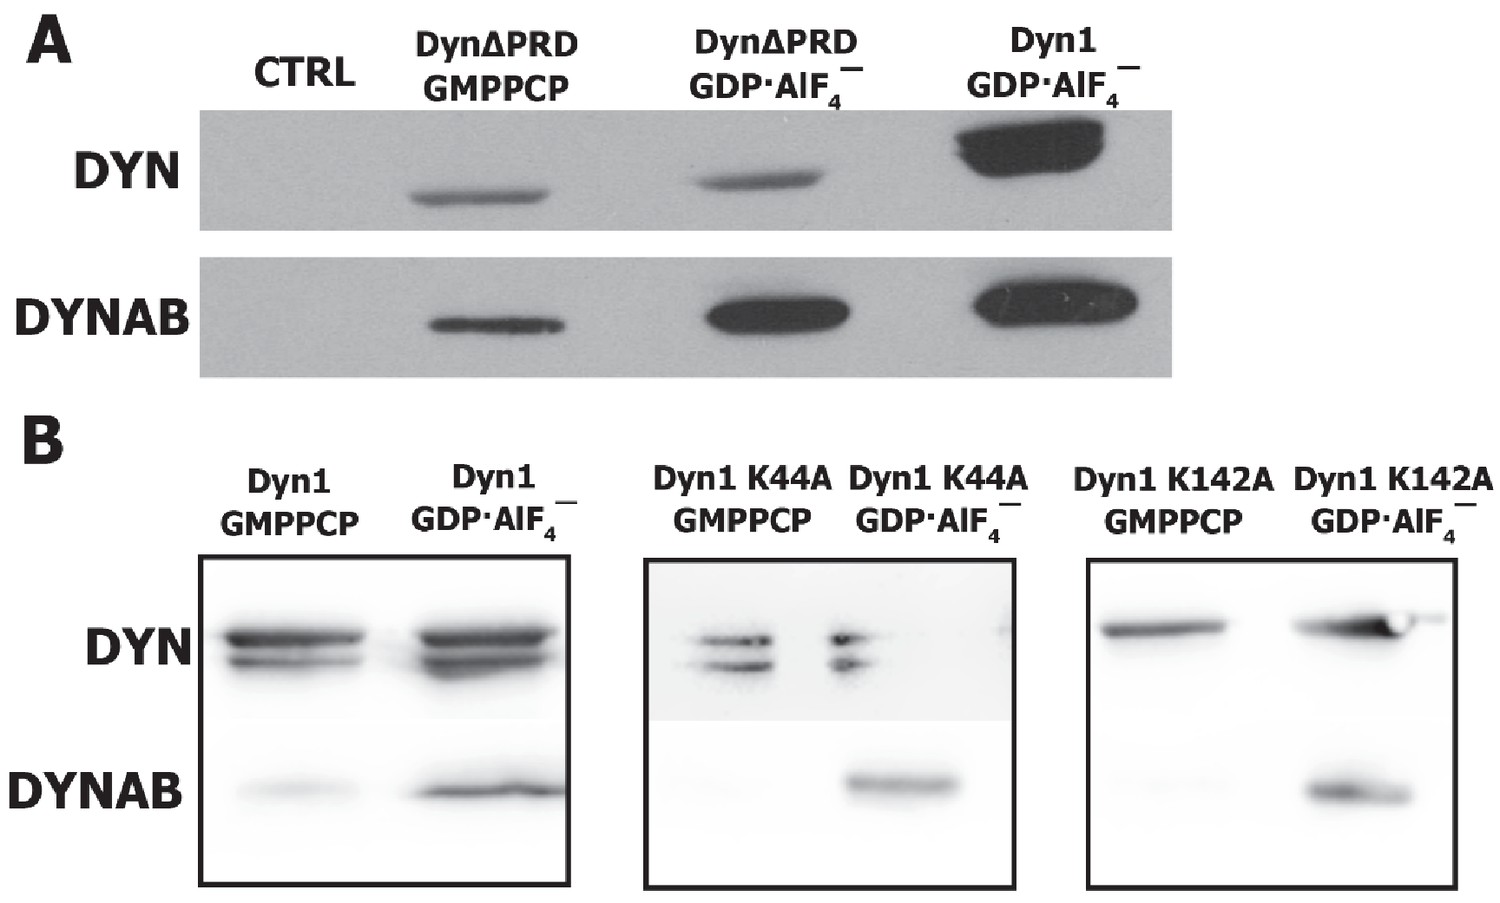
Pull-downs of dynamin mutants with dynab.
(A) Pull-down with SUPER templates of dynamin ΔPRD with dynab. (B) Pull-downs of dynab with SUPER templates of dynamin 1 (left panel) dynamin 1 K44A (central panel) and dynamin 1 K142A (right panel).
Figure 1—figure supplement 6

Membrane sheets assay with dynamin 1-GDP·AlF4‾ and dynab on fluorescent lipids, scale bar: 10 µm.
https://doi.org/10.7554/eLife.25197.008
Figure 2
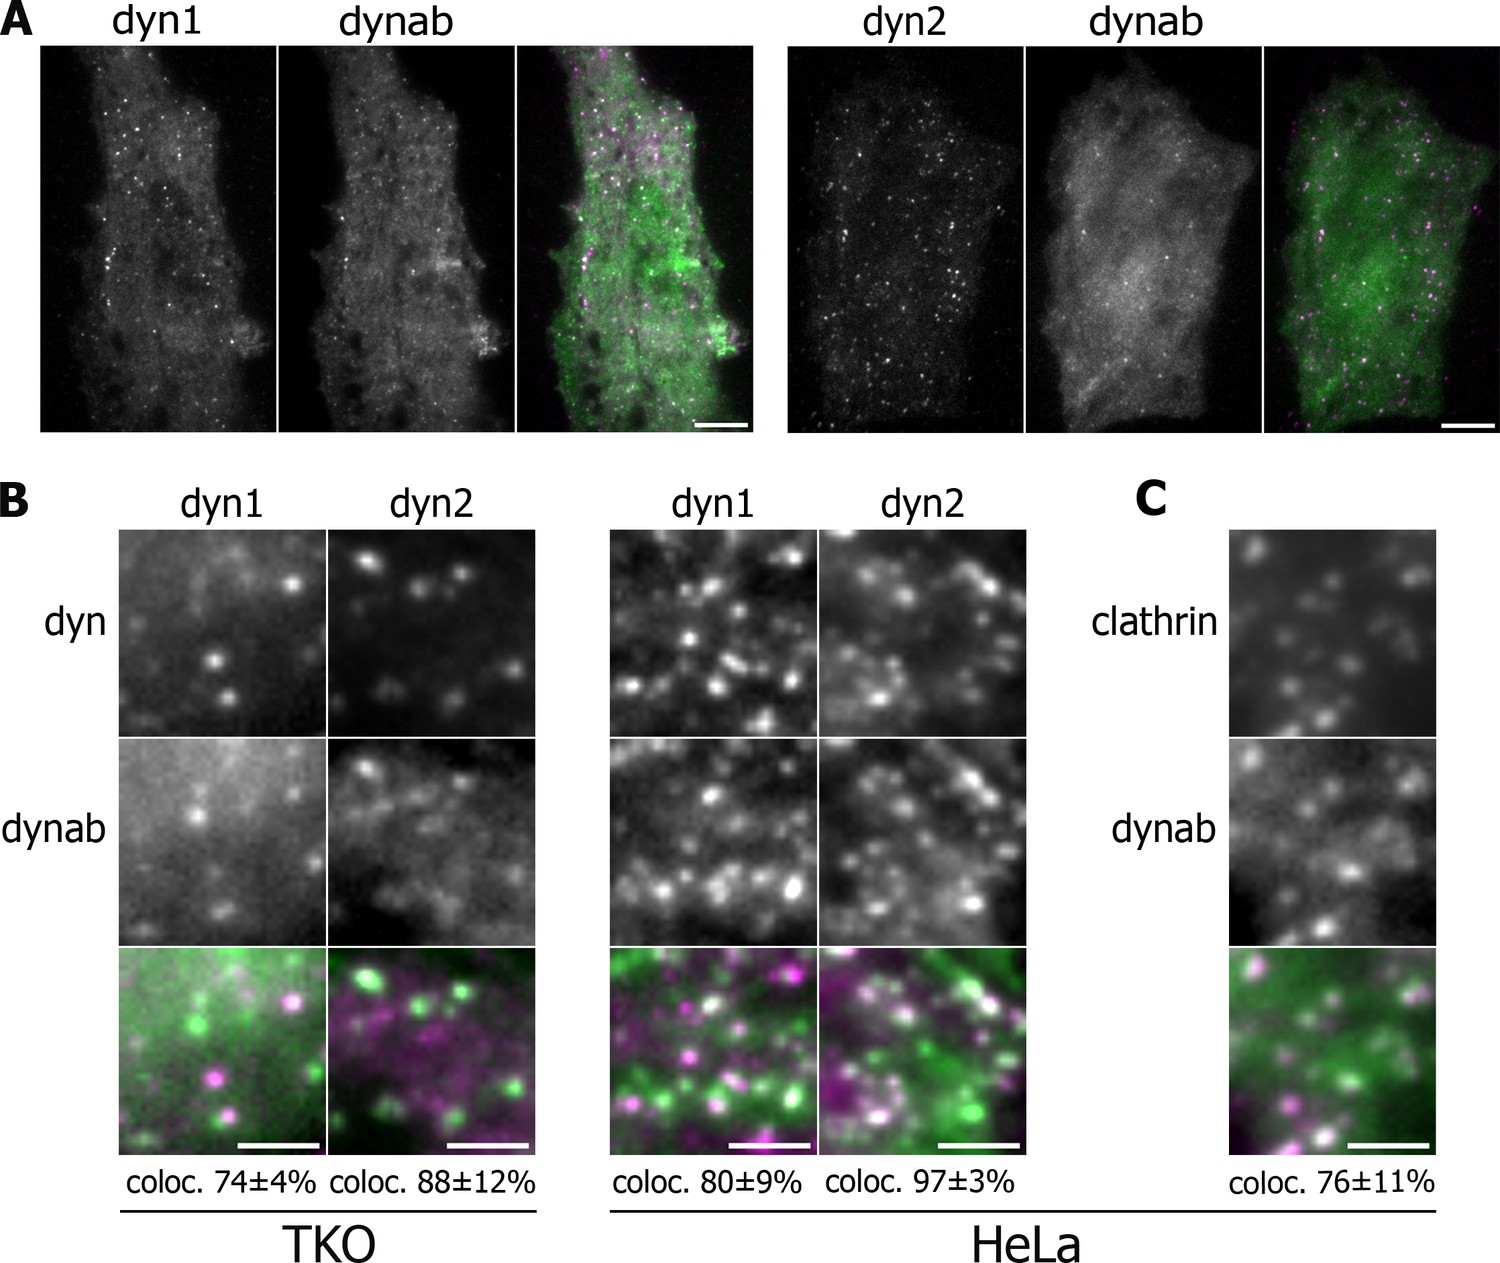
Expression in vivo of dynamin-1/2 and dynab.
(A) Average images of time-lapse movies of dynamin triple knockout cells (TKO) expressing dyn1/2-mCherry and dynab-EGFP. Scale bar 10 µm. (B) Detail of TKO (left) and HeLa (right) cells expressing dyn1/2-mCherry and dynab-EGFP and relative colocalization (percentage measured over 3 cells, ±SD). Scale bar 2 µm. (C) Detail of HeLa cells expressing Clathrin-mCherry and dynab-EGFP and relative colocalization (percentage measured over 3 cells, ±SD). Scale bar 2 µm.
Figure 3 with 1 supplement
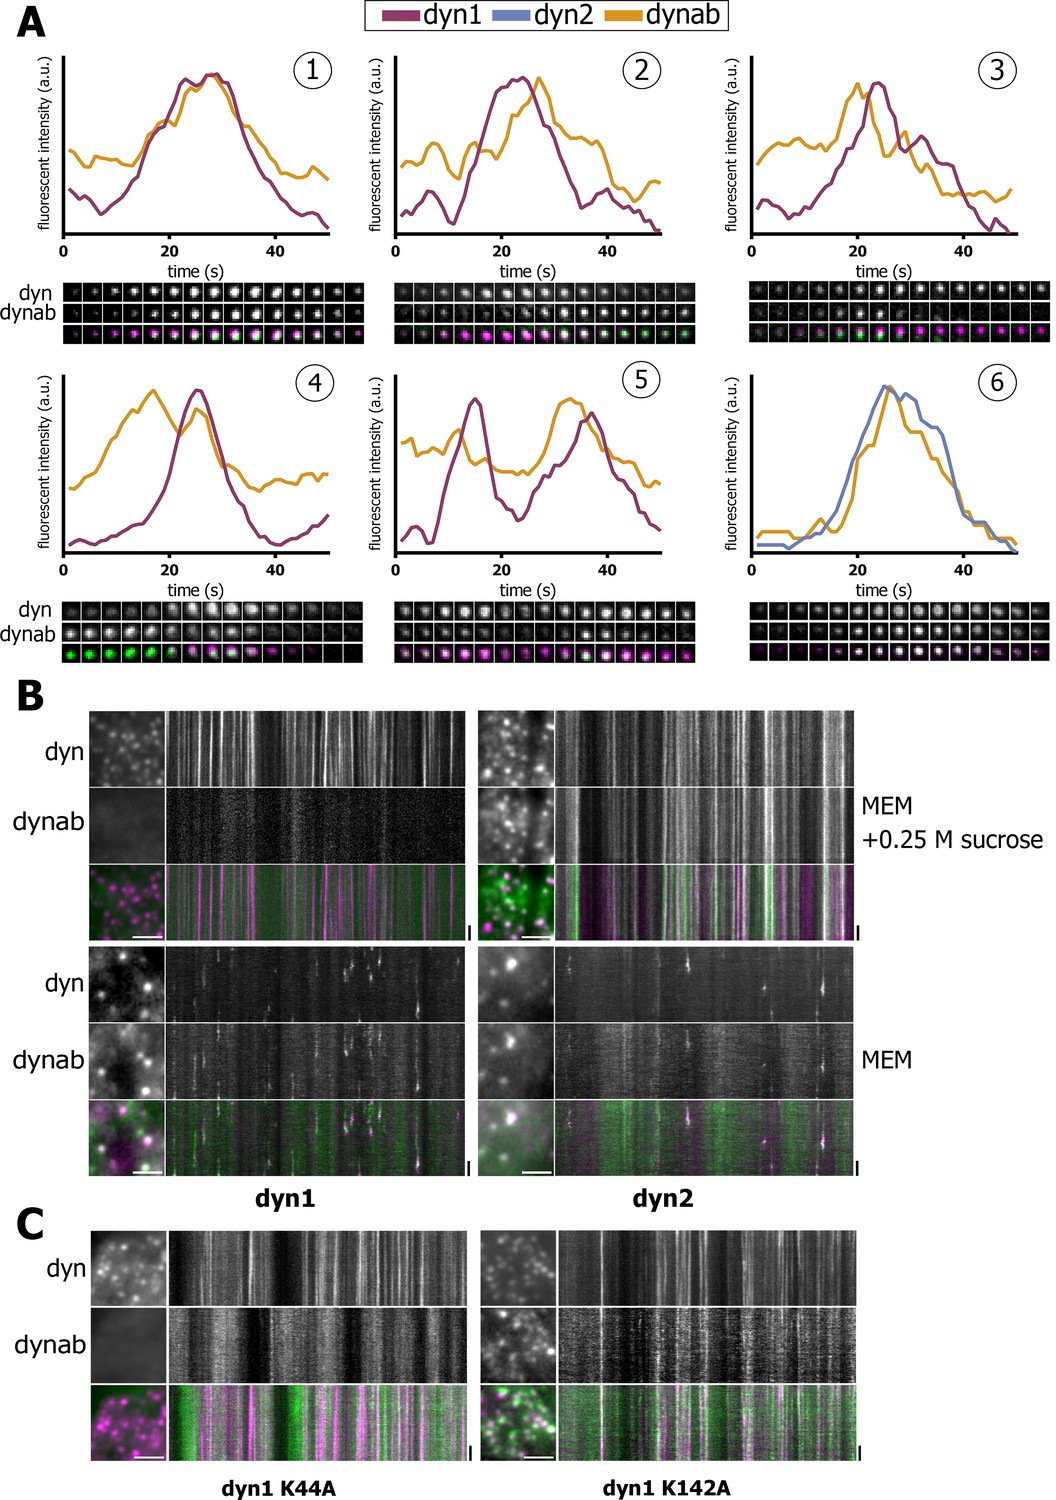
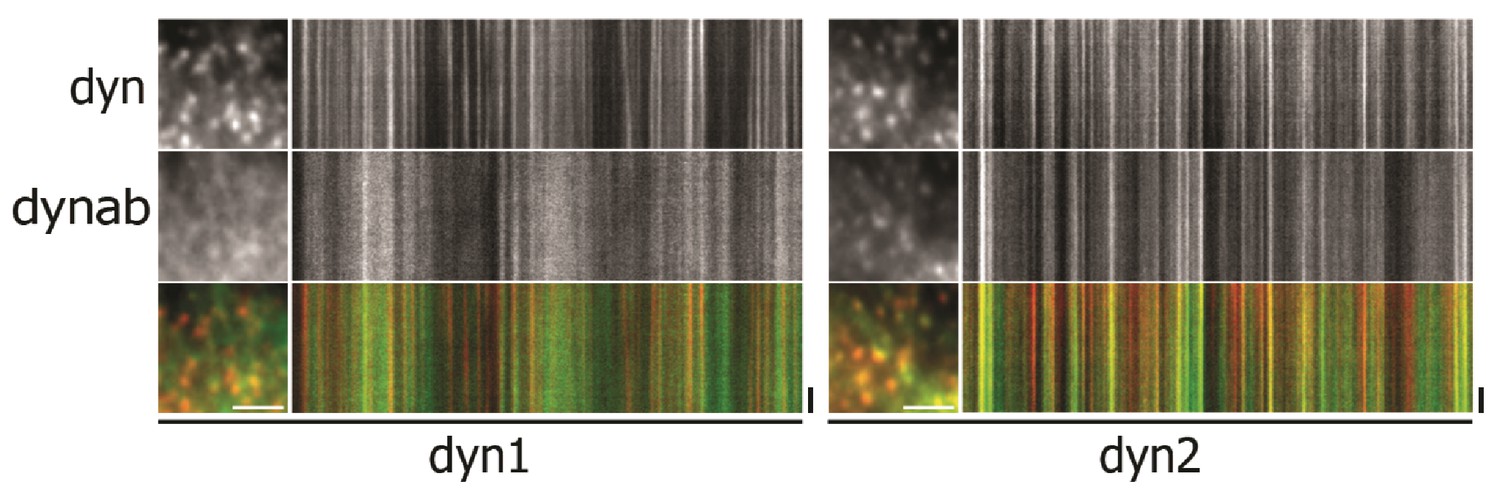
Expression in vivo of dynamin-1/2 and dynab.
(A) Time sequences (2 s/frame) of selected dynamin-1 or 2-dynab punctae in TKO cells and relative fluorescence profiles (normalized to dynamin peak). (1): central dynab peak; (2): right dynab peak; (3): left dynab peak; (4): double dynab peak; (5): double dynamin peak (dynamin-1-dynab); (6): dynamin-2-dynab profile. (B) Detail and kymographs of TKO cells expressing dynamin-1–2 and dynab treated with 0.25 M sucrose (hypertonic shock) or in normal medium. Scale bar for insets: 3 µm, 20 s. for kymographs. (C) Detail and kymographs of TKO cells expressing dynamin-1 K44A or K142A and dynab. Scale bar for insets: 3 µm, 20 s. for kymographs.
Figure 3—figure supplement 1
Detail and kymographs of HeLa cells expressing dynamin-1/2 and dynab treated with 0.25 M sucrose (hypertonic shock).
Scale bar for insets: 3 µm, 20 s. for kymographs.
Figure 4 with 3 supplements
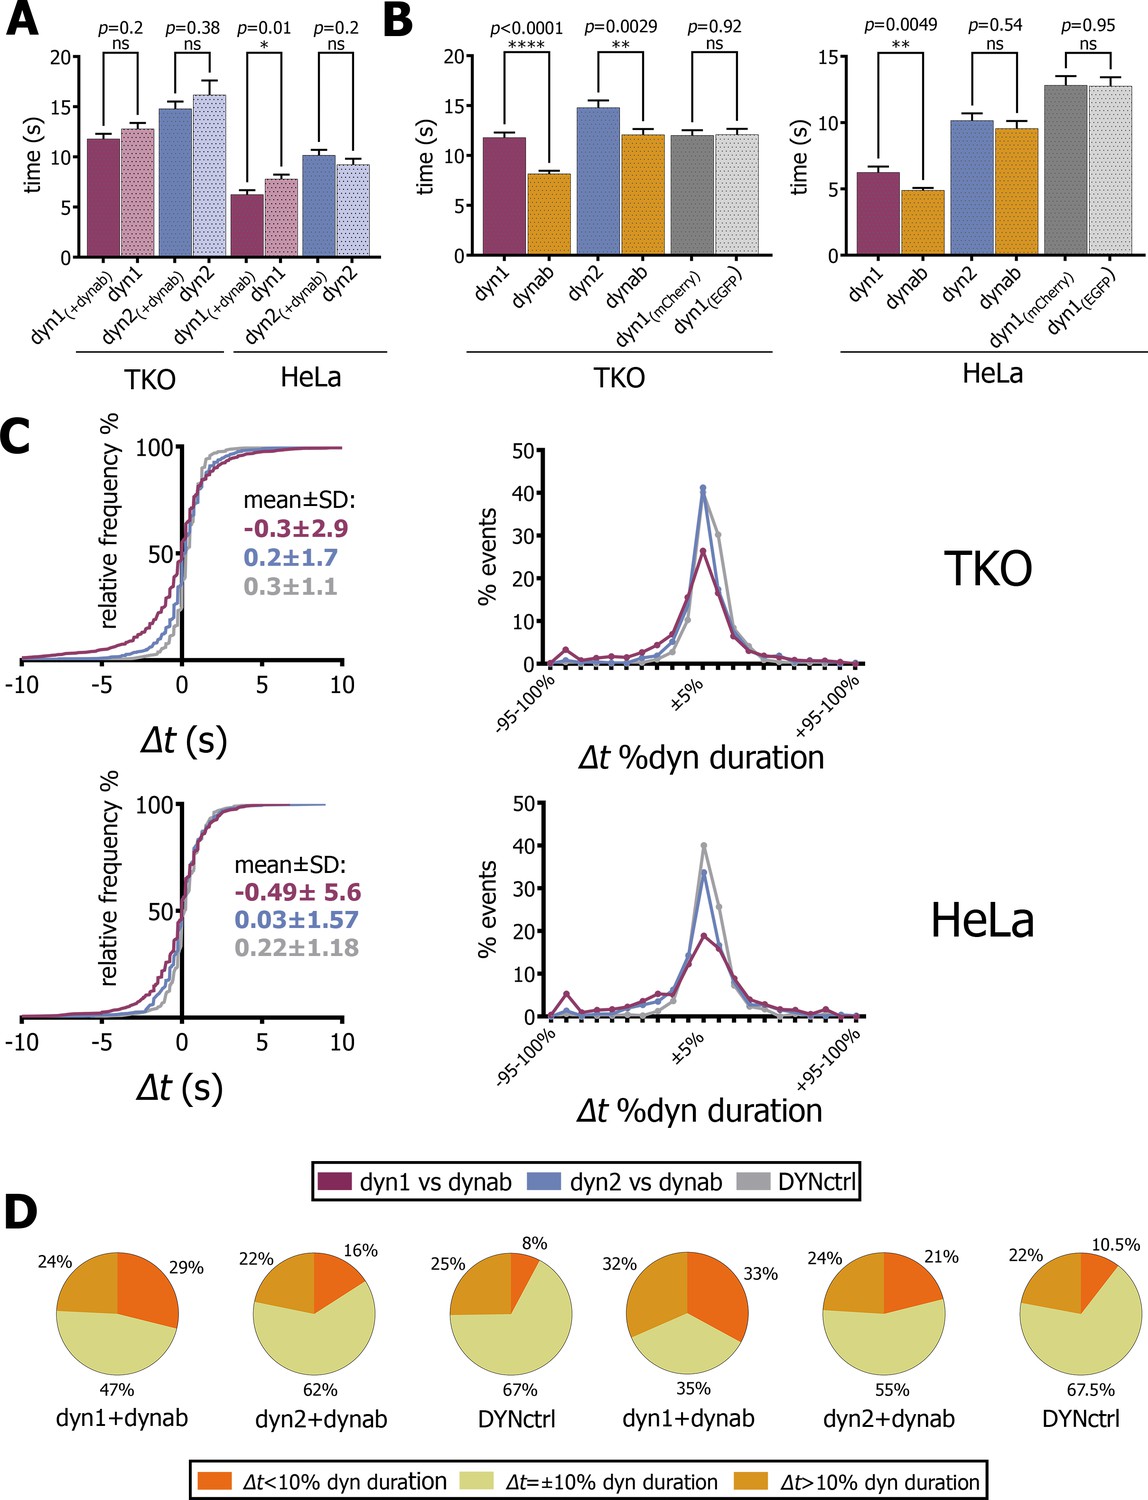
Analysis of fitted profiles.
(A) Plot of average of dynamin-1/2 event duration with or without dynab in TKO and HeLa cells (bars are averages ± SEM, unpaired t-test, *=p value<0.05, ns = p value>0.05). (B) Plots of average of dynab duration compared to dynamin-1/2 duration in TKO and HeLa cells. (bars are averages ± SEM, unpaired t-test, ****=p value<0.0001, **=p value<0.05 ns = p value>0.05). (C) From the left: relative frequency plot of Δt values; Δt distribution expressed in percentage of relative dynamin duration; the central 0 ± 10% comprises all the values of the +5% and −5% cluster. Values over 100% not represented (D) Circle charts based on Δt distributions, Δt=±10% category corresponds to events for which −10% ≤ Δt ≤+10%. Total events analyzed for statistics shown in this figure: in TKO cells, dyn1-dynab = 1094 (17 cells); dyn2-dynab = 854 (9 cells); DYNctrl = 662 (9 cells); dyn1 = 833 (2 cells); dyn2 = 234 (1 cell). In HeLa cells, dyn1-dynab = 511 (13 cells); dyn2-dynab = 512 (7 cells); DYNctrl = 664 (5 cells); dyn1 = 476 (5 cells); dyn2 = 534 (5 cells). Source files and statistical report for panel A-B-C and Figure 4—figure supplements 2–4 are available in Figure 4—source data 1, Figure 4—source data 2, Figure 4—source data 3, Figure 4—source data 4, Figure 4—source data 5, Figure 4—source data 6, Figure 4—source data 7 and Figure 4—source data 8.
-
Figure 4—source data 1
(panel A) Comparison of duration of dynamin 1–2 events with and without dynab (expressed in seconds), and statistical report.
- https://doi.org/10.7554/eLife.25197.017
-
Figure 4—source data 2
(panel B) Comparison of duration of dynamin 1–2 events with dynab events in TKO cells (expressed in seconds), and statistical report.
- https://doi.org/10.7554/eLife.25197.018
-
Figure 4—source data 3
(panel B) Comparison of duration of dynamin 1–2 events with dynab events in Hela cells (expressed in seconds), and statistical report.
- https://doi.org/10.7554/eLife.25197.019
-
Figure 4—source data 4
(panel C) Cumulative probability of time difference between t(dynab)-t(dyn1-2) and DYNctrl in TKO cells, and statistical report.
- https://doi.org/10.7554/eLife.25197.020
-
Figure 4—source data 5
(panel C) Cumulative probability of time difference between t(dynab)-t(dyn1-2) and DYNctrl in HeLa cells, and statistical report.
- https://doi.org/10.7554/eLife.25197.021
-
Figure 4—source data 6
(panel C) Relative frequency Δt values; Δt distribution expressed in percentage of relative dynamin duration.
- https://doi.org/10.7554/eLife.25197.022
-
Figure 4—source data 7
(panel D and F) Maximum intensity values of dynab peaks vs dynamin peaks.
- https://doi.org/10.7554/eLife.25197.023
-
Figure 4—source data 8
Data and statistical analysis of CCPs persistence in presence of dynab in HeLa cells.
- https://doi.org/10.7554/eLife.25197.024
Figure 4—figure supplement 1
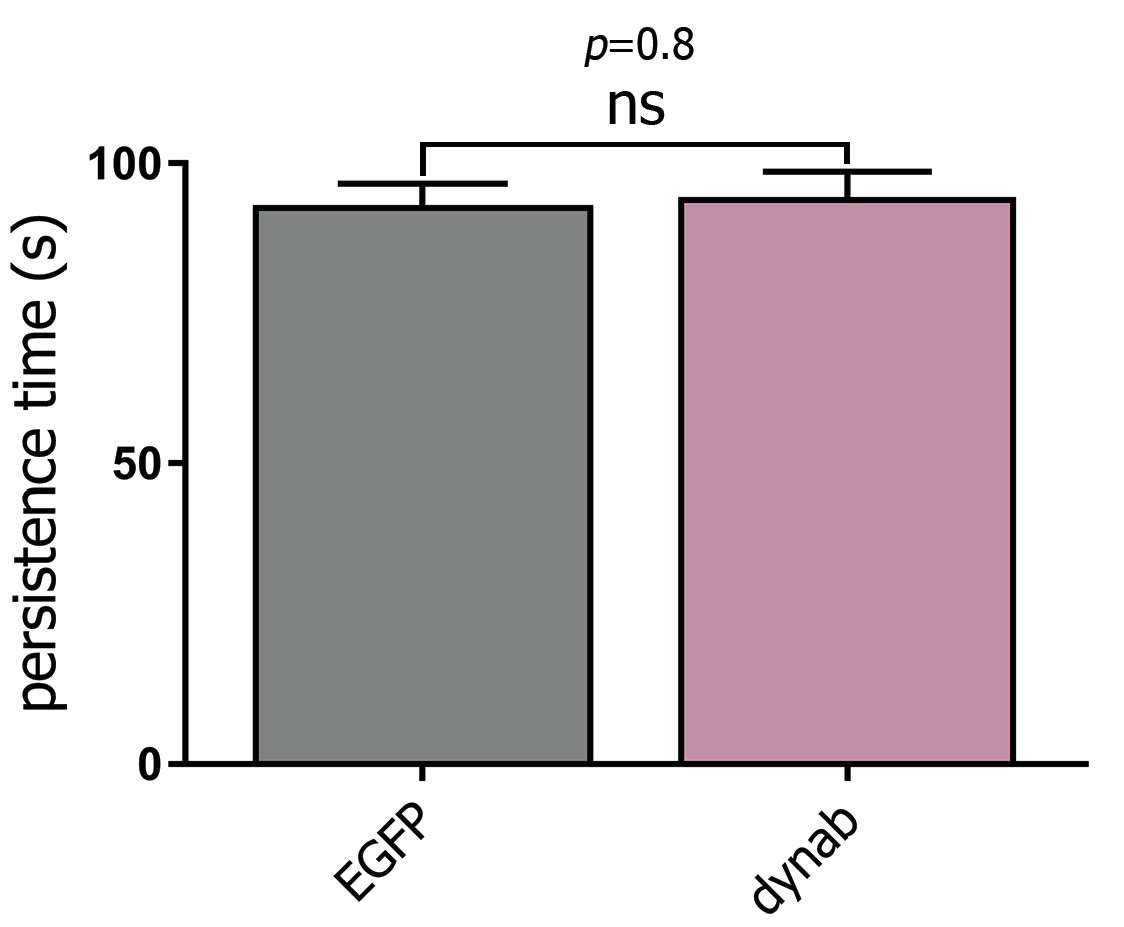
Lifetime of CCPs with or without expression of dynab in HeLa cells.
Measurement of clathrin-coated pits lifetime in HeLa cells expressing clathrin-mCherry and co-transfected with EGFP or dynab. Bars are averages ± SEM, unpaired t-test, p-value>0.05 = ns. The plot is the result of four independent experiments, counting 1 to 5 cells per experiment. For EGFP n = 234, for dynab n = 236.
Figure 4—figure supplement 2
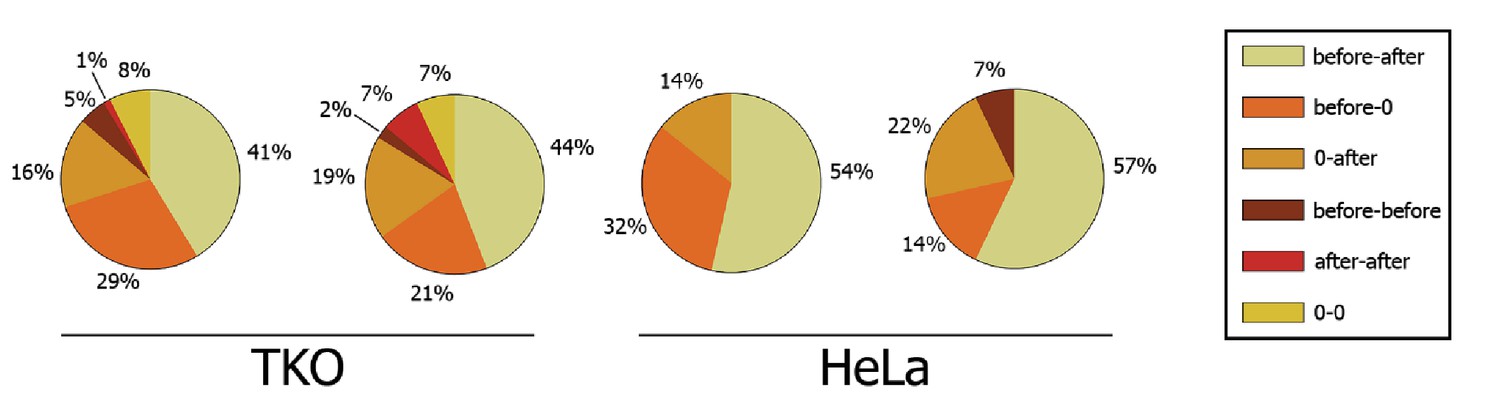
Double dynact peak distribution towards dynamin peak.
Circle charts based on Δt distributions, Δt=±10% category corresponds to events for which −10% ≤ Δt ≤+10%.
Figure 4—figure supplement 3

plots of maximum intensity of dynab with max intensity of dynamin.
(A) Plots of maximum intensity values of dynab peaks vs dynamin peaks (TKO cells). (B) Plots of maximum intensity values of dynab peaks vs dynamin peaks (HeLa cells).
Figure 5
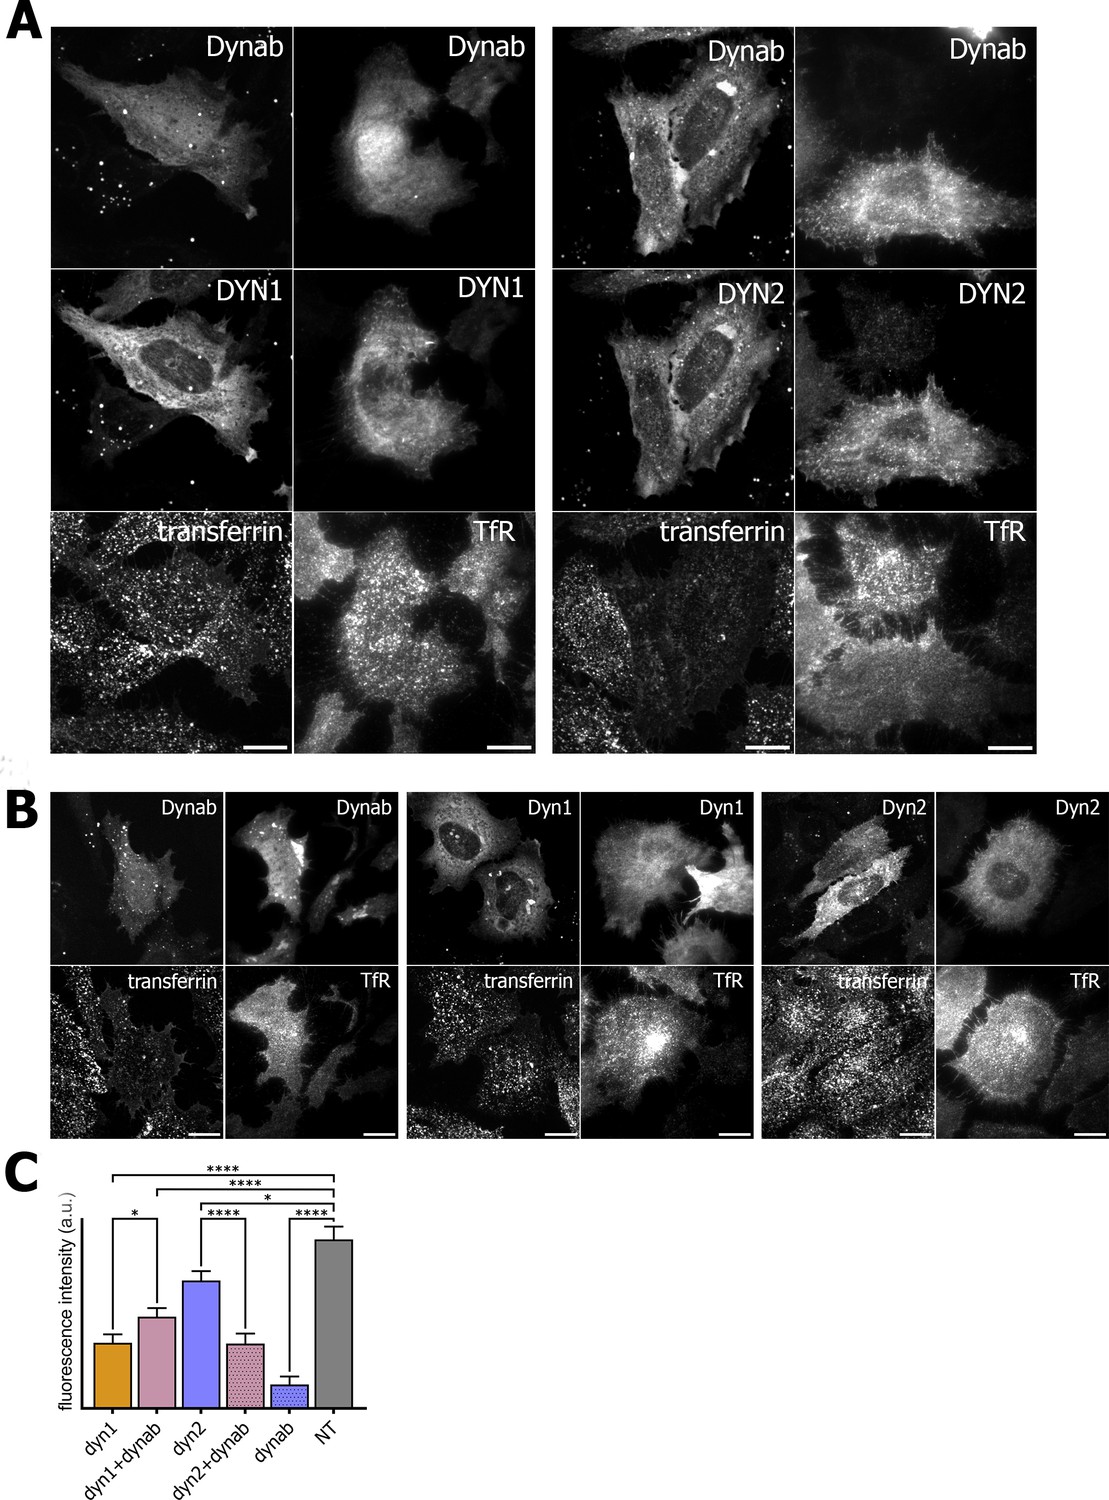
Transferrin internalization assay and TfR immunofluorescence on HeLa cells.
(A) Transferrin internalization assay and TfR immunofluorescence on HeLa cells overexpressing dynamin1/2 and dynab (B) Transferrin internalization assay and TfR immunofluorescence on HeLa cells overexpressing dynamin1/2 or dynab alone. (C) Measurements (fluorescence intensity of manually fitted cell profiles) of transferrin internalization of HeLa cells expressing dynamin1/2 with dynab or dynamin 1/2 or dynab alone or not transfected (NT) (bars are averages ± SEM, unpaired t-test, *=p value<0.05, ns = p value>0.05). Number of cells analyzed: dyn1 n = 17; dyn1 +dynab n = 23; dyn2 n = 21; dyn2 +dynab n = 26; dynab n = 9; not transfected (NT) n = 13. Source file for panel C and Figure 4—figure supplement 1: Figure 5—source data 1, Figure 4—source data 8.
-
Figure 5—source data 1
(panel C) Data and statistical analysis of transferrin internalization in HeLa cells.
- https://doi.org/10.7554/eLife.25197.026
Figure 6
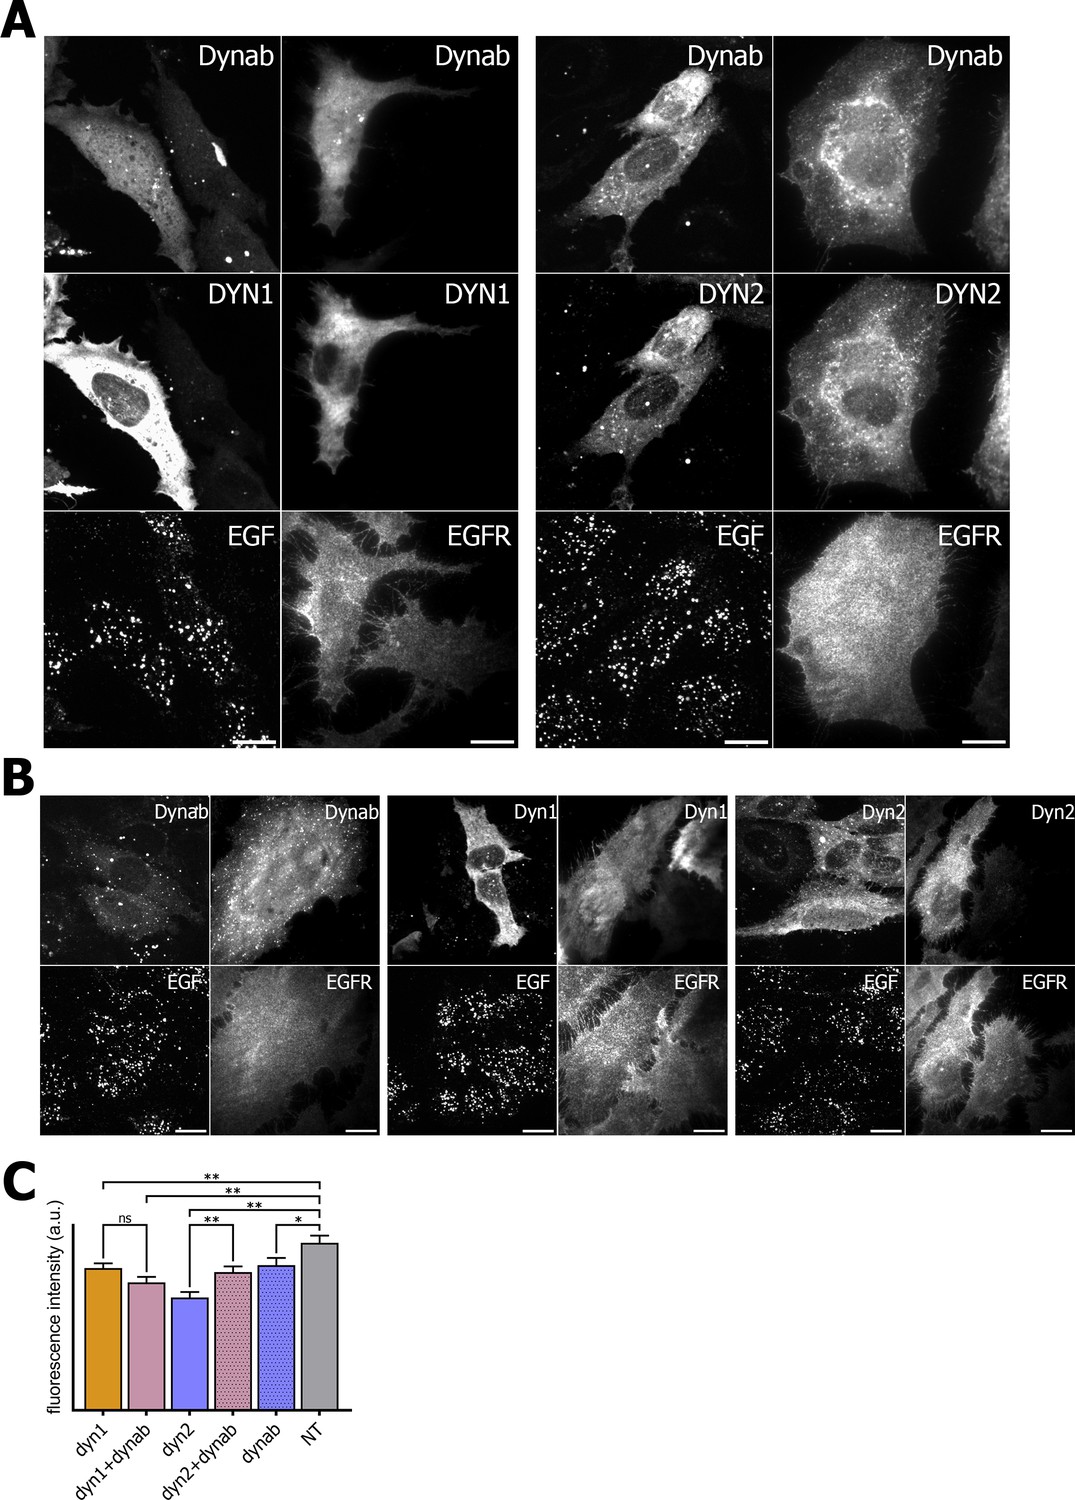
EGF internalization assay and EGFR immunofluorescence on HeLa cells.
(A) EGF internalization assay and EGFR immunofluorescence on HeLa cells overexpressing dynamin1/2 and dynab (B) EGF internalization assay and EGFR immunofluorescence on HeLa cells overexpressing dynamin1/2 or dynab alone. (C) Measurements (fluorescence intensity of manually fitted cell profiles) of EGF internalization of HeLa cells expressing dynamin1/2 with dynab or dynamin 1/2 or dynab alone or not transfected (NT) (bars are averages ± SEM, unpaired t-test, *=p value<0.05, ns = p value>0.05). Number of cells analyzed: dyn1 n = 29; dyn1 + dynab n = 28; dyn2 n = 24; dyn2 + dynab n = 29; dynab n = 30; not transfected (NT) n = 25. Source file for panel C: Figure 6—source data 1.
-
Figure 6—source data 1
(panel C) Data and statistical analysis of EGF internalization in HeLa cells.
- https://doi.org/10.7554/eLife.25197.028
Author response image 1
Author response image 2
Additional files
-
Source code 1
postUtrack_1.
- https://doi.org/10.7554/eLife.25197.029
-
Source code 2
postUtrack_2_GenerateProfiles.
- https://doi.org/10.7554/eLife.25197.030
-
Supplementary file 1
Supplementary File_Manual _Code.
- https://doi.org/10.7554/eLife.25197.031
-
Transparent reporting form
- https://doi.org/10.7554/eLife.25197.032
Download links
A two-part list of links to download the article, or parts of the article, in various formats.
Downloads (link to download the article as PDF)
Open citations (links to open the citations from this article in various online reference manager services)
Cite this article (links to download the citations from this article in formats compatible with various reference manager tools)
Uncoupling of dynamin polymerization and GTPase activity revealed by the conformation-specific nanobody dynab
eLife 6:e25197.
https://doi.org/10.7554/eLife.25197


