Purinergic regulation of vascular tone in the retrotrapezoid nucleus is specialized to support the drive to breathe
- University of Connecticut, United States
- University of São Paulo, Brazil
- University of Vermont, United States
- University of Manchester, United Kingdom
Figures
Figure 1
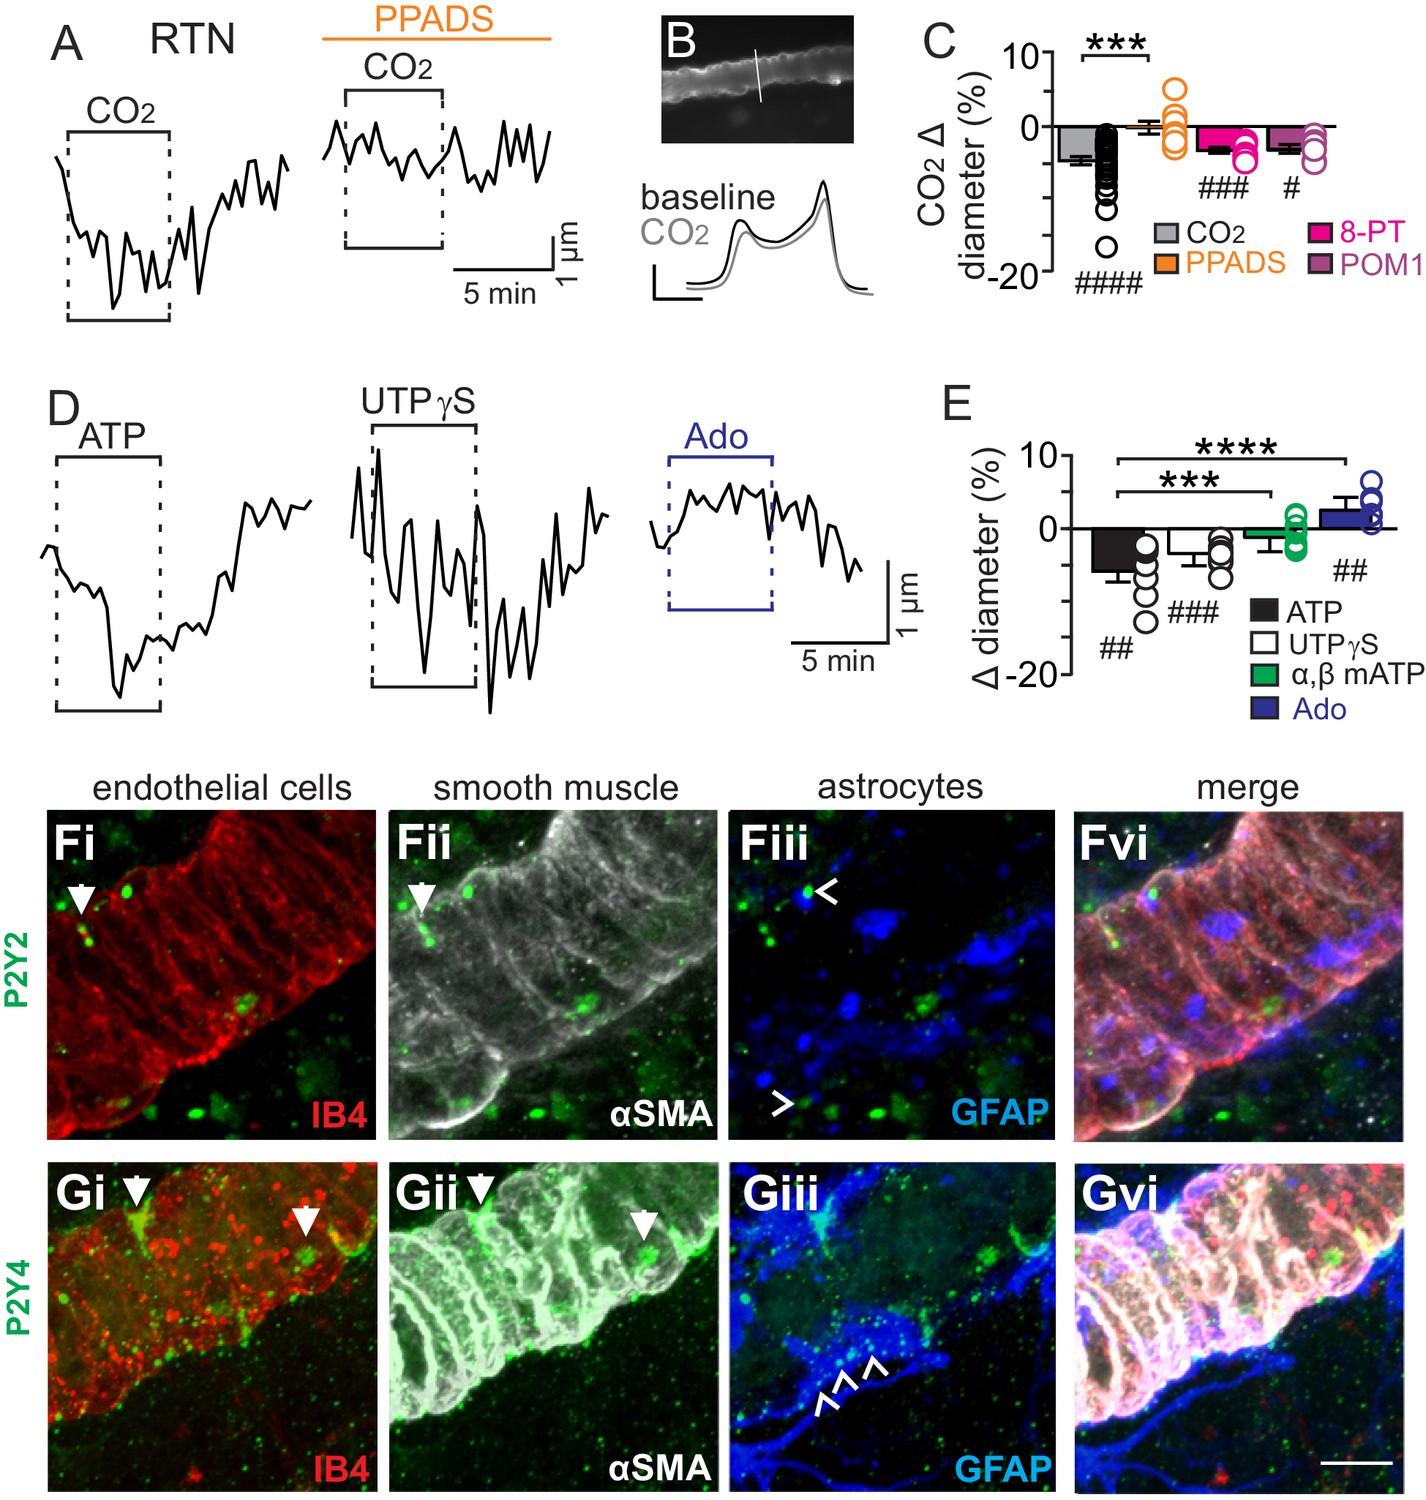
CO2/H+-induced vasoconstriction of RTN arterioles is mediated by a purinergic dependent mechanism involving P2Y2/4 receptors.
(A) trace of an RTN arteriole diameter show that increasing CO2 in the perfusion media from 5% to 15% (balance air, in TTX) caused vasoconstriction under baseline conditions but not in PPADS (5 µM). (B) example vessel image under baseline conditions and corresponding fluorescent intensity profile plots also show that exposure to high CO2 decreased vessel diameter. Profile plot scale bars: 2000 a.u., 10 µm. (C) summarized results of RTN arteriole responses to CO2/H+ under baseline conditions (N = 34 vessels) and when P2-receptors were blocked (5 µM PPADS; N = 8 vessels), P1-receptors were blocked (10 µM 8-PT; N = 7 vessels), or ectonucleotidase activity was inhibited (100 µM POM1; N = 5 vessels). (D) example diameter traces show RTN arterioles constrict in response to bath application of ATP (100 µM) or the selective P2Y2/4 receptor agonist UTPγS (0.5 µM) but dilate when P1 receptors are activated by adenosine (Ado; 1 µM). (E) summary data plotted as % diameter change in response to ATP (N = 7 vessels), UTP (N = 8 vessels), α,β-mATP (100 µM, preferential P2X agonist; N = 9 vessels) or adenosine (N = 9 vessels). (F–G), immunoreactivity for P2Y2 (F) and P2Y4 (G) receptors was detected as brightly label puncta near endothelial cells (DyLight 594 Isolectin B4 conjugate; IB4), arteriole smooth muscle (α-smooth muscle actin; αSMA), and astrocytes (glial fibrillary acidic protein; GFAP) associated with arterioles in the RTN (N = 3 animals). Arrows identify receptor labeling close to endothelial or smooth muscle cells and arrowhead identifies receptor labeling of astrocyte processes. Scale bar 10 µM. Hash marks designate a difference in µm from baseline as determined by RM-one-way ANOVA and Fishers LSD test or paired t-test and asterisks identify differences in CO2/H+-induced % change under baseline conditions vs in the presence of PPADS (C) or ATP vs specific agonist-induced % change (E) (one-way ANOVA and Fishers LSD test); one symbol = p<0.05, two symbols = p<0.01, three symbols = p<0.001, four symbols = p<0.0001.
Figure 2
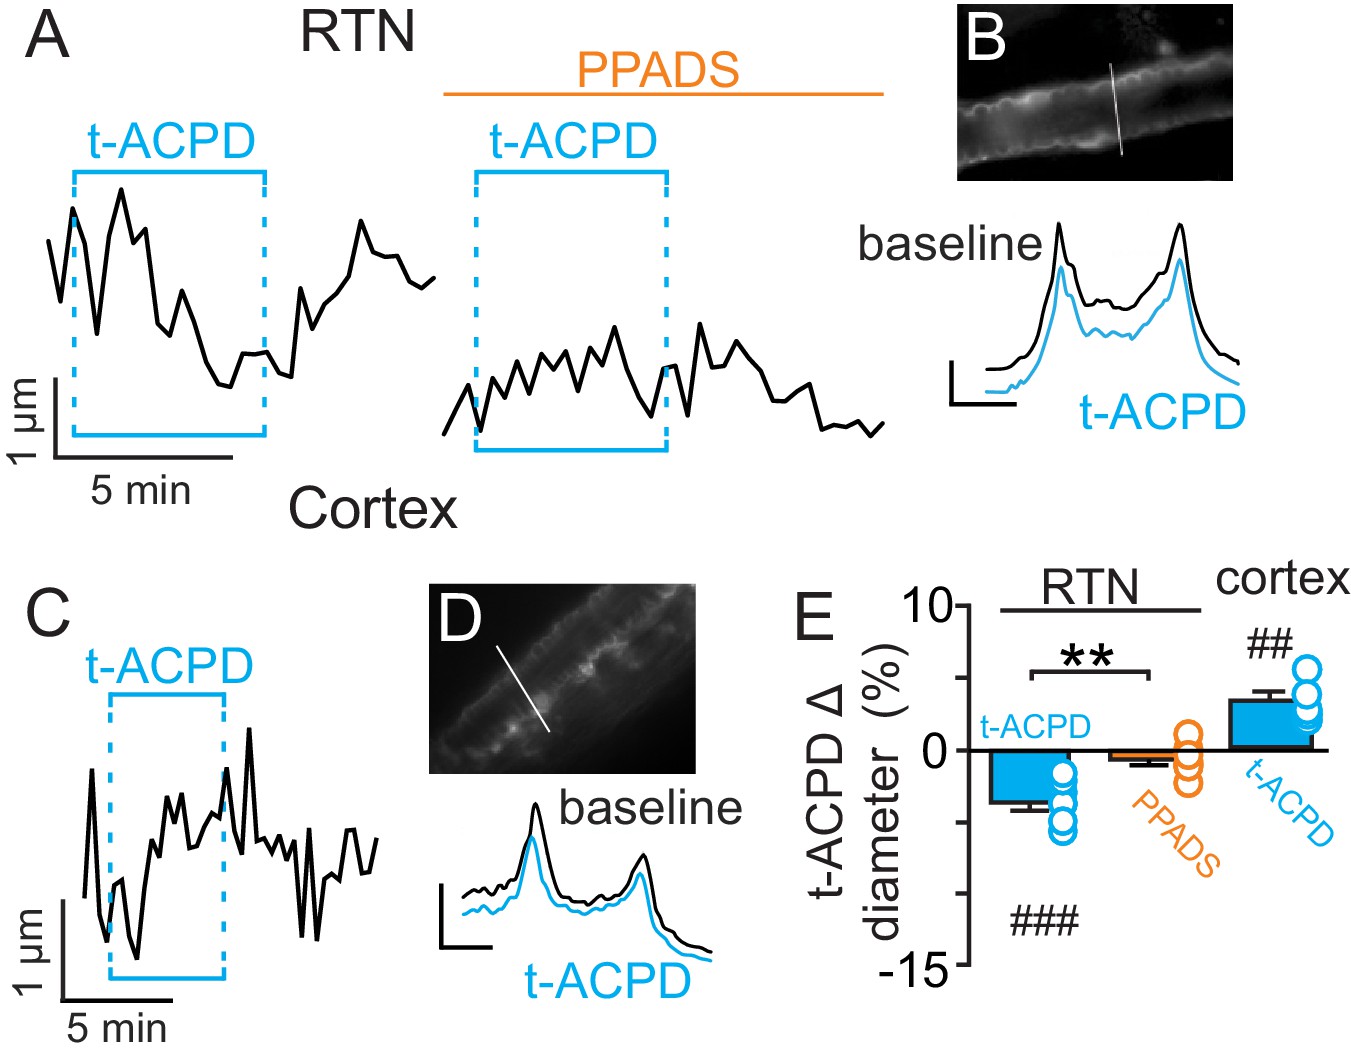
t-ACPD-mediated astrocyte activation has opposite effects on arteriole diameter in the RTN and cortex.
(A) diameter trace of an RTN arteriole show the response of an RTN arteriole to t-ACPD (50 µM) under baseline conditions and during P2-receptor blockade with PPADS (5 µM). (B) example RTN vessel image under baseline conditions and corresponding fluorescent intensity profile plots also show that exposure to tACPD decreased vessel diameter. (C) diameter trace of an cortical arteriole and corresponding vessel image with example profile plots (D) show that exposure to tACPD (50 µM) increase cortical arteriole diameter. Profile plot scale bars: 2000 a.u., 10 µm. (E) summary from the RTN (N = 7 vessels) and cortex (N = 5 vessels) data show that t-ACPD caused vasoconstriction of RTN arterioles under control conditions but not in the presence of PPADS, suggesting purinergic signaling most likely from astrocytes mediate constriction of arterioles in the RTN. Conversely, in the cortex t-ACPD caused vasodilation. ##, difference in µm from baseline (paired t-test, p<0.01). ###, difference in µm from baseline (RM-one-way ANOVA and Fishers LSD test, p<0.001). **, difference in t-ACPD-induced % change under baseline conditions vs in PPADS (paired t-test, p<0.01).
Figure 3
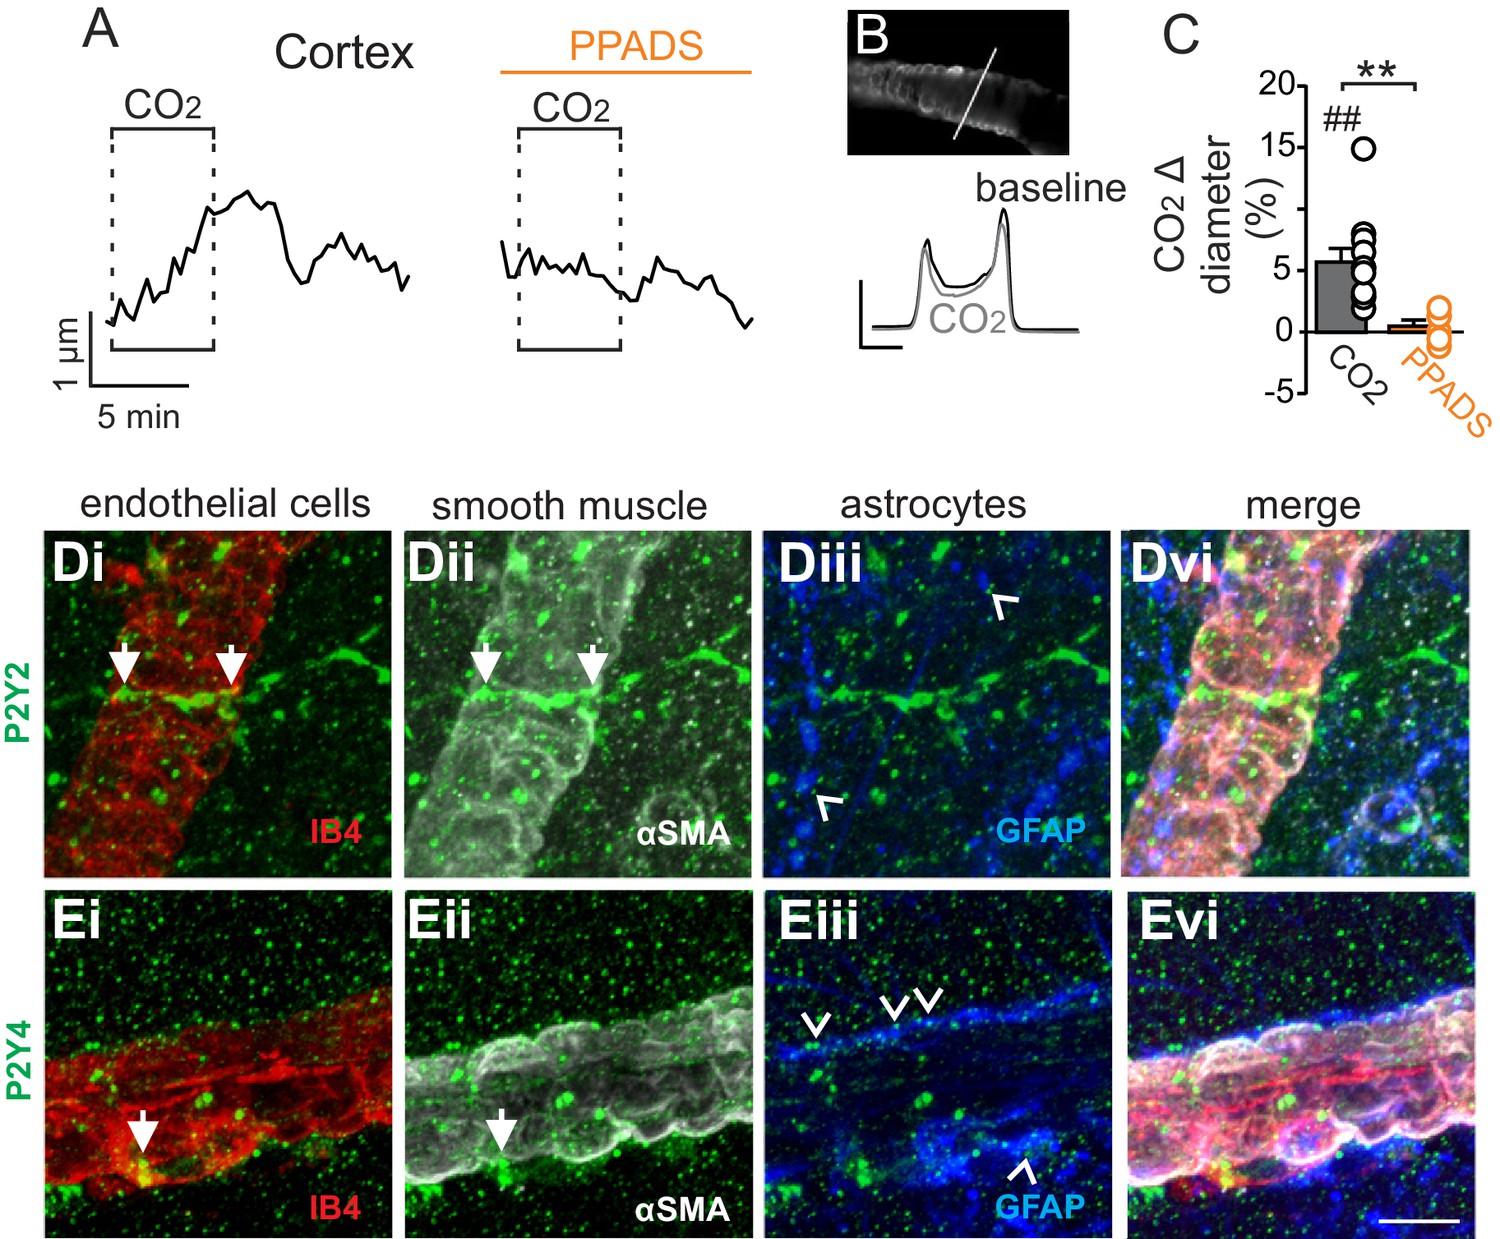
Cortical arterioles dilate in response to CO2/H+.
(A) diameter trace of a cortical arteriole with an example vessel image and fluorescence profile plots (B) show that exposure to CO2/H+ caused vasodilation under baseline conditions and this response was blunted by PPADS (5 µM). Profile plot scale bars: 2000 a.u., 10 µm. (C) summary data show CO2/H+-induced vasodilation of cortical arterioles under bassline conditions (N = 11 vessels) but not in PPADS (N = 6 vessels). (D–E), immunoreactivity for P2Y2 (D) and P2Y4 (E) receptors was detected as brightly label puncta near endothelial cells (DyLight 594 Isolectin B4 conjugate; IB4), arteriole smooth muscle (α-smooth muscle actin; αSMA), and astrocytes (glial fibrillary acidic protein; GFAP) associated with cortical arterioles (N = 3 animals). Arrows identify receptor labeling close to endothelial or smooth muscle cells and arrowheads identifies receptor labeling of astrocyte processes. Scale bar 10 µM. ##, difference in µm from baseline (paired t test, p<0.01). **, difference in CO2/H+-induced % change under control conditions vs in PPADS (paired t-test, p<0.01).
Figure 4
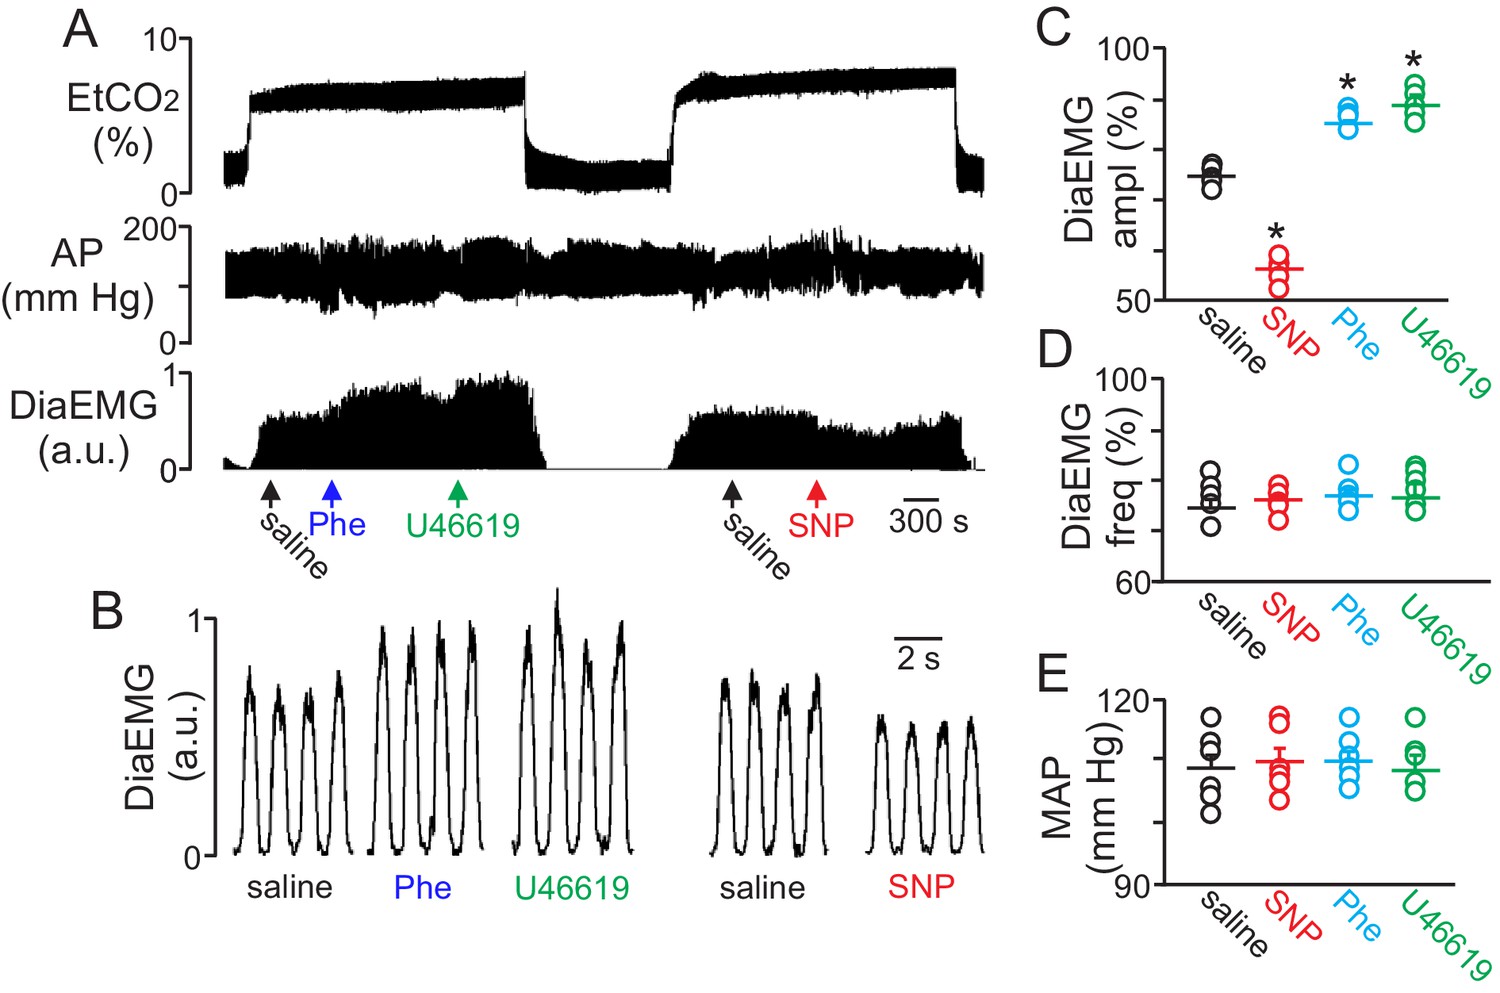
Local constriction and dilation of RTN vessels reciprocally modulates the ventilatory response to CO2in vivo.
(A) end expiratory CO2 (EtCO2), arterial pressure (AP) and diaphragm EMG (DiaEMG) traces show that application of vasoconstrictors (phenylephrine, Phe, 1 µM or U46619, 1 µM) or a vasodilator (sodium nitroprusside, SNP, 1 µM) to the RTN increased and decreased the ventilatory response to 7–8% CO2, respectively. (B) diaphragm EMG (DiaEMG) traces expanded in time show that application of Phe, U46619 or SNP, to the VMS in the region of the RTN increased and decreased the DiaEMG amplitude response to 7–8% CO2. (C–E) summary data show effects of saline, SNP, Phe and U46619 applications to the VMS near the RTN on DiaEMG amplitude (N = 6 animals per group) (C), DiaEMG frequency (D) and mean arterial pressure (MAP) (E). *, difference in CO2/H+-induced % change under control conditions (saline) vs during vasodilation or vasoconstriction (RM-ANOVA followed by Bonferroni multiple-comparison test, p<0.05).
Figure 5
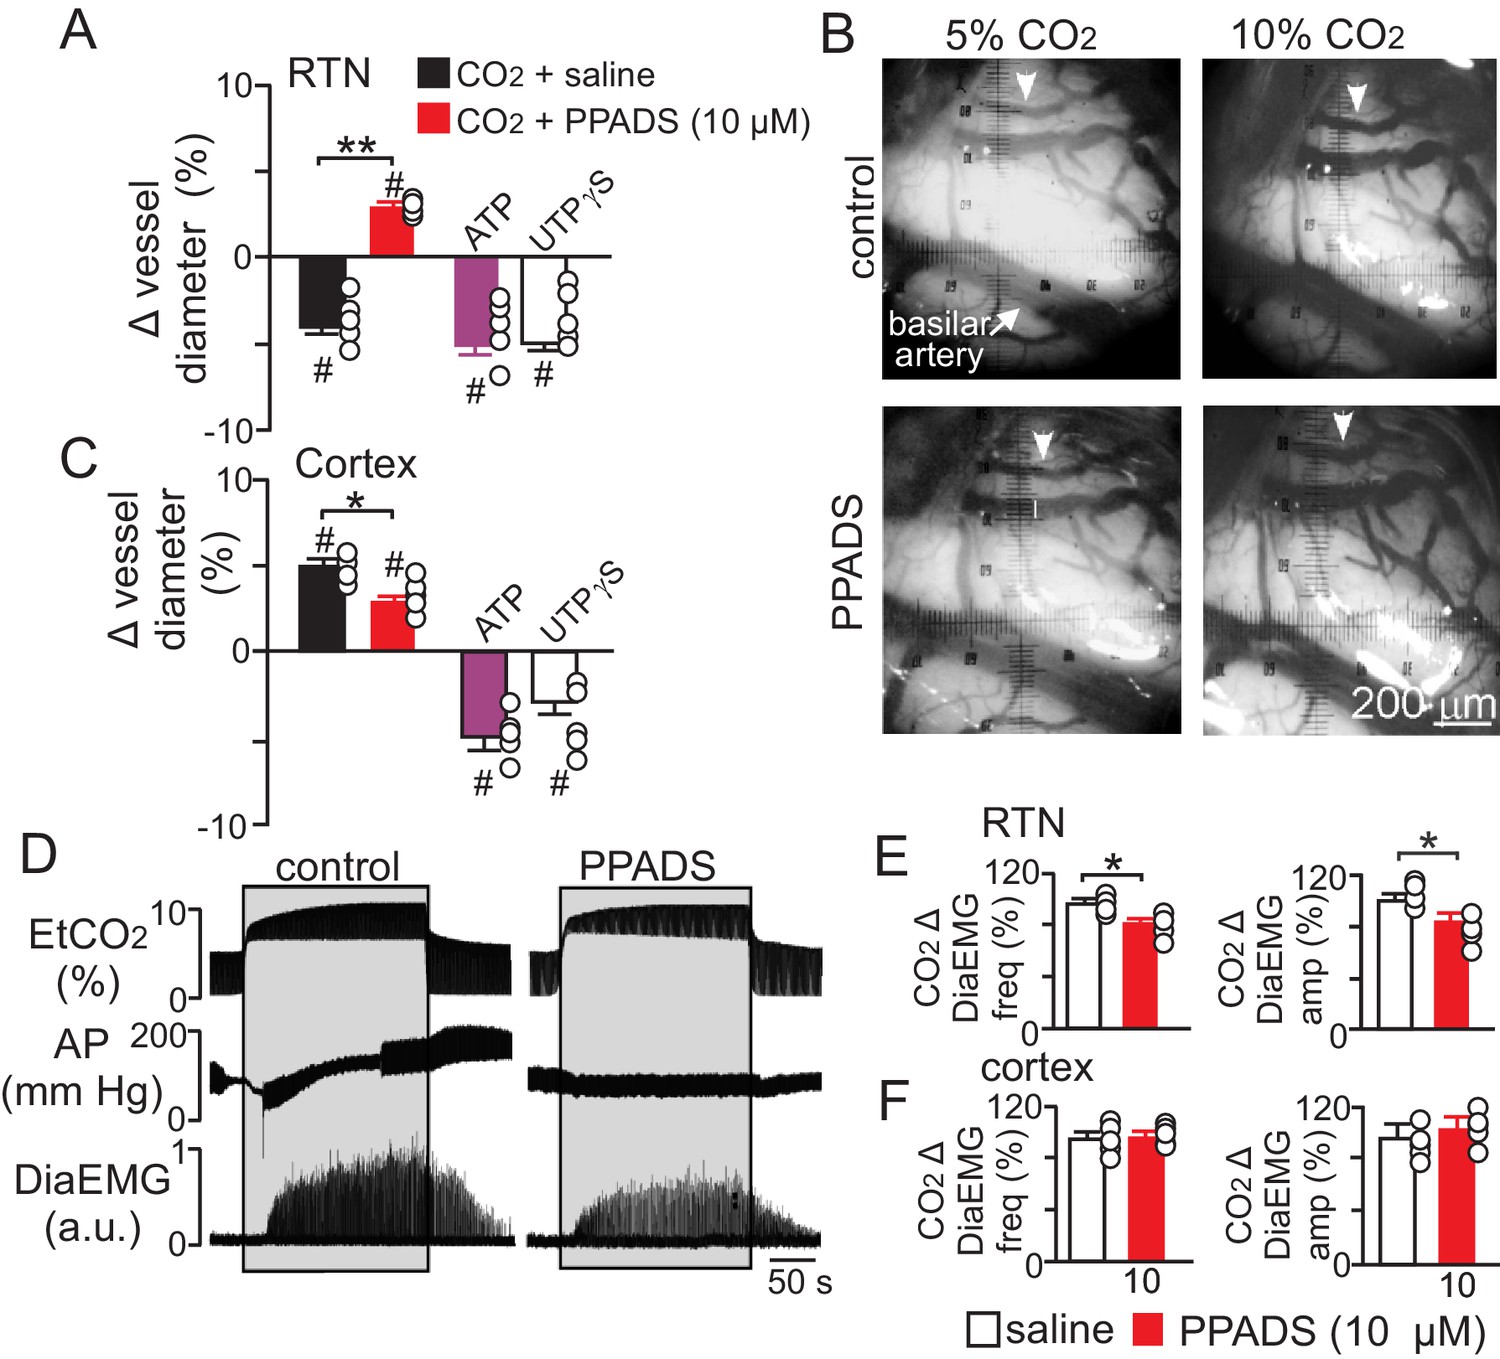
Purinergic signaling opposes CO2/H+-dilation of VMS pial vessels in vivo and contributes to the ventilatory response to CO2.
(A) summary data plotted as % change in RTN pial vessel diameter in response to an increase in end expiratory CO2 after VMS application of saline (100 nL; N = 5 animals) or PPADS (10 µM, 100 nL; N = 5 animals). Also shown are the vascular responses to VMS application of ATP (1 mM, 100 nL; N = 5) and UTPγS (1 mM, 100 nL; N = 5 animals). (B) Photomicrographs (40X) show pial vessel distribution on the VMS, arrow; representative vessel analyzed. (C) Summary data shows the response of cortical pial vessels to CO2 after local application of saline or PPADS (10 µM, 100 nL; N = 5 animals). Also shown are vascular responses to exogenous application of ATP (1 mM - 100 nL; N = 5 animals) or UTPγS (1 mM, 100 nL; N = 5). (D) End expiratory CO2 (EtCO2), arterial pressure (AP) and diaphragm EMG (DiaEMG) traces show that bilateral VMS application of PPADS (10 µM, 100 nL) attenuated the ventilatory response to CO2. (E) summary data show CO2-induced changes in DiaEMG frequency and amplitude after bilateral VMS application of saline and PPADS (10 µM; N = 5 animals). (F) summary data show that PPADS (10 µM) application to the cortex surface had no measurable effect on CO2-induced changes in DiaEMG frequency and amplitude (N = 5 animals). Hash marks designate a difference in µm from baseline (RM-ANOVA followed by Bonferroni multiple-comparison test, #, p<0.05). Asterisks identify a difference in CO2/H+--induced % change under control conditions (saline) vs in the presence of PPADS (RM-ANOVA followed by Bonferroni multiple-comparison test, *, p<0.05; **, p<0.01) (panels A and C) or paired t-test (panel E, *, p<0.05).
Download links
A two-part list of links to download the article, or parts of the article, in various formats.
Downloads (link to download the article as PDF)
Open citations (links to open the citations from this article in various online reference manager services)
Cite this article (links to download the citations from this article in formats compatible with various reference manager tools)
Purinergic regulation of vascular tone in the retrotrapezoid nucleus is specialized to support the drive to breathe
eLife 6:e25232.
https://doi.org/10.7554/eLife.25232


