Scaffold-mediated gating of Cdc42 signalling flux
- University of Bordeaux, CNRS, European Institute of Chemistry and Biology, IBGC, UMR 5095, France
- Harvard Medical School, United States
Figures
Figure 1 with 1 supplement
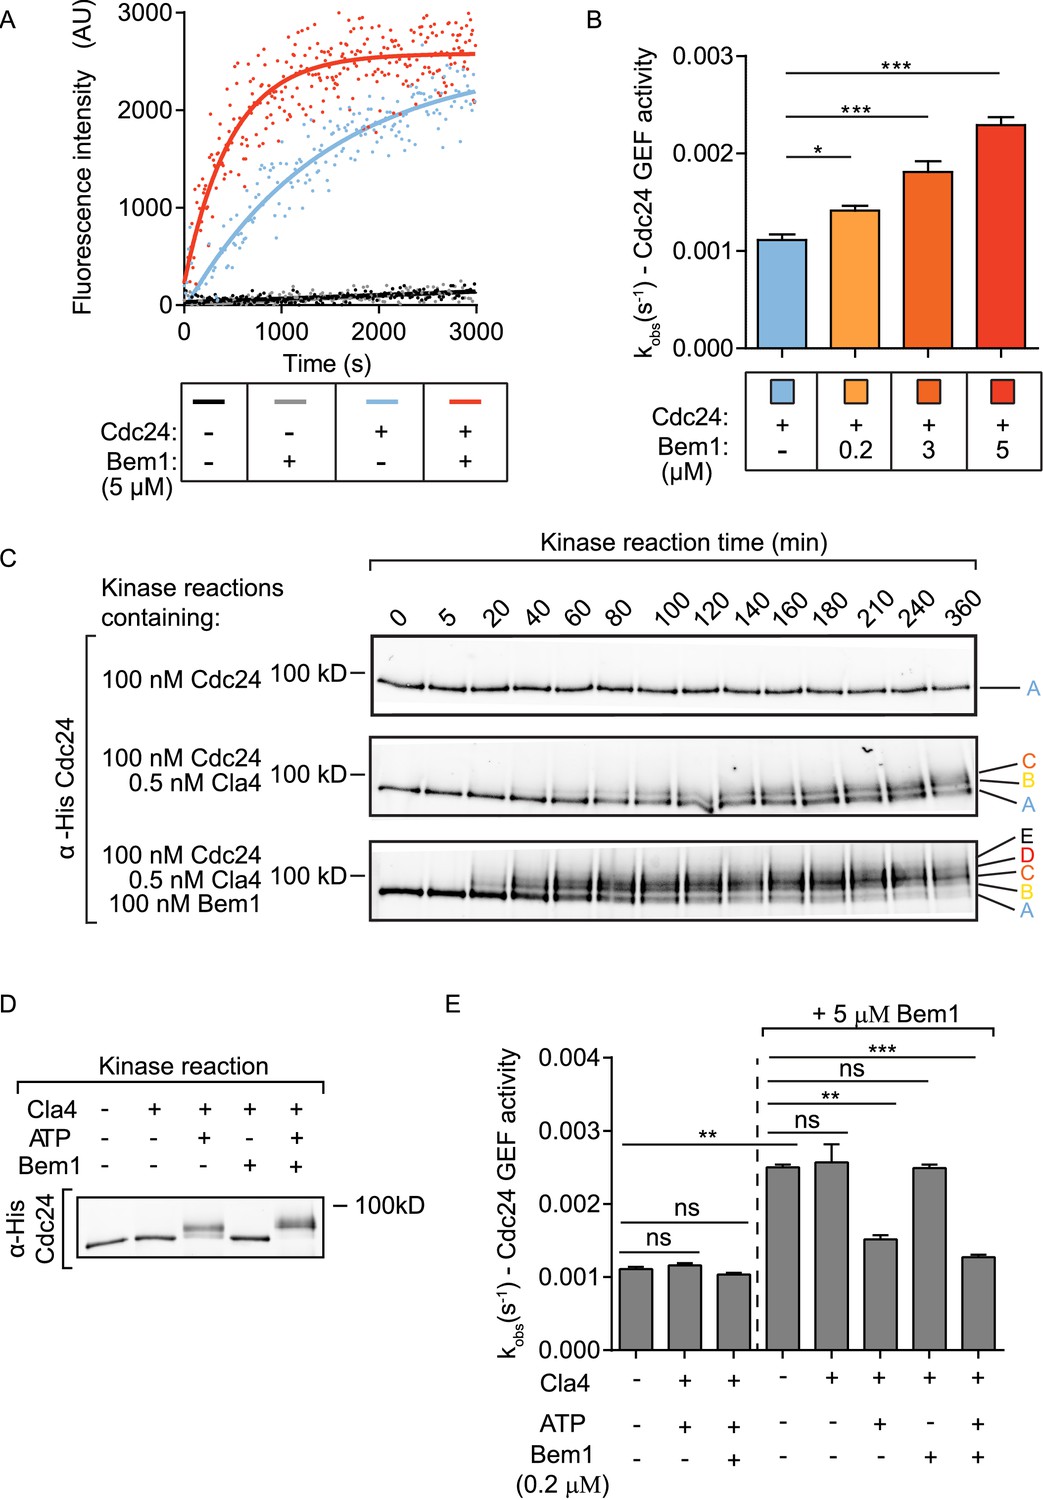
The scaffold Bem1 directly stimulates Cdc24 GEF activity in a reversible manner via PAK-dependent phosphorylation.
(A) Fluorescence intensity change associated with the nucleotide exchange of GDP-Cdc42 for mant-GTP Cdc42. Fluorescence was measured after the addition of GDP-Cdc42 (9 µM) to reactions containing Mant-GTP (100 nM) and GMP-PNP (100 µM) in the absence (blue curve) and presence (red curve) of Bem1 (5 µM) and Cdc24 (60 nM). (B) Observed kinetic rate constants were obtained by fitting trace data to a single exponential equation. Error bars show SD and confidence where *p<0.05 and ***p<0.001. (C) In vitro kinase reactions in which the indicated proteins were incubated with Cdc24-6xHis. At the times indicated, samples were removed and analysed by SDS-PAGE and Western blotting using anti-His antibody to detect the electrophoretic mobility shift of Cdc24-6xHis. (D) A Western blot showing the phosphorylation of Cdc24 in the samples used for subsequent GEF assays. (E) The observed kinetic rate constants of Cdc24 GEF activity obtained by fitting trace data to a single exponential equation. The reactions indicated on the right had additional Bem1 added to 5 µM.
-
Figure 1—source data 1
Excel file showing the observed rate constants for the GEF assays presented in Figure 1B and E.
- https://doi.org/10.7554/eLife.25257.003
Figure 1—figure supplement 1
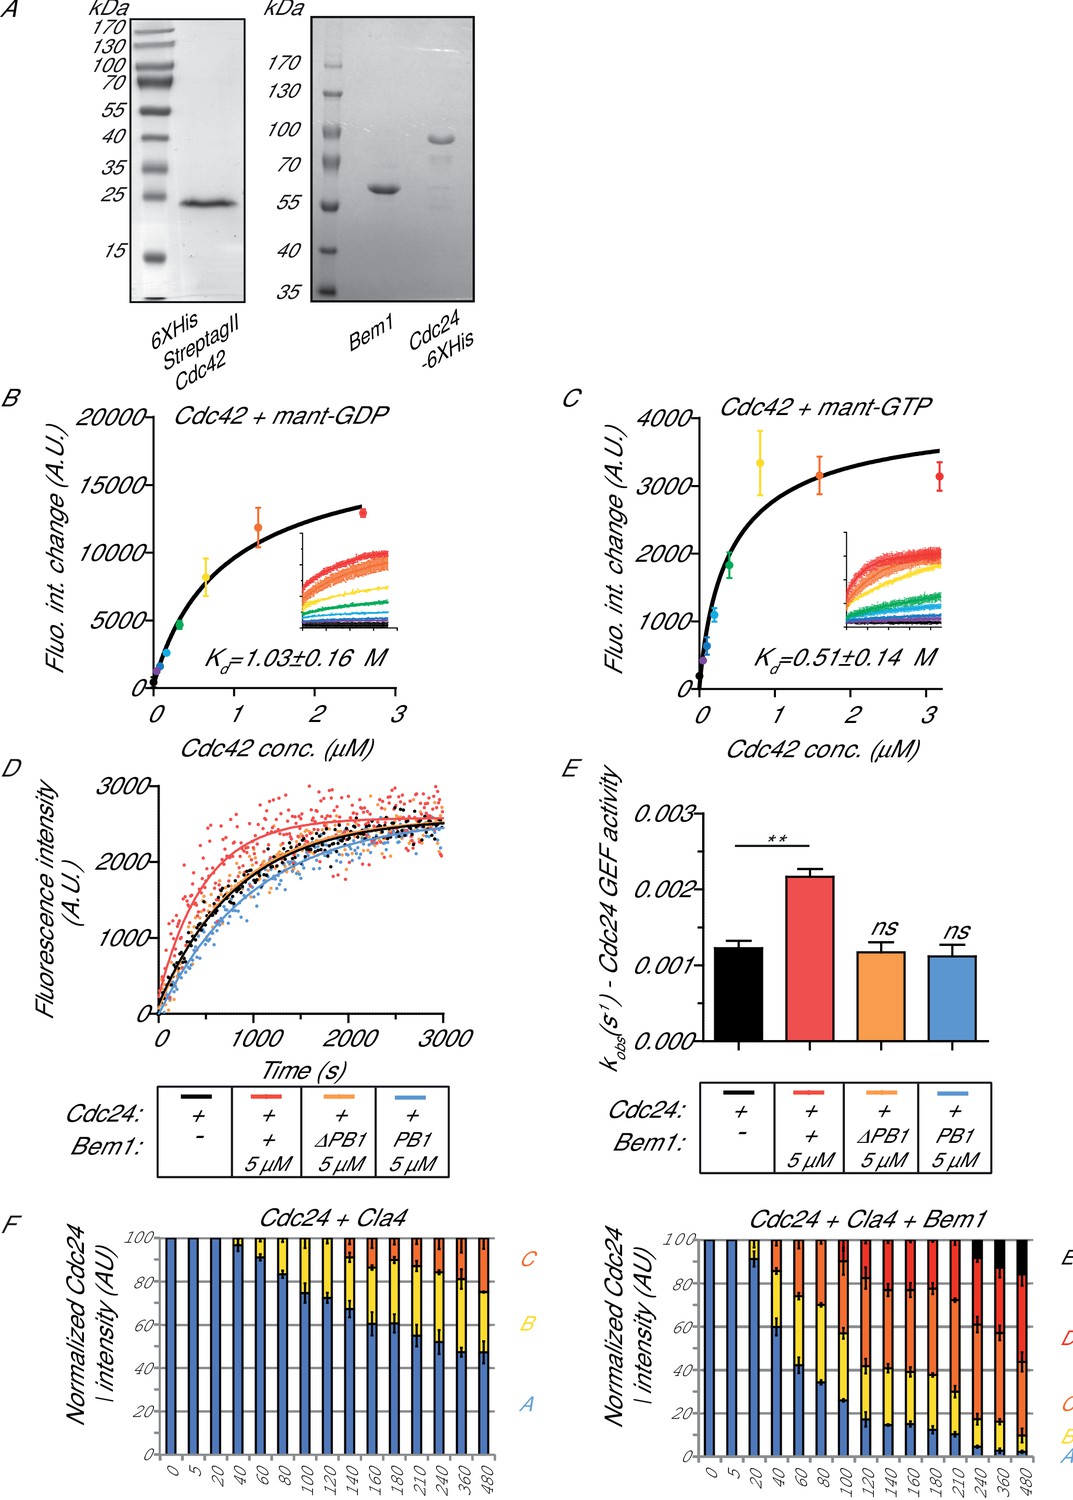
The interaction of Cdc42 with mant- nucleotides and the dependence of scaffold stimulation on the PB1 domain.
(A) Coomassie-stained SDS-PAGE of purified Cdc42, Cdc24 and Bem1. (B) Estimation of the Kd of mant-GDP for nucleotide-free Cdc42. (C) Estimation of the Kd of mant-GTP for nucleotide-free Cdc42. (D) Nucleotide exchange rates for Cdc24 in the presence (orange curve) or absence (black curve) of a bem1 △PB1 mutant or in the presence of the Bem1 PB1 domain (blue curve). Assay conditions as in Figure 1A were used. (E) Observed kinetic rate constants for the reactions shown in (D) were obtained by fitting trace data to a single exponential equation. Error bars show SD and confidence where **p≤0.01. (F) Densitometry analysis of the resolved phosphorylated forms of Cdc24 shown on the blots in Figure 1C.
-
Figure 1—figure supplement 1—source data 1
Excel file showing the observed rate constants for the GEF assays presented in Figure 1—figure supplement 1E.
- https://doi.org/10.7554/eLife.25257.005
Figure 2 with 1 supplement
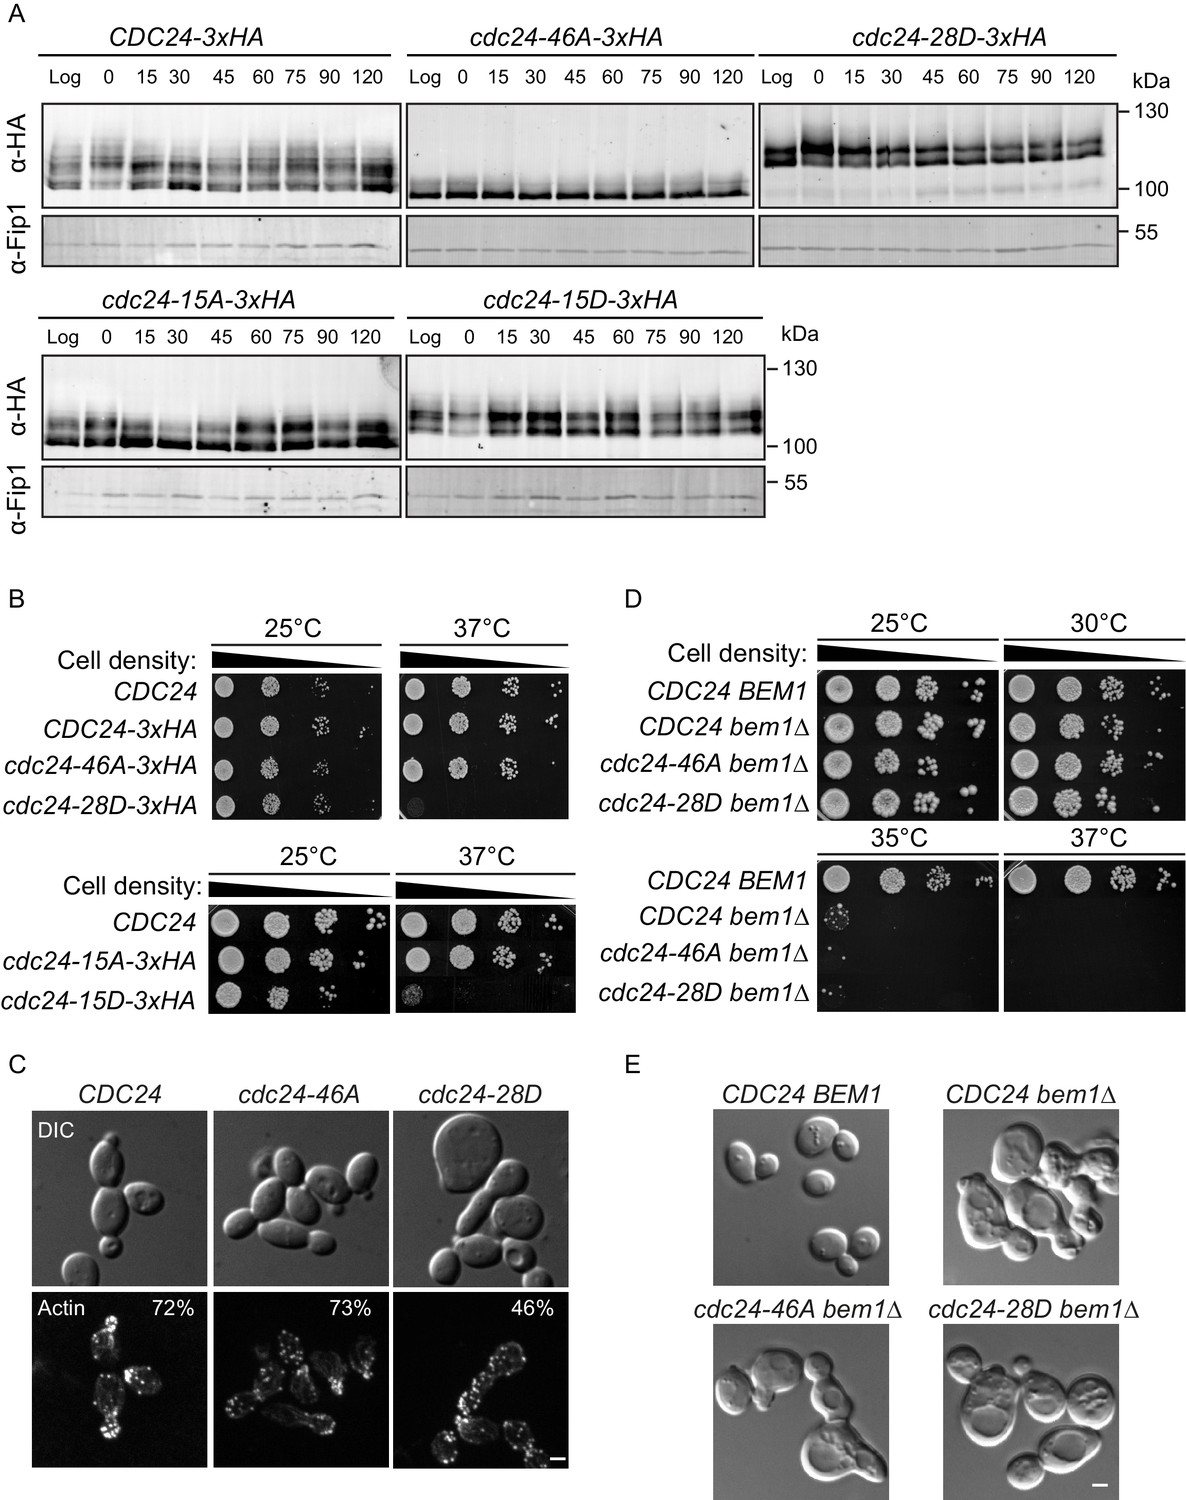
Phospho-regulation of Cdc24 is required for normal cellular polarity.
(A) Phosphorylation of Cdc24-3xHA, cdc24-46A-3xHA, cdc24-28D-3xHA, cdc24-15A-3xHA and cdc24-15D-3xHA during the cell cycle. Cells were synchronised in mating pheromone and samples were removed at the times shown (top) and analysed by SDS-PAGE and Western blotting using anti-HA antibody to detect Cdc24 and anti-Fip1 antibody as a loading control. (B) cdc24-28D and cdc24-15D cells display a temperature-sensitive growth defect at 37°C. Serial dilutions of the cells indicated were spotted onto YPD plates and grown at 25°C and 37°C for 2 days. (C) The cells indicated were grown to mid-logarithmic phase at 25°C then fixed and stained with Alexa 546-phalloidin to visualise F-actin. DIC images are shown in the top and F-actin on the bottom panels. The numbers indicate the percentage of cells displaying polarised F-actin where more than 150 cells were counted for each strain. Scale bar: 2 µm. (D) The phenotype of the cdc24 phosphorylation mutants is dependent on BEM1. Serial dilutions of the cells indicated were spotted onto YPD plates and grown at the temperatures indicated for 2 days. (E) DIC images showing the effect of deletion of BEM1 in the cdc24 phosphorylation mutants. Scale bar: 2 µm.
Figure 2—figure supplement 1
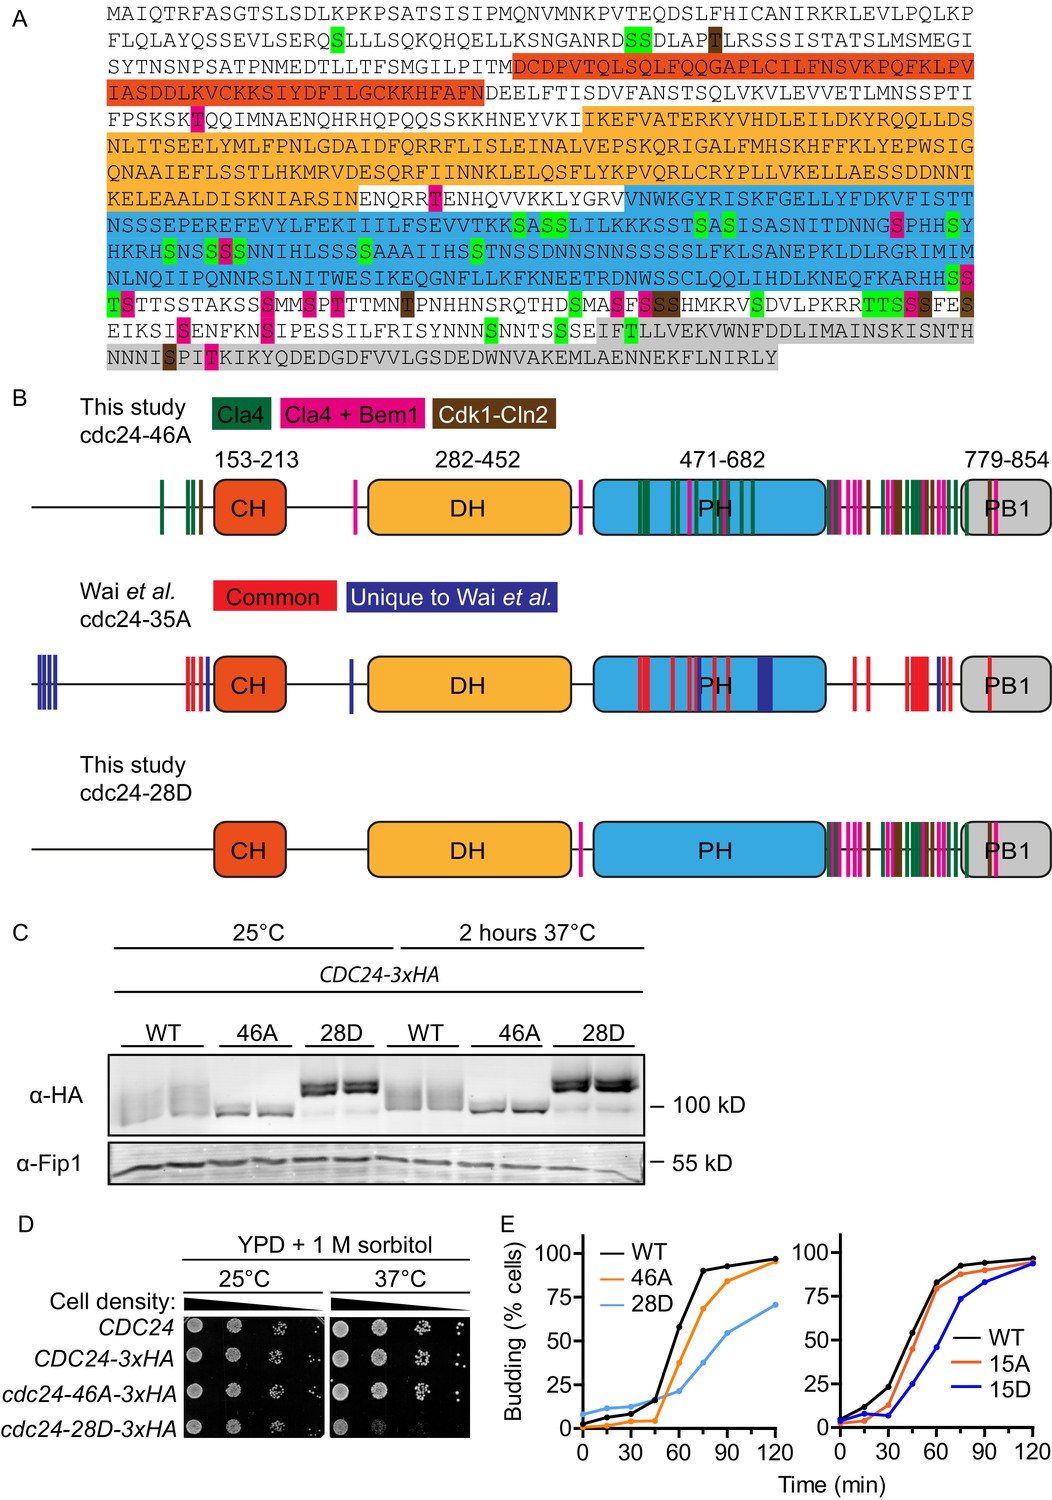
Mapped phosphosites on Cdc24 and mutant phenotypes.
(A) Amino acid sequence of Cdc24. The identified Cla4, Cla4 and Bem1 as well as Cdk1-Cln2 phosphosites are highlighted in green, pink and brown, respectively. PB1, PH, DH and CH domains are shown in grey, blue, yellow and orange, respectively. (B) Schematic representation of mutated phosphosites and domain organisation of cdc24-46A and cdc24-28D. The second schematic shows the phosphosites identified by Wai et al. The overlapping phosphosites identified by both studies are shown in red. Unique sites are shown in blue. (C). Indicated strains were grown at 25 or 37°C for 2 hr then Cdc24 was analysed by Western blot. Cdc24 phospho-mutant proteins were stable at 37°C in vivo. (D) The temperature-dependent growth defect of the cdc24-28D mutant cells at 37°C was partially suppressed by the addition of sorbitol to the growth media. Serial dilutions of the cells indicated were spotted onto YPD plates supplemented with 1 M sorbitol and grown at 25°C and 37°C for 2 days. (E) The indicated cells were arrested in a G1-like state with mating pheromone and released into the cell cycle synchronously. At the times shown, samples were fixed and the percentage of budded cells was plotted. At least 200 cells were counted for each strain and the experiment was conducted at 25°C.
-
Figure 2—figure supplement 1—source data 1
Excel file showing the percentage cells of the indicated genotype displaying buds.
This is the source data for Figure 2—figure supplement 1E.
- https://doi.org/10.7554/eLife.25257.008
Figure 3 with 1 supplement
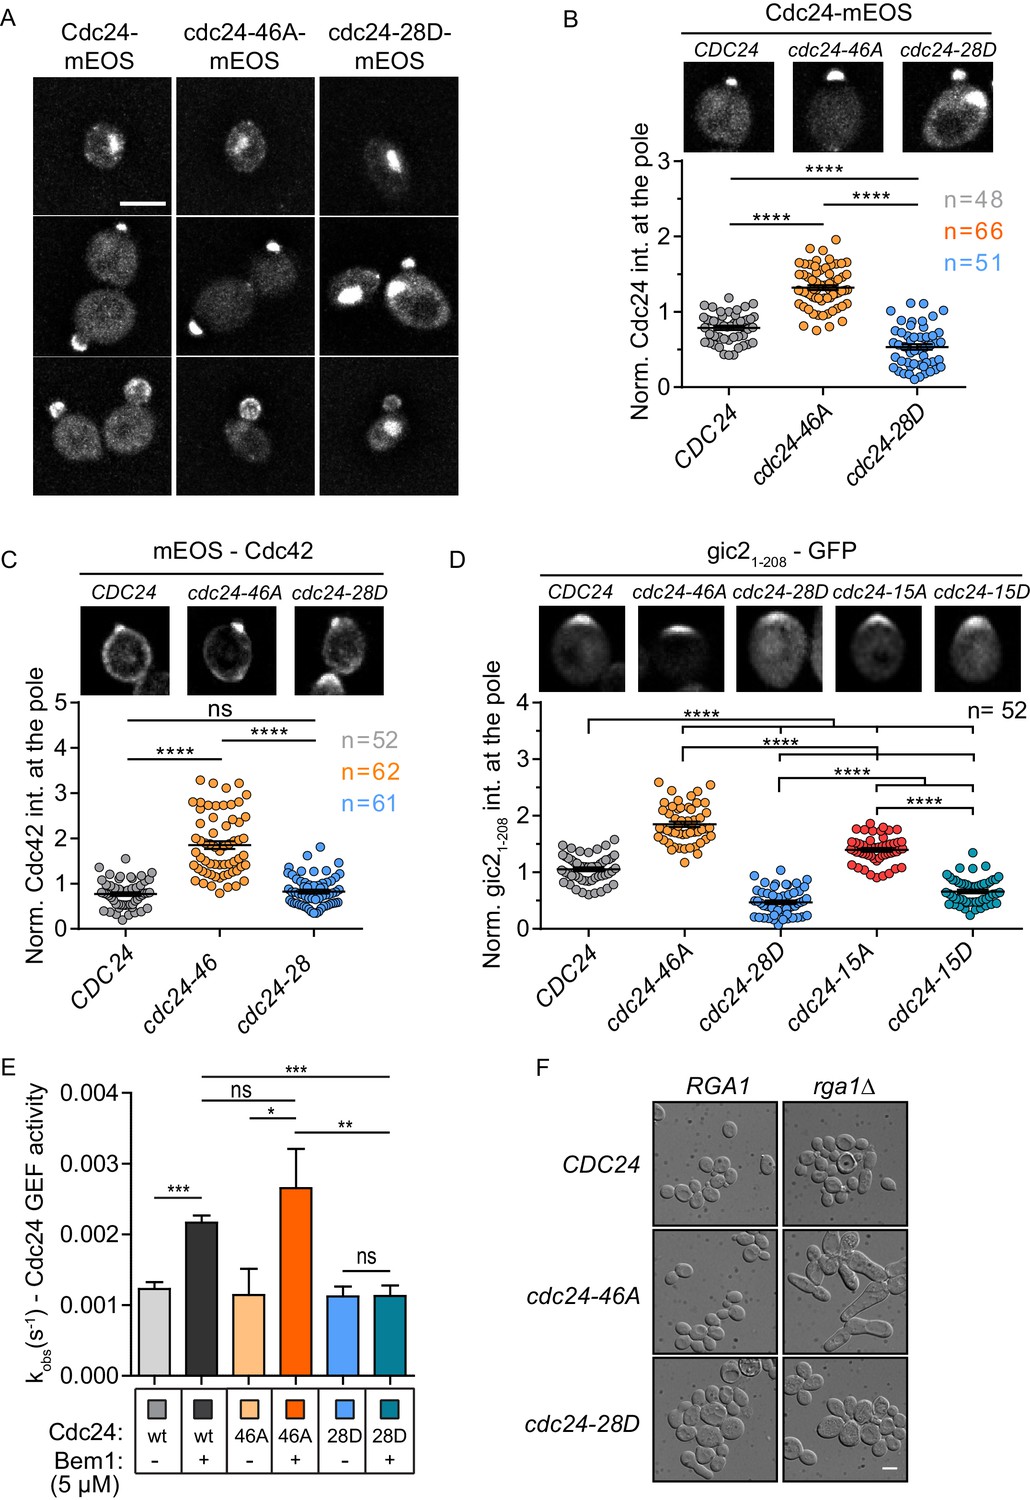
Phospho-regulation of Cdc24 is required for normal GEF localisation at the cell pole in vivo and Bem1-stimulated GEF activity in vitro.
(A) Maximum projection images of deconvolved z-stacks. Scale bar: 5 µm. (B) The average fluorescence intensity signal of Cdc24 at the cell pole was plotted for 48–66 cells of the indicated strains. Error bars show SD and confidence where ****p≤0.0001. (C) Maximum projection images of deconvolved z-stacks showing mEOS-Cdc42 fluorescence and quantification of the average fluorescence intensity. The significance of error bars is the same as in (B). (D) Maximum projection images of deconvolved z-stacks showing gic21-208-yEGFP fluorescence and quantification of the average fluorescence intensity. The significance of error bars is the same as in (B) and (C). (E) Observed kinetic rate constants of Cdc24 GEF activity for cdc24-46A and cdc24-28D +/− Bem1. Note how Bem1 stimulates the rate of cdc24-46A GEF activity, but not that of cdc24-28D. Error bars show SD and confidence where *p<0.05 and **p≤0.01. (F) DIC images showing the effects of RGA1 deletion on the indicated strains. Scale bar: 5 µm.
-
Figure 3—source data 1
Excel file showing the source data for Figure 3, including the normalised Cdc24-mEos intensity, the normalised mEos-Cdc42 intensity, the normalised gic2 (1-208)-yEGFP intensity and the observed rate constants for Cdc24 GEF activity.
- https://doi.org/10.7554/eLife.25257.010
Figure 3—figure supplement 1
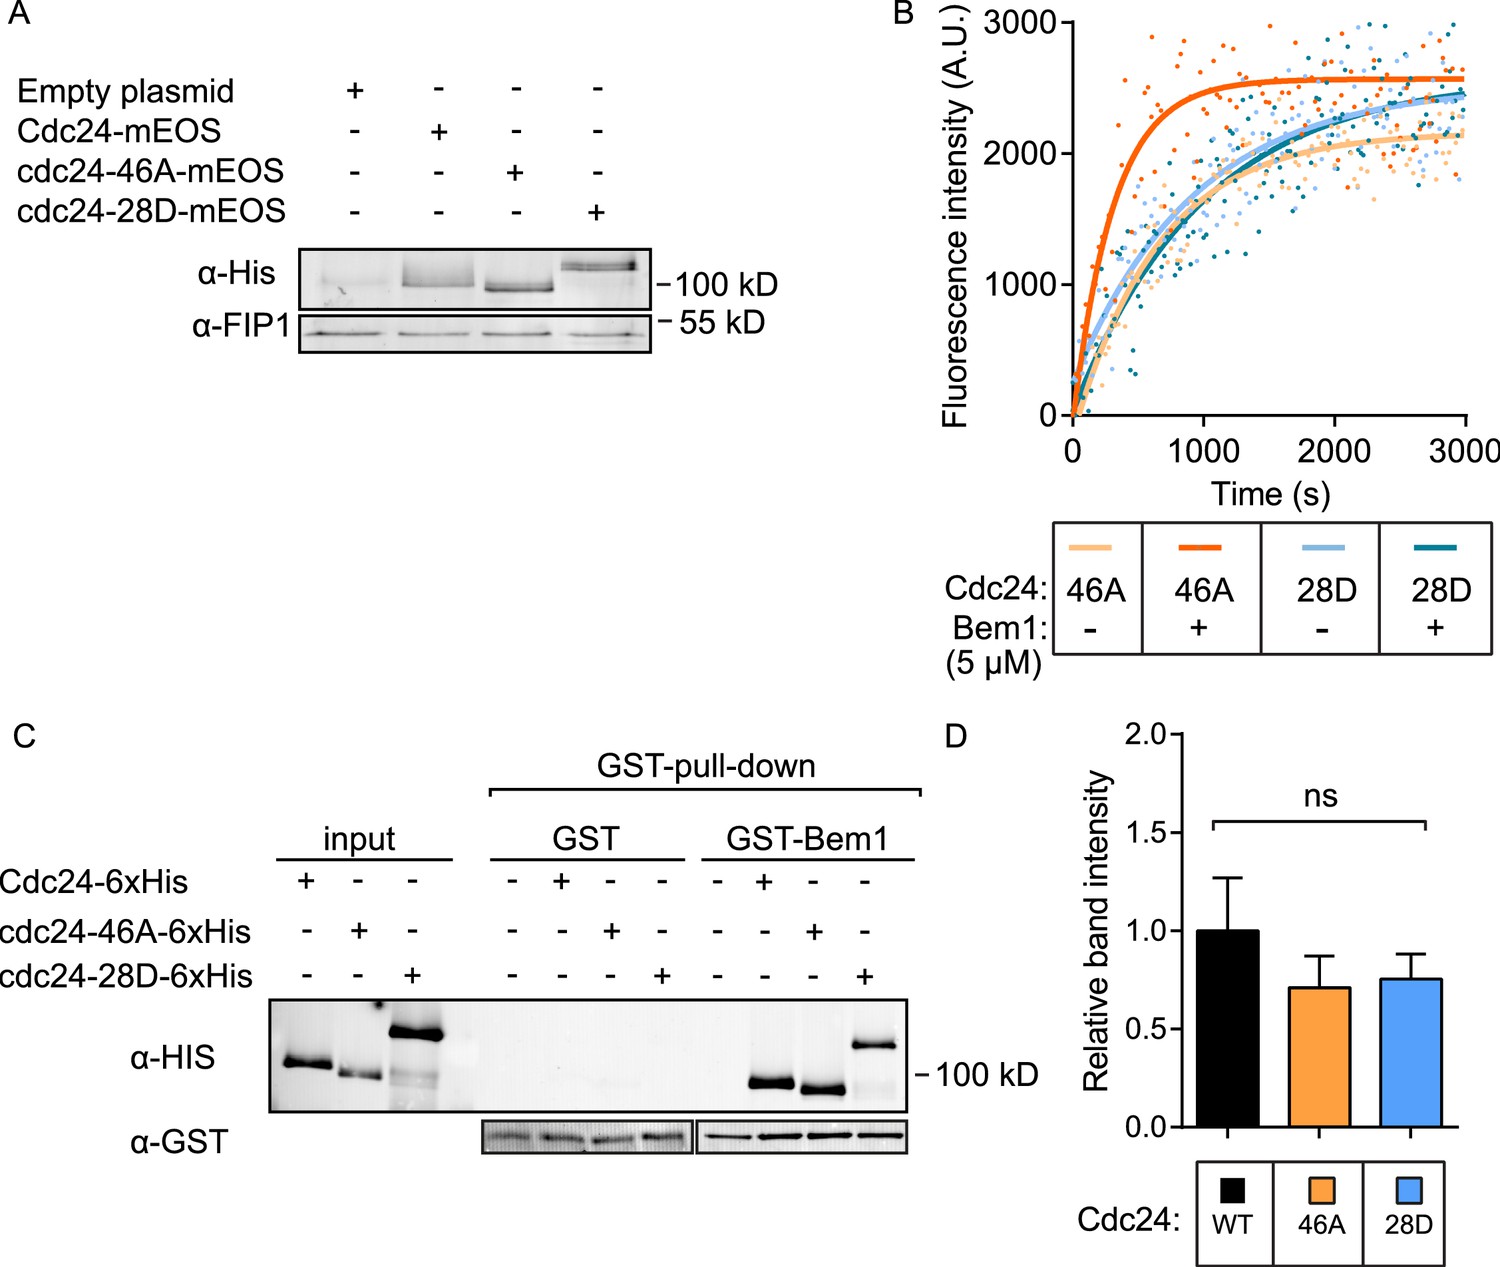
Expression of Cdc24-mEOS in vivo and the activity of cdc24 phospho-mutants in vitro.
(A) A Western blot showing the levels of expression of the Cdc24-mEOS constructs. The constructs contain a His tag that was used for detection. (B) Representative in vitro GEF reactions of indicated cdc24 phospho-mutant proteins in the presence and absence of Bem1. (C and D) Quantification of pull-down experiments to assess the interaction between GST-Bem1 and the Cdc24 phospho-mutant proteins.
-
Figure 3—figure supplement 1—source data 1
Excel file showing the band intensity of the data presented in Figure 3—figure supplement 1D.
- https://doi.org/10.7554/eLife.25257.012
Figure 4
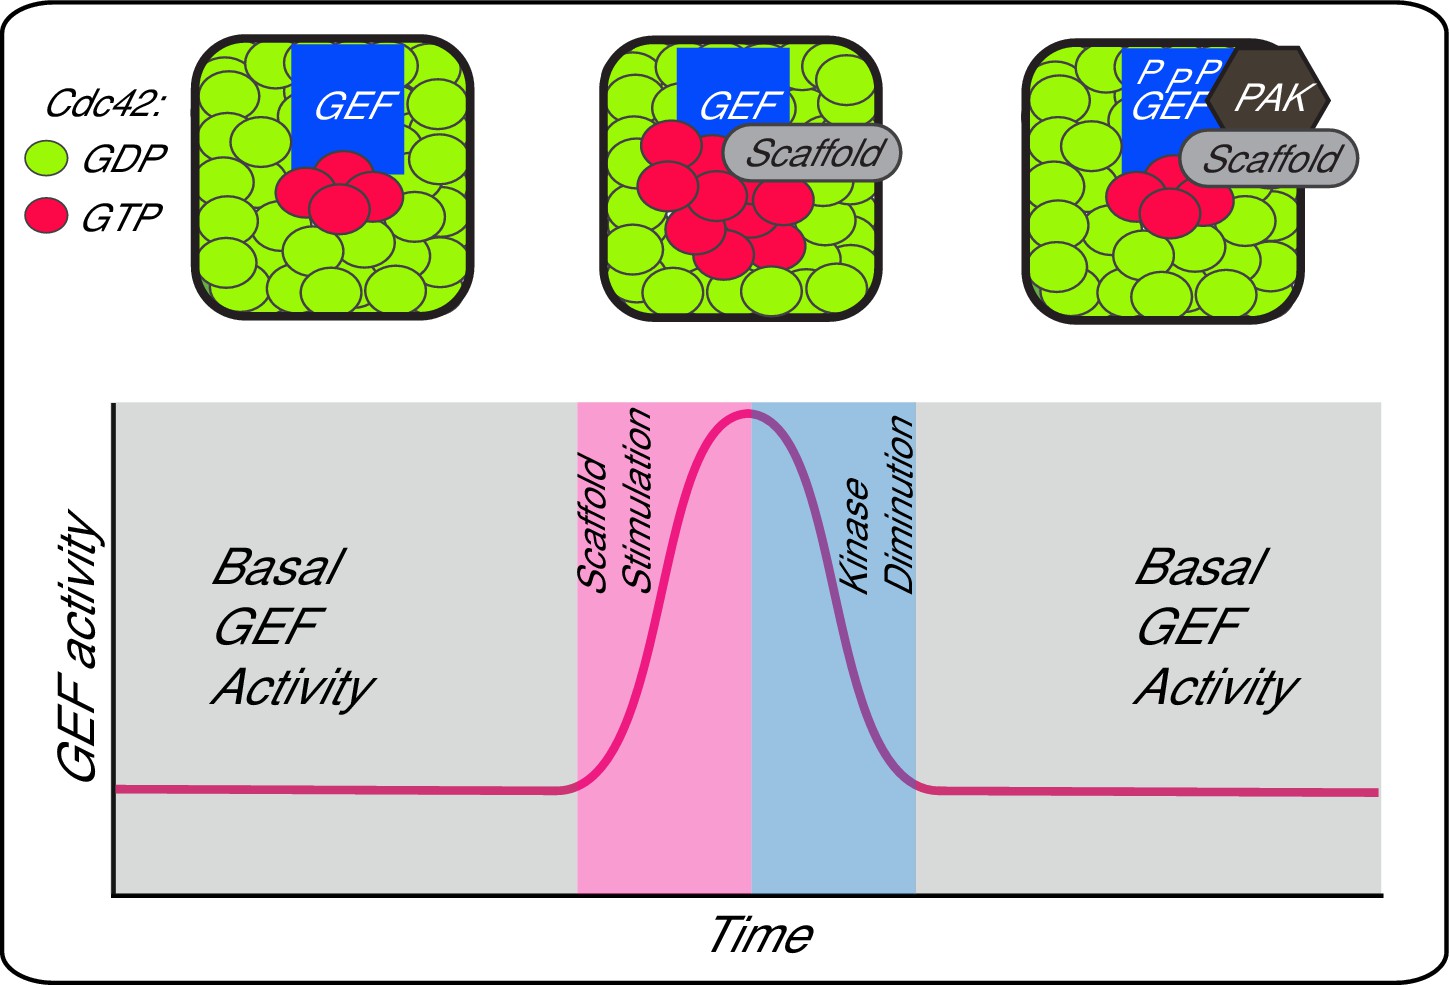
A working model depicting scaffold-mediated gating of Cdc42 signalling flux.
https://doi.org/10.7554/eLife.25257.013Additional files
-
Supplementary file 1
Yeast strains used in this study.
- https://doi.org/10.7554/eLife.25257.014
Download links
A two-part list of links to download the article, or parts of the article, in various formats.
Downloads (link to download the article as PDF)
Open citations (links to open the citations from this article in various online reference manager services)
Cite this article (links to download the citations from this article in formats compatible with various reference manager tools)
Scaffold-mediated gating of Cdc42 signalling flux
eLife 6:e25257.
https://doi.org/10.7554/eLife.25257


