Mechanosensory neurons control the timing of spinal microcircuit selection during locomotion
- Sorbonne Universités, UPMC Univ Paris 06, Inserm, CNRS, Institut du Cerveau et la Moelle épinière, Hôpital Pitié-Salpêtrière, France
- Hôpital Pitié-Salpêtrière, France
Figures
Figure 1

Amplitude of bioluminescence signals in spinal motor neurons correlates with the type of locomotor maneuver during active swimming.
(A) Bioluminescence signals emitted from spinal motor neurons in Tg(mnx1:gal4;UAS:GFP-aequorin-opt) zebrafish larvae at 4 dpf were recorded using a photomultiplier tube under infrared illumination during active behaviors elicited by an acoustic stimulus. (B) Live fluorescent image (upper panel) and immunohistochemistry for GFP (lower panel) in a 4 dpf Tg(mnx1:gal4;UAS:GFP-aequorin-opt) zebrafish larva showing selective expression in spinal motor neurons (arrowhead: dorsal primary, arrow: ventral secondary motor neurons), and strictly no expression in muscle fibers (n = 5). (C) Motor behaviors elicited by acoustic stimuli. Superimposed traces illustrate the amplitude of tail contractions over time, for each behavior. Traces are color-coded according to the delay from stimulus onset. Automated categorization classified maneuvers into escapes (n = 245/283) or swims (n = 21/283) (n = 10 larvae and 300 trials). (D) Example traces of typical bioluminescence signals and kinematic parameters observed for each category. (E) Mean bioluminescence amplitude was higher for escapes (28.4 ± 0.9 photons/10 ms; normalized amplitude per larva = 0.41 + /- 0.18) than swims (3.9 ± 1.4 photons/10 ms, p<0.001; normalized amplitude = 0.06 + /- 0.02, p<0.001). (F) Correlation between bioluminescence signal amplitude and maximum tail angle amplitude (R = 0.4, p<0.001).
Figure 2
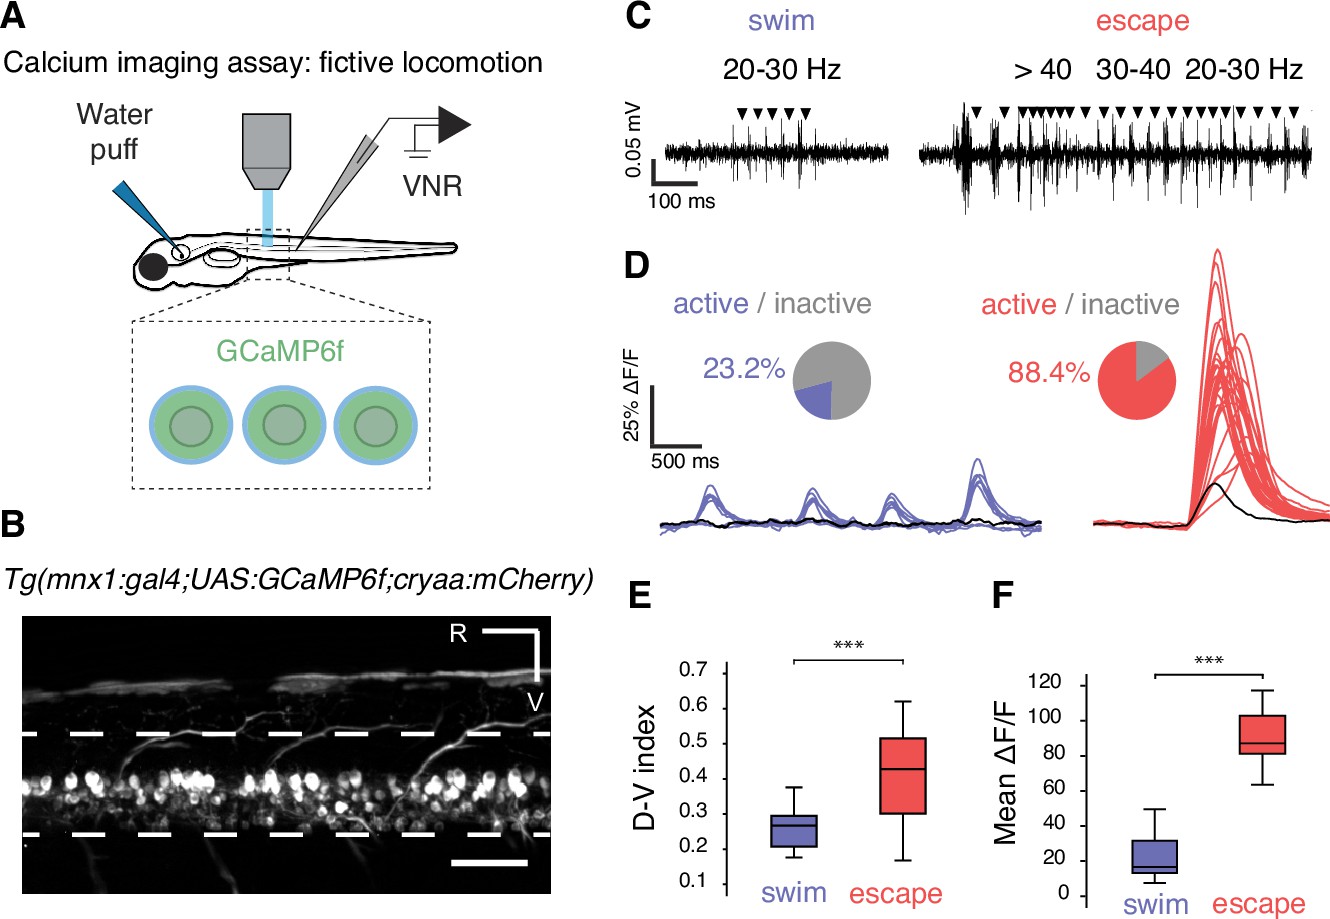
Calcium imaging in paralyzed larvae confirms a larger recruitment of spinal motor neurons for fast escapes than for slow swimming.
(A) Calcium transients emitted from spinal motor neurons in Tg(mnx1:gal4;UAS:GCaMP6f,cryaa:mCherry) zebrafish larvae at 4 dpf were recorded simultaneously with ventral nerve root recordings (VNR) during fictive behaviors elicited by a water puff to the otic vesicle. (B) Expression pattern in a Tg(mnx1:gal4;UAS:GCaMP6f,cryaa:mCherry) larva at 4 dpf (R is rostral, V is ventral; scale bar is 50 µm). (C) VNR for each fictive behavior illustrates typical spontaneous fictive slow swims and induced fictive escapes: burst frequencies ranged between 20–30 Hz for slow swims (left panel) and 20–80 Hz for escapes (right panel). (D) GCaMP6f signals from individual motor neurons during spontaneous slow swimming (4 swims, left panel) and during an evoked escape response (right panel). For each recording, out-of-focus light was estimated within the spinal cord (black trace) and used as a criterion to determine the active vs inactive status of each cell. Pie charts represent the proportion of active cells in each behavior: 16/69 cells across 27 swims versus 61/69 cells across 12 escapes (n = 3 larvae). (E) Dorso-ventral (D–V) position of cells recruited during each maneuver shows dorsal motor neurons only active during escapes (the dorso-ventral axis within the spinal cord is normalized to 0 at the ventral limit and 1 the dorsal limit; mean D-V position for escapes = 0.41 + /- 0.02 versus 0.25 ± 0.01, p<0.001, n = 78 cells in n = 3 larvae). (F) Mean ΔF/F amplitude was higher during escapes compared to spontaneous swims across larvae (91.2 ± 4.7% versus 25.9 ± 3.8%, p<0.001, 12 escapes and 27 swims in n = 3 larvae).
Figure 3
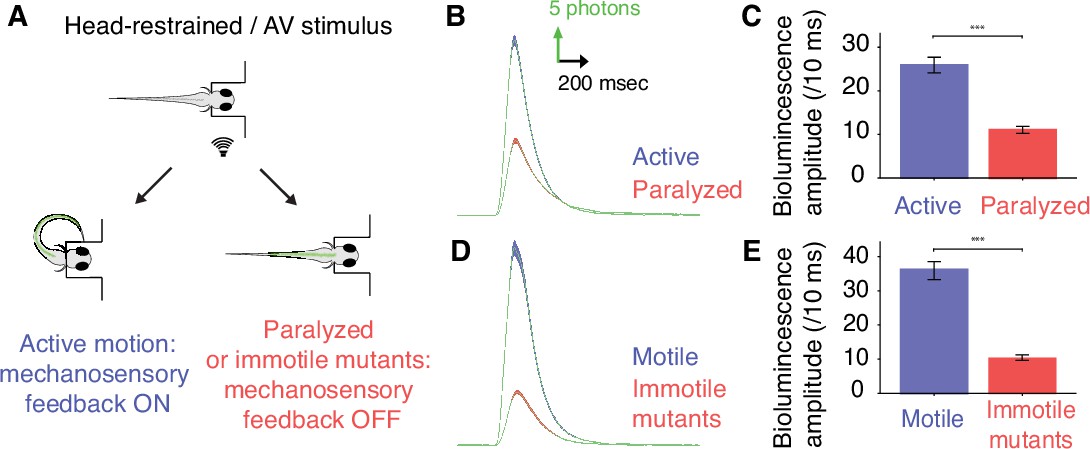
Mechanosensory feedback enhances the recruitment of spinal motor neurons during active locomotion.
(A) To compare the recruitment of spinal motor neurons when mechanosensory feedback was present (‘active locomotion’) or suppressed (‘fictive locomotion’), we conducted bioluminescence assays in 4 dpf Tg(mnx1:gal4;UAS:GFP-aequorin-opt) zebrafish larvae before and after paralysis using pancuronium bromide, and in immotile 4 dpf Tg(mnx1:gal4;UAS:GFP-aequorin-opt;cacnb1ts25/ts25) mutants compared to their motile siblings. (B) Bioluminescence signals from motor neurons revealed a marked decrease in bioluminescence amplitude after paralysis. (C) Quantification of the change in mean bioluminescence amplitude (before paralysis: 26.6 ± 0.9 photons/10 ms; after paralysis: 11.1 ± 0.4 photons/10 ms, n = 10 larvae in each group, 30 trials per larva, p<0.001). (D) Similarly, averaged bioluminescence signals from motor neurons were markedly decreased in immotile Tg(mnx1:gal4;UAS:GFP-aequorin-opt;cacnb1ts25/ts25,) mutant larvae when compared with motile siblings. (E) Mean bioluminescence amplitude in motile siblings (37.6 ± 1.4 photons/10 ms) compared to immotile mutants (9.8 ± 0.4 photons/10 ms, n = 300 trials in 10 larvae for each group, p<0.001).
Figure 4 with 1 supplement
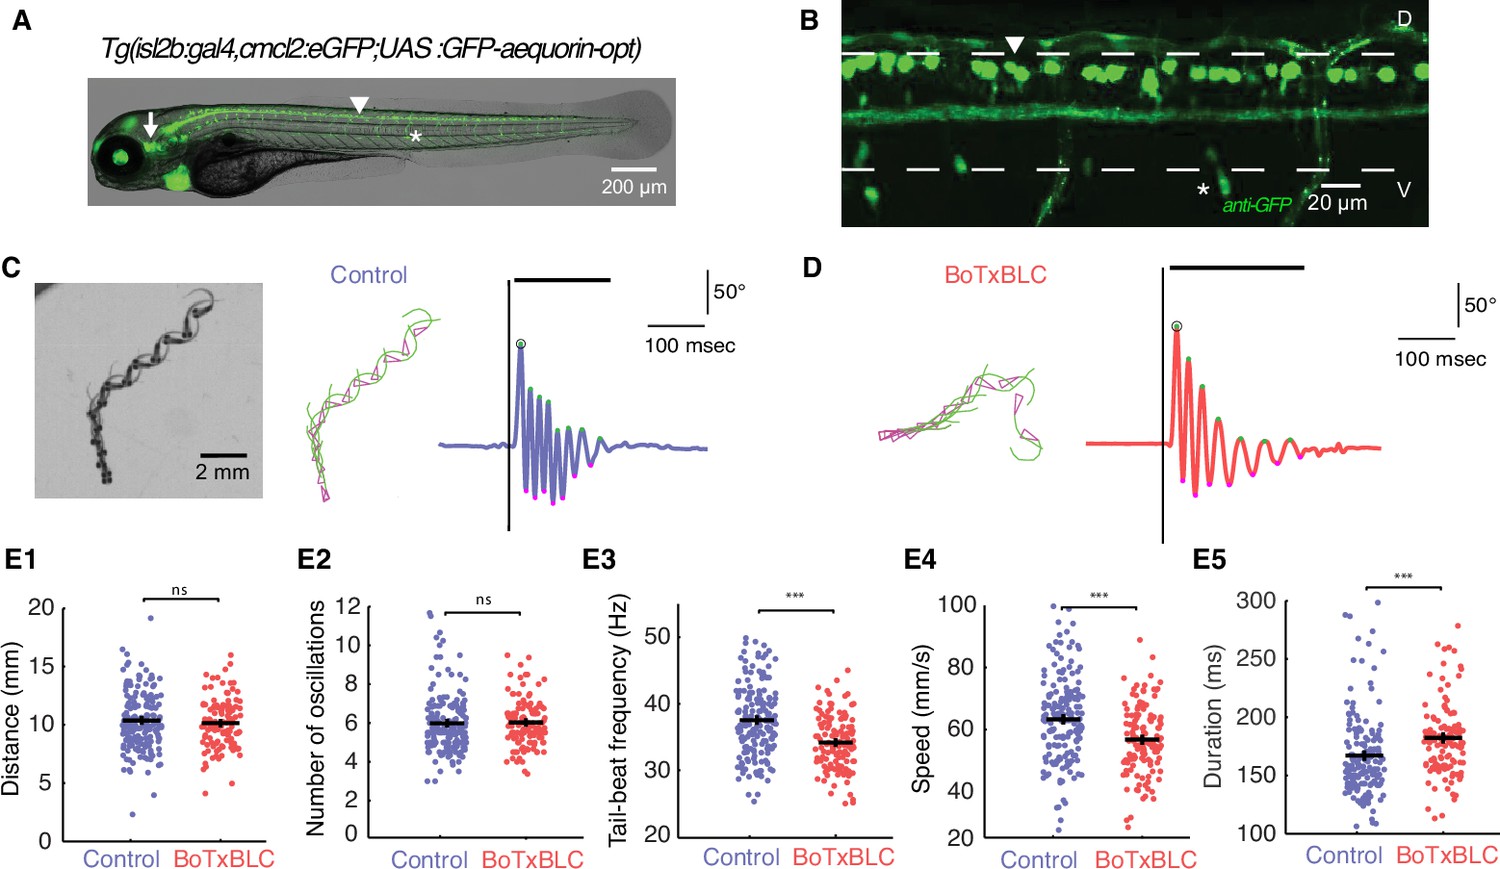
Silencing mechanosensory neurons decreases speed of locomotion.
(A) In vivo fluorescence image and (B) immunohistochemistry for GFP in 4 dpf Tg(isl2b:gal4,cmlc2:eGFP;UAS:GFP-aequorin-opt) double transgenic zebrafish larva show selective expression of GFP-aequorin in mechanosensory neurons: trigeminal ganglia (arrow), Rohon-Beard spinal neurons and their ascending axons (arrowhead) and dorsal root ganglia (*), but no expression in muscle fibers (n = 4). (C–D) Superimposed images from the raw high-speed camera recording (left), the corresponding automated tracking (middle, pink triangles represent the head and green lines the tail of the fish) and tail angle over time extracted from the tracking analysis (right; stimulus is represented by the black vertical line, duration of the event is the black horizontal line) of a typical escape elicited by an acoustic stimulus in a freely-swimming control sibling larva at 6 dpf (C), and in a Tg(isl2b:gal4,cmlc2:eGFP;UAS:BoTxBLC-GFP) larva (D). (E1) Distance travelled was unchanged in BoTxBLC+ and control larvae (10.2 ± 0.2 mm versus 10.6 ± 0.2 mm, p=0.1). (E2) Number of oscillations was unchanged in BoTxBLC+ and control larvae (6.0 ± 0.2 versus n = 6.1 + /- 0.2 oscillations, p=0.6). (E3) BoTxBLC+ larvae showed a decreased tail-beat frequency (TBF, 34.2 ± 0.4 Hz versus 37.8 ± 0.3 Hz, p<0.001). (E4) BoTxBLC+ larvae showed a decreased speed of escape responses (56.9 ± 1.1 versus 64.1 ± 0.9 mm/s, p<0.001). (E5) Escape duration was increased in BoTxBLC+ larvae compared to control siblings (182.0 ± 3.0 ms versus 168.1 ± 2.4 ms, p<0.001). (For all parameters: control group: n = 176 larvae from 8 clutches, n = 561 escapes; BoTxBLC+ group: n = 128 larvae from 8 clutches, n = 329 escapes).
Figure 4—figure supplement 1
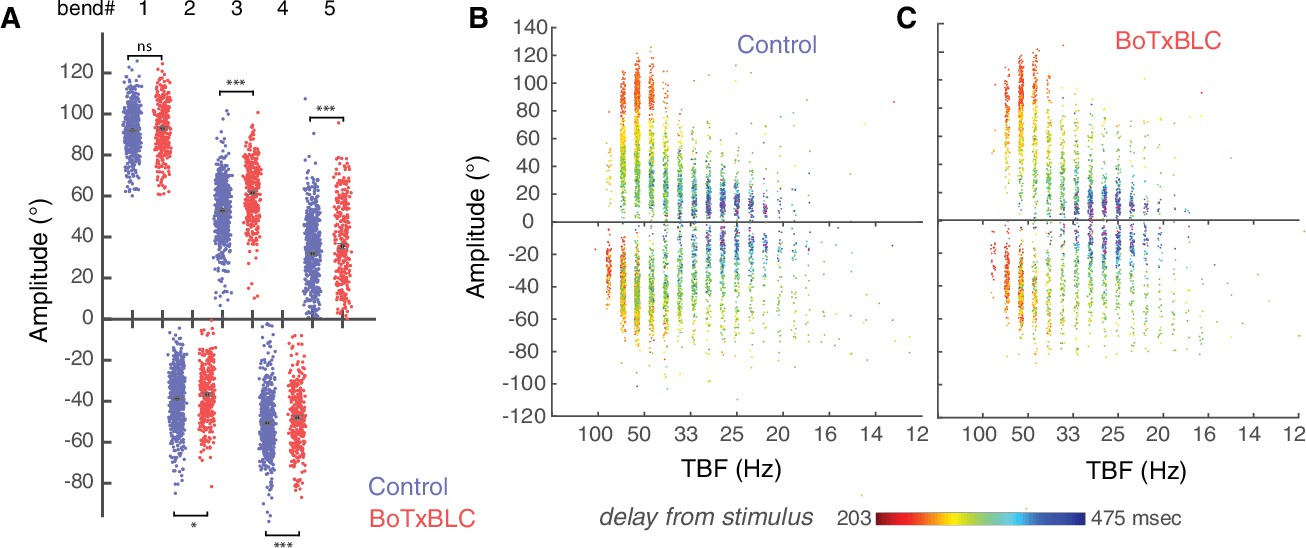
Silencing mechanosensory neurons alters bends amplitude only after the initial C-bend of the escape response.
(A) Amplitude of the initial C-bend was not affected, but the bend amplitudes were overall larger in BoTxBLC-GFP+ larvae on the side of the initial C-bend (24 versus 22°, p=0.001, control group: n = 176 larvae from 8 clutches, n = 561 escapes; BoTxBLC+ group: n = 128 larvae from 8 clutches, n = 329 escapes). Over the duration of the escape response, the amplitude of the tail angle decreases concomitantly with tail-beat frequency, both in the control group (B) and the BotxBLC-GFP+ group (C).
Figure 5
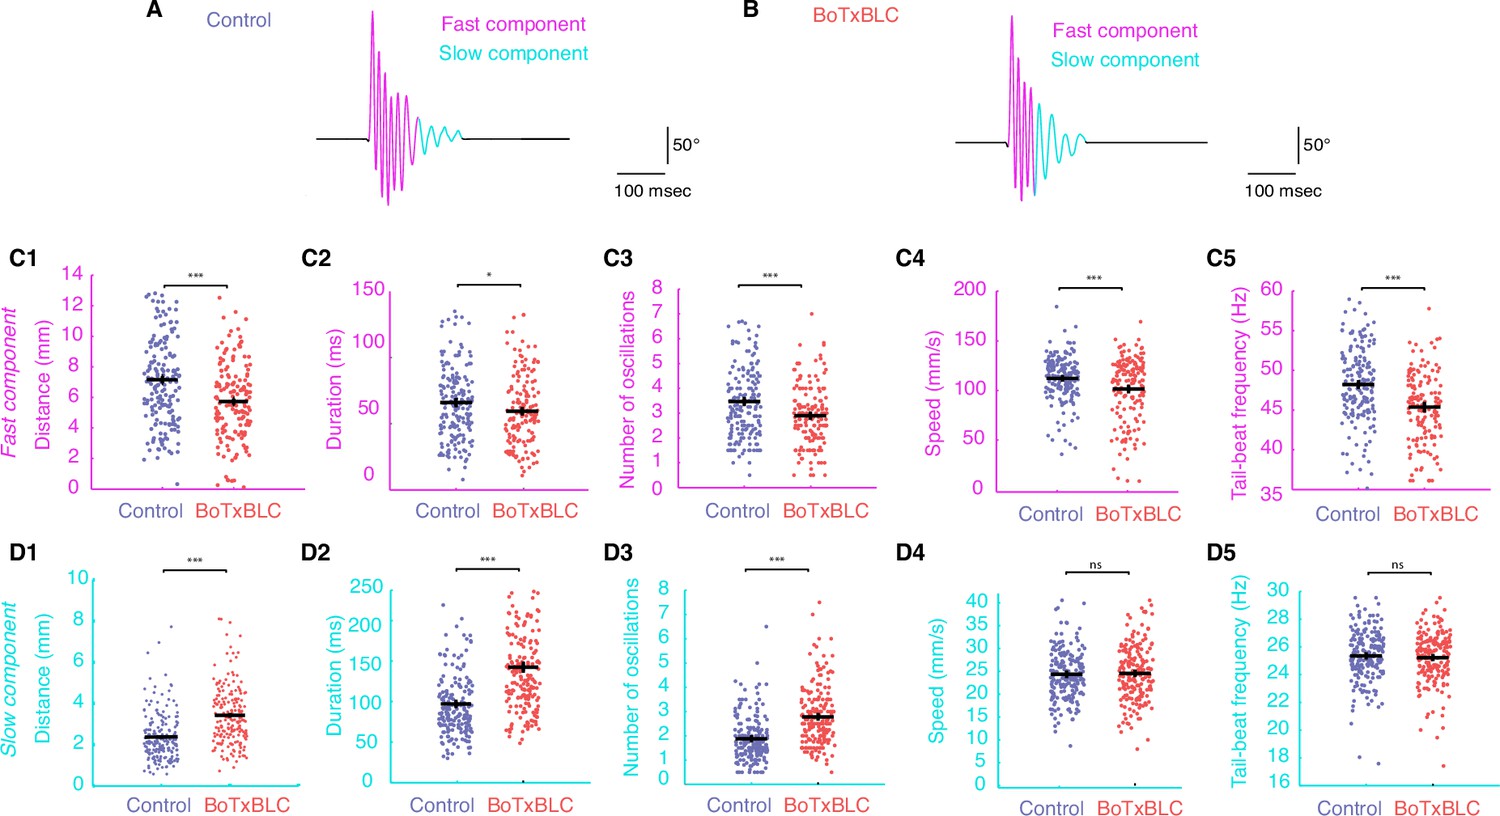
Silencing mechanosensory neurons accelerates the transition between fast and slow locomotion during acoustic escape responses.
(A–B) We separately analyzed the fast component of the escape response (cycles with TBF >30 Hz) and the slow component (cycles with TBF ≤30 Hz) as shown for control (n = 176 larvae from 8 clutches, n = 561 escapes) and BoTxBLC+ larvae (n = 128 larvae from 8 clutches, n = 329 escapes). (C1–C5) Within the fast regime of the escape, silencing mechanosensory feedback reduces the distance travelled in BoTxBLC+ larvae compared to control siblings (C1, 5.9 ± 0.2 versus 7.4 ± 0.2 mm, p<0.001), duration (C2, 60.0 ± 2.1 versus 67.8 ± 1.9 ms, p=0.005), number of oscillations (C3, 2.9 ± 0.1 versus 3.6 ± 0.1 oscillations, p<0.001), speed (C4, 104.3 ± 1.9 versus 112.6 ± 1.6 mm/s, p=0.001), and TBF (C5, 45.8 ± 0.4 versus 48.4 ± 0.3 Hz, p<0.001). (D1–D5) Within the slow component of the escape, silencing mechanosensory feedback in BoTxBLC+ larvae increases the distance travelled (D1, 3.5 ± 0.1 versus 2.4 ± 0.1 mm, p<0.001), duration (D2, 140.9 ± 3.4 versus 97.1 ± 3.2 ms, p<0.001, p<0.001) and number of oscillations (D3, 2.8 ± 0.1 versus 1.9 ± 0.1, p<0.001) but has no effect on speed (D4, 24.9 ± 0.4 versus 24.6 ± 0.4 mm/s, p=0.5) and tail-beat frequency (D5, 25.3 ± 0.1 versus 25.4 ± 0.1 Hz, p=0.5). For all parameters: n = 304 larvae, number of fast components = 1013; number of slow components = 1265.
Figure 6
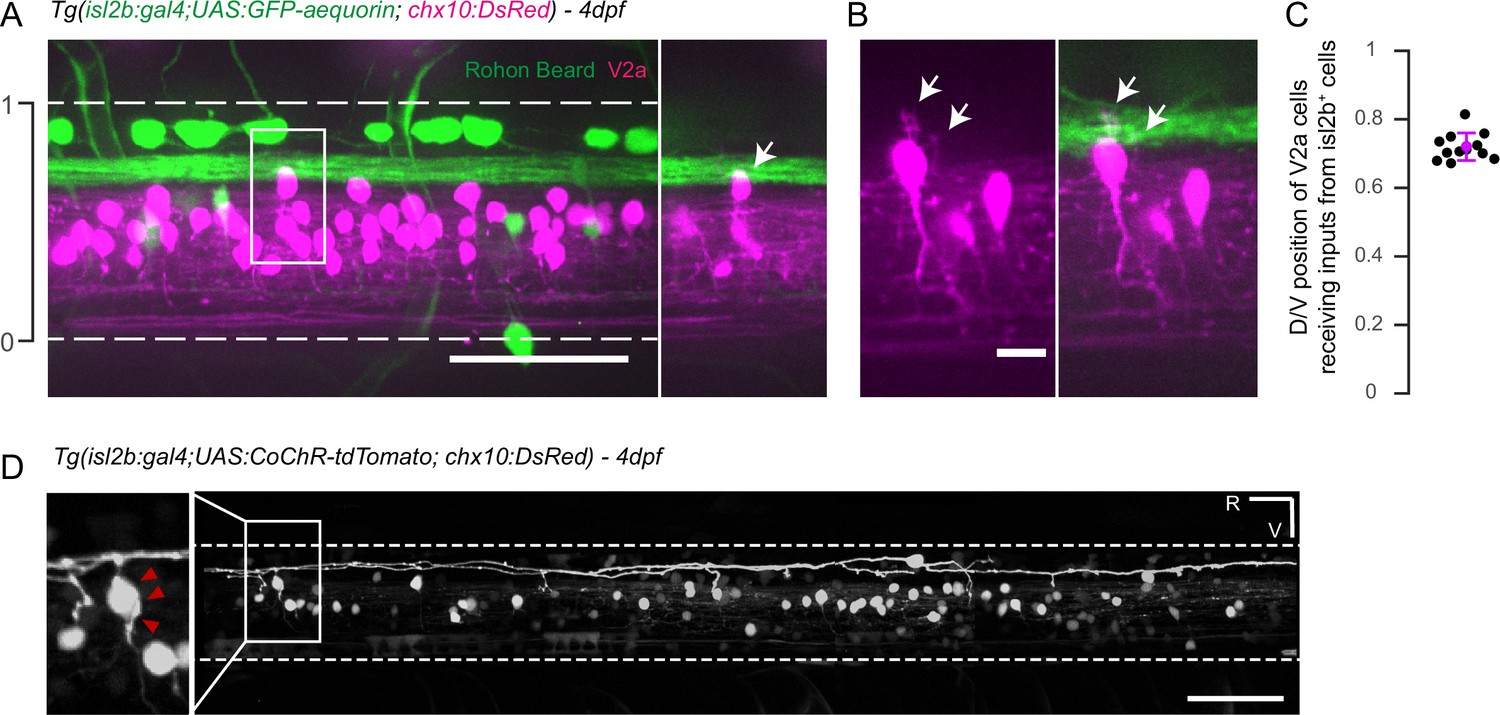
Axons of isl2b+ Rohon-Beard project onto dorsalmost chx10+ V2a interneurons in the spinal cord.
(A) Z-projection stack of the spinal cord imaged from the lateral side in a 4 dpf Tg(isl2b:gal4,cmcl2:eGFP;UAS:GFP-aequorin;chx10:DsRed) triple transgenic larva. White dashed lines delineate ventral and dorsal limits of the spinal cord; these limits define the dorso-ventral (D/V) axis from 0 to 1. The axon bundle from isl2b+ Dorsal Root Ganglia (DRG) and Rohon-Beard (RB) neurons contact the soma of dorsal chx10+ V2a interneurons. The white square is enlarged in the right panel to stress the anatomical connections (arrow). (B) Dendrites of dorsal V2a interneurons are targeted by axonal processes from isl2b+ sensory neurons (arrows). (C) D/V positions of V2a neurons receiving putative inputs from isl2b+ cells (mean D/V position = 0.72 ± 0.04. N = 12 cells in n = 4 larvae). (D) Profile of expression of 4 dpf Tg(isl2b:gal4,cmcl2:eGFP;chx10:DsRed) injected with the Tg(UAS:CoChR-tdTomato) construct reveals projections from single Rohon Beard cells onto chx10+ dorsal V2a interneurons. Scale bars in (A) and (D) are 50 µm and is 10 µm in (B). For each panel rostral side (R) is on the left and ventral side (V) is at the bottom.
Figure 7
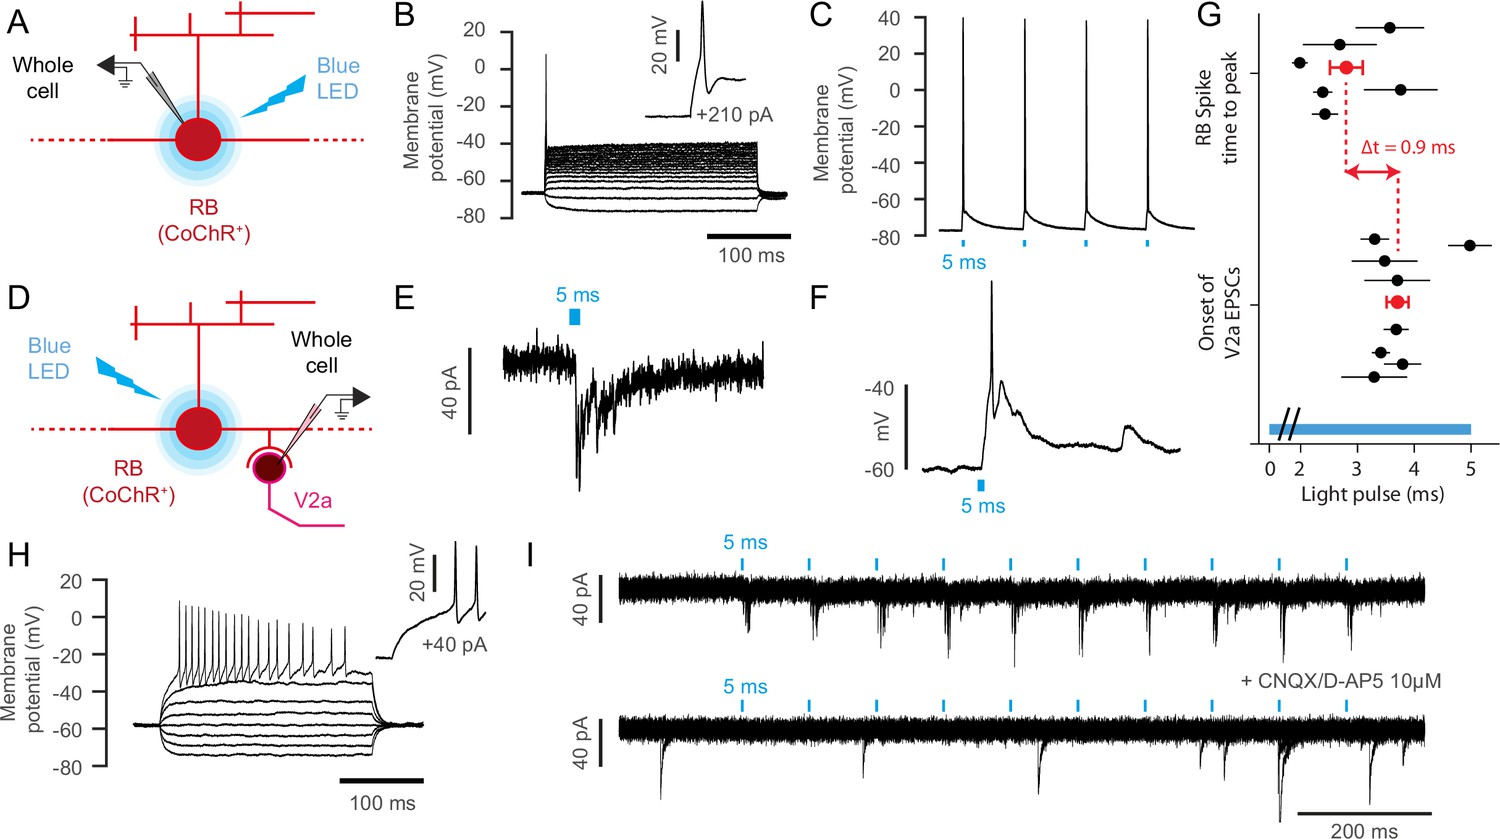
Rohon-Beard neurons selectively synapse onto ipsilateral dorsalmost V2a interneurons.
(A) Schematic of the optogenetic calibration of CoChR-mediated stimulation in RB neurons. (B) Current-injection steps recording reveals the low-input resistance nature of Rohon Beard neurons, n = 7 cells). (C) 5 ms blue light pulse stimulations reliably elicit single action potentials in CoChR-expressing RB cells (n = 3 cells). (D) Schematic of whole cell recording of V2a interneurons with optogenetic stimulation of RB neurons. (E) Voltage clamp recording of a target V2a interneuron receiving monosynaptic inputs from a RB neuron. (F) Current clamp recording of a target V2a interneuron firing an action potential following the stimulation of a RB neuron. (G) Timing of RB spike time-to-peak (2.8 ms ±0.3 ms after the onset of the blue light pulse, n = 103 stimulations recorded in 6 cells) and onset of EPSCs in target V2a interneurons (3.7 ms ±0.2 ms after the onset of the blue light pulse, n = 78 EPSCs in 8 cells). The average lag between RB spiking and V2a EPSC is 0.9 ms. The blue bar represents the duration of the blue light pulse. (H) Membrane properties of recorded V2a interneurons in the dorsal cord, n = 5 cells). (I) Blockade of glutamatergic neurotransmission following the application of 10 µM of CNQX and D-AP5 suppresses elicited post-synaptic currents in a V2a interneuron (n = 2 cells).
Author response image 1

Responses to RB neurons to electrical and optogenetic stimulations consists in single spikes (n = 5).
RB neurons respond to a long current step by a single action potential (top row). RB neurons in Tg(isl2b:gal4) expressing the construct UAS:CoChR-tdTomato respond to 5ms light pulses by single action potentials (bottom row).
Author response image 2
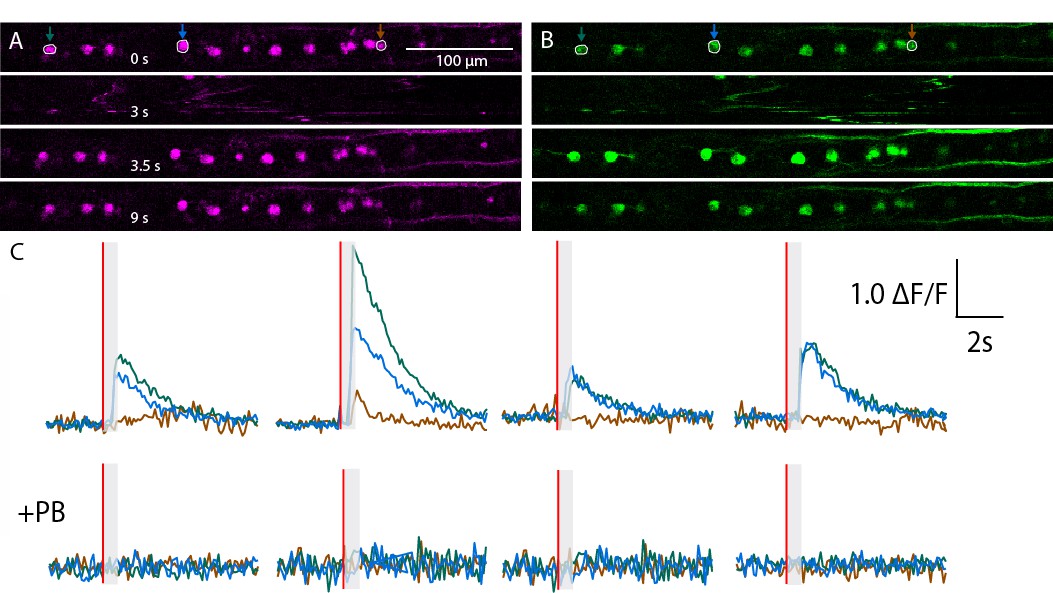
Calcium transients recorded in RB neurons from a non representative zebrafish larva in Tg(isl2b:gal4;cry:GFP,UAS: mRFP; UAS:GCaMP5G) triple transgenic animals.
(A,B) Expression of mRFP (A) and GCaMP5G (B) is restricted to RB neurons in this field of view. Successive snapshots show signals before the stimulus (0s), during tail motion (3 s), immediately after the motion artifact when the cells are back in the plane (3.5 s) and long after tail motion (9 s). (C) Calcium transients estimated as relative △F/F = △F (green) – △F (red) is depicted for four trials before (top) and after (bottom) application of the paralytic agent Pancuronium Bromide (PB) in the bath.
Author response image 3
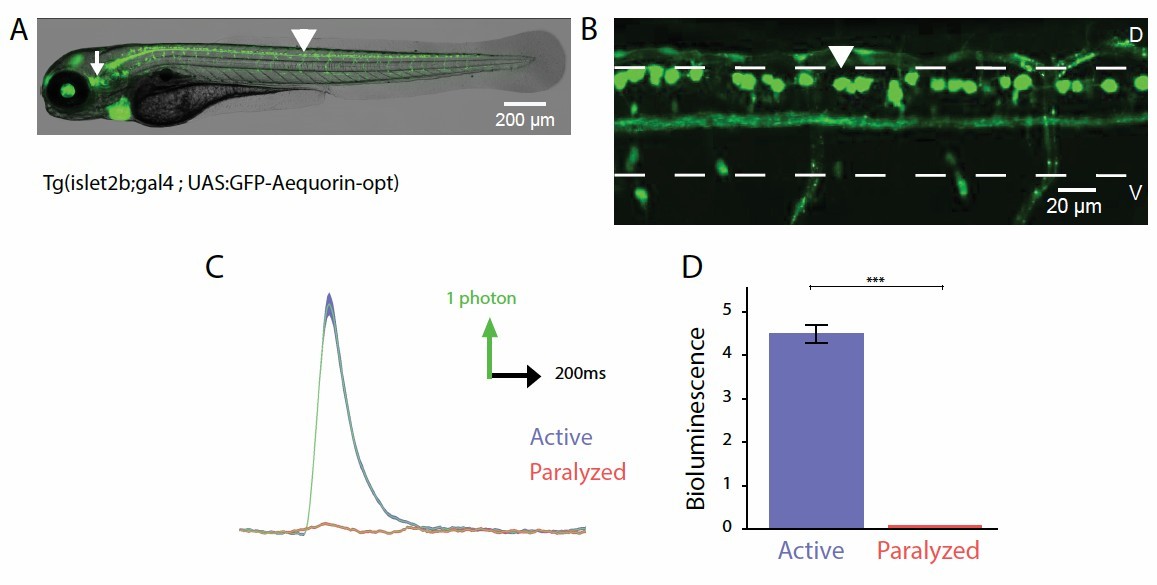
Probing the recruitment of Rohon-Beard neurons expressing GFP-Aequorin during movement.
(A, B) Lateral view showing the expression of GFP-Aequorin in 4 dpf Tg(isl2b:gal4;UAS:GFP- Aequorin-opt) larvae throughout the animal (A) and in the spinal cord (B). The arrowhead points to one Rohon-Beard cell in the dorsal spinal cord. The white dashed lines delineate the ventral and dorsal limits of the spinal cord. As previously stated for Tg(mnx1:gal4; UAS:GFP-Aequorin-opt) larvae, we verified on 5 animals that expression never targeted muscle fibers in these double transgenic animals. Ventral is bottom, rostral is left. (C) Bioluminescence signals emitted from 10 isl2b+following an acoustic stimulus during motion (blue) or after blockade of muscle contraction using pancuronium bromide in the bath (red). (D) Quantification of the amplitude of bioluminescence signals across fish in active and paralyzed larvae (4.53 +/- 0.21 versus 2.20 +/- 0.10 photons / 10 ms, n = 10 fish, n = 600 trials, p < 0.001).
Author response image 4

Amplitude of bioluminescence signals originating from motor neurons does not increase with the intensity of voltage applied to induce acoustic stimuli.
(A) As shown here for 10 fish tested in control conditions and with pancuronium bromide, larger voltages actually led to decreased amplitude of the bioluminescence signals before paralysis (mean bioluminescence amplitudes across fish = 28.3 +/- 1.7; 25.7 +/- 4.6; 14.9 +/- 4.7 photons /10ms for stimuli voltage of respectively 1, 2 or 4 V, p = 0.03) and no correlation after paralysis. Furthermore, one can note that the stimulus voltage used in paralyzed conditions was equal or higher than in control conditions. (B) As shown here for 10 control fish and 10 immotile mutants, larger voltages did not lead to larger amplitude of the bioluminescence signals: there was no correlation in control siblings while immotile mutants showed smaller signals for larger stimuli (mean bioluminescence amplitudes across fish = 13.9 +/- 3.6; 10.5 +/- 6.4; 7.9 +/- 7.3; 5.0 =:- 2.0 photons /10ms for respective stimuli voltage of 2, 3, 5 or 8 V; p = 0.001). Furthermore, one can note that the stimulus voltage used in immotile mutants (mean = 3.9 +/- 0.1 V) was higher than in control conditions (mean = 2.4 +/- 0.01 V, p < 0.001).
Videos
Video 1
Expression of GFP in a 4 dpf Tg(mnx1:gal4; UAS:GFP-aequorin-opt) larva revealed by immunohistochemistry (one example shown out of the n = 5 larvae where IHC was performed).
https://doi.org/10.7554/eLife.25260.004
Video 2
Bioluminescence signal emitted by a 4 dpf Tg(mnx1:gal4; UAS:GFP-aequorin-opt) free-tailed transgenic larva and corresponding kinematics during escape.
https://doi.org/10.7554/eLife.25260.005
Video 3
Bioluminescence signal emitted by a 4 dpf Tg(mnx1:gal4; UAS:GFP-aequorin-opt) free-tailed transgenic larva and corresponding kinematics during swimming.
https://doi.org/10.7554/eLife.25260.006
Video4
Calcium imaging of spinal motor neurons in a 4 dpf Tg(mnx1:gal4; UAS:GCaMP6f) larva during fictive slow swimming.
Animals were paralyzed with bungarotoxin injections. A small fraction of ventral motor neurons is active. Recordings were acquired at 20 Hz. Movies were sped up by 2.5 X.
Video 5
Calcium imaging of spinal motor neurons in a 4 dpf Tg(mnx1:gal4; UAS:GCaMP6f) larva during a fictive escape response.
Animals were paralyzed with bungarotoxin injections. A large portion of both ventral and dorsal motor neurons is recruited. Recordings were acquired at 20 Hz. Movies were sped up by 2.5 X.
Video 6
Expression of GFP in a 4 dpf Tg(isl2b:gal4,cmcl2:eGFP;UAS:GFP-aequorin-opt) larva revealed by immunohistochemistry (one example shown out of the n = 4 larvae where IHC was performed).
https://doi.org/10.7554/eLife.25260.012Tables
Table 1
Stable transgenic lines used or generated in this study.
| Name | Original reference |
|---|---|
| Tg(mnx1:gal4)icm23 | (Böhm et al., 2016) |
| Tg(isl2b:gal4,cmlc2:eGFP) | (Auer et al., 2015) |
| Tg(UAS:GFP-aequorin-opt)icm09 | This paper |
| Tg(UAS:GCaMP6f,cryaa:mCherry)icm06 | (Böhm et al., 2016) |
| Tg(chx10:loxP:DsRed:loxP:GFP) | (Kimura et al., 2006) |
| relaxed (cacnb1ts25) | (Granato et al., 1996) |
| Tg(UAS:BoTxLCB-GFP)icm21 | (Auer et al., 2015; Böhm et al., 2016; Sternberg et al., 2016) |
Download links
A two-part list of links to download the article, or parts of the article, in various formats.
Downloads (link to download the article as PDF)
Open citations (links to open the citations from this article in various online reference manager services)
Cite this article (links to download the citations from this article in formats compatible with various reference manager tools)
Mechanosensory neurons control the timing of spinal microcircuit selection during locomotion
eLife 6:e25260.
https://doi.org/10.7554/eLife.25260


