Palaeogenomes of Eurasian straight-tusked elephants challenge the current view of elephant evolution
- Max Planck Institute for Evolutionary Anthropolgy, Germany
- Harvard Medical School, United States
- University of Potsdam, Germany
- University of York, United Kingdom
- Danube Private University, Austria
- Basel University, Switzerland
- University of Illinois at Urbana-Champaign, United States
- State Office for Heritage Management and Archaeology Saxony-Anhalt with State Museum of Prehistory, Germany
- Naturalis Biodiversity Center, Netherlands
- Thüringisches Landesamt für Denkmalpflege und Archäologie, Germany
- Broad Institute of Harvard and MIT, United States
- Howard Hughes Medical Institute, Harvard Medical School, United States
- University of California, United States
Figures
Figure 1
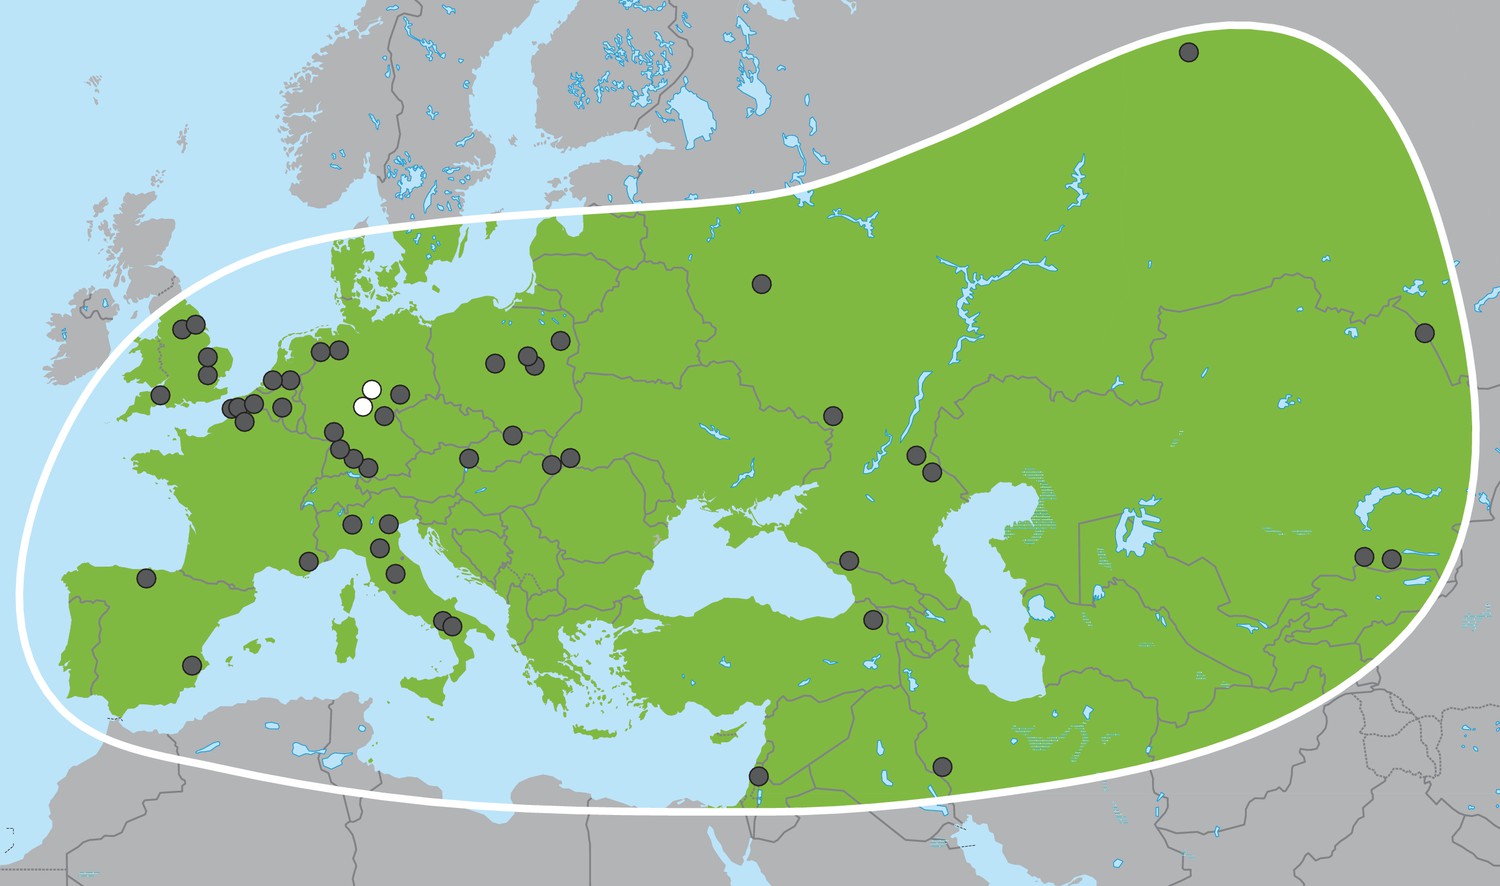
Palaeoloxodon antiquus, geographic range based on fossil finds (after Pushkina, 2007).
White dots indicate the locations of Weimar-Ehringsdorf and Neumark-Nord.
Figure 2 with 5 supplements
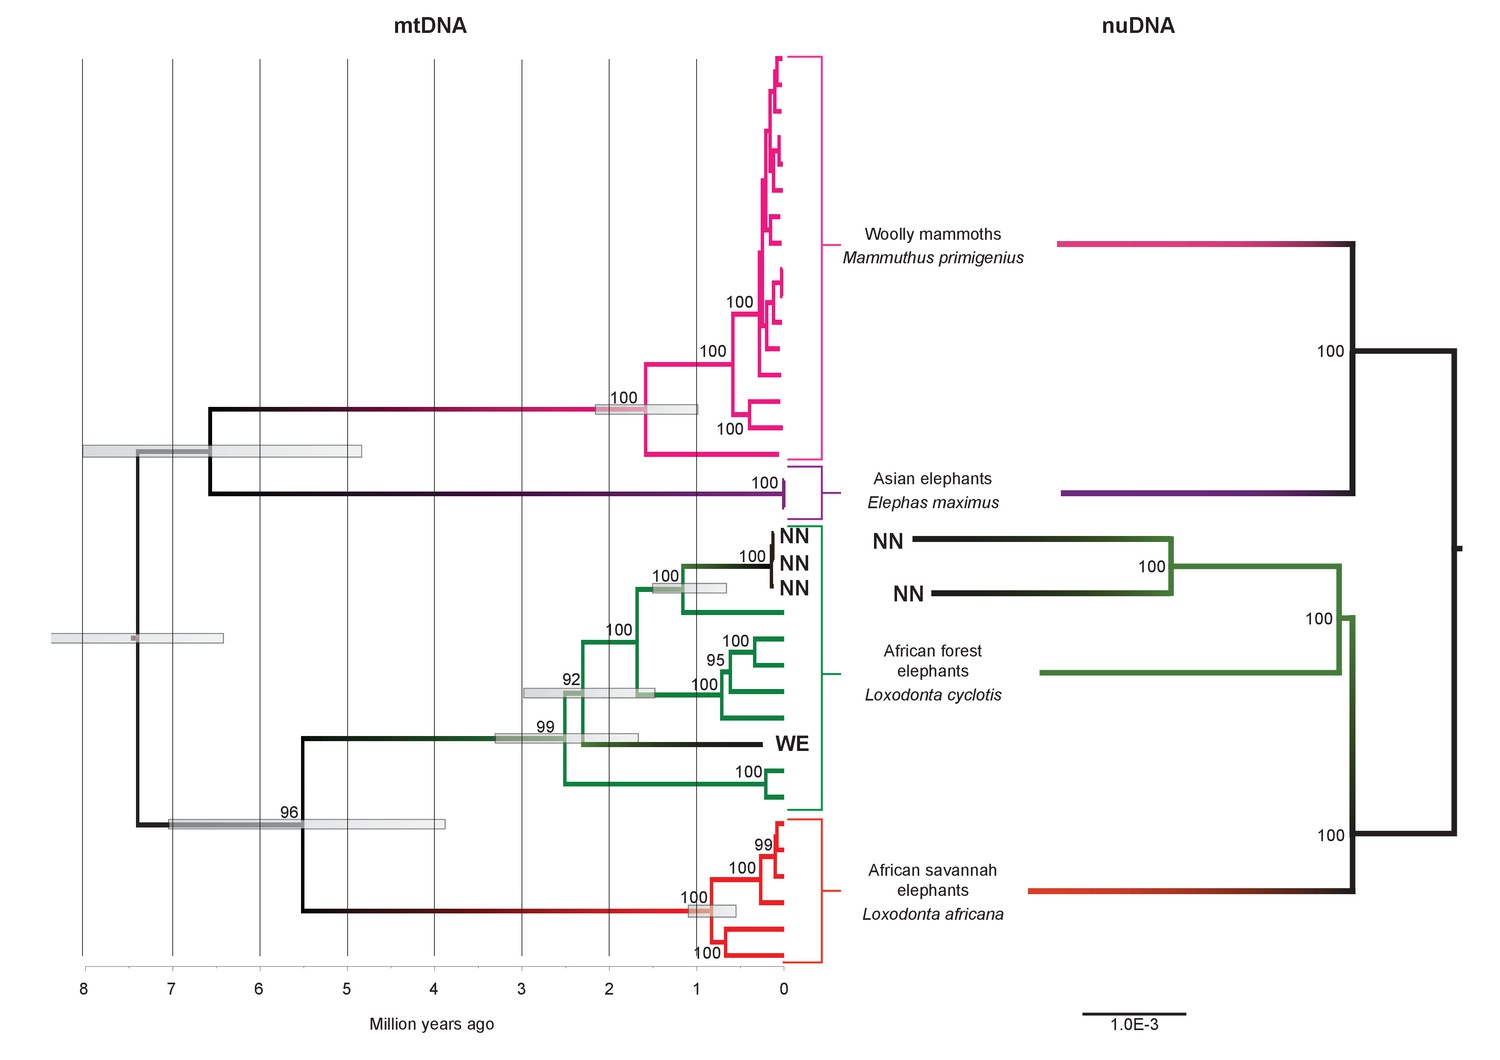
Phylogenetic trees relating the mitochondrial and nuclear sequences of P.antiquus (NN and WE) to other elephantids.
(A) Maximum clade credibility (MCC) tree resulting from a BEAST (Drummond et al., 2012) analysis of 35 complete mitochondrial genomes using 15,447 sites. Node bars and numbers show the 95% highest posterior density estimates for node ages and clade support, respectively. Mitochondrial partitioning scheme and molecular and coalescent models are described in ‘Materials and methods’. (B) Pairwise-distance Neighbor-joining tree from between 210 million and 2.5 billion base pairs of nuclear shotgun sequence data. Bootstrap support values from 100 replicates are shown inside nodes. Summary statistics of the underlying sequence data are available in Figure 2—source data 1.
-
Figure 2—source data 1
This spreadsheet contains summary statistics of all sequence data generated in this study, the sequences of PCR primers used for reconstructing mtDNA sequences of extant elephants, as well as amino acid racemization data on opercula of Bithynia tentaculata from Amersfoort.
- https://doi.org/10.7554/eLife.25413.005
Figure 2—figure supplement 1
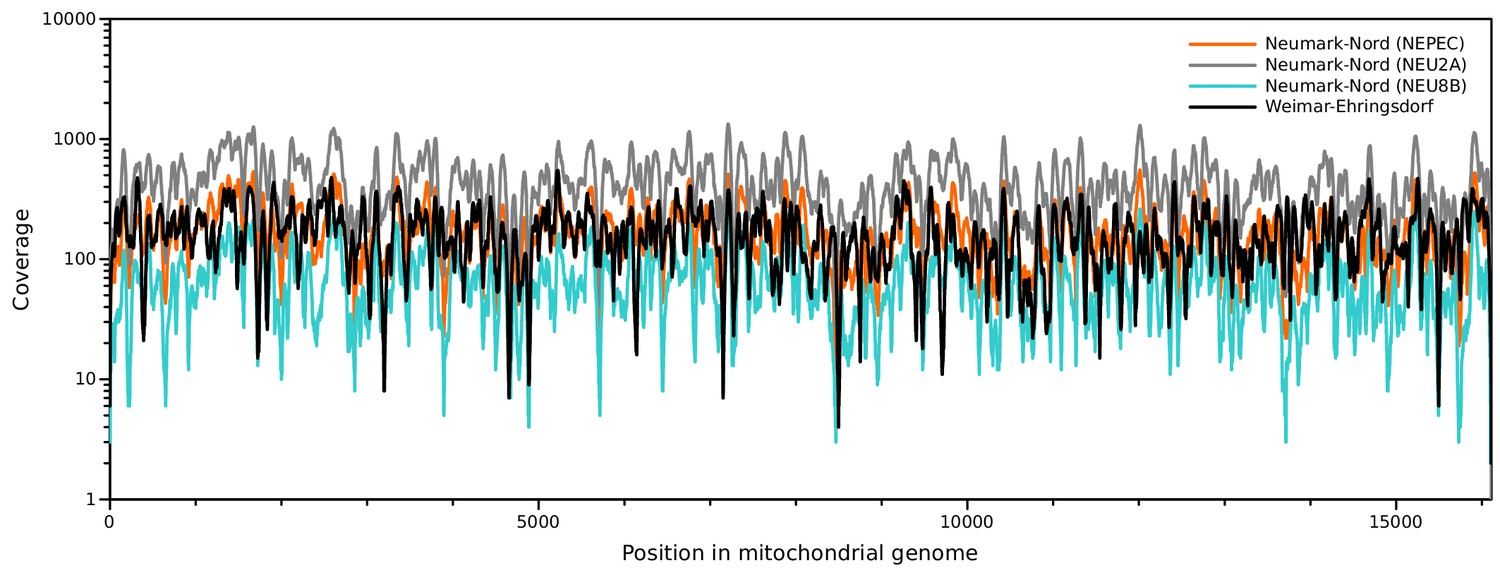
Sequence coverage of the NN and WE mitochondrial genomes.
https://doi.org/10.7554/eLife.25413.006
Figure 2—figure supplement 2
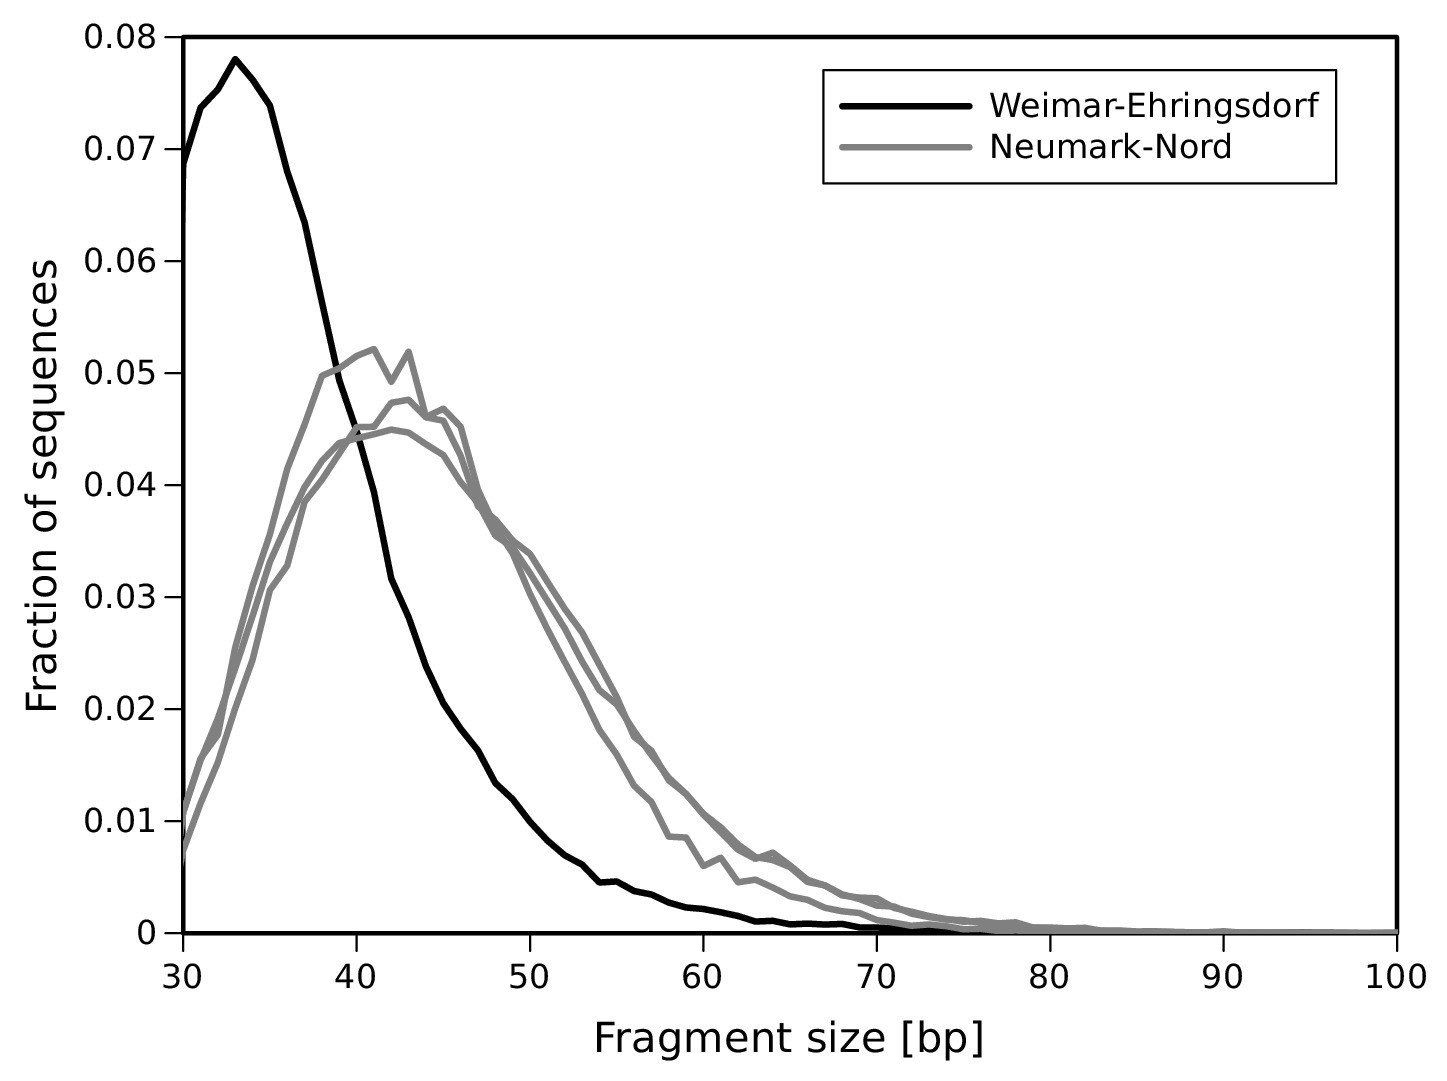
DNA fragment size distribution inferred from full-length mtDNA sequences.
https://doi.org/10.7554/eLife.25413.007
Figure 2—figure supplement 3
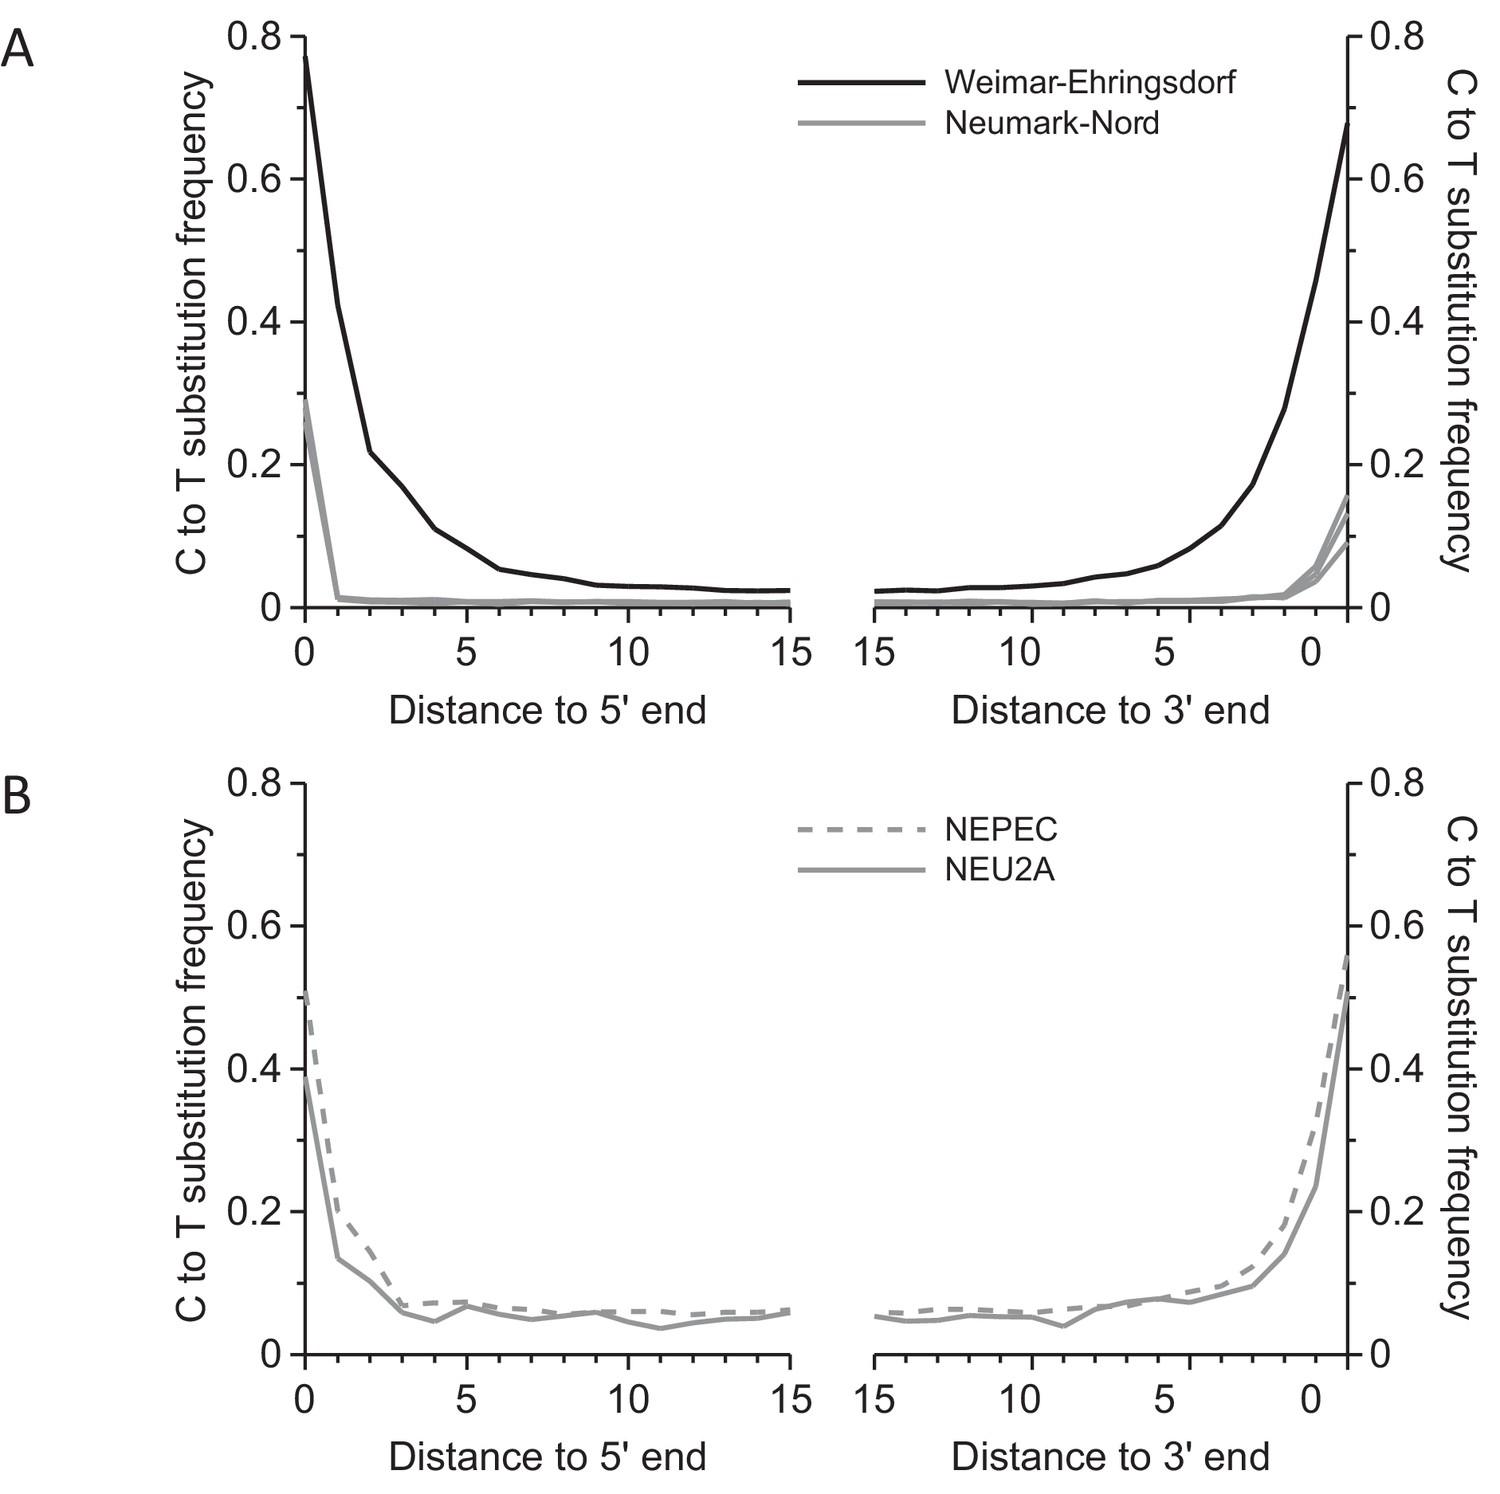
Frequency of C to T substitutions for each position in the sequence alignments.
(A) Substitution frequencies in mitochondrial alignments. Substitution frequencies are depressed in the Neumark-Nord libraries due treatment with uracil-DNA-glycosylase (UDG). (B) In nuclear sequence alignments, the deamination signal could be partly restored by limiting analysis to cytosines in CpG content. Since the majority of cytosines in CpG dinucleotides are methylated in mammalian genomes, deamination leaves thymines, which are not excised by UDG.
Figure 2—figure supplement 4
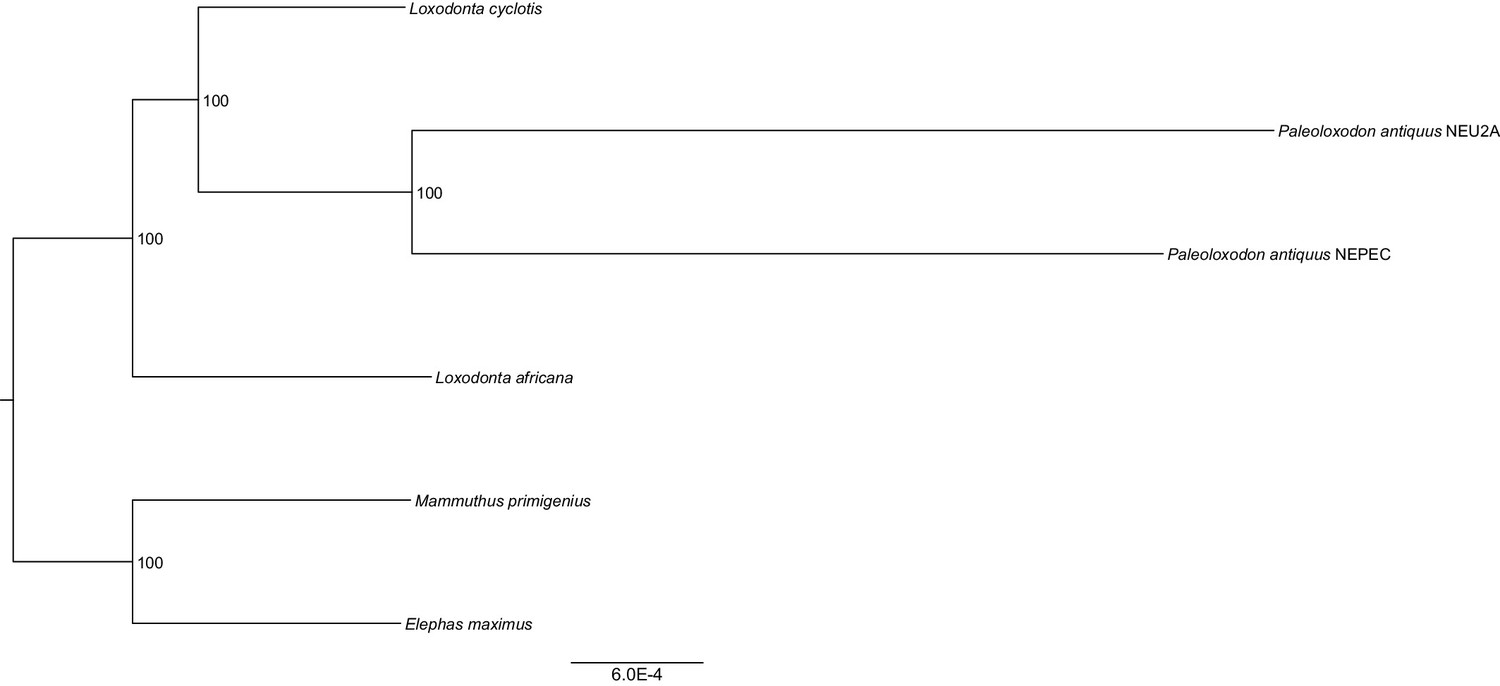
Maximum likelihood tree from concatenated nuclear protein-coding sequences with bootstrap support values shown inside nodes.
https://doi.org/10.7554/eLife.25413.009
Figure 2—figure supplement 5
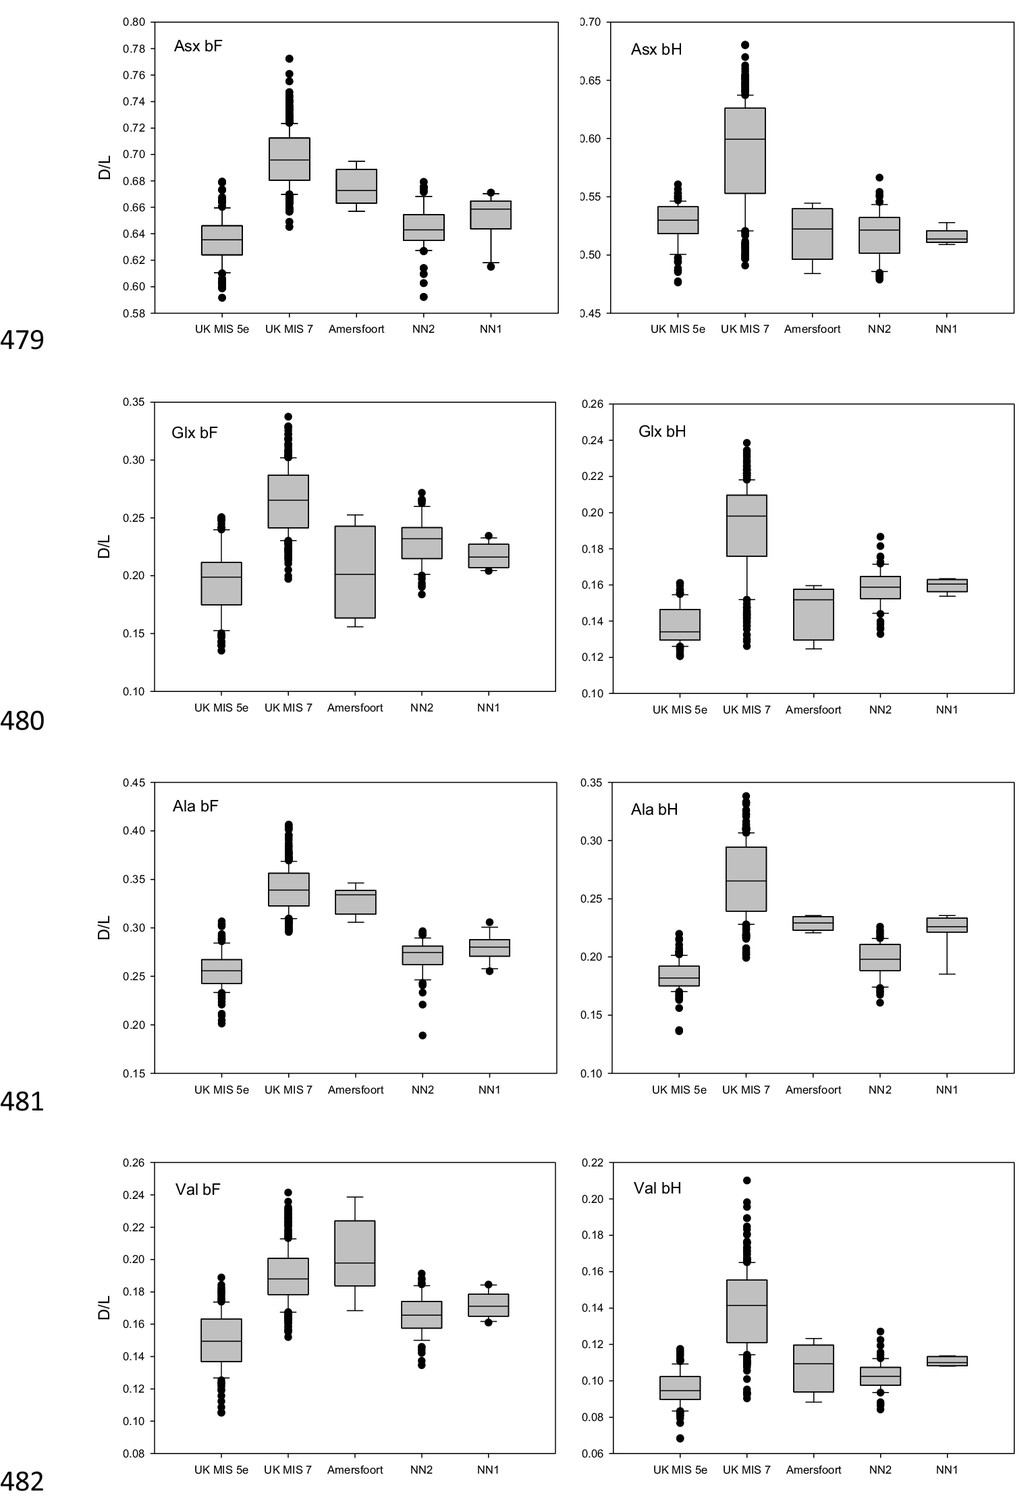
Amino acid racemization data.
D/L values of Asx, Glx, Ala and Val for the free amino acid (FAA, panels on the left) and total hydrolysable amino acid (THAA, panels on the right) fraction of bleached Bithynia tentaculata opercula from Amersfoort, Neumark-Nord 1 and 2. Ranges for samples from UK sites correlated with MIS 5e and MIS seven are indicative only, as effective diagenetic temperatures are likely to have differed significantly between Britain and continental Europe. The boundary of the box closest to zero indicates the 25th percentile, the dashed line within the box marks the mean and the boundary of the box farthest from zero indicates the 75th percentile. The 10th and 90th percentiles are represented by lines above and below the boxes. The results of each duplicate analysis are included in order to provide a statistically significant sample size.
Figure 3
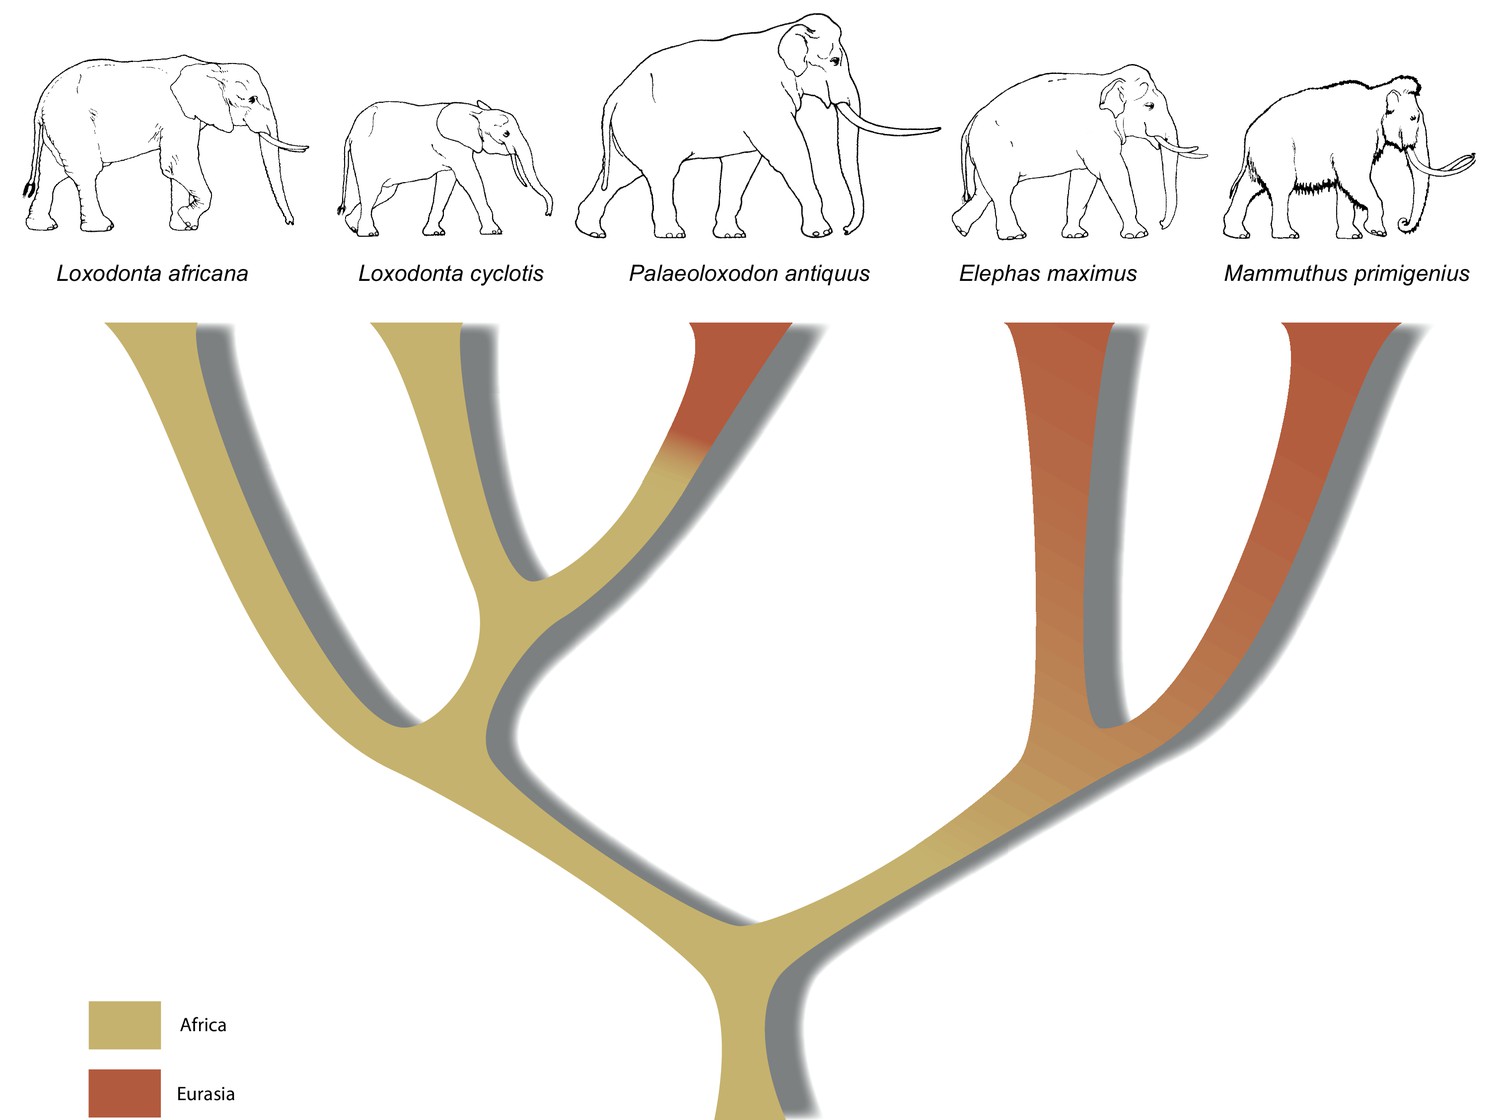
A revised tree of phylogenetic relationships among elephantids, color-coded by their presumed geographical range.
https://doi.org/10.7554/eLife.25413.011Download links
A two-part list of links to download the article, or parts of the article, in various formats.
Downloads (link to download the article as PDF)
Open citations (links to open the citations from this article in various online reference manager services)
Cite this article (links to download the citations from this article in formats compatible with various reference manager tools)
Palaeogenomes of Eurasian straight-tusked elephants challenge the current view of elephant evolution
eLife 6:e25413.
https://doi.org/10.7554/eLife.25413


