Co-agonists differentially tune GluN2B-NMDA receptor trafficking at hippocampal synapses
- Interdisciplinary Institute for NeuroSciences, CNRS UMR 5297, France
- Université de Bordeaux, France
- NSERM U862, Neurocentre Magendie, France
- Institut de Biologie de l'ENS (IBENS), CNRS UMR 8197, INSERM U1024, France
- Université Aix-Marseille, CNRS CRN2M UMR 7286, France
- Università degli Studi dell’Insubria, Italy
Figures
Figure 1
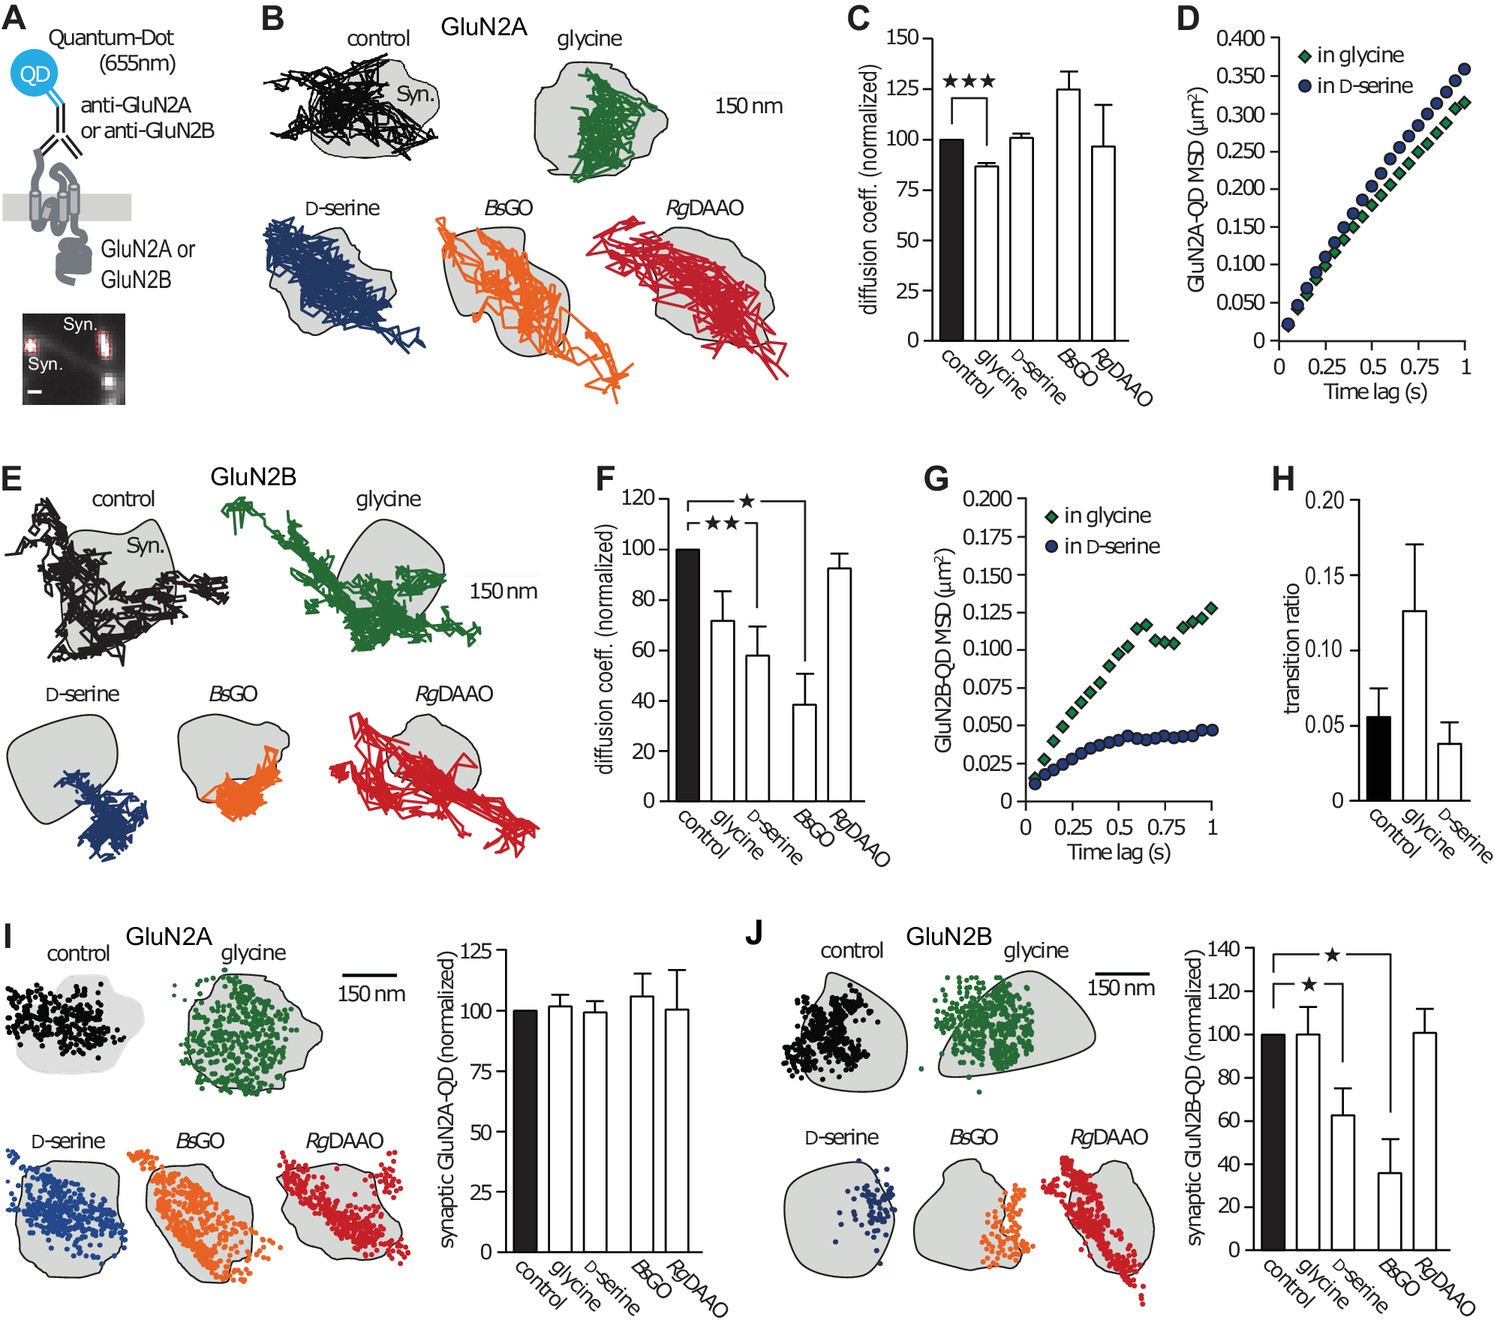
GluN2B-NMDAR synaptic dynamics is specifically altered by D-serine.
(A) Diagram representing the Quantum Dot (QD) coupled to the specific antibody used to track single surface GluN2-NMDAR (top). Example of a synapse area (Syn) identified after incubation with MitoTracker (bottom). Scale: 1 µm. (B) Examples of the surface trajectories of single QD-coupled GluN2A-NMDAR in the synaptic area. Scale: 150 nm. (C) Mean diffusion coefficient of synaptic GluN2A-QD normalized to control condition (before co-agonist or enzyme application). Glycine: n = 8,115, D-serine: n = 5,555, BsGO: n = 308, RgDAAO: n = 121 trajectories; p<0.0001 Kruskal-Wallis test. (D) Mean Square Displacement (MSD) of surface GluN2A trajectories measured either on the presence of glycine or D-serine. (E) Examples of the surface trajectories of single QD-coupled GluN2B-NMDAR as in (B). (F) Mean diffusion coefficient of synaptic GluN2B-QD normalized to control condition. Glycine: n = 318, D-serine: n = 836, BsGO: n = 73, RgDAAO: n = 605 trajectories; p<0.0001 Kruskal-Wallis test. (G) MSD of surface GluN2B trajectories as in (D). (H) Transition ratio (i.e. entries or exits from synaptic areas/total number of trajectories per cellular field) of GluN2B-QD in the presence of either glycine or D-serine. Control: n = 7, glycine: n = 4, D-serine: n = 7 neuronal fields; p=0.1187 Kruskal-Wallis test. (I–J) Synaptic fraction of QD-detected GluN2A-NMDAR (I) and GluN2B-NMDAR (J) in the synaptic area, normalized to the respective controls. GluN2A: n = 21 glycine, n = 21 D-serine, n = 16 BsGO, n = 22 RgDAAO dendritic fields; p=0.9974 Kruskal-Wallis test. GluN2B: n = 8 glycine, n = 14 D-serine, n = 37 BsGO, n = 15 RgDAAO dendritic fields; p<0.0001 Kruskal-Wallis test. Data are represented as mean ± s.e.m.; ***p<0.0001, **p<0.001, *p<0.05, Dunn's Multiple Comparison Test.
Figure 2 with 1 supplement
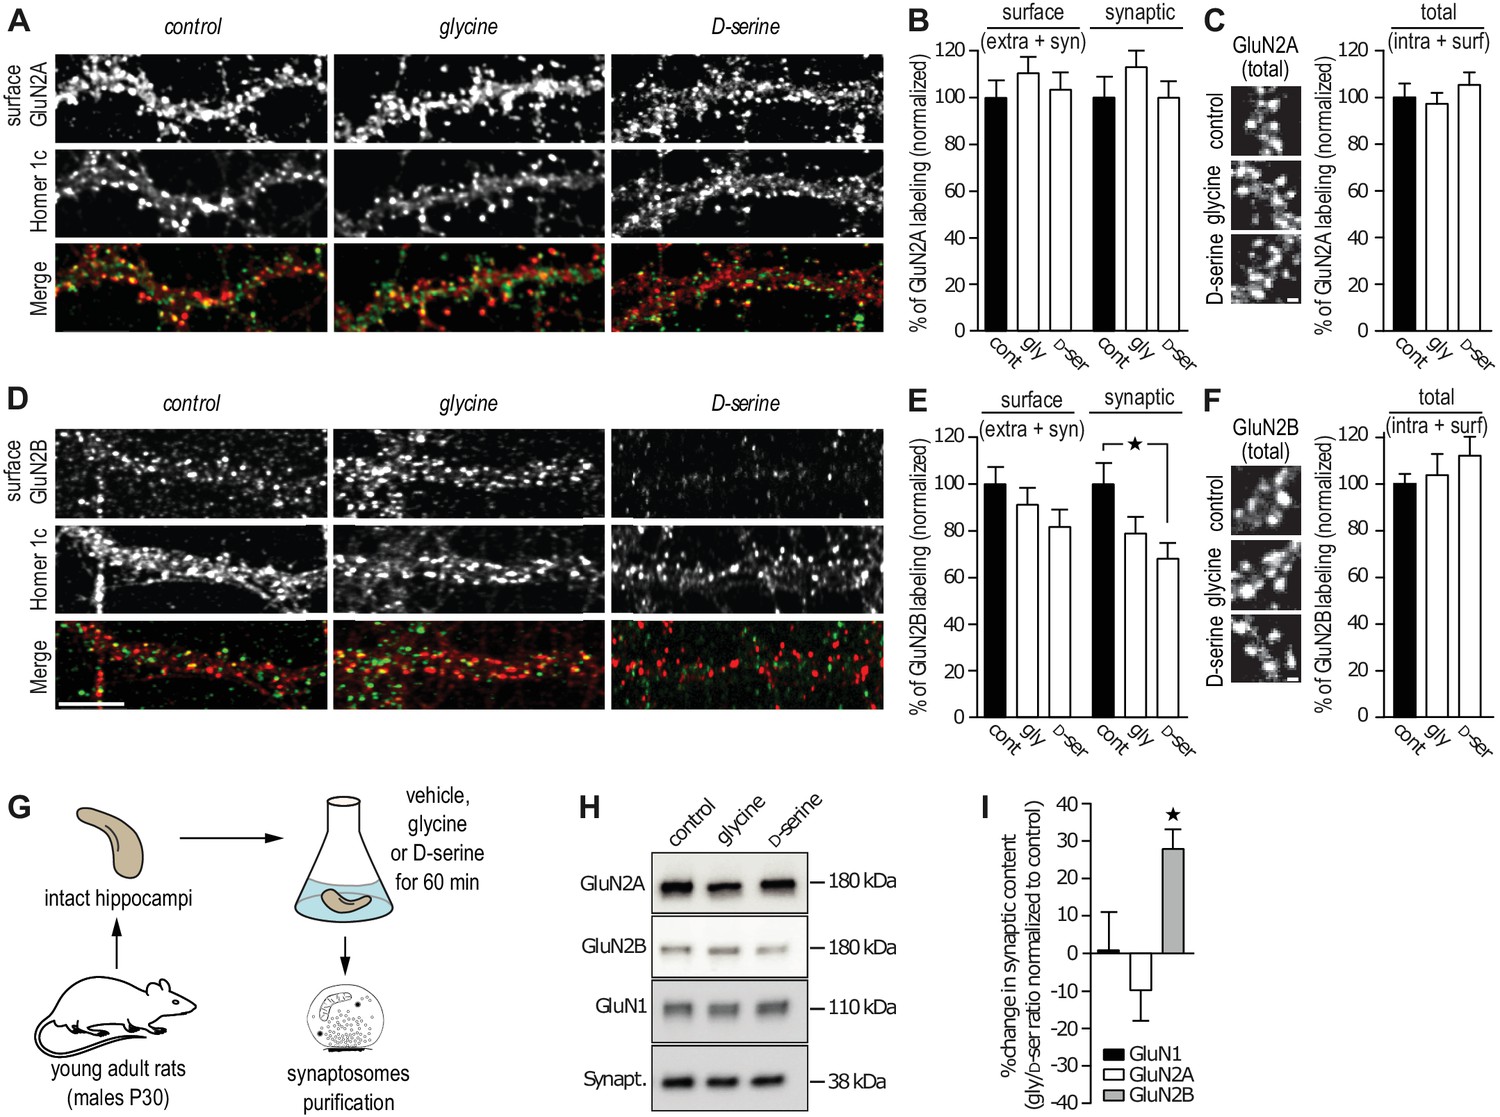
GluN2B synaptic content is decreased after D-serine incubation.
(A) Surface labeling of GluN2A in hippocampal neurons 18–19 div in culture stimulated with glycine or D-serine. Homer 1c staining was used as the synaptic maker. Scale: 10 µm. (B) Surface (extra- and synaptic) and synaptic GluN2A clusters overlapping Homer 1c positive clusters, normalized to the respective control conditions. Control: n = 41, glycine: n = 39, D-serine: n = 40 cells; surface GluN2A p=0.8935, synaptic GluN2A p=0.8830, Kruskal-Wallis test. (C) Total (intracellular and surface) GluN2A clusters from hippocampal neurons 17 div, labeled after permeabilization, stimulated with glycine or D-serine and normalized to the control. Control: n = 30, glycine n = 30, D-serine n = 30 cells; p=0.6884, Kruskal-Wallis test. (D) Surface labeling of GluN2B in hippocampal neurons 18–19 div in culture stimulated with glycine or D-serine. Homer 1c staining was used as the synaptic maker. Scale: 10 µm. (E) Surface (extra- and synaptic) and synaptic GluN2B clusters overlapping Homer 1c positive clusters, normalized to the respective control conditions. Control: n = 41, glycine: n = 39, D-serine: n = 40 cells; surface GluN2B p=0.1383, synaptic GluN2B p=0.0247, Kruskal-Wallis test followed by Dunn's Multiple Comparison Test, *p<0.05. (F) Total (intracellular and surface) GluN2B clusters from hippocampal neurons 17 div, labeled after permeabilization, stimulated with glycine or D-serine and normalized to the control. Control: n = 30, glycine n = 30, D-serine n = 30 cells; p=0.5478, Kruskal-Wallis test. (G) Synaptosomes were purified by subcellular fractionation from rats P30 hippocampi incubated for 60 min in aCSF containing either glycine or D-serine. (H) 1 µg of protein was probed against GluN2B, GluN2A and GluN1. Synaptophysin was used as a loading control. (I) Synaptic fraction of NMDAR subunits levels, calculated as the variation between the protein expression levels in glycine and in D-serine conditions, normalized to the non-treated condition, control. n = 5, GluN1 levels p=0.4409, GluN2A levels p=0.1062, GluN2B levels p=0.0207, Repeated measures ANOVA followed by Bonferroni's multiple comparison test, *p<0.05. Data are represented as mean ± s.e.m.
Figure 2—figure supplement 1
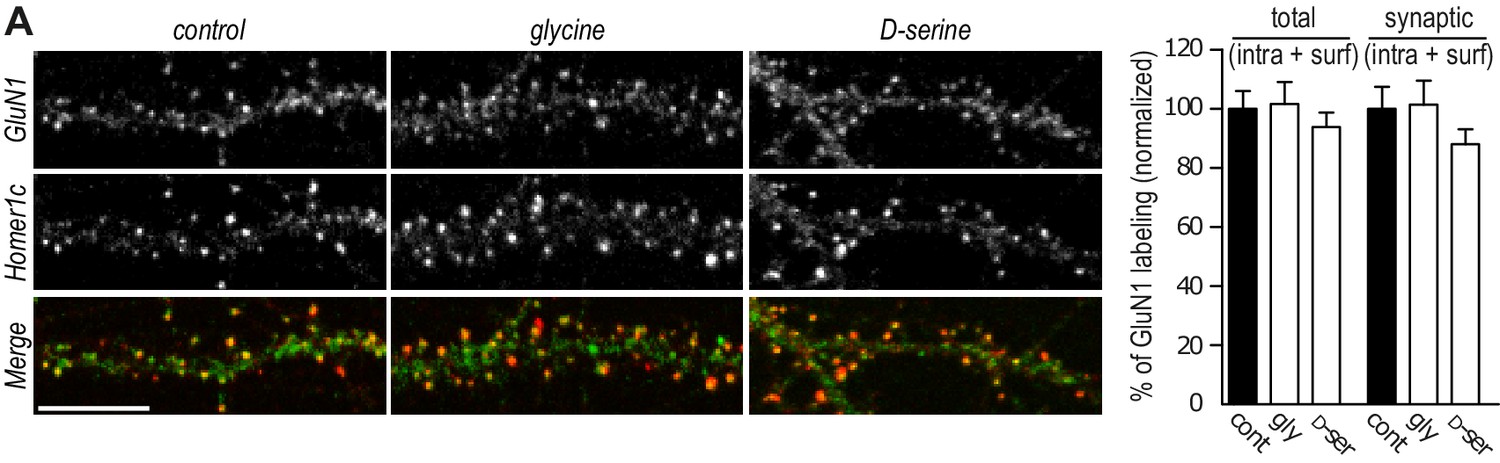
GluN1 content is not altered by the co-agonists application.
(A) Hippocampal neurons 16–18 div labeled after permeabilization with anti-GluN1 and anti-Homer1c, as a synaptic marker. Total (intracellular and synaptic) and synaptic (intracellular and surface) GluN1 clusters intensity (juxtaposed to Homer1c), after incubation with either glycine or D-serine, was normalized to the respective control. Control n = 30, glycine n = 30 and glycine n = 30. Total p=0.8338, synaptic p=0.4872, Kruskal-Wallis test.
Figure 3
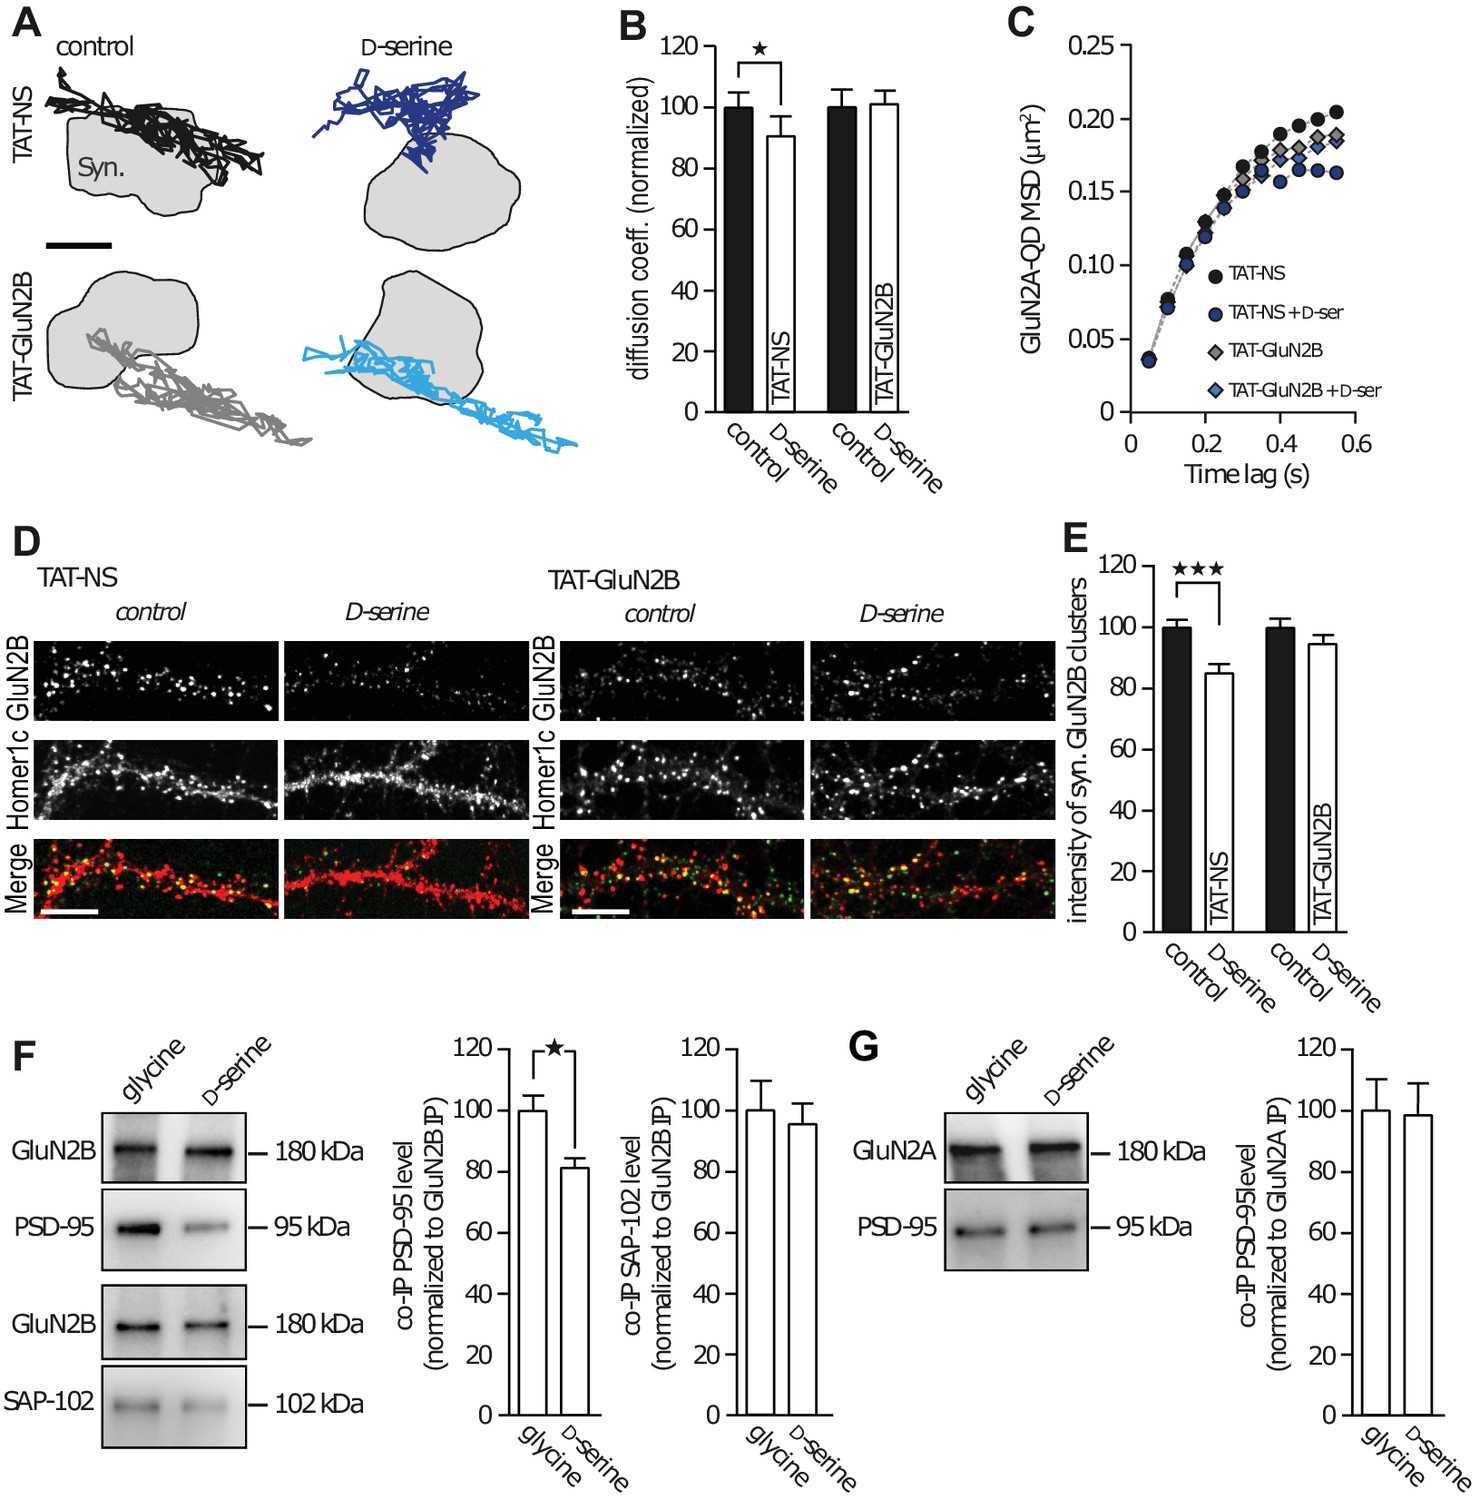
GluN2B subunit PDZ-binding domain mediates subunit co-agonist action.
(A) Examples of the surface trajectories of single QD-coupled GluN2B-NMDAR in the synaptic area. Pre-incubated with scramble peptide (TAT-NS, top) or GluN2B PDZ-proteins disrupting binding (TAT-GluN2B, bottom), before (control, left) or after D-serine application (right). Scale: 150 nm. (B) Mean diffusion coefficient of synaptic GluN2B-QD normalized to respective control condition (before D-serine application). TAT-NS control: n = 543, TAT-NS + D-serine: n = 299, TAT-GluN2B control: n = 413, TAT-GluN2B + D-serine: n = 713 trajectories; TAT-NS p=0.0398, TAT-GluN2B p=0.9292, Mann-Whitney test. (C) MSD of surface GluN2B trajectories in the presence of either TAT-NS or TAT-GluN2B, with or without D-serine. (D) Surface labelling of anti-GluN2B in hippocampal neurons 16–17 div in culture after incubation with either TAT-NS (top) or TAT-GluN2B (bottom), with (right) or without D-serine (left). Homer 1c staining was used as the synaptic maker. Scale: 10 µm. (E) Mean intensity of synaptic surface GluN2B clusters (juxtapose to Homer1c clusters) normalized to the respective control. TAT-NS control: n = 41, TAT-NS + D-serine: n = 38, TAT-GluN2B control: n = 61, TAT-GluN2B + D-serine: n = 70 cells; TAT-NS p<0.0001, TAT-GluN2B p=0.3090, Mann-Whitney test. (F–G) GluN2B immunoprecipitates (GluN2B IP, (F) or GluN2A (GluN2A IP, (G) were probed against PSD-95 (top) or SAP-102 (bottom). PSD-95 and SAP-102 co-immunoprecipitation levels (co-IP) normalized to GluN2B (F) or GluN2A (G) levels after glycine or D-serine incubation. Glycine: n = 10, D-serine: n = 8; PSD-95 co-IP GluN2B p=0.0148; glycine and D-serine: n = 10; SAP-102 co-IP GluN2B p=0.9118; glycine and D-serine: n = 8; PSD-95 co-IP GluN2A p=0.8785, Mann-Whitney test. Data are represented as mean ± s.e.m.; *p<0.05, ***p<0.0001.
Figure 4 with 1 supplement
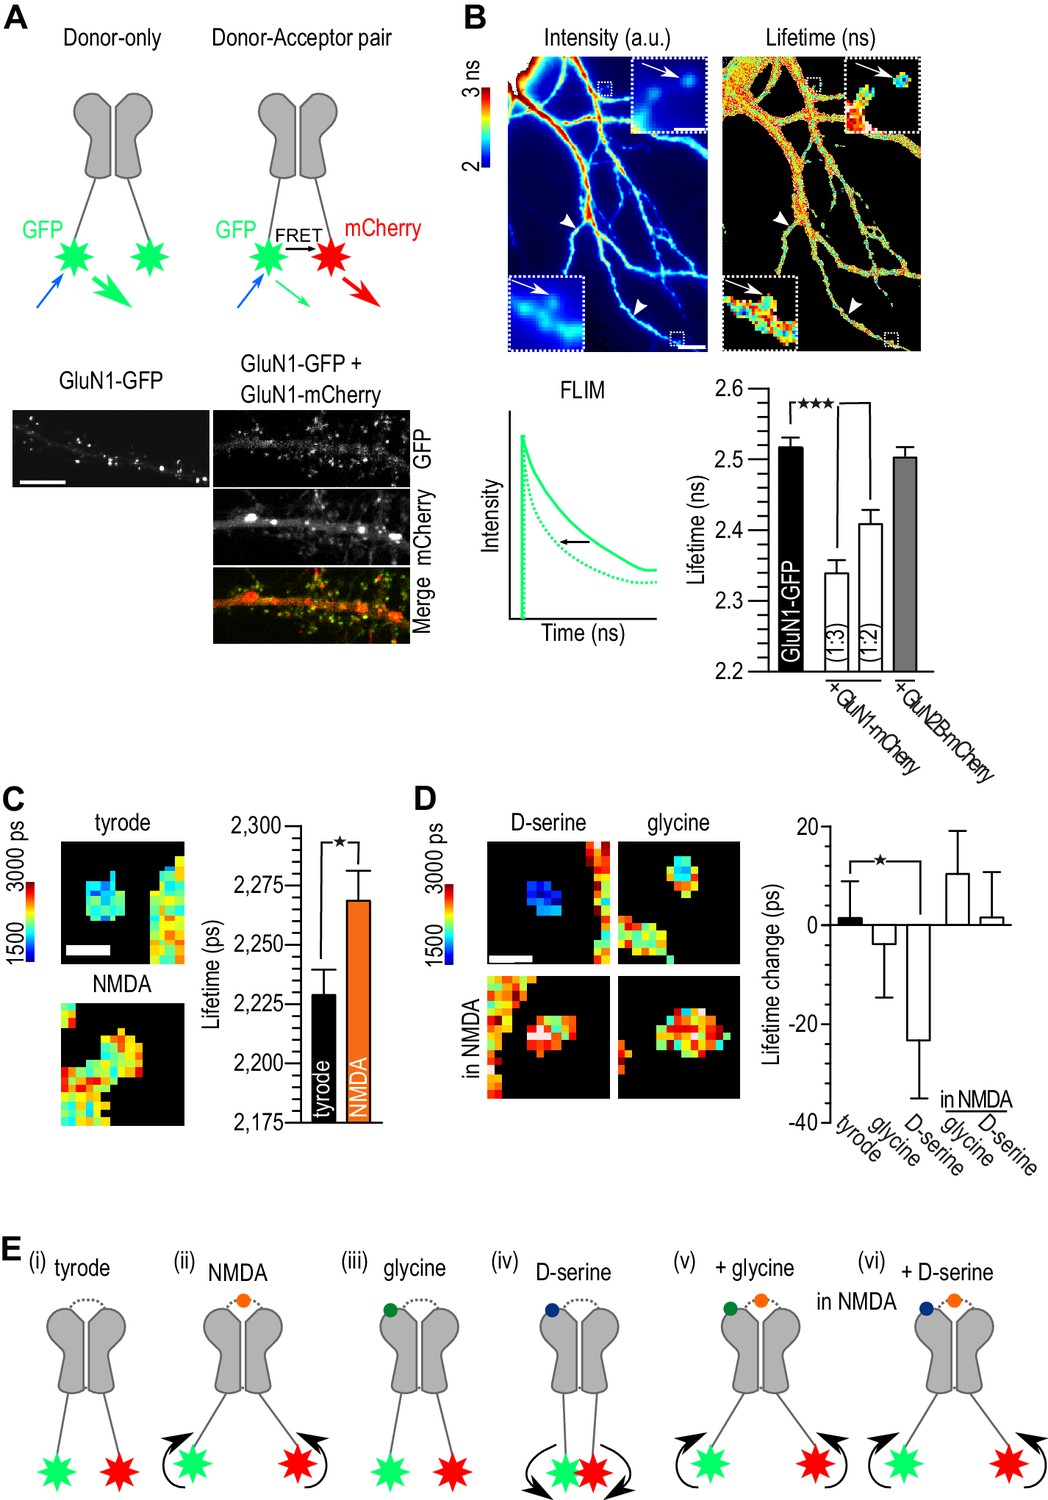
D-serine binding alone differently modulated NMDAR c-terminal conformation.
(A) Schematic representation of experimental design (top). Hippocampal neurons 14 div, transfected at 10 div with: GluN1-GFP (donor) or GluN1-GFP plus GluN1-mCherry (acceptor, bottom). Both conditions were co-transfected with GluN2B-Flag. Scale: 10 µm. (B) Example of GluN1-GFP fluorescent (left) and FLIM image (right). NMDAR clusters (spines clusters: arrows; shaft clusters: arrow heads, top) lifetime in nanoseconds (ns) quantification (bottom). Scale: 10 µm, insert 1 µm. Schematic representation of lifetime decay of a donor-only (full line) and of the donor in the presence of the acceptor (dashed line, bottom left). Comparison between GluN1-GFP lifetime alone (donor-only), co-transfected with GluN1-mcherry with a ratio 1:3 or 1:2 (donor-acceptor pair) and co-transfected with GluN2B-mCherry (negative control). GluN1-GFP: n = 70, GluN1-GFP + GluN1-mCherry (1:3): n = 88, GluN1-GFP + GluN1-mCherry (1:2): n = 44, GluN1-GFP + GluN2B-mCherry: n = 60 spines and shaft clusters; p<0.0001, One-way analysis of variance, followed by Dunnett's Multiple Comparison Test, ***p<0.0001 (bottom right). (c) Example of FLIM image of GluN1-GFP/GluN1-mCherry clusters after addition of tyrode (control) or NMDA (left). Quantification of GluN1-GFP lifetime (right). Tyrode: n = 291, NMDA: n = 124; p=0.0165, F = 1.719, Unpaired t test, one-tail. (D) Example of FLIM image of GluN1-GFP/GluN1-mCherry clusters after addition of D-serine or glycine (top) in tyrode only or in the presence of NMDA (bottom). Quantification of GluN1-GFP lifetime change (lifetime after minus the lifetime before co-agonist addition, right). Tyrode: n = 291, glycine: n = 110, D-serine: n = 103, glycine in NMDA: n = 268, D-serine in NMDA: n = 233 spine and shaft clusters; tyrode p=0.4234, r2 = 0.0001, glycine p=0.3650, r2 = 0.0011, D-serine p=0.0255, r2 = 0.0368, glycine in NMDA p=0.0949, r2 = 0.0065, D-serine in NMDA p=0.4348, r2 = 0.0001, Paired t-test, one-tail, before and after, *p<0.05. Data are represented as mean ± s.e.m. (E) Schematic representation of the c-terminus tails of the NMDAR in basal conditions (tyrode, (i) or in the presence of NMDA (ii), the co-agonists alone (iii, iv) or in activating conditions (co-agonists together with NMDAR, (v, vi).
Figure 4—figure supplement 1
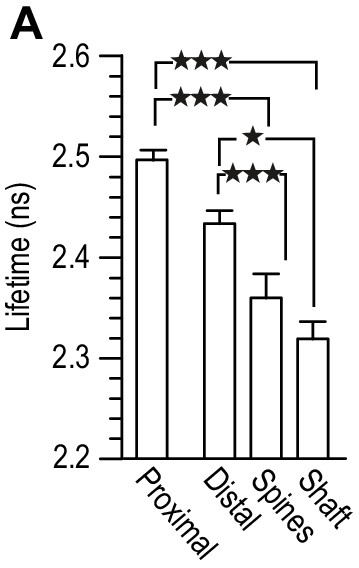
Lifetime measurement of GluN1-GFP co-transfected 14 div hippocampal neurons, with GluN1-mCherry, and Flag-GluN2B (1:3:2), at 10 div.
Different regions were chosen in the fluorescent image: proximal (dendrite region close to the cellular body), distal (secondary dendrite region without NMDAR clusters), spines (NMDAR clusters with a spine-like morphology) and shaft (NMDAR clusters localized in dendrites). Comparison between the lifetimes within the different regions showed no difference between spines and shaft. All results in the main text are a result of a pull of spine and shaft NMDAR clusters. n = 40 proximal dendritic regions, n = 45 distal dendritic regions, n = 45 spine-like NMDAR clusters, n = 43 shaft-like NMDAR clusters. One-way analysis of variance; p<0.0001, followed by Bonferroni's multiple comparison test; *p<0.05, ***p<0.0001.
Figure 5 with 2 supplements
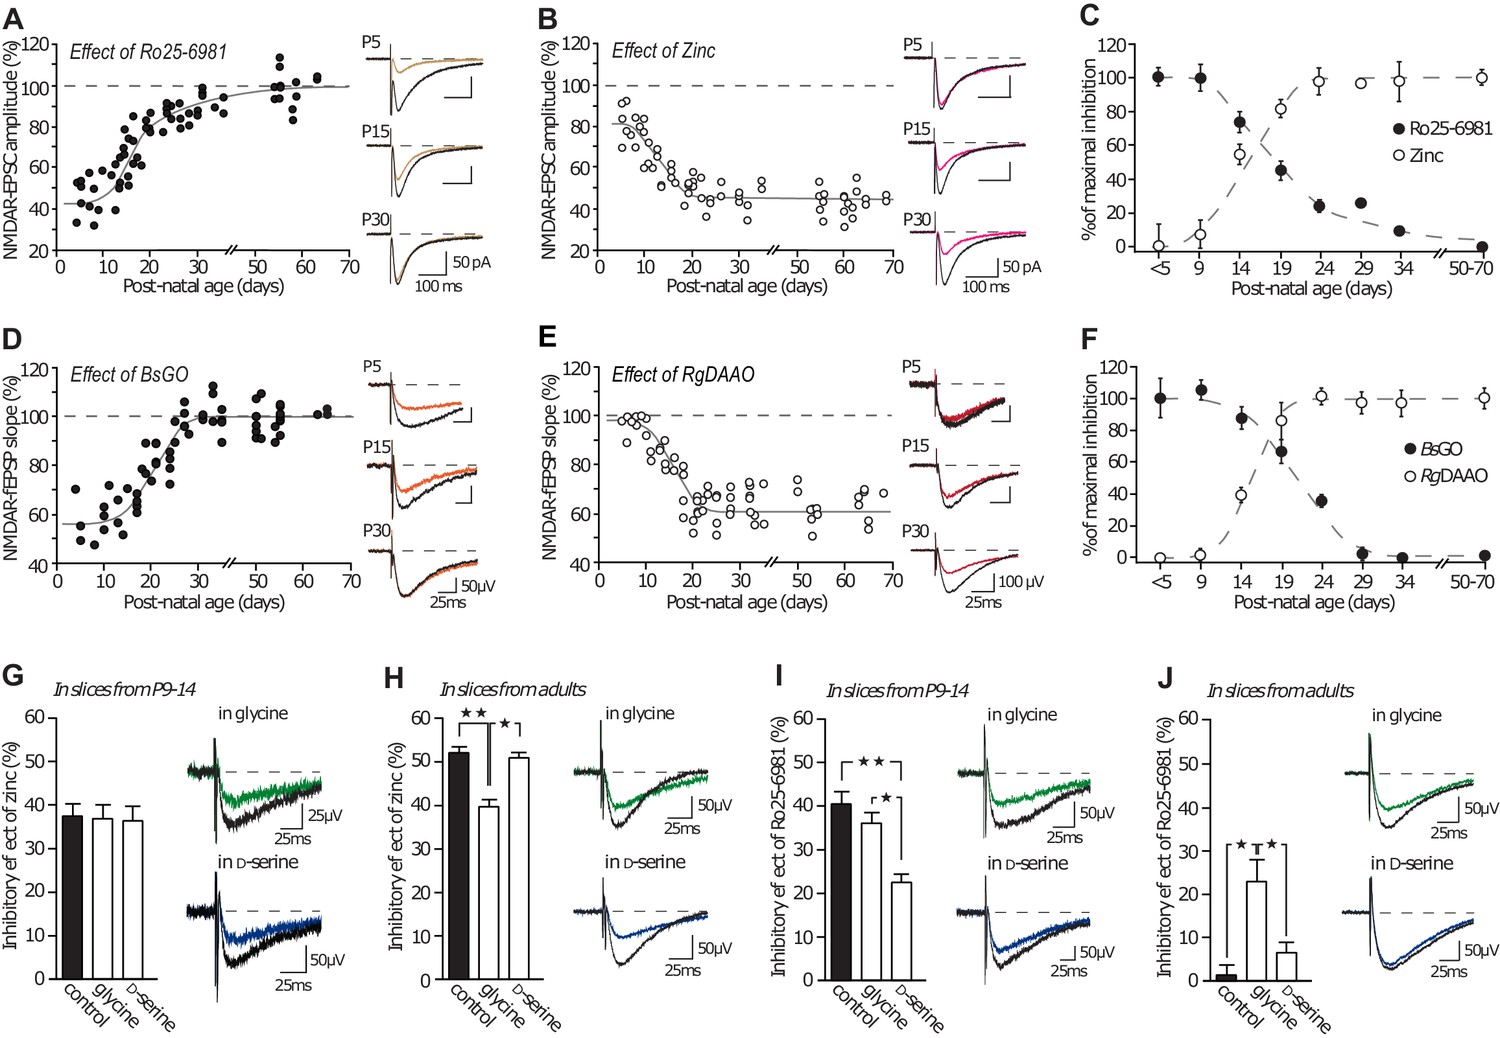
GluN2A/GluN2B developmental ratio is differently changed by the co-agonists availability.
(A–B) Inhibition mediated by Ro25-6981 (A) and by Zinc (B) on NMDAR-EPSCs in P5 to P70 rats slices. Each dot represents a single experiment. (C) Summary of Ro25-6981 and zinc inhibitory effects throughout development. Data are normalized to the maximal and minimal inhibitory effects and displayed for animals younger than P5 (<P5), from P5-P9 (P9), etc. (D–E) Effects of BsGO (d) and RgDAAO (e) on NMDAR-fEPSPs in P5 to P70 rat slices. (F) Summary of BsGO and RgDAAO inhibitory effects throughout development. Each dot represents a single experiment. n and p values can be found in Supplementary file 1. (G–H) Inhibitory effects of zinc on NMDAR-fEPSPs in P10-15 rat slices (G) and in adult rat slices (H). P9-P14 slices: n = 7, p=0.9319, adults slices: n = 6, p=0.0032; Kruskal-Wallis test, followed by Dunn's multiple comparison test *p<0.05, **p<0.01. (I–J) Inhibitory effects of Ro25-6981 on NMDAR-fEPSPs in P10-15 rat slices (I) and in adult rat slices (J). P9-P14 slices: n = 6 control and D-serine, n = 7 glycine, p=0.0004, adults slices: n = 13 control, n = 12 glycine, n = 11 D-serine; p=0.0003; Kruskal-Wallis test followed by Bonferroni's multiple comparison test *p<0.05, **p<0.01. Data are present as mean ± s.e.m.
Figure 5—figure supplement 1
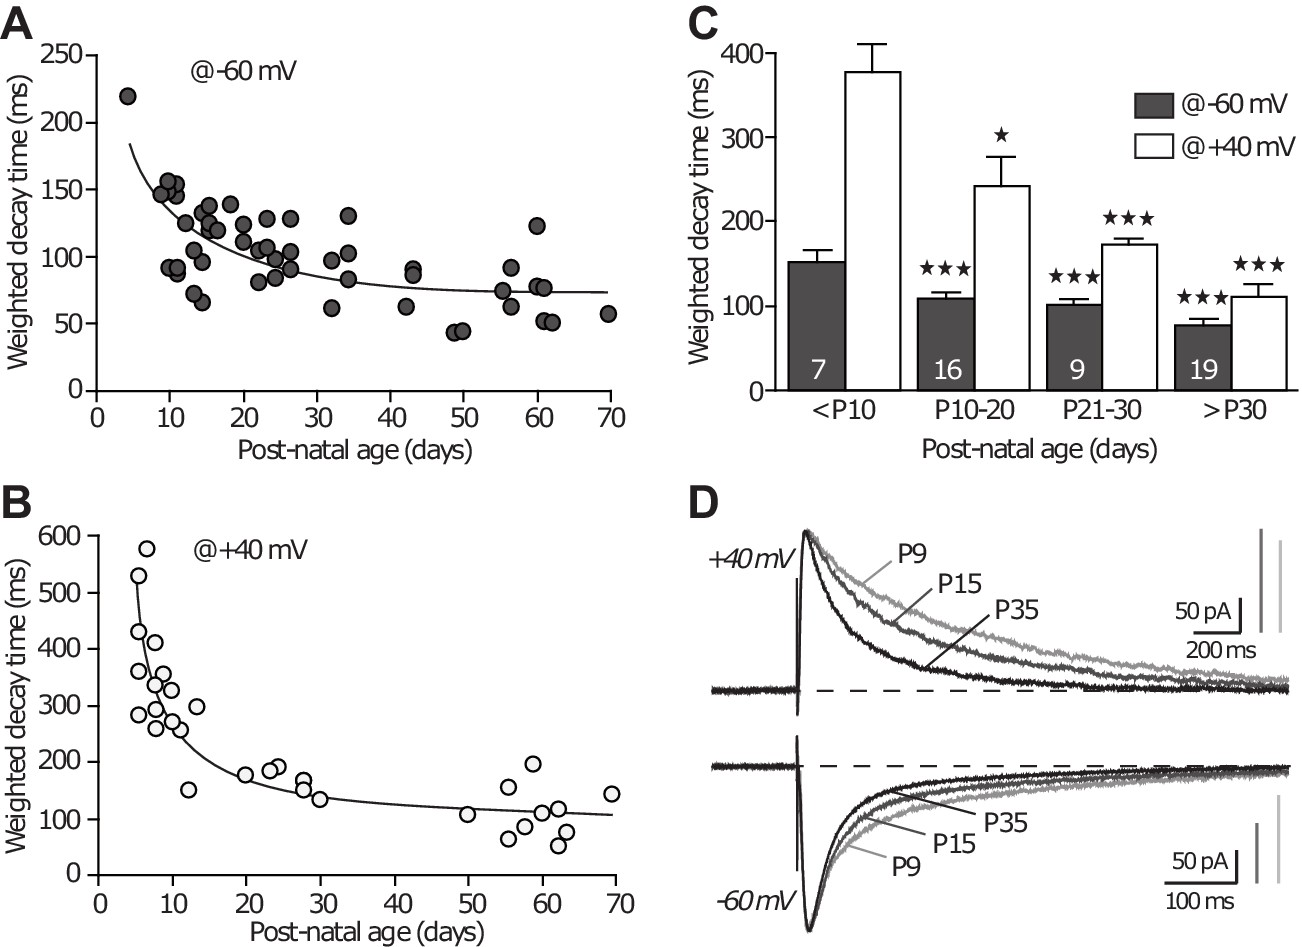
NMDAR-EPSC decay time decreases across development.
(A–B) Weighted decay time of NMDAR-EPSCs recorded at −60 mv (A) and +40 mV (B), in slices obtained from P5 to P70 animals. Each dot represents a single experiment. (C) Average weighted decay time (mean ± SEM) measured at −60 mV (grey bars) and +40 mV (white bars) in animals younger than P10 (151.1 ± 14.0 ms; 377.6 ± 31.2 ms, respectively), between P10 and P20 (109.5 ± 5.7 ms, p<0.001 compared to ‘ < P10’; 242.6 ± 32.4 ms, p<0.05, respectively, unpaired Student t-test), P21 and P30 (100.8 ± 6.7 ms, p<0.001; 172.1 ± 5.7 ms, p<0.001, respectively), and older than P30 (76.4 ± 5.8 ms, p<0.001; 111.4 ± 13.0 ms, p<0.001, respectively). The n-values are indicated in the bars. (D) Examples of NMDAR-EPSCs recorded at +40 mV (upper traces) or −60 mV (lower traces), in slices from P9, P15 and P35 rats and illustrating the expected decrease in decay time with age and subunit switch. Traces are averages of 30 sweeps and were scaled to their peak amplitude.
Figure 5—figure supplement 2
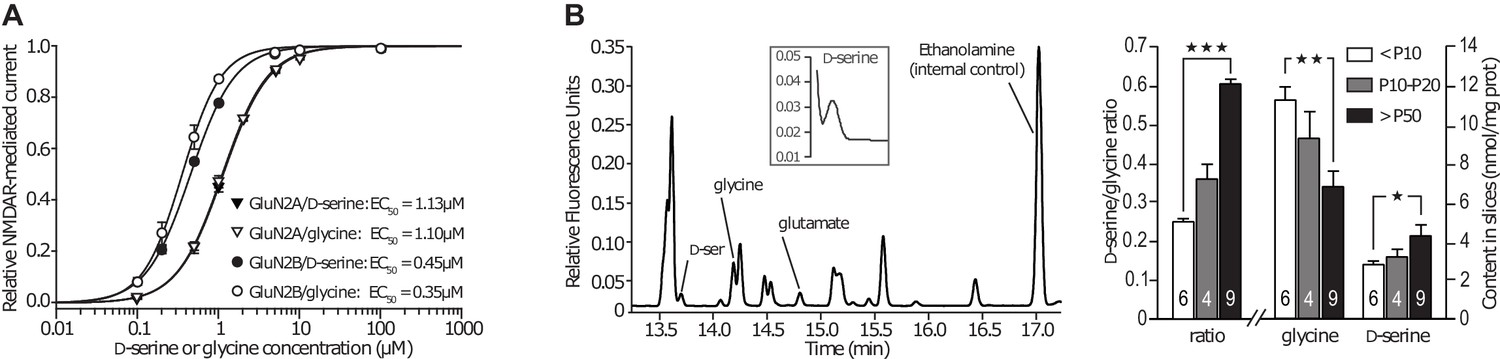
GluN2B subunit does not confer preference for the co-agonist.
(A) D-serine and glycine dose-response curves for GluN2A-NMDARs and GluN2B-NMDARs expressed in Xenopus oocytes. n and p values can be found in Supplementary file 2. (B) Average contents of glycine and D-serine, and D-serine/glycine ratio, measured by capillary electrophoresis in slices homogenates across development. n and p values can be found in Supplementary file 3.
Figure 6
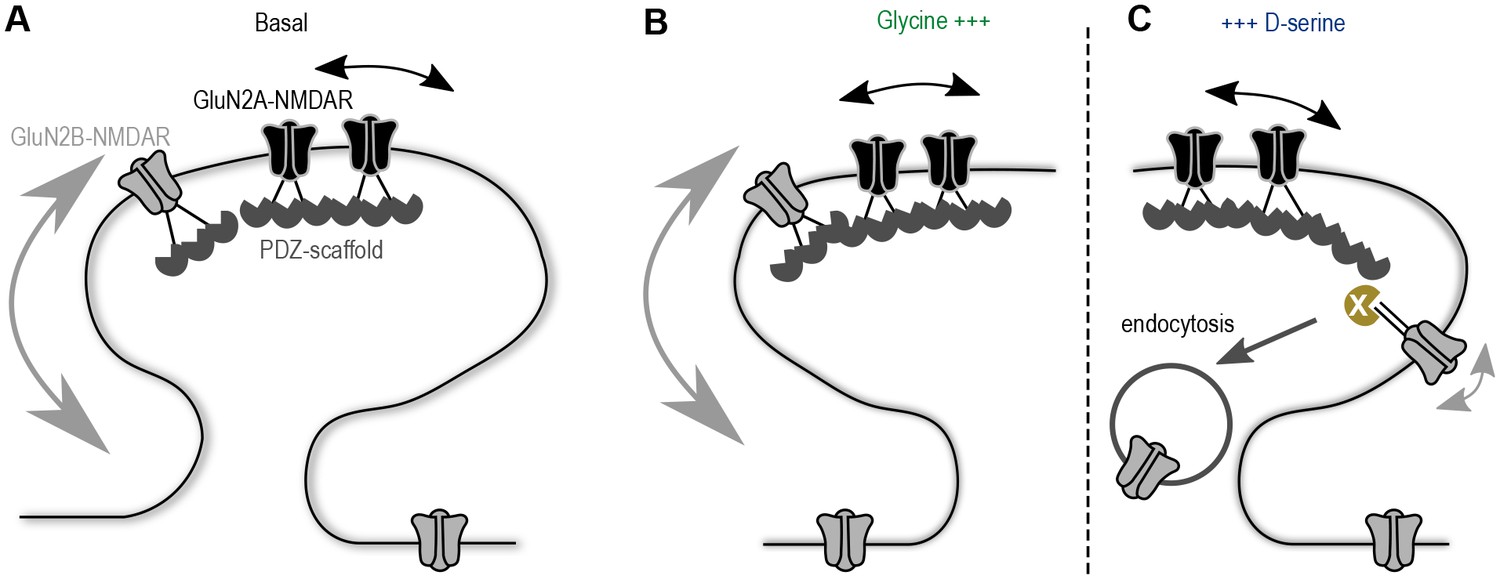
Proposed model of the co-agonist differential modulation NMDAR surface dynamics.
(A) In basal conditions GluN2A-NMDAR are enriched at synapses, whereas GluN2B-NMDAR are highly mobile. (B) This dynamics is maintained after glycine application. (C) However, D-serine application leads to a specific decrease of GluN2B-NMDAR surface diffusion and synaptic content, through the modulation of the receptors C-terminus interactions, possibly leading to an increase of the receptor internalization.
Additional files
-
Supplementary file 1
Co-agonist and NMDAR-subunit developmental switch.
Summary of the effects of BsGO, RgDAAO, Ro25-6981 and zinc normalized to baseline (mean ± s.e.m) in slices obtained from rats at indicated ages (see Figure 5—figure supplement 1). n values are indicated as well as p-values (paired Student t-test) assessing the significance of the effect achieved compared to baseline.
- https://doi.org/10.7554/eLife.25492.012
-
Supplementary file 2
D-serine and glycine dose-response curves.
Summary of Hill coefficient (nH), half maximal concentration (EC50) and n-values for the glycine/D-serine dose-response curves obtained on GluN2A- and GluN2B-NMDARs recombinants. p-Values (unpaired, two-tailed Student t-test) assess the difference between the EC50 obtained with D-serine and glycine.
- https://doi.org/10.7554/eLife.25492.013
-
Supplementary file 3
Capillary electrophoresis measurements.
Summary of the measurements of glutamate, glycine and D-serine content in slices at different ages. Values indicate average content (in nmoles per mg of tissue) ± s.e.m. p-Values indicate the level of significance (student t-test) between values in <P10 slices compared to values in adults.
- https://doi.org/10.7554/eLife.25492.014
Download links
A two-part list of links to download the article, or parts of the article, in various formats.
Downloads (link to download the article as PDF)
Open citations (links to open the citations from this article in various online reference manager services)
Cite this article (links to download the citations from this article in formats compatible with various reference manager tools)
Co-agonists differentially tune GluN2B-NMDA receptor trafficking at hippocampal synapses
eLife 6:e25492.
https://doi.org/10.7554/eLife.25492


