Brain micro-inflammation at specific vessels dysregulates organ-homeostasis via the activation of a new neural circuit
- Hokkaido University, Japan
- Alexandria University, Egypt
- Keio University School of Medicine, Japan
- Osaka University, Japan
- Tsurumi University, Japan
- National Hospital Organization Toneyama National Hospital, Japan
- University of Freiburg, Germany
Figures
Figure 1 with 3 supplements
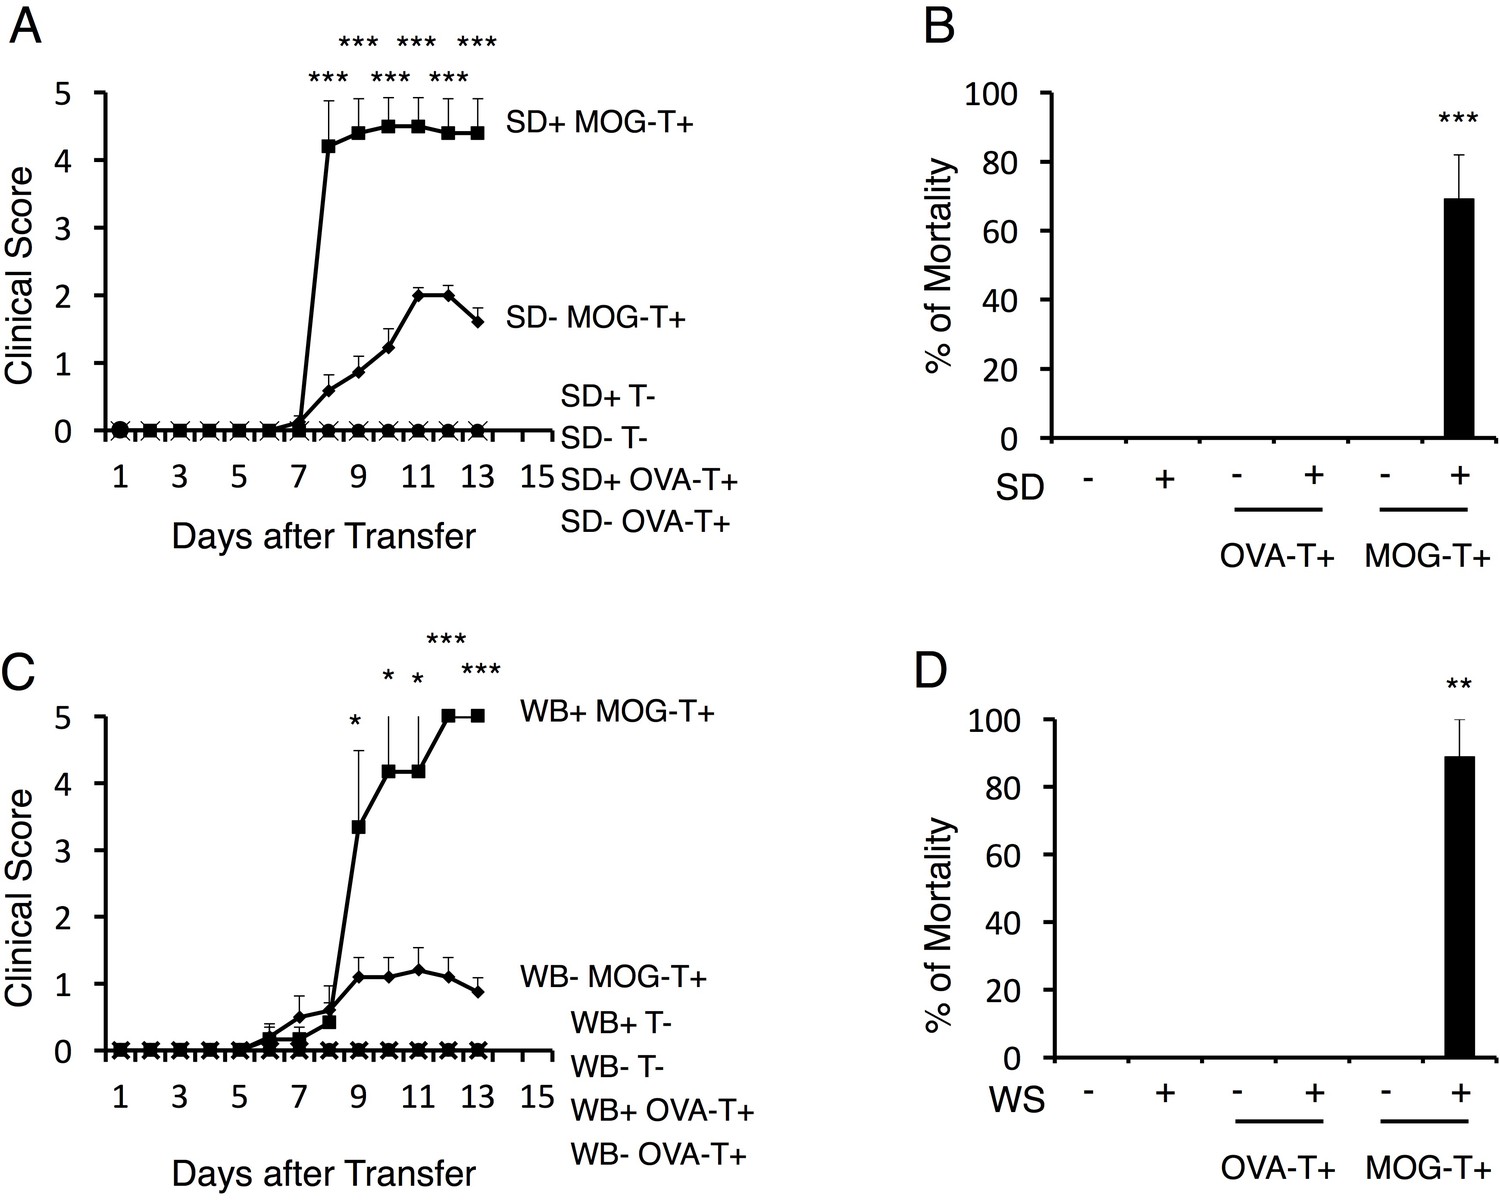
Stress conditions develop a severe phenotype of EAE.
(A) Clinical scores of mice with no treatment (SD- T-), stress condition (sleep disorder (SD) stress) only (SD+ T-), OVA-specific CD4+ T cell transfer only (SD- OVA-T+), OVA-specific CD4+ T cell transfer under stress condition (SD+ OVA-T+), MOG-pathogenic CD4+ T cell transfer only (SD- MOG-T+), and MOG-pathogenic CD4+ T cell transfer under stress condition (SD+ MOG-T+) (n = 3–5 per group). (B) Percentages of mortality of mice with no treatment (SD- T-), stress condition only (SD+ T-), OVA-specific CD4+ T cell transfer only (SD- OVA-T+), OVA-specific CD4+ T cell transfer only (SD+ OVA-T+), MOG-pathogenic CD4+ T cell transfer only (SD- MOG-T+), and MOG-pathogenic CD4+ T cell transfer under stress condition (SD+ MOG-T+) 10 days after pathogenic CD4+ T cell transfer (n = 3–5 per group). (C) Clinical scores of mice with no treatment (WB- T-), stress condition (wet bedding (WB) stress) only (WB+ T-), OVA-specific CD4+ T cell transfer only (WB- OVA-T+), OVA-specific CD4+ T cell transfer only (WB+ OVA-T+), MOG-pathogenic CD4+ T cell transfer only (WB- MOG-T+), and MOG-pathogenic CD4+ T cell transfer under stress condition (WB+ MOG-T+) (n = 5 per group). (D) Percentages of mortality of mice with no treatment (WB- T-), stress condition (wet bedding stress) only (WB+ T-), OVA-specific CD4+ T cell transfer only (WB- OVA-T+), OVA-specific CD4+ T cell transfer only (WB+ OVA-T+), MOG-pathogenic CD4+ T cell transfer only (WB- MOG-T+), and MOG-pathogenic CD4+ T cell transfer under stress condition (WB+ MOG-T+) 10 days after transfer (n = 3–5 per group). Mean scores ± SEM are shown. Statistical significance was determined by ANOVA tests. Statistical significance is denoted by asterisks (*p<0.05, **p<0.01, ***p<0.001). Experiments were performed at least three times; representative data are shown.
Figure 1—figure supplement 1
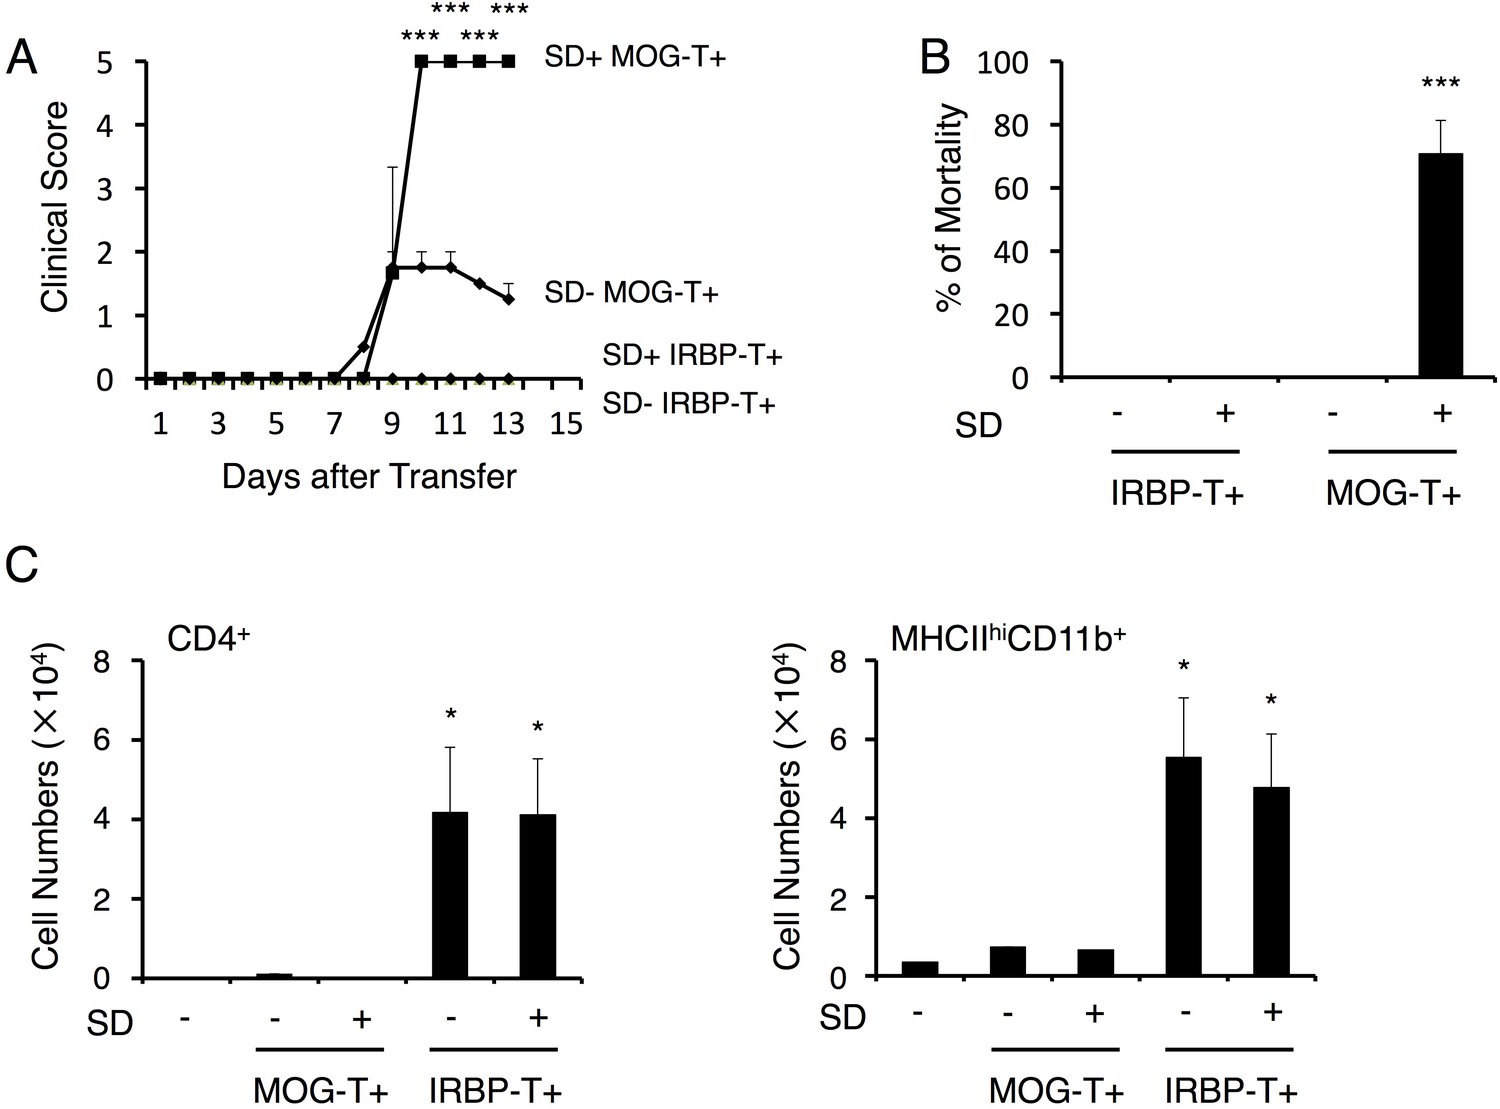
Autoreactive CD4+ T cells against a retinal antigen IRBP did not cause the severe phenotype under stress condition.
(A) Clinical scores of mice with IRBP-autoreactive CD4+ T cell transfer only (SD- IRBP-T+), IRBP-autoreactive CD4+ T cell transfer under stress condition (SD+ IRBP-T+), MOG-pathogenic CD4+ T cell transfer only (SD- MOG-T+), and MOG-pathogenic CD4+ T cell transfer under stress condition (SD+ MOG-T+) (n = 3–5 per group). (B) Percentages of mortality of mice with IRBP-autoreactive CD4+ T cell transfer only (SD- IRBP-T+), IRBP-autoreactive CD4+ T cell transfer under stress condition (SD+ IRBP-T+), MOG-pathogenic CD4+ T cell transfer only (SD- MOG-T+), and MOG-pathogenic CD4+ T cell transfer under stress condition (SD+ MOG-T+) 10 days after transfer (n = 3–5 per group). (C) Numbers of CD4+ T cells and MHCIIhiCD11b+ cells in the retina of mice with no treatment (SD- T-), IRBP-autoreactive CD4+ T cell transfer only (SD- IRBP-T+), IRBP-autoreactive CD4+ T cell transfer under stress condition (SD+ IRBP-T+), MOG-pathogenic CD4+ T cell transfer only (SD- MOG-T+), and MOG-pathogenic CD4+ T cell transfer under stress condition (SD+ MOG-T+) (n = 3–5 per group). Mean scores ± SEM are shown. Statistical significance was determined by ANOVA tests. Statistical significance is denoted by asterisks (*p<0.05, ***p<0.001). Experiments were performed at least three times; representative data are shown.
Figure 1—figure supplement 2
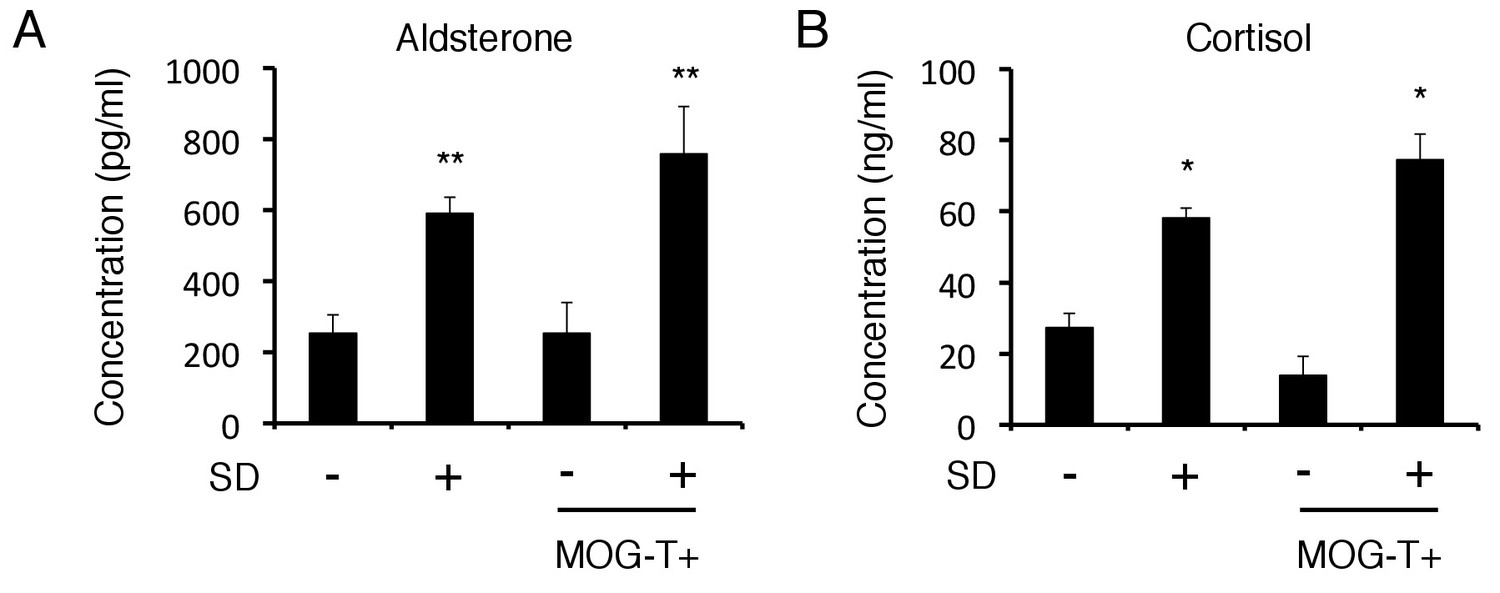
Blood aldosterone and cortisol levels were significantly higher in mice under stress condition independent of pathogenic CD4+ T cell transfer.
(A) Serum concentrations of aldosterone in C57BL/6 mice with stress 9 days after T cell transfer (n = 4–5 per group). (B) Serum concentrations of cortisol in C57BL/6 mice with stress 9 days after T cell transfer (n = 4–5 per group). Mean scores ± SD are shown. Statistical significance was determined by ANOVA tests. Statistical significance is denoted by asterisks (*p<0.05, **p<0.01). Experiments were performed at least three times; representative data are shown.
Figure 1—figure supplement 3
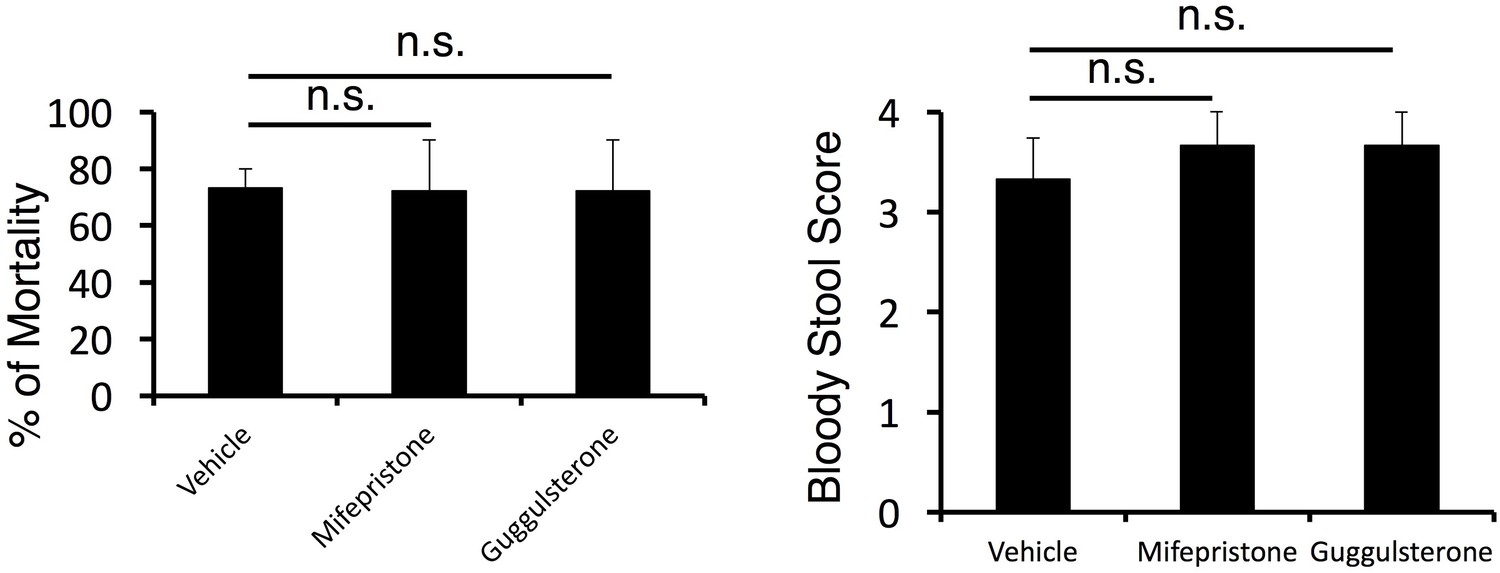
The mortality was not affected by corticosteroid receptor antagonist treatment in cytokine-microinjected mice under stress condition.
Bloody stool scores and percentages of mortality in mice under stress condition 2 days after direct microinjection of IL-6 and IL-17A at the specific vessels of boundary area of third-ventricle, thalamus, and dentate-gyrus (see Figure 4G) with or without corticosteroid receptor antagonist (mifepristone and guggulsterone) treatment. Mean scores ± SEM are shown. Statistical significance was determined by ANOVA tests. (n.s.: not significant). Experiments were performed at least three times; representative data are shown.
Figure 2 with 2 supplements
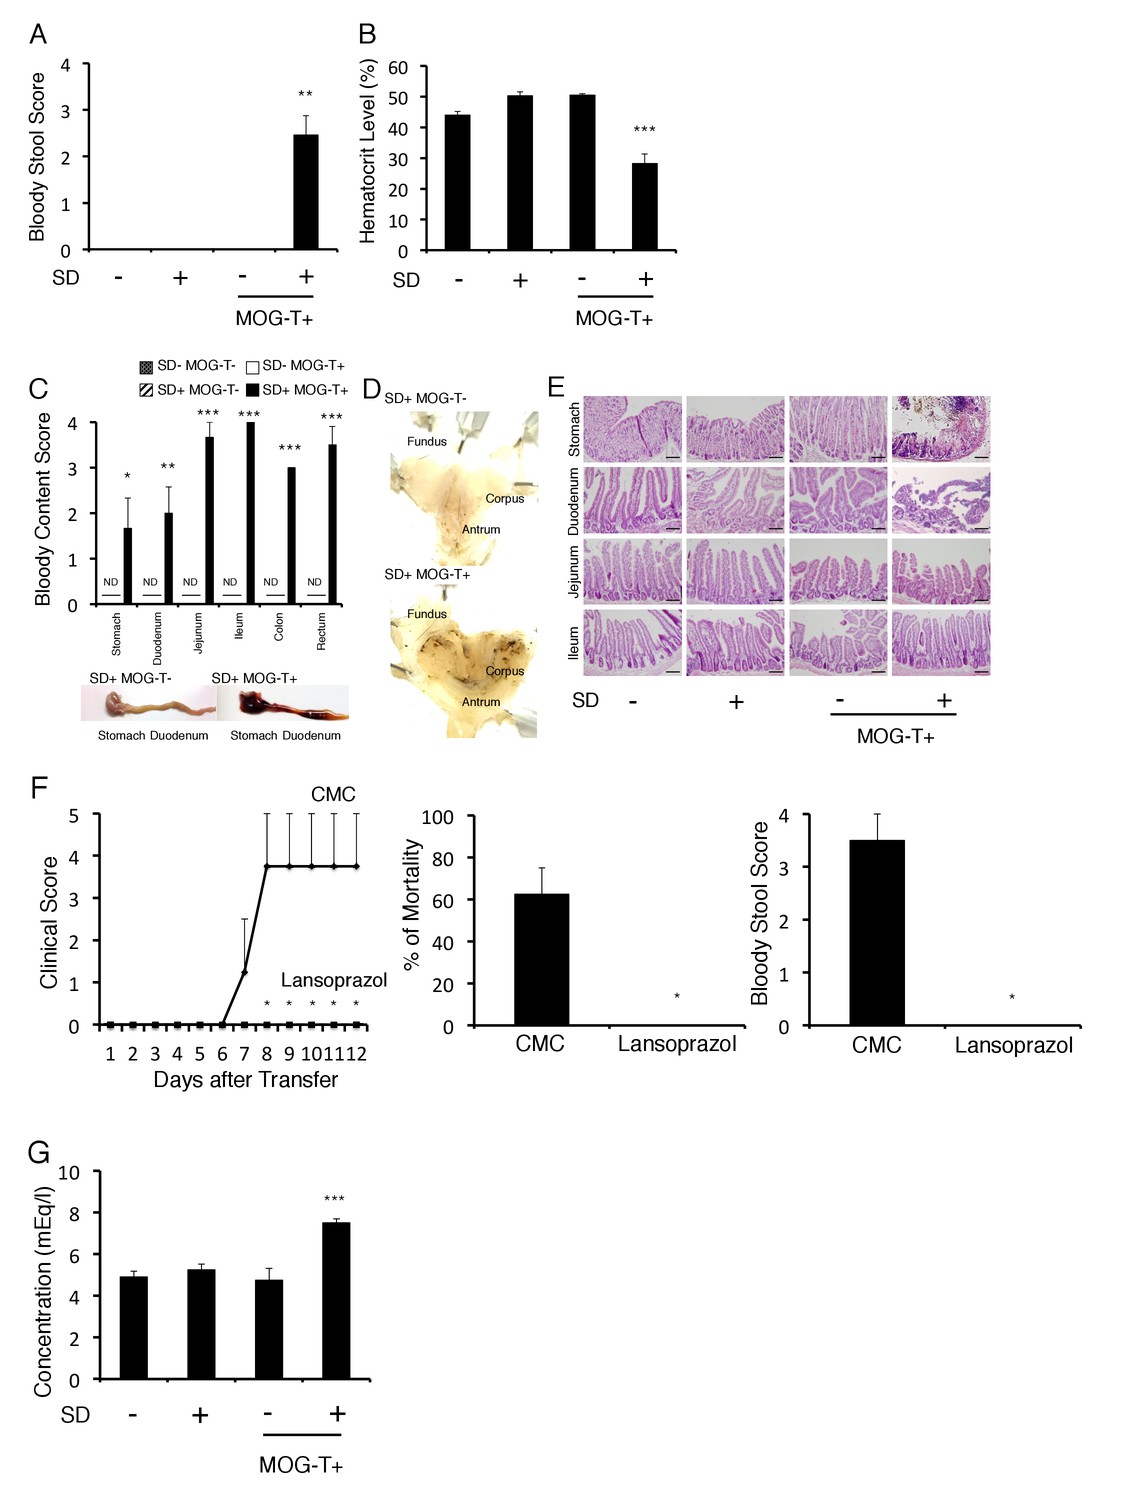
Gastrointestinal failure is induced after pathogenic CD4+ T cell transfer under stress condition.
(A) Bloody stool scores by a fecal occult blood test of mice with no treatment (SD- MOG-T-), stress condition only (SD+ MOG-T-), pathogenic CD4+ T cell transfer only (SD- MOG-T+), and pathogenic CD4+ T cell transfer under stress condition (SD+ MOG-T+) 10 days after pathogenic CD4+ T cell transfer (n = 3–4 per group). (B) Blood hematocrit levels in mice with no treatment (SD- MOG-T-), stress condition only (SD+ MOG-T-), pathogenic CD4+ T cell transfer only (SD- MOG-T+), and pathogenic CD4+ T cell transfer under stress condition (SD+ MOG-T+) 10 days after pathogenic CD4+ T cell transfer (n = 3–4 per group). (C) Bloody content scores by a fecal occult blood test of mice with no treatment (SD- MOG-T-), stress condition only (SD+ MOG-T-), pathogenic CD4+ T cell transfer only (SD- MOG-T+), and pathogenic CD4+ T cell transfer under stress condition (SD+ MOG-T+) 10 days after pathogenic CD4+ T cell transfer. Stomach and small and large intestines were collected after perfusion (n = 3–4 per group). ND, not detected. (D) Pathological analysis of stomach in mice with stress condition only (SD+ MOG-T-) and pathogenic CD4+ T cell transfer under stress condition (SD+ MOG-T+) 10 days after pathogenic CD4+ T cell transfer (n = 3 per group). (E) Pathological analysis of stomach and small intestine of mice with no treatment (SD- MOG-T-), stress condition only (SD+ MOG-T-), pathogenic CD4+ T cell transfer only (SD- MOG-T+), and pathogenic CD4+ T cell transfer under stress condition (SD+ MOG-T+) 10 days after pathogenic CD4+ T cell transfer (n = 3 per group). Scale bars represent 100 μm. (F) Clinical scores, percentages of mortality, and bloody stool scores of mice with or without lansoprazol treatment after pathogenic CD4+ T cell transfer and stress condition (n = 3–5 per group). Percentages of mortality and bloody stool score were evaluated 10 days after pathogenic CD4+ T cell transfer. (G) Plasma potassium levels in mice with no treatment (SD- MOG-T-), stress condition only (SD+ MOG-T-), pathogenic CD4+ T cell transfer only (SD- MOG-T+), and pathogenic CD4+ T cell transfer under stress condition (SD+ MOG-T+) 10 days after pathogenic CD4+ T cell transfer (n = 4–5 per group). Mean scores ± SEM are shown. Statistical significance was determined by ANOVA tests. Statistical significance is denoted by asterisks (*p<0.05, **p<0.01, ***p<0.001). ND, not detected. Experiments were performed at least three times; representative data are shown.
Figure 2—figure supplement 1
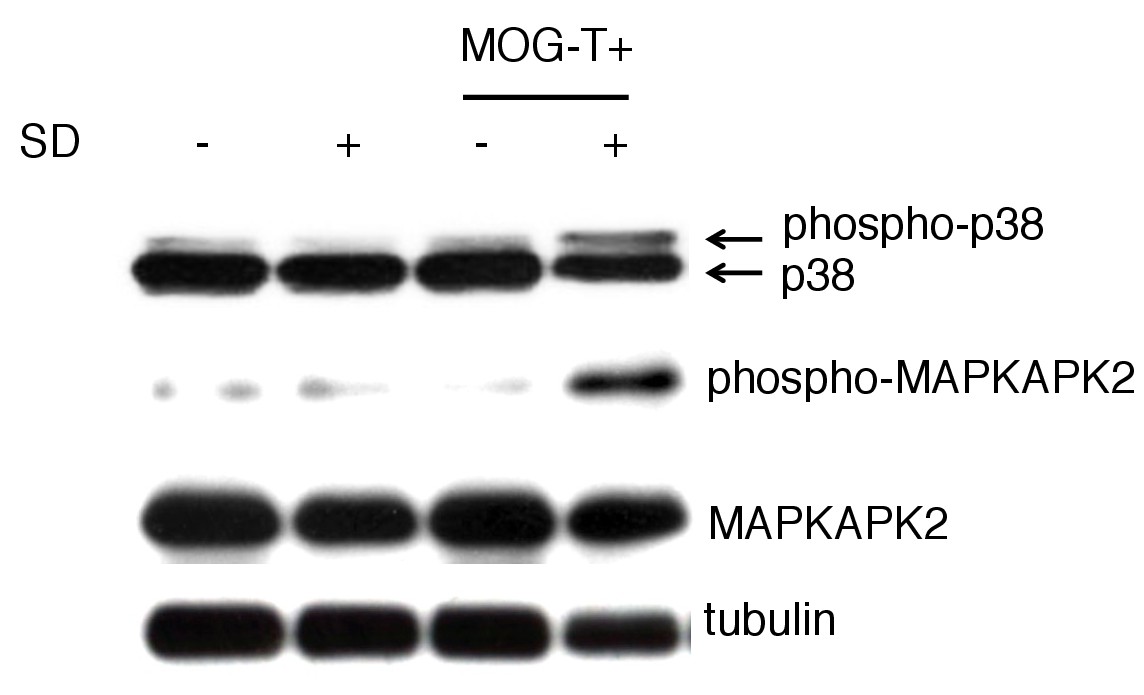
The phosphorylated p38 and phosphorylated MAPKAPK 2 levels were significantly higher in gastric mucosa of mice with pathogenic CD4+ T cell transfer under stress condition.
The gastric mucosa was isolated from the mice under stress condition 10 days after pathogenic CD4+ T cell transfer. The phosphorylated p38 and phosphorylated MAPKAPK 2 levels were detected by western blot.Experiments were performed at least three times; representative data are shown.
Figure 2—figure supplement 2
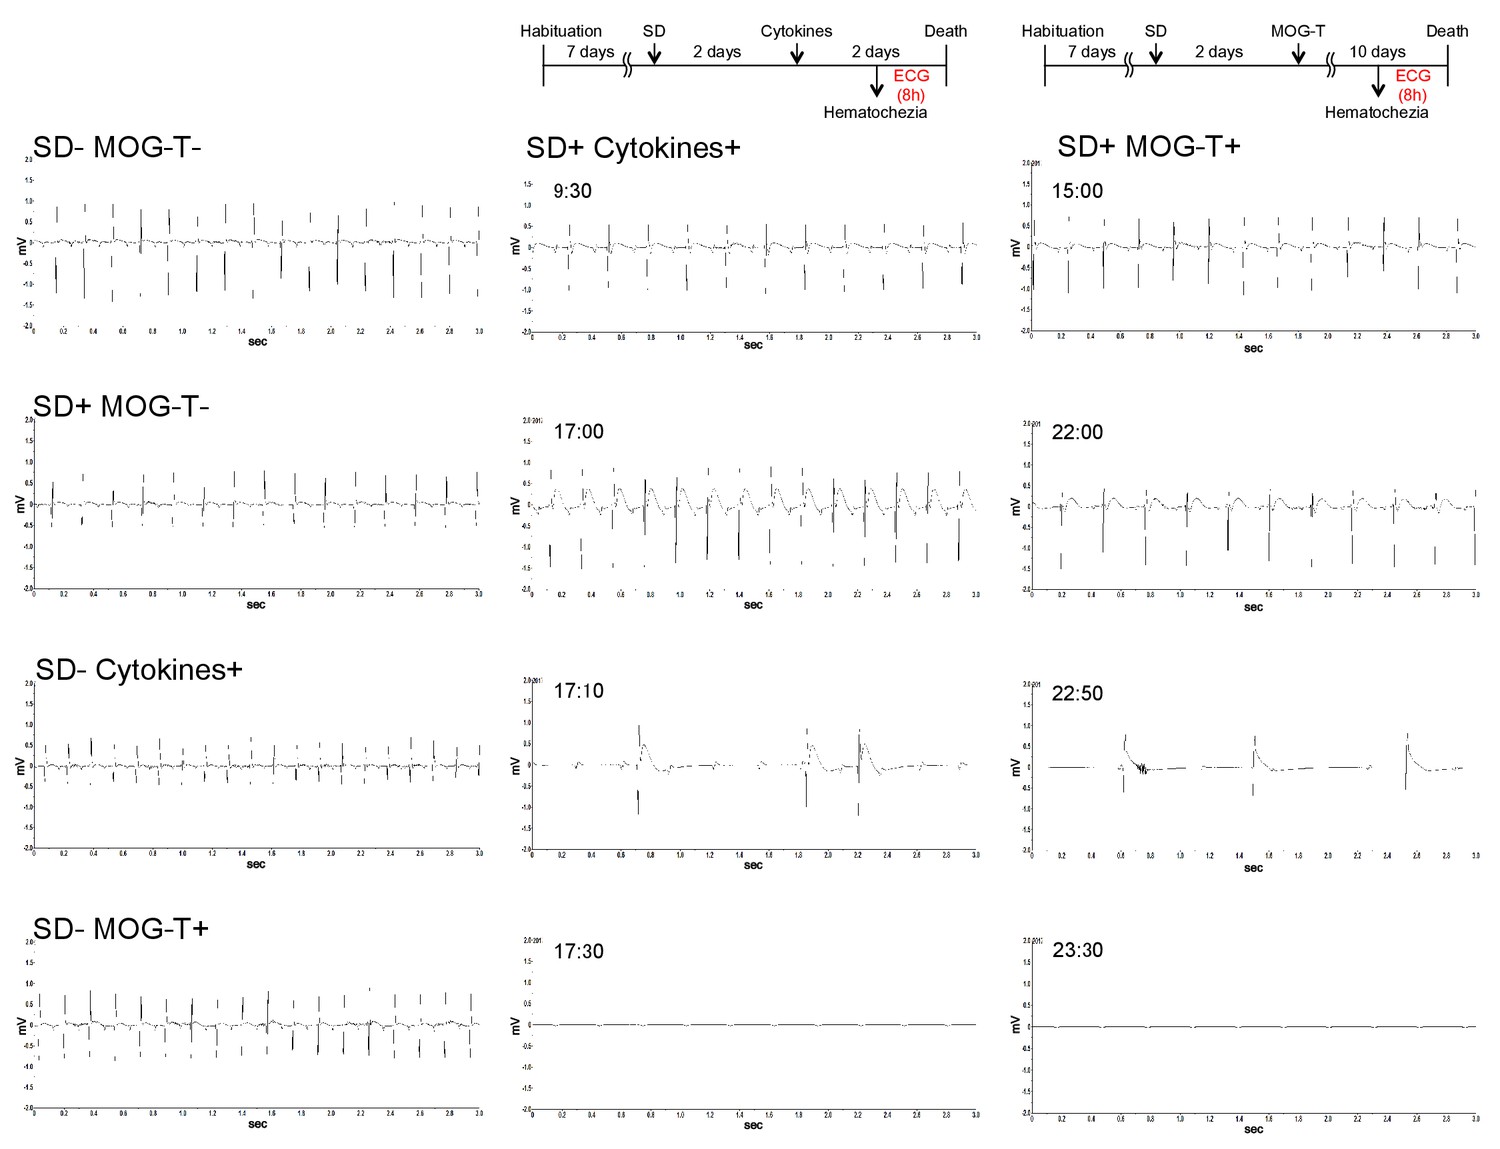
Heart failure was induced in mice with pathogenic CD4+ T cell transfer under stress condition.
Recording charts display ECG activity in mice with no treatment (Normal), stress condition (sleep disorder stress) only (SD+), MOG-pathogenic CD4+ T cell transfer only (MOG-T+), MOG-pathogenic CD4+ T cell transfer under stress condition (SD+ MOG-T+), cytokines microinjection only (Cytokines+), and cytokines microinjection under stress condition (SD+ Cytokines+). The data was shown for 8hs before the death in SD+ Cytokines+ groups and SD+ MOG-T+ groups. And the measurements of other groups were also conducted at the same time. Experiments were performed at least three times; representative data are shown.
Figure 3 with 3 supplements

Brain micro-inflammation was developed at specific vessels of the boundary area of the third ventricle region, thalamus, and dentate gyrus after pathogenic CD4+ T cell transfer under stress condition.
(A) Immunohistochemical staining for CD4 and MHC class II in the L5 cord of mice in the presence or absence of stress condition (SD) 5 days after pathogenic CD4+ T cell transfer (n = 3 per group). (right) Quantification of the histological analysis. Number of cells per picture (10x). (B) Immunohistochemical staining for CD4 and MHC class II at specific vessels of the boundary area of the third ventricle region, thalamus, and dentate gyrus in mice with or without stress condition (SD) in the presence of T cell transfer (n = 3 per group). (right) Quantification of the histological analysis. Number of cells per picture (10x). (C) Numbers of CD4+ T cells and MHC class IIhiCD11b+ cells in different brain regions of mice with no treatment (SD- MOG-T-), stress condition only (SD+ MOG-T-), pathogenic CD4+ T cell transfer only (SD- MOG-T+), and pathogenic CD4+ T cell transfer under stress condition (SD+ MOG-T+) 10 days after pathogenic CD4+ T cell transfer (n = 3–4 per group). Mean scores ± SEM are shown. (D) Numbers of microglia and monocytes in the hippocampi and interbrains area of tamoxifen-treated CX3CR1 CreER ROSA26-TdTomato mice 10 days after pathogenic CD4+ T cell transfer (n = 4–5 per group). Mean scores ± SEM are shown. Statistical significance was determined by ANOVA tests. Statistical significance is denoted by asterisks (*p<0.05, **p<0.01, ***p<0.001). Experiments were performed at least three times; representative data are shown.
Figure 3—figure supplement 1

Pathogenic CD4+ T cells and MHC class II+ cells accumulated at the specific vessels but not L5 cord with or without lansoprazol treatment.
(A) Immunohistochemical staining for CD4 and MHC class II in the L5 cord of mice with or without lansoprazol treatment after pathogenic CD4+ T cell transfer and stress condition. (B) Immunohistochemical staining for CD4 and MHC class II at specific vessels of the boundary area of the third ventricle region, thalamus, and dentate gyrus of mice with or without lansoprazol treatment after pathogenic CD4+ T cell transfer and stress condition. (C) Quantification of the histological analysis. Number of cells per picture (10x). (top) MHC class II+ cells. (bottom) CD4+ T cells. (n = 3 per group). (D) Clinical scores of mice with pathogenic CD4+ T cell transfer with or without lansoprazol treatment (n = 4–5 per group). Immunohistochemical staining for CD4 and MHC class II in the L5 cord of mice with or without lansoprazol treatment after pathogenic CD4+ T cell transfer. Quantification of the histological analysis. Number of cells per picture (10x). (top) CD4+ T cells. (bottom) MHC class II+ cells. Mean scores ± SEM are shown. Statistical significance was determined by ANOVA tests. Statistical significance is denoted by asterisks (**p<0.01, ***p<0.001). Experiments were performed at least three times; representative data are shown.
Figure 3—figure supplement 2
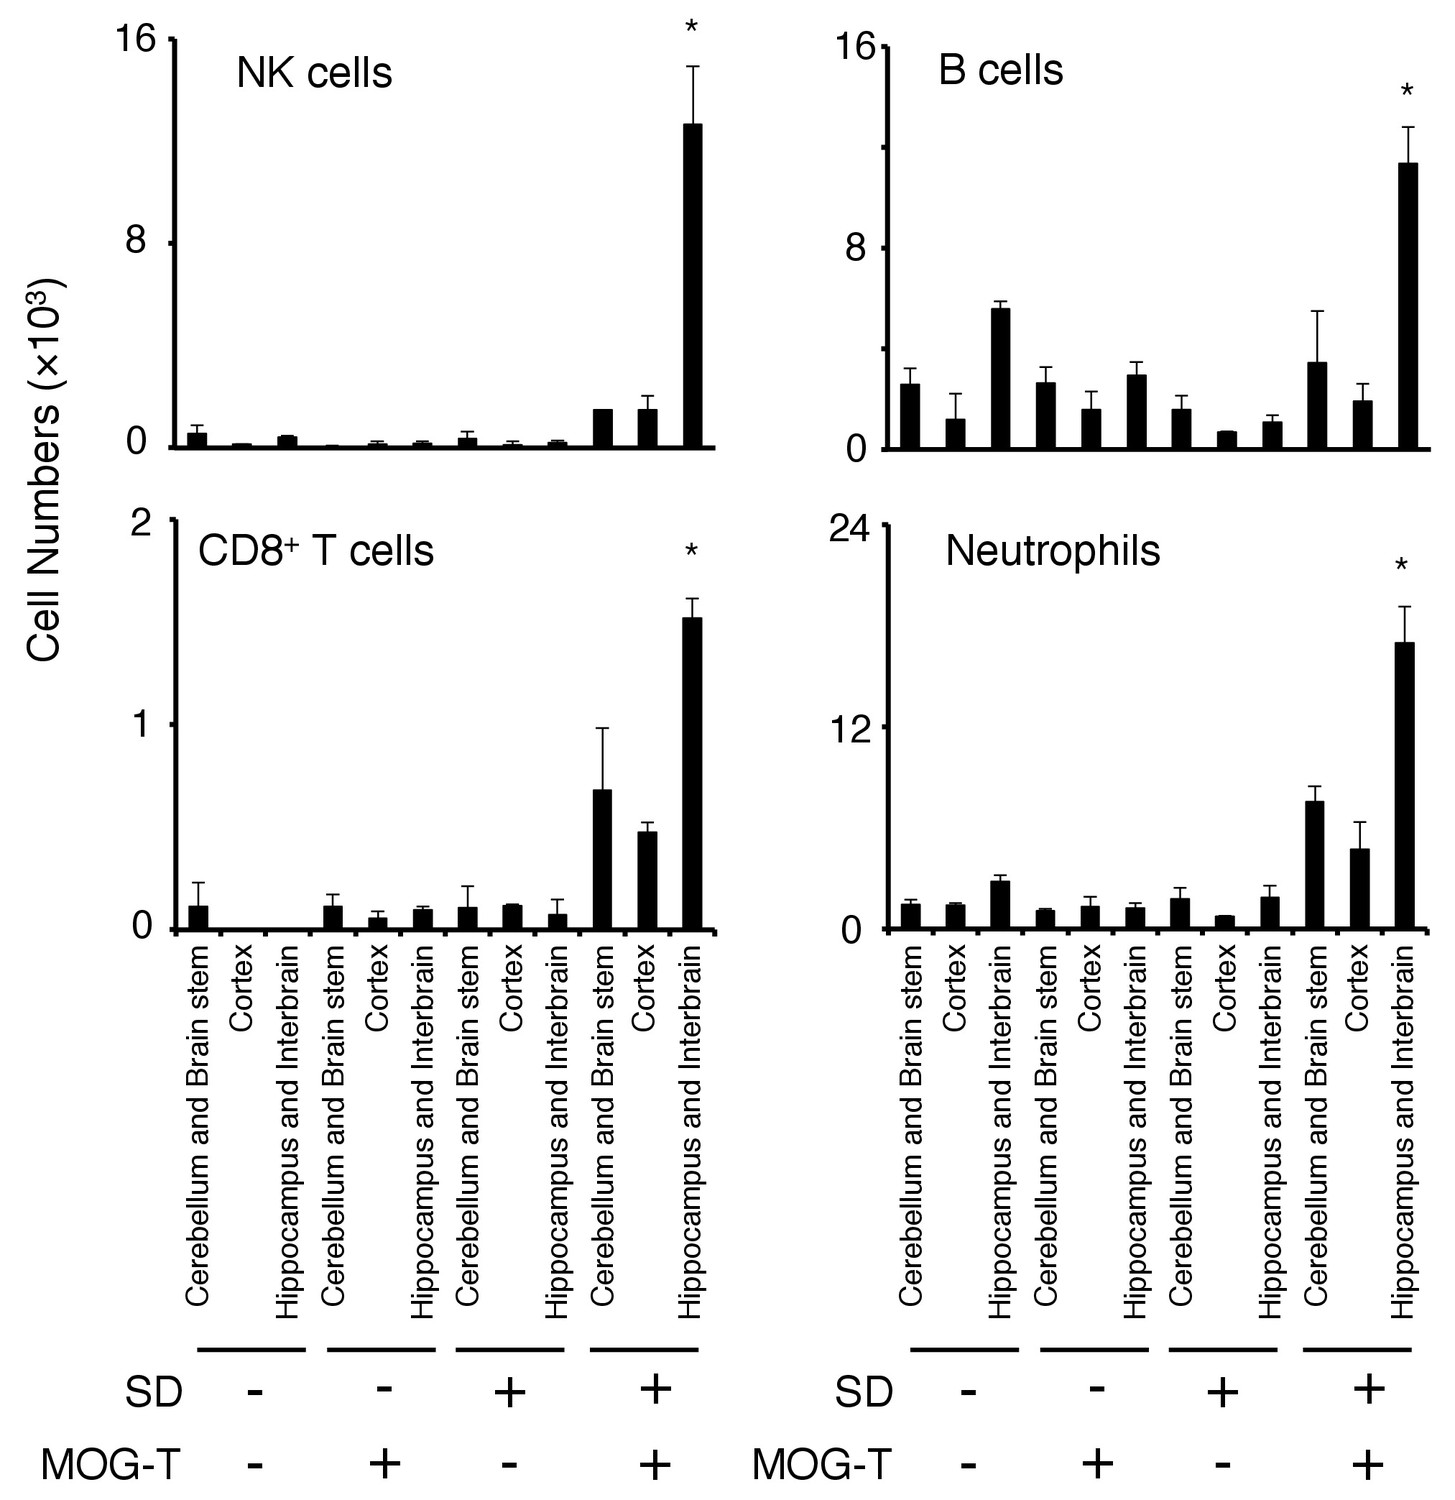
Various immune cells had accumulated at the specific vessels in mice after pathogenic CD4+ T cell transfer under stress condition.
Numbers of NK cells, B cells, CD8+ T cells and neutrophils in different brain regions of mice with no treatment (SD- MOG-T-), sleep disorder (SD) stress condition only (SD+ MOG-T-), pathogenic CD4+ T cell transfer only (SD- MOG-T+), and pathogenic CD4+ T cell transfer under stress condition (SD+ MOG-T+) 10 days after pathogenic CD4+ T cell transfer (n = 3–4 per group). Mean scores ± SEM are shown. Statistical significance was determined by ANOVA tests. Statistical significance is denoted by asterisks (*p<0.05). Experiments were performed at least three times; representative data are shown.
Figure 3—figure supplement 3
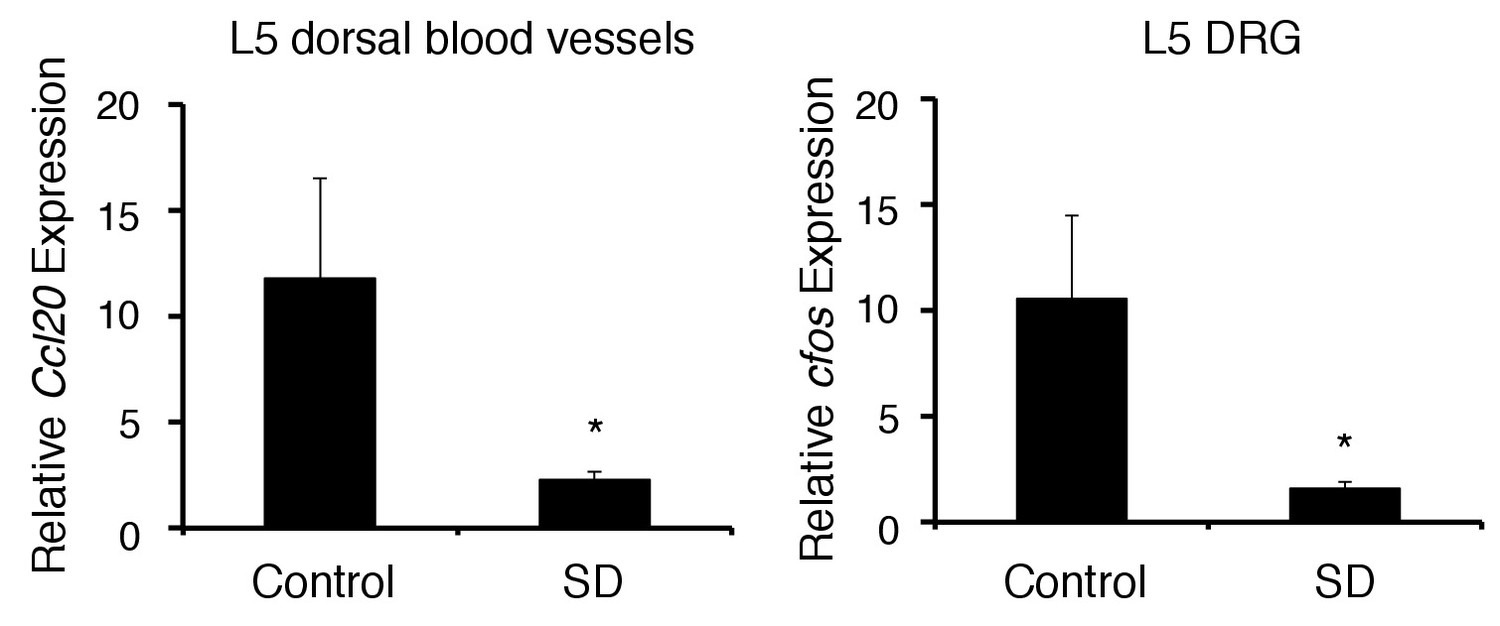
The chronic stress condition reduced CCL20 expression at L5 dorsal blood vessels and cfos expression in L5 DRG.
CCL20 mRNA expression at L5 dorsal blood vessels and cfos mRNA expression in L5 DRG were examined with (SD) or without (control) chronic stress condition (n = 3–5 per group). Mean scores ± SEM are shown. Statistical significance was determined by ANOVA tests. Statistical significance is denoted by asterisks (*p<0.05). Experiments were performed at least three times; representative data are shown.
Figure 4 with 5 supplements
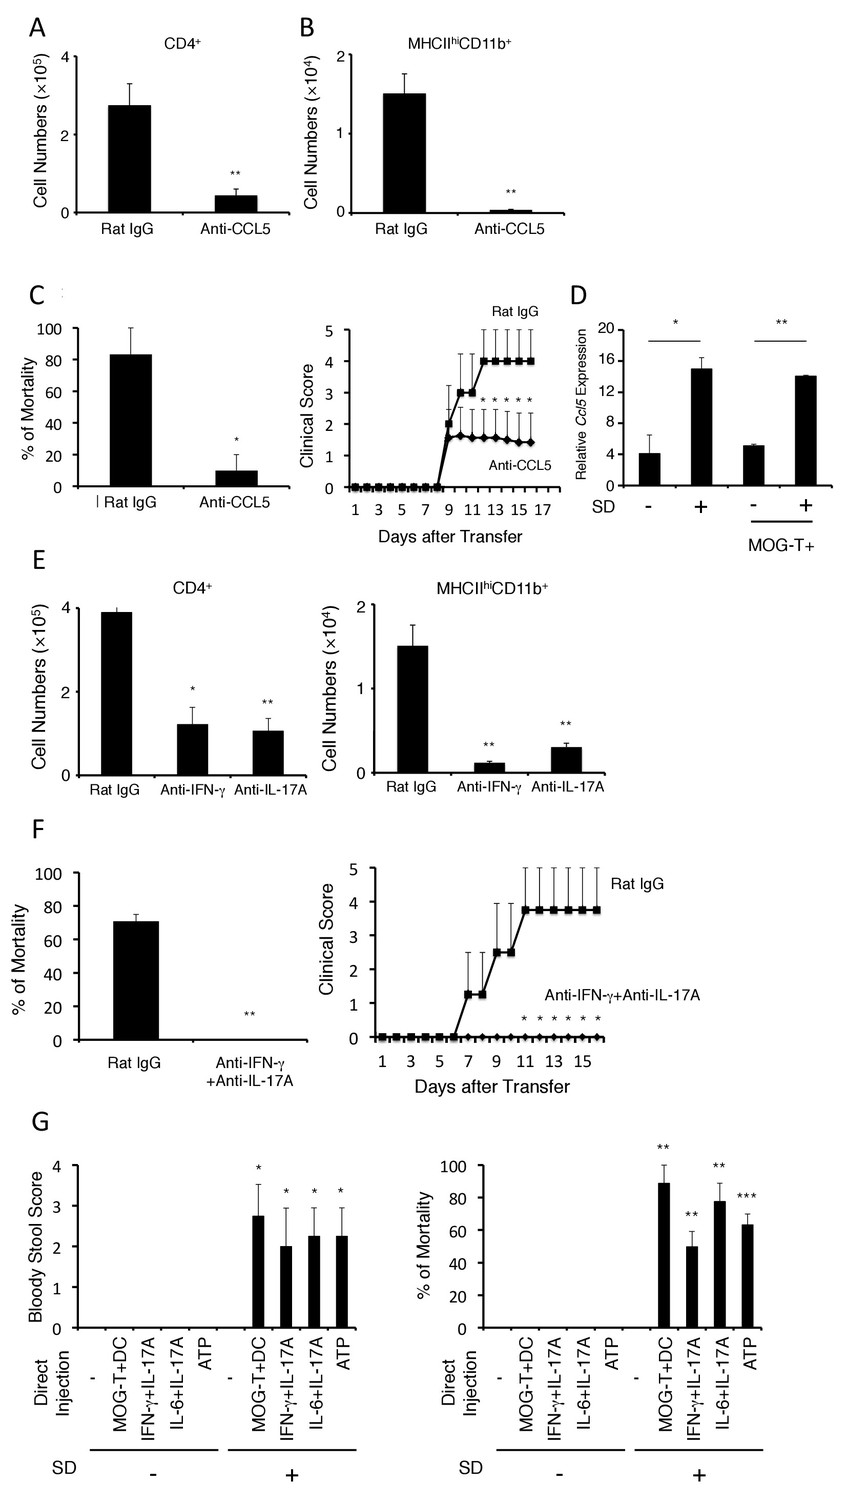
The development of brain micro-inflammation at specific vessels in mice with pathogenic CD4+ T cell transfer under stress condition is dependent on CCL5, IL-17, and IFN-γ.
(A and B) Numbers of CD4+ T cells and MHC class IIhiCD11b+ cells in the hippocampi and interbrains of mice under stress condition in the presence or absence of anti-CCL5 antibody treatment 10 days after pathogenic CD4+ T cell transfer (n = 4–5 per group). (C) Percentages of mortality and clinical scores of mice under stress condition in the presence or absence of anti-CCL5 treatment (n = 3–5 per group). (D) CCL5 mRNA expression at specific vessels of the boundary area of the third ventricle region, thalamus, and dentate gyrus in mice with no treatment (SD- MOG-T-), stress condition only (SD+ MOG-T-), pathogenic CD4+ T cell transfer only (SD- MOG-T+), and pathogenic CD4+ T cell transfer under stress condition (SD+ MOG-T+) 4 days after pathogenic CD4+ T cell transfer (n = 3–5 per group). (E) Numbers of CD4+ T cells and MHC class IIhiCD11b+ cells in the hippocampi and interbrain area of mice under stress condition in the presence or absence of anti-IFN-γ antibody, anti-IL-17A antibody, or control 10 days after pathogenic CD4+ T cell transfer (n = 4–5 per group). (F) Percentages of mortality and clinical scores of mice with pathogenic CD4+ T cell transfer under stress condition in the presence or absence of anti-IFN-γ plus anti-IL-17A antibody treatment (n = 3–5 per group). (G) Bloody stool scores and percentages of mortality in mice under stress condition 2 days after microinjection of MOG-T plus DC, IFN-γ and IL-17A, or IL-6 and IL-17A at specific vessels of the boundary area of the third ventricle region, thalamus, and dentate gyrus (n = 3–5 per group). Mean scores ± SEM are shown. Statistical significance was determined by Student's t tests (A, B) and ANOVA tests (C-G). Statistical significance is denoted by asterisks (*p<0.05, **p<0.01). Experiments were performed at least three times; representative data are shown.
Figure 4—figure supplement 1
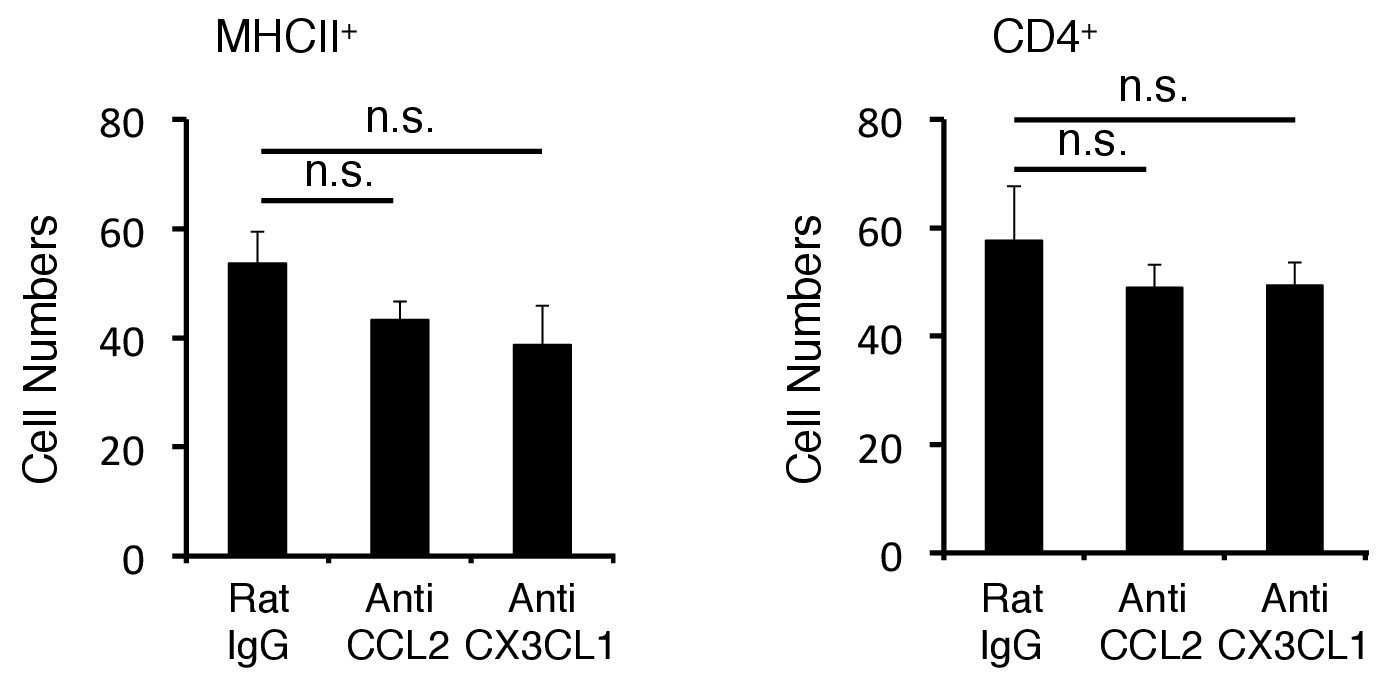
Anti-CCL2 and Anti-CX3CL1 antibody had not suppressed the accumulation of pathogenic CD4+ T cells and MHC class IIhiCD11b+ cells at the specific vessels.
Quantification of the histological analysis. Number of cells per picture (10x). (left) MHC class II+ cells. (right) CD4+ T cells. Mean scores ± SEM are shown. Statistical significance was determined by ANOVA tests. (n.s.: not significant). Experiments were performed at least three times; representative data are shown.
Figure 4—figure supplement 2

The chronic stress condition induced CCL5 expression at the specific blood vessels but not acute stress condition.
CCL5 mRNA expression at specific vessels of the boundary area of the third ventricle region, thalamus, and dentate gyrus in mice with no treatment, chronic stress condition only, acute stress condition only (n = 3–5 per group). Mean scores ± SEM are shown. Statistical significance was determined by ANOVA tests. Statistical significance is denoted by asterisks (*p<0.05). Experiments were performed at least three times; representative data are shown.
Figure 4—figure supplement 3
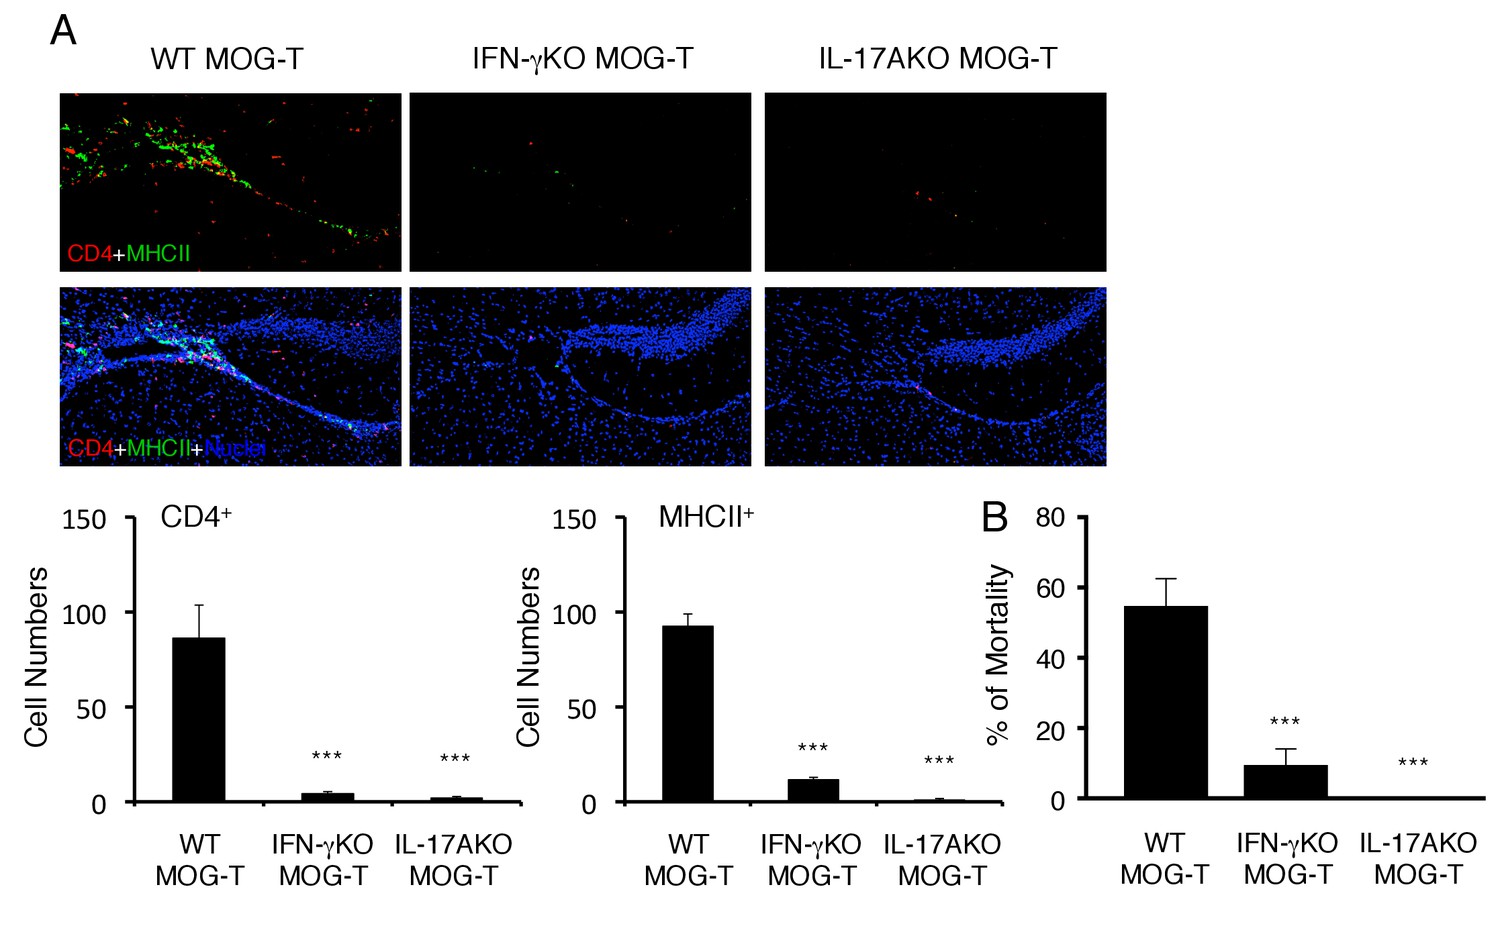
Pathogenic CD4+ T cells derived from IL-17A deficient or IFN-γ deficient mice inhibited the severe phenotypes.
(A) Immunohistochemical staining for CD4 and MHC class II at specific vessels of the boundary area of the third ventricle region, thalamus, and dentate gyrus of mice with IL-17A deficient or IFN-γ deficient pathogenic CD4+ T cell transfer under stress condition (n = 3–5 per group). (right) Quantification of the histological analysis. Number of cells per picture (10x). (B) Percentages of mortality of mice with IL-17A deficient or IFN-γ deficient pathogenic CD4+ T cell transfer under stress condition (n = 3–5 per group). Mean scores ± SEM are shown. Statistical significance was determined by ANOVA tests. Statistical significance is denoted by asterisks (***p<0.001). Experiments were performed at least three times; representative data are shown.
Figure 4—figure supplement 4
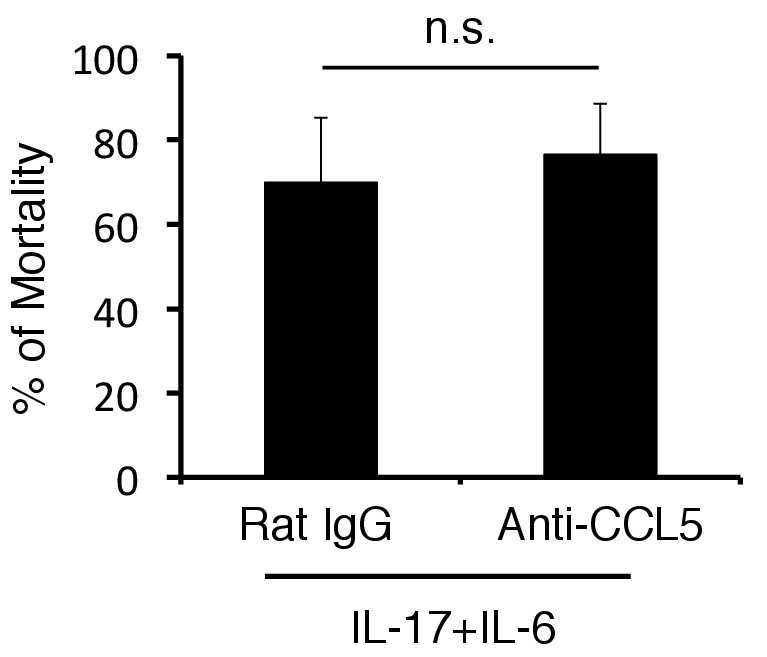
The mortality was not affected by anti-CCL5 antibody treatment in cytokines-microinjected mice under stress condition.
Percentages of mortality in mice under stress condition 2 days after microinjection of IL-6 and IL-17A at specific vessels of the boundary area of the third ventricle region, thalamus, and dentate gyrus with or without anti-CCL5 antibody treatment. Mean scores ± SEM are shown. Statistical significance was determined by ANOVA tests. (n.s.: not significant). Experiments were performed at least three times; representative data are shown.
Figure 4—figure supplement 5
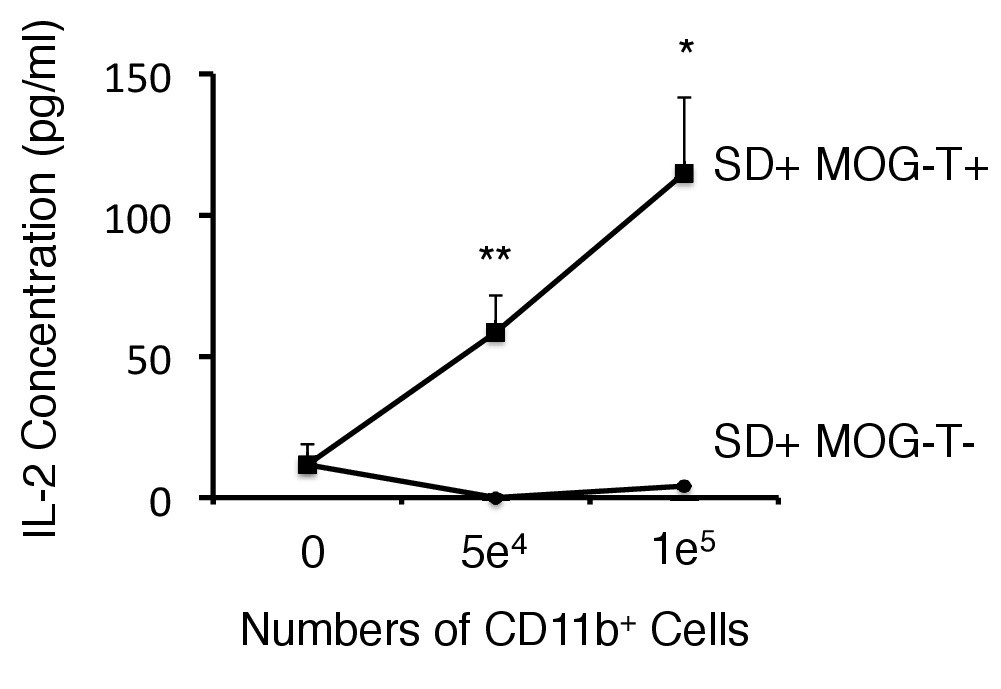
CD11b+ cells isolated from mice with pathogenic CD4+ T cell transfer under stress condition have the potential of antigen presentation to CD4+ T cells without peptide addition.
Co-culture supernatants of naïve 2D2 TCR transgenic T cells and CD11b+ cells isolated from SD+ MOG-T+ mice were collected and assessed using an ELISA specific for mouse IL-2. (n = 2 per group). Mean scores ± SEM are shown. Statistical significance was determined by ANOVA tests. Statistical significance is denoted by asterisks (*p<0.05, **p<0.01). Experiments were performed at least three times; representative data are shown.
Figure 5 with 2 supplements
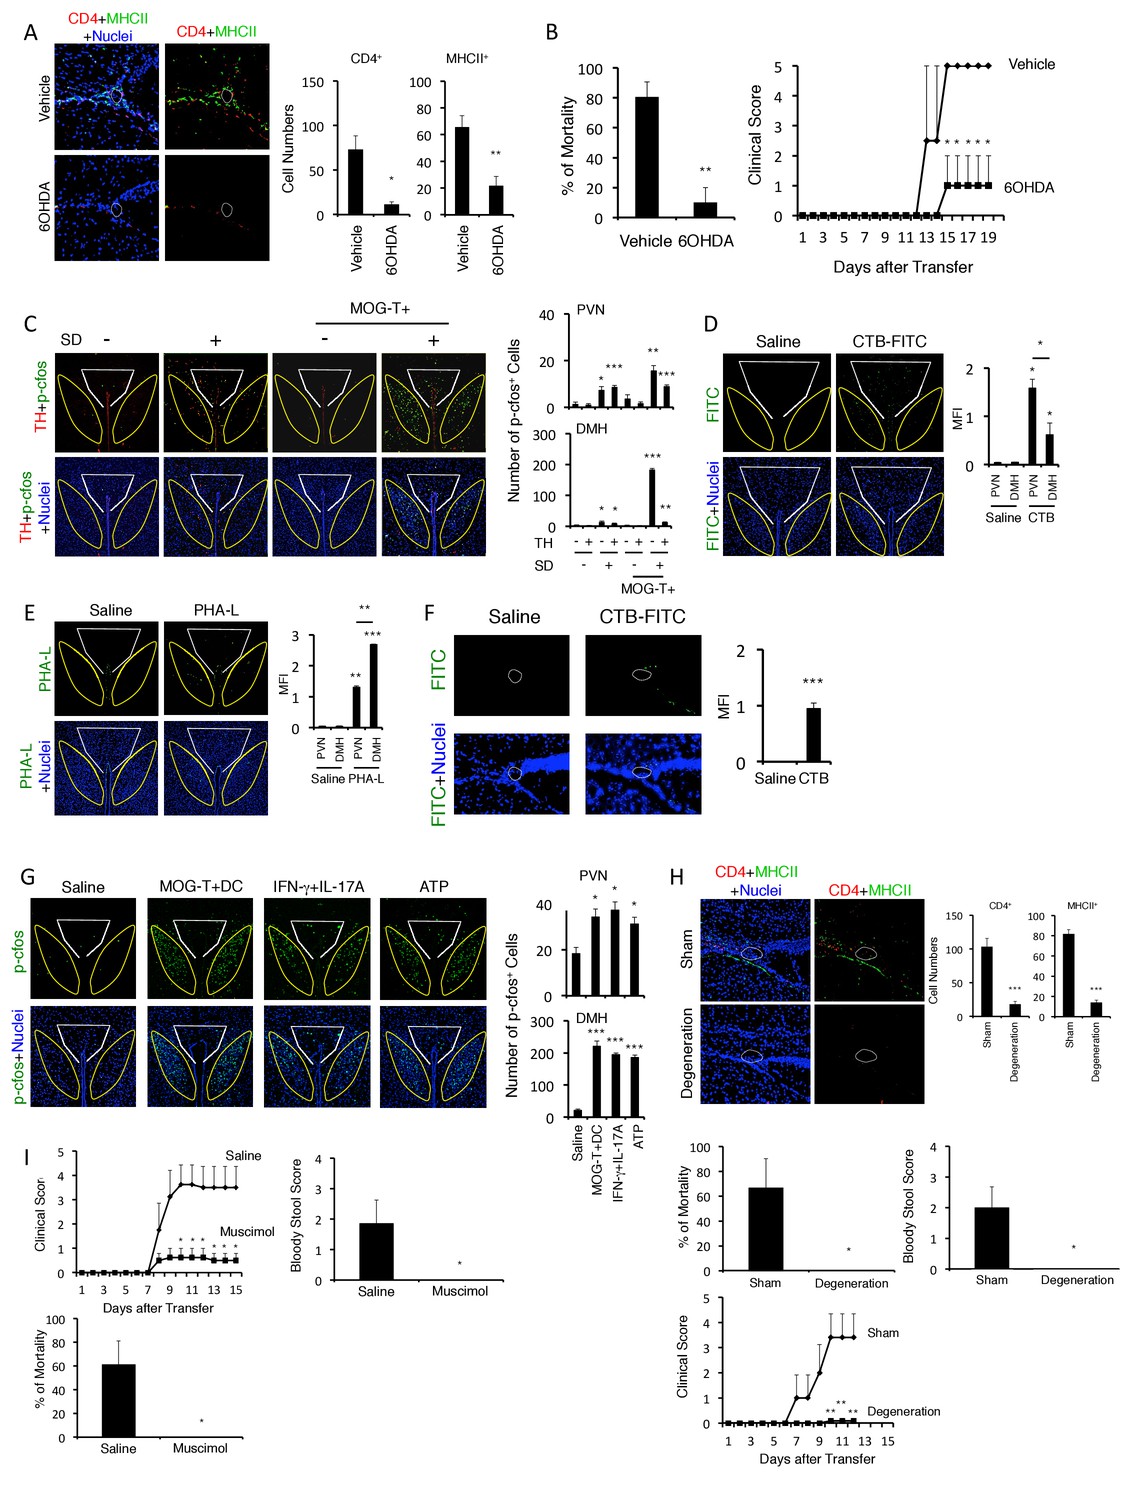
Neural activation of DMH following brain micro-inflammation is critical for the development of severe gastrointestinal failure.
(A) Immunohistochemical staining for CD4 and MHC class II at specific vessels of the boundary area of the third ventricle region, thalamus, and dentate gyrus in mice under stress condition in the presence or absence of 6-OHDA microinjection at the specific vessels 10 days after pathogenic CD4+ T cell transfer. White polygon: the specific blood vessels of the boundary area of the third ventricle region, thalamus, and dentate gyrus. (right) Quantification of the histological analysis (n = 3 per group). Number of cells per picture (10x). (B) Percentages of mortality and clinical scores of mice in the presence or absence of microinjection of 6-OHDA at the specific vessels 10 days after pathogenic CD4+ T cell transfer (n = 3–5 per group). (C) Immunohistochemical staining for phospho-cfos and TH in the PVN and DMH of mice with no treatment (SD- MOG-T-), stress condition only (SD+ MOG-T-), pathogenic CD4+ T cell transfer only (SD- MOG-T+), and pathogenic CD4+ T cell transfer under stress condition (SD+ MOG-T+) 10 days after pathogenic CD4+ T cell transfer. White polygon: PVN, Yellow polygon: DMH. (right) Quantification of the histological analysis (n = 3–5 per group). Number of cells per picture (10x). (D) FITC-conjugated cholera toxin B in the PVN and DMH of C57BL/6 mice with or without microinjection of FITC-conjugated cholera toxin B at the specific vessels 5 days after pathogenic CD4+ T cell transfer. White polygon: PVN, Yellow polygon: DMH. (right) Quantification of the histological analysis (n = 3–5 per group). (E) PHA-L in the PVN and DMH of C57BL/6 mice with or without microinjection of PHA-L at the specific vessels 5 days after pathogenic CD4+ T cell transfer. White polygon: PVN, Yellow polygon: DMH. (right) Quantification of the histological analysis (n = 3–5 per group). (F) FITC-conjugated cholera toxin B at the specific vessels of C57BL/6 mice with or without microinjection of FITC-conjugated cholera toxin B in the DMH 5 days after pathogenic CD4+ T cell transfer (n = 3–5 per group). (G) Immunohistochemical staining for phosphor-cfos in the PVN and DMH of mice under stress condition 2 days after microinjection of MOG-T plus DC, IFN-γ plus IL-17A, or ATP at the specific vessels of the boundary area of the third ventricle region, thalamus, and dentate gyrus. (right) Quantification of the histological analysis (n = 3 per group). Number of cells per picture (10x). White polygon: PVN, Yellow polygon: DMH. (H) Immunohistochemical staining for CD4 and MHC class II at the specific vessels of the boundary area of the third ventricle region, thalamus, and dentate gyrus of mice in the presence or absence of PVN and DMH unilateral ablation 10 days after pathogenic CD4+ T cell transfer. (right) Quantification of the histological analysis (n = 3–4 per group). Number of cells per picture (10x). Percentages of mortality of mice under stress condition in the presence or absence of the unilateral ablation 10 days after pathogenic CD4+ T cell transfer (degeneration). Clinical scores are also shown (n = 4–5 per group). (I) Percentages of mortality and clinical scores of mice in the presence or absence of microinjection of muscimol at DMH 5 days after pathogenic CD4+ T cell transfer (n = 3–5 per group). Mean scores ± SEM are shown. Statistical significance was determined by Student's t tests (A, F) and ANOVA tests (B-E, G-I). Statistical significance is denoted by asterisks (*p<0.05; **p<0.01; ***p<0.001). Experiments were performed at least three times; representative data are shown.
Figure 5—figure supplement 1

TH and pCREB signals were reduced in 6OHDA-mediated sympathectomized mice under stress.
Immunohistochemical staining at specific vessels of the boundary area of the third ventricle region, thalamus, and dentate gyrus for TH (tyrosine hydroxylase) and phospho-CREB in mice with pathogenic CD4+ T cell transfer under stress condition in the presence or absence of 6-OHDA treatment (n = 3 per group). White polygons: the specific vessels. Mean scores ± SEM are shown. Statistical significance was determined by ANOVA tests. Statistical significance is denoted by asterisks (**p<0.01, ***p<0.001). Experiments were performed at least three times; representative data are shown.
Figure 5—figure supplement 2
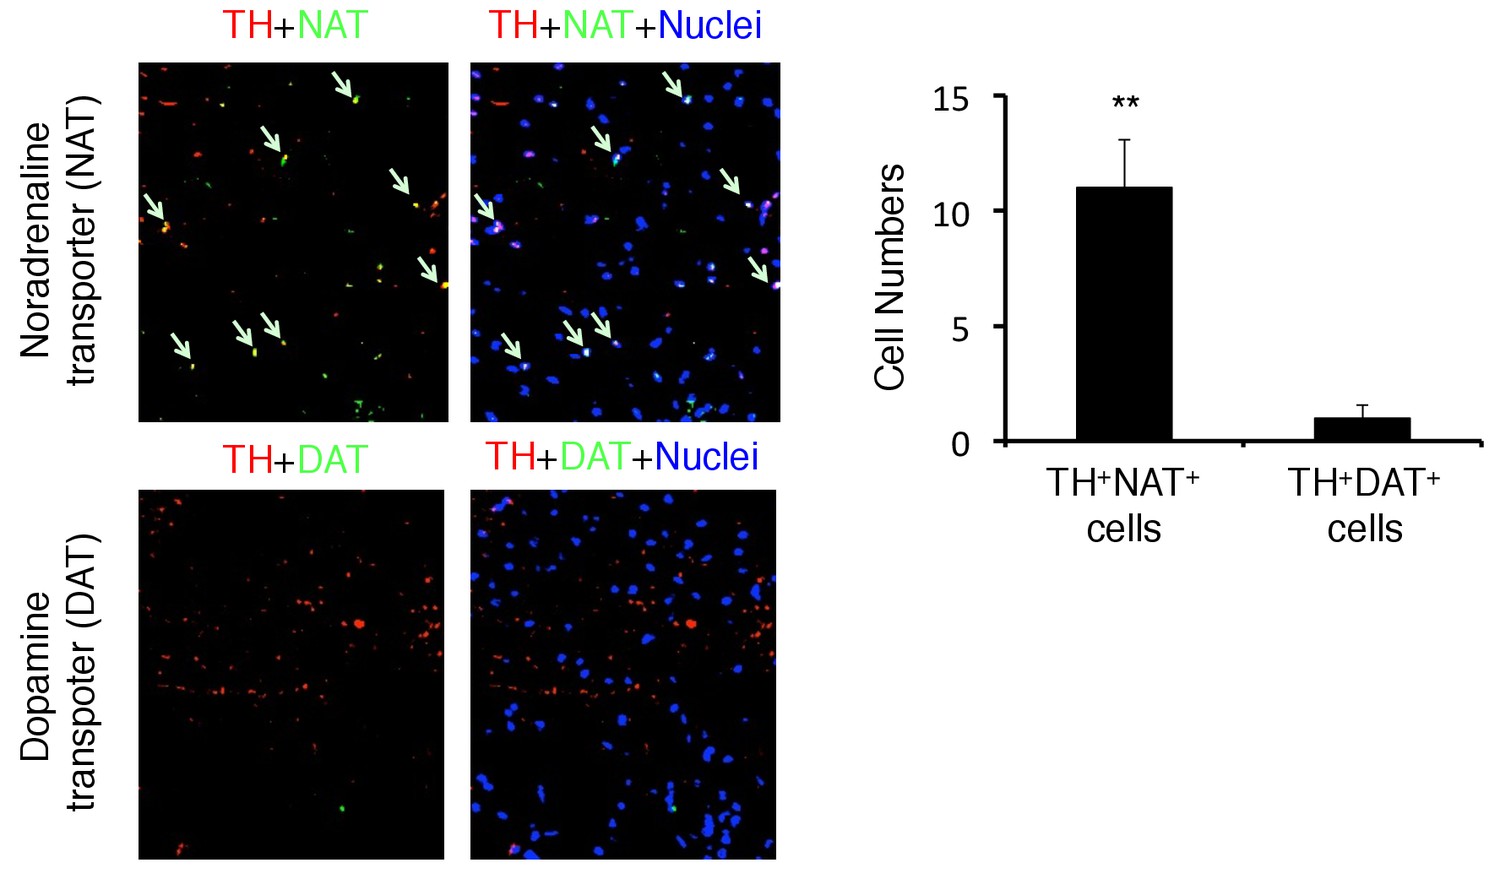
TH-positive neurons co-expressed noradrenaline transporter, but not dopamine transporter.
Immunohistochemical staining of the PVN for TH (tyrosine hydroxylase), NAT (noradrenaline transporter), and DAT (dopamine transporter) in C57BL/6 mice (n = 3 per group). Mean scores ± SD are shown. Statistical significance was determined by Student's t tests. Statistical significance is denoted by asterisks (**p<0.01). Experiments were performed at least three times; representative data are shown.
Figure 6 with 1 supplement

ATP induced at brain micro-inflammation sites causes severe gastrointestinal failure by activating DMH neurons.
(A) ATP expression from BC1 cells after stimulation with IL-6 and IL-17A. (B) Immunohistochemical staining for phospho-cfos at the PVN and DMH of mice with microinjection of IL-6 plus IL-17A under stress condition in the presence or absence of A438079 at specific vessels of the boundary area of the third ventricle region, thalamus, and dentate gyrus 2 days after microinjection. (right) Quantification of the histological analysis (n = 3 per group). Number of cells per picture (10x). White polygon: PVN, Yellow polygon: DMH. (C) Bloody stool scores and percentages of mortality of mice with direct injection of IL-6 plus IL-17A under stress condition in the presence or absence of A438079 at the specific vessels 2 days after microinjection (n = 3–5 per group). Mean scores ± SEM are shown. Statistical significance was determined by Student's t tests (A, B) and ANOVA tests (C). Statistical significance is denoted by asterisks (*p<0.05; **p<0.01; ***p<0.001). Experiments were performed at least three times; representative data are shown.
Figure 6—figure supplement 1
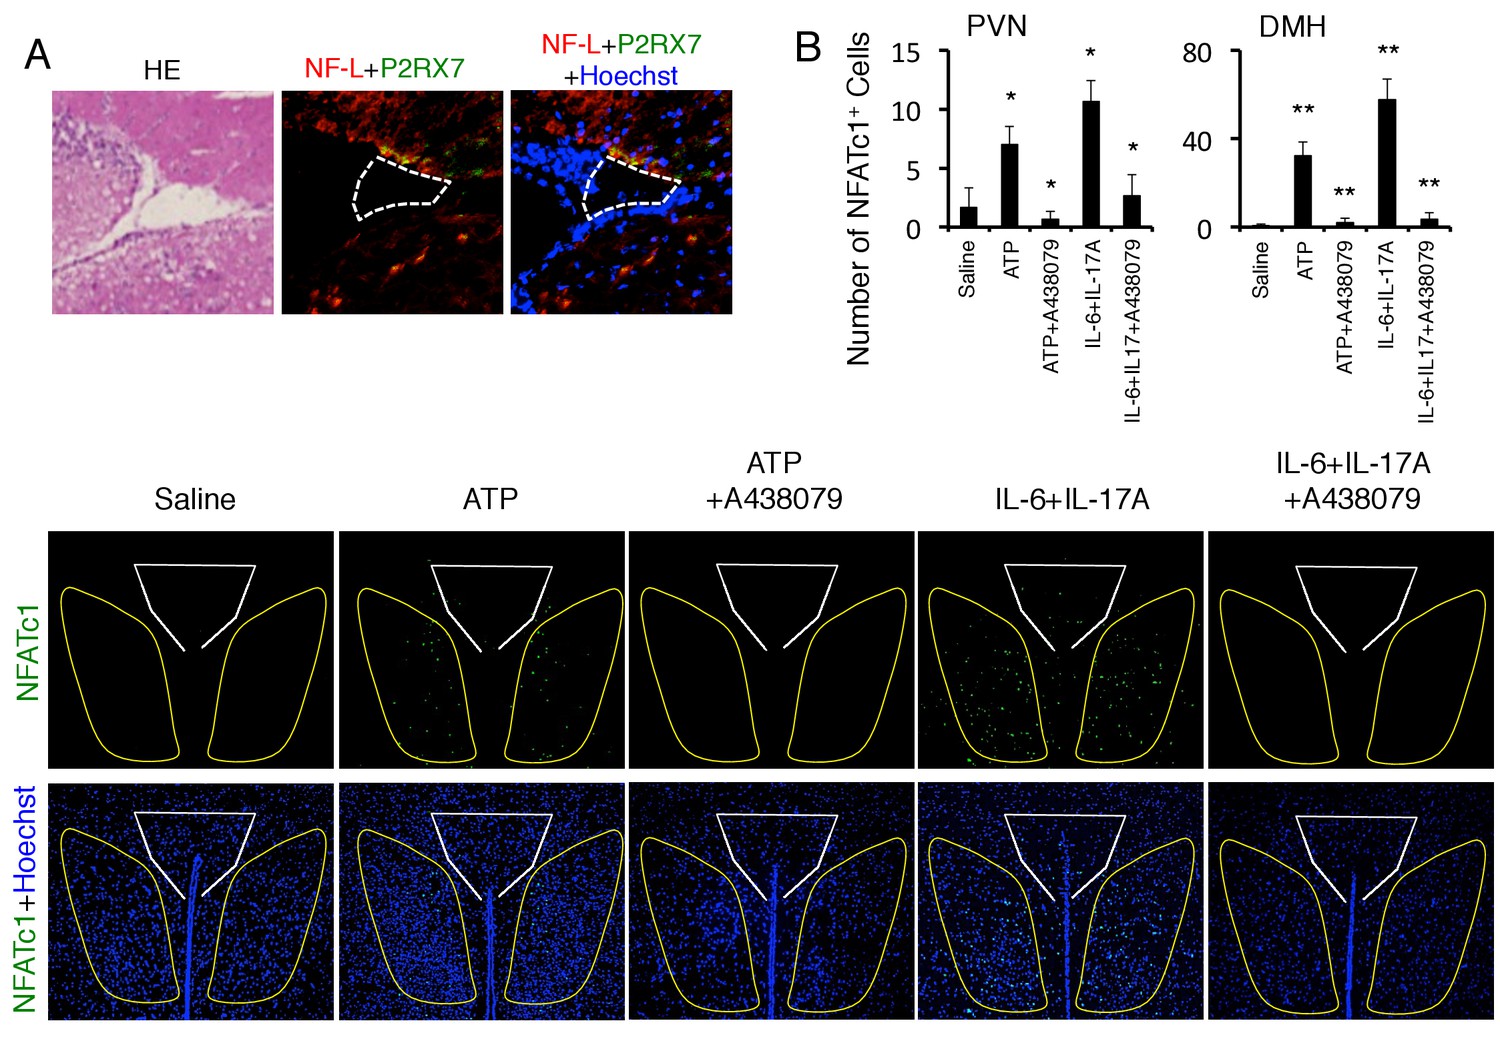
ATP activated the neurons in the DMH via P2RX7 receptor.
(A) Immunohistochemical staining for Neurofilament L and P2RX7 in the specific vessels (n = 3 per group). (Left) HE staining. White polygon: the specific blood vessels. (B) Immunohistochemical staining for NFATc1 in DMH and PVN of mice with microinjection of ATP or cytokines in the specific vessels of the boundary area of the third ventricle region, thalamus, and dentate gyrus with or without A438079 treatment (n = 3 per group). (Top) Quantification of the histological analysis. White polygon: PVN, Yellow polygon: DMH. Mean scores ± SEM are shown. Statistical significance was determined by ANOVA tests. Statistical significance is denoted by asterisks (*p<0.05, **p<0.01). Experiments were performed at least three times; representative data are shown.
Figure 7 with 1 supplement
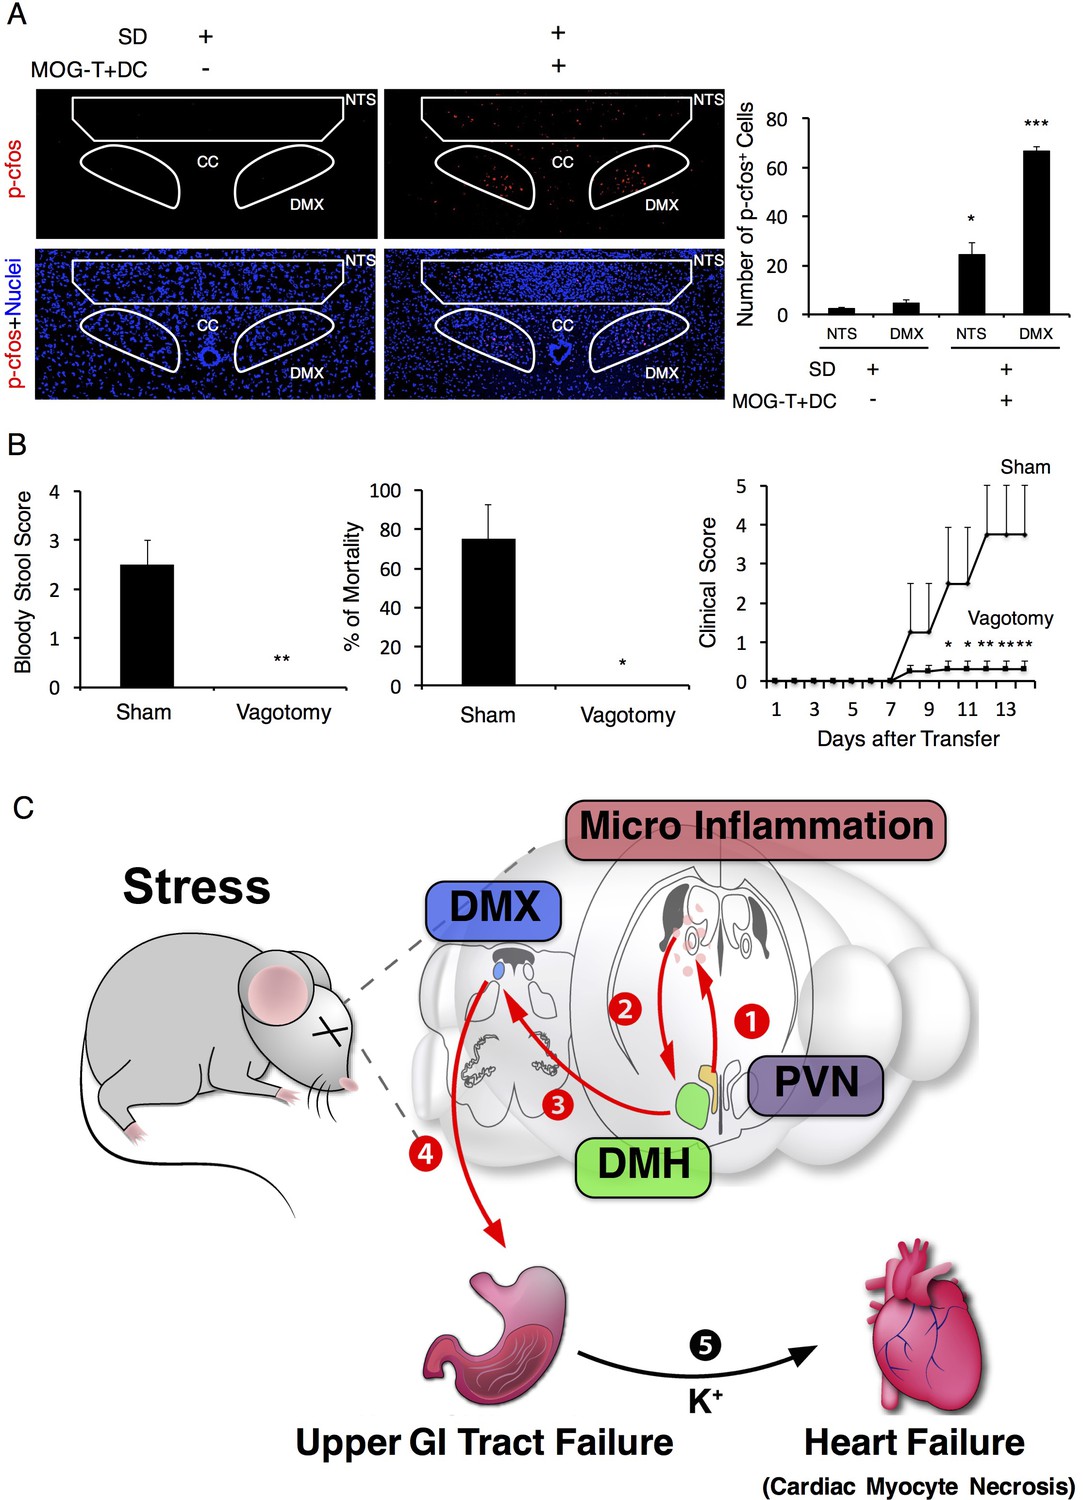
Vagal nerve activation induced by brain micro-inflammation under stress condition is critical for the development of severe gastrointestinal failure.
(A) Immunohistochemical staining for phospho-cfos in the DMX and NTS of mice under stress condition 2 days after the microinjection of MOG-T plus DC at specific vessels of the boundary area of the third ventricle region, thalamus, and dentate gyrus (n = 3 per group). (B) Bloody stool scores and percentages of mortality of mice under stress condition 2 days after microinjection of MOG-T plus DC at the specific vessels (n = 3–5 per group). Clinical scores are also shown (n = 4–5 per group). (C) Schematic figure of stress mediated brain micro-inflammation exacerbates gastrointestinal failure and heart failure. (1)The stress mediated PVN activation induced the micro-inflammation at the specific vessels of the boundary area of the third ventricle region, thalamus, and dentate gyrus, followed by (2 and 3) activation of the neurons in the DMH, DMX region and (4 and 5) finally exacerbated gastrointestinal failure and heart failure with cardiac myocyte necrosis. Mean scores ± SEM are shown. Statistical significance was determined by ANOVA tests. Statistical significance is denoted by asterisks (*p<0.05, **p<0.01, ***p<0.001). Experiments were performed at least three times; representative data are shown.
Figure 7—figure supplement 1
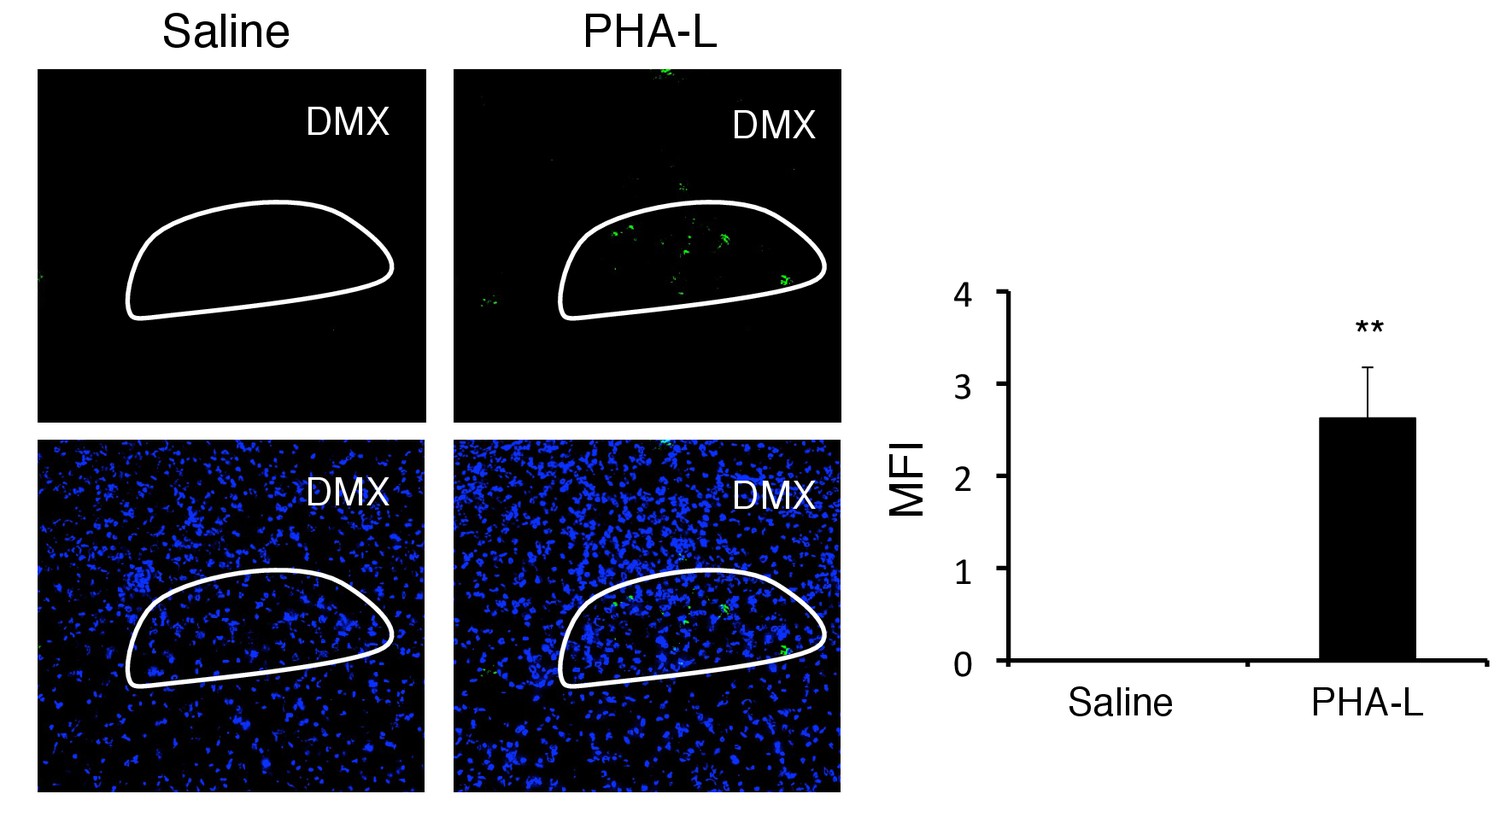
PHA-L-FITC after injection at the DMH reached the DMX.
PHA-L-FITC in the DMX of C57BL/6 mice with or without microinjection of PHA-L-FITC at the DMH 5 days. White line: DMX. (right) Quantification of the MFI (n = 3–5 per group). Mean scores ± SD are shown. Statistical significance was determined by Student's t tests. Statistical significance is denoted by asterisks (**p<0.01). Experiments were performed at least three times; representative data are shown.
Download links
A two-part list of links to download the article, or parts of the article, in various formats.
Downloads (link to download the article as PDF)
Open citations (links to open the citations from this article in various online reference manager services)
Cite this article (links to download the citations from this article in formats compatible with various reference manager tools)
Brain micro-inflammation at specific vessels dysregulates organ-homeostasis via the activation of a new neural circuit
eLife 6:e25517.
https://doi.org/10.7554/eLife.25517


