The expression of established cognitive brain states stabilizes with working memory development
- University of Pittsburgh, United States
- Center for the Neural Basis of Cognition, United States
Figures
Figure 1
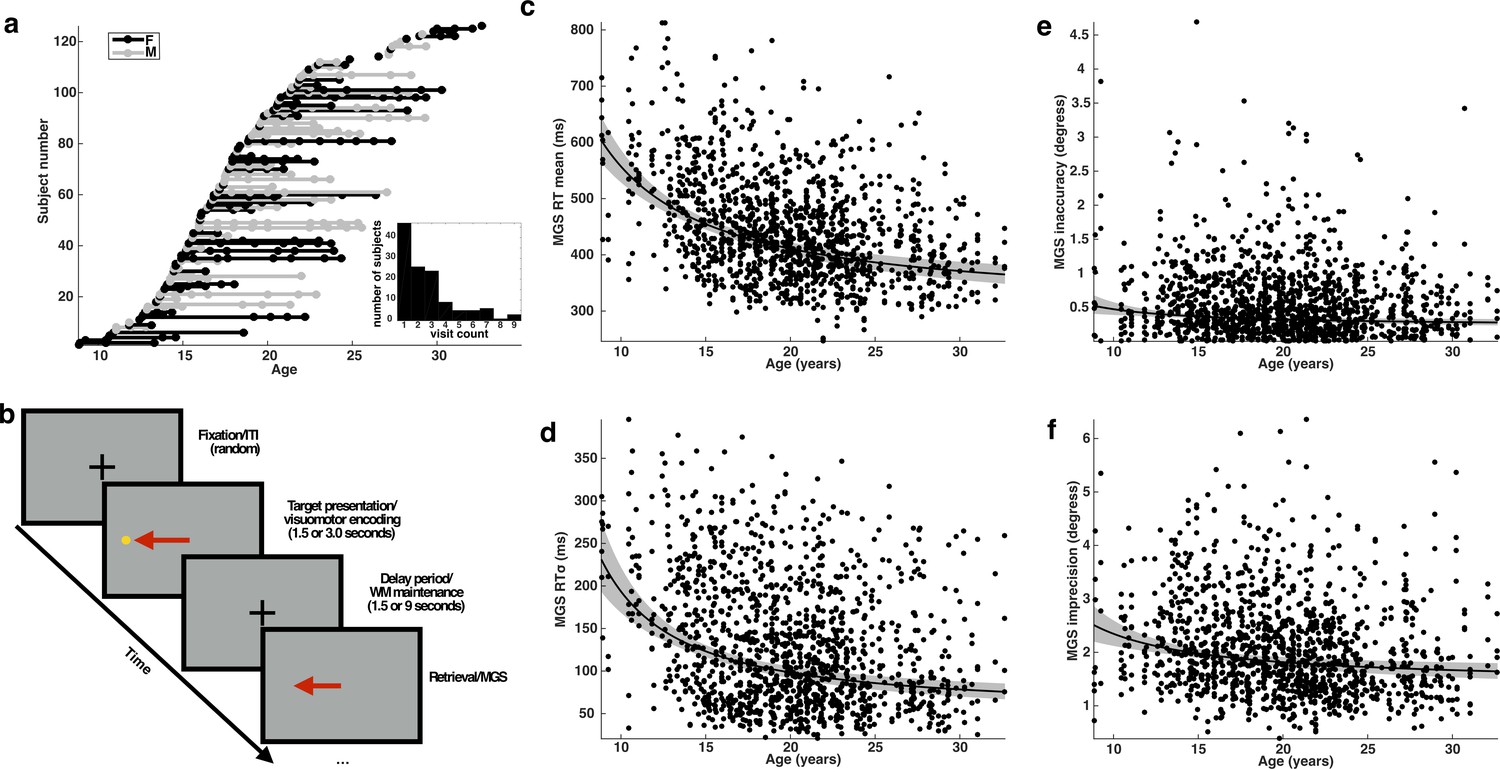
Subjects, task, and behavioral performance.
(a) The distribution of subjects included in our analyses. Each entry on the y-axis represents a unique subject. Each visit is indicated by a dot whose x-coordinate corresponds to the age of the subject at that visit. A solid line connects repeated sessions. Female subjects are rendered in black and males in gray. Inset histogram depicts the distribution of the number of single and return visits across subjects. (b) A schematic depiction of the variant of the memory-guided saccade task employed in our study. Developmental changes in behavioral performance for each task condition across age: (c) mean reaction time; (d) reaction time variability (standard deviation); (e) inaccuracy (average absolute value of SE); and (f) imprecision of memory-guided saccades (standard deviation of SE). Each black curve depicts the best fitting group-level age−1 trajectory. The gray envelope represents the 95% confidence bounds.
Figure 2
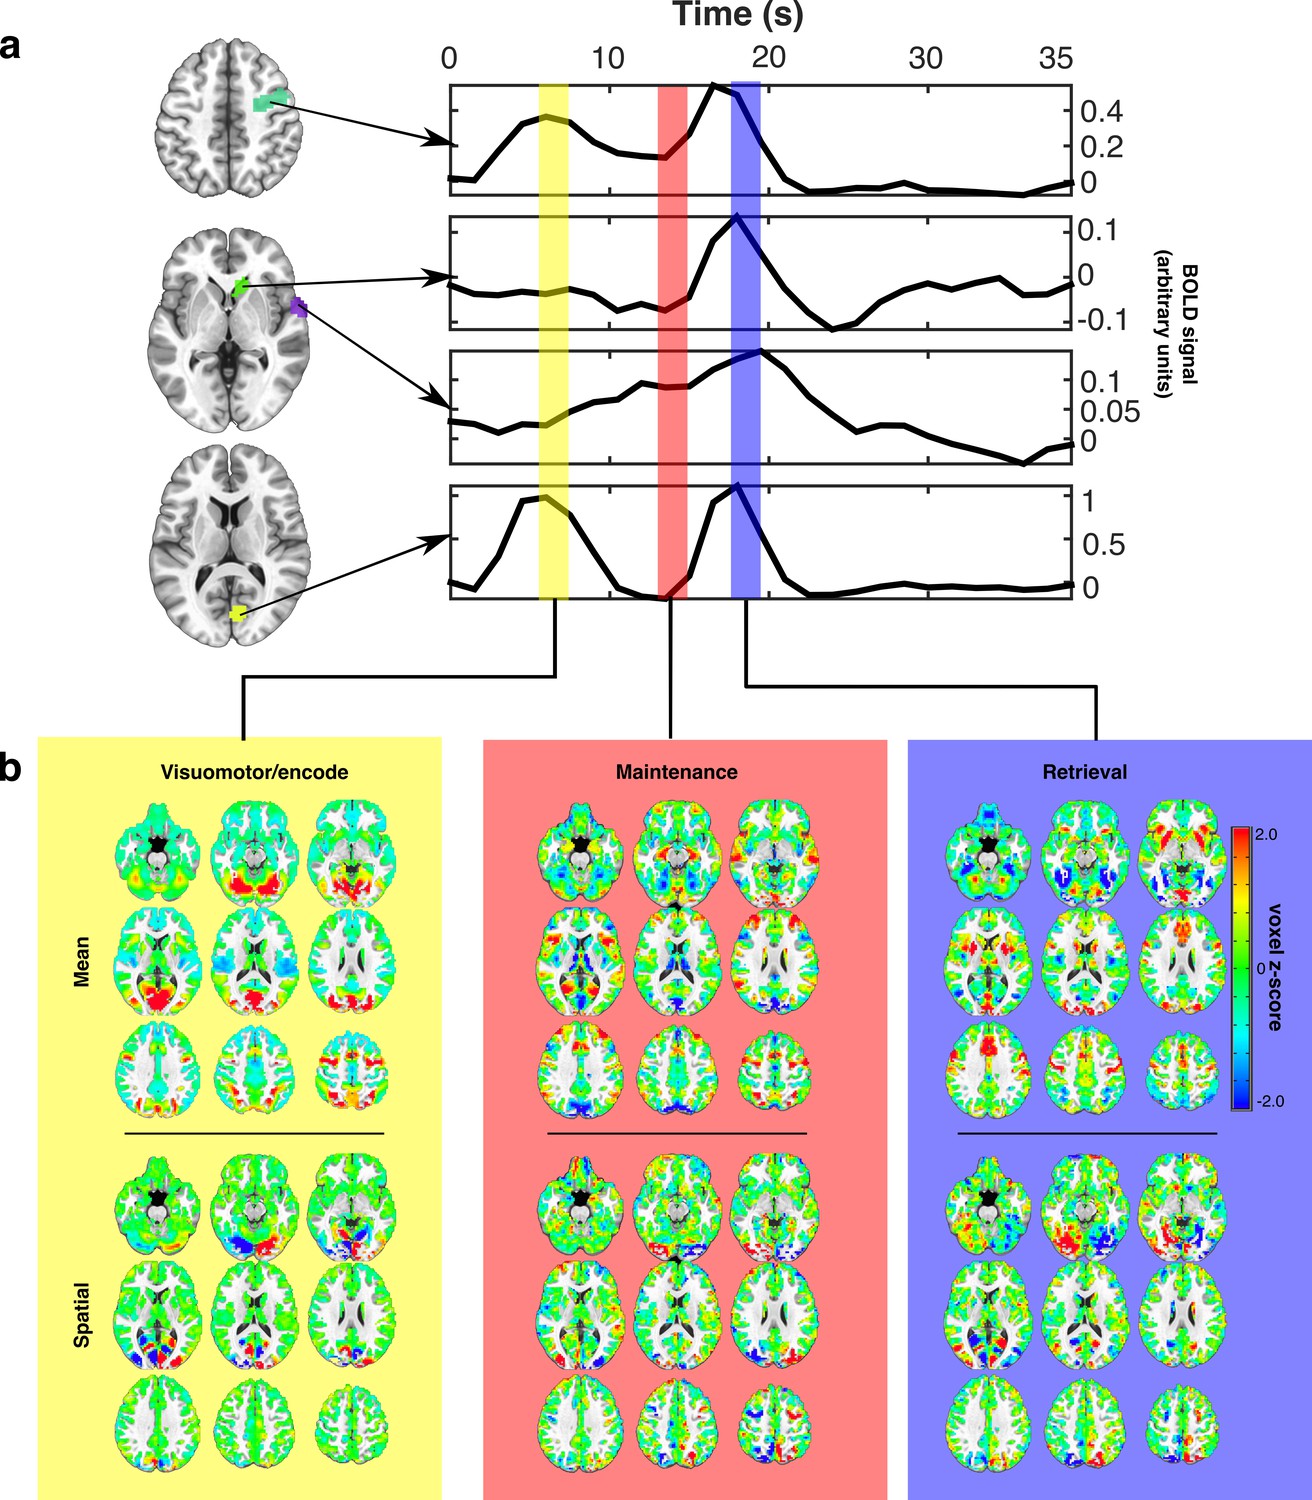
Estimating canonical task-related brain states.
(a) Representative idealized time series from long presentation, long delay trials where the target appeared in the left visual hemifield. Example ROIs, selected for illustration, are depicted as colored patches on the anatomical underlay and include (from top to bottom) right FEF, caudate head, superior temporal gyrus, and Broadmann area 17. Each colored vertical bar overlay represents a time point that was used for constructing the set of canonical task-related brain state patterns representing VME (yellow), maintenance (red), and retrieval (blue) processes. (b) The set of task-related brain state patterns derived from the time points indicated above and sequentially orthogonalized. Each brain state consists of two components: mean (top row) and spatial (bottom row). Different linear combinations of mean and spatial components model differences in activity across the brain related to whether the target is on the left or right. Whole brain patterns of task evoked BOLD activity can be converted into time courses of brain state expression by projecting each whole brain volume onto the complete set of brain state patterns using linear regression and organizing the regression weights into a time series.
Figure 3
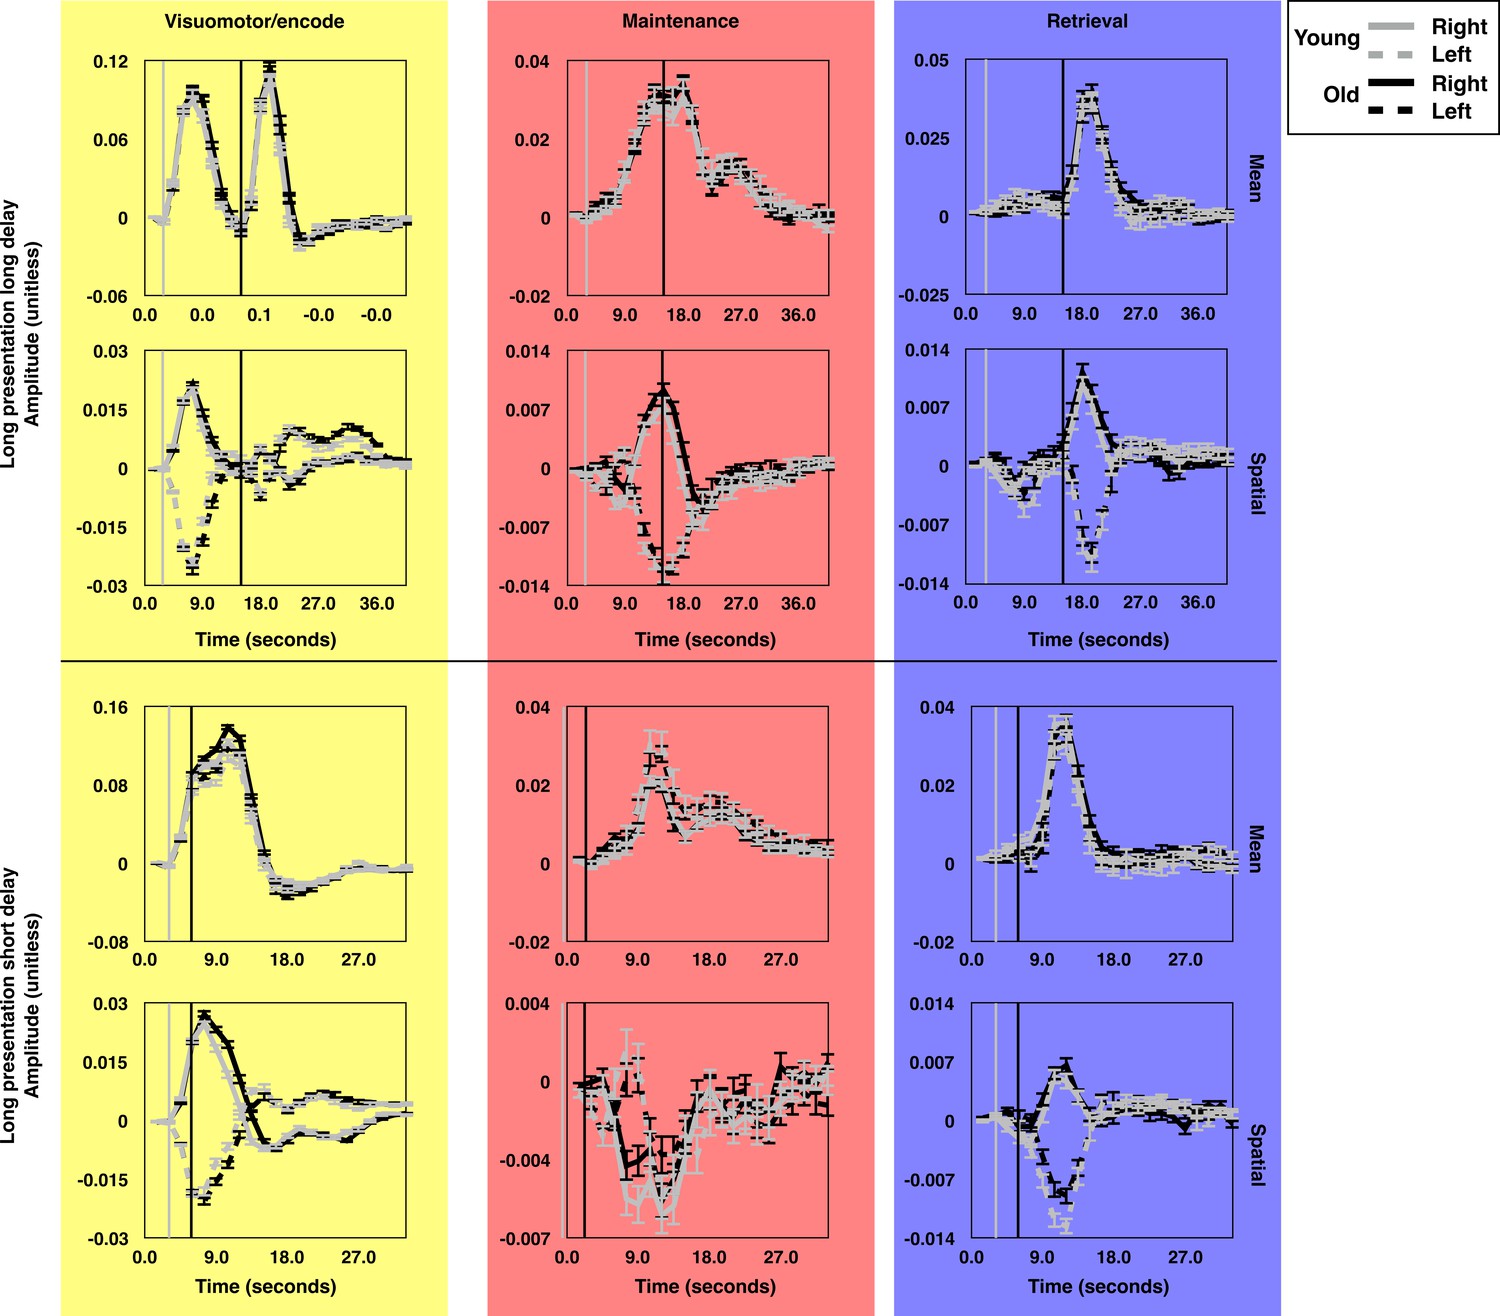
The average time course of brain state expression by age group.
The average time courses of expression for each brain state component during long presentation, long delay trials (top subset) and short presentation short delay trials (bottom subset). Each panel depicts the average time courses for the oldest (19.9 < Age ≤ 32.6; gray lines) and youngest (8.83 ≤ Age ≤ 19.9; black lines) halves of the subject pool. The time courses for trials during which targets were presented in the left (dashed) and right (solid) visual hemifields are rendered separately. The gray and black vertical lines indicate the time of visually-guided and memory-guided saccade signals respectively. As in Figure 2, yellow, red, and blue background colors correspond to VME-, maintenance- and retrieval-related brain state components. Error bars depict one standard error of the mean. These figures depict the absence of significant age related differences in the mean amplitude of expression of the canonical task-related brain states.
Figure 4
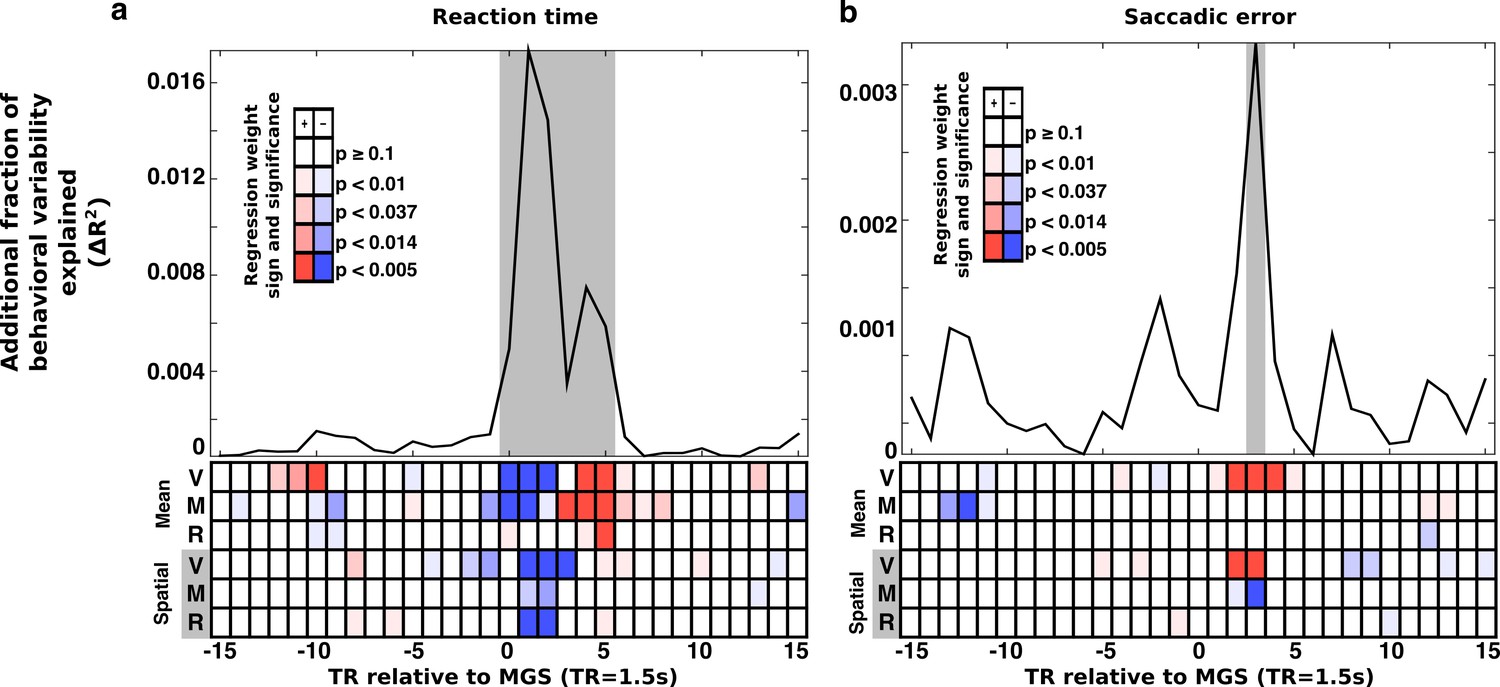
Trial-wise relationship between brain state expression and behavior.
Trial-to-trial brain state variability is associated with (a) reaction time and (b) saccade error. For all trials, snippets of the time course of brain state variability, centered on the TR containing the MGS are extracted and aligned (±15 TRs). At each TR relative to the saccade a regression model estimated the relationship between trial-to-trial behavioral performance and variability in the amplitude of expression of the canonical brain state components. The top panels depict the additional fraction of behavioral variability (compared to a null model) accounted for by including brain state measurements from each TR relative to each correct MGS. Highlighted gray intervals represent TRs where the full models provided a better fit than the null model (simulated likelihood ratio test with 5000 iterations; p<0.001). Each cell in the lower panels of (a) and (b) represent the p-value (darker colors are more significant) and the sign of the regression coefficient (blue, negative; red, positive) for each brain state component. Positive coefficients indicate that greater expression of a brain state component at a given time is associated with an increase in RT or SE. A negative coefficient indicates that greater expression of a brain state component is associated with a reduction in RT or SE. The top three rows of cells represent the mean brain state components (V: VME; M: maintenance; R: retrieval). The bottom three rows represent the significance of interactions between the spatial brain state component and the target hemifield.
Figure 5
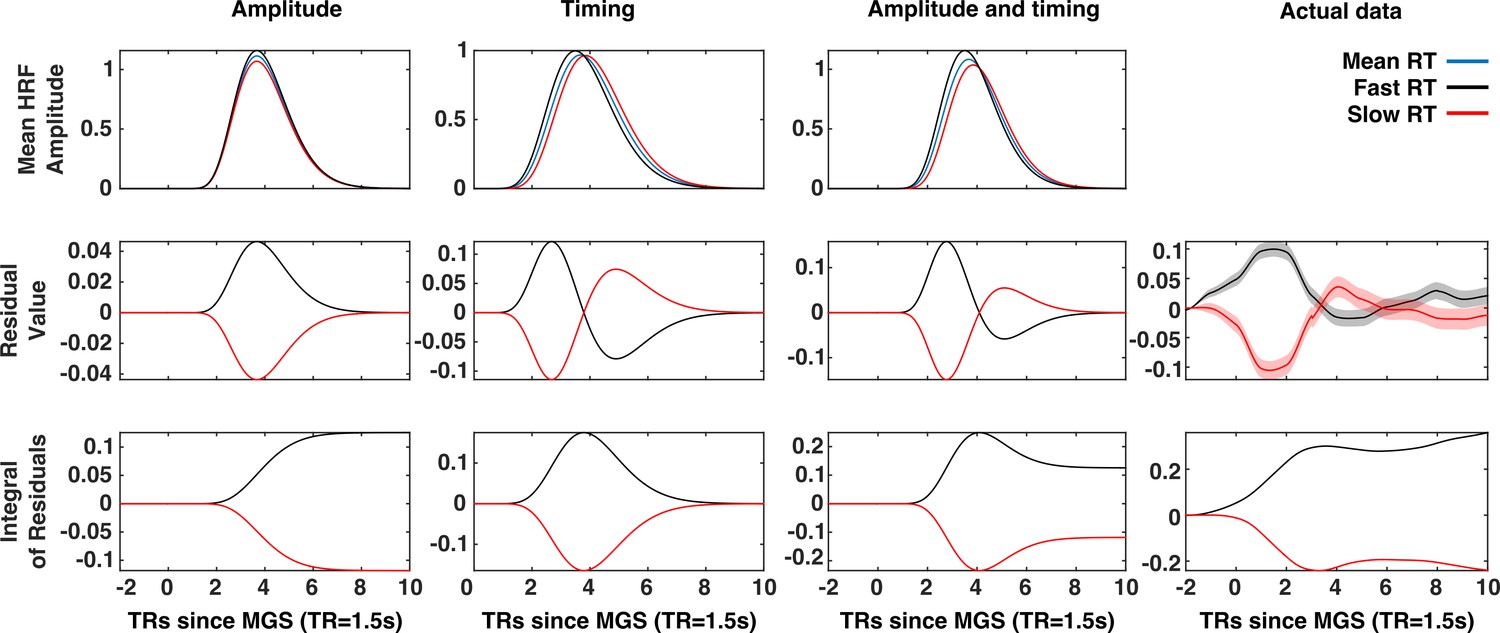
A comparison of timing and amplitude effects on brain state expression.
The x-axis of each panel represents time (in 1.5 s TRs) relative to the execution of the memory-guided saccade. An amplitude relationship (First column), a timing relationship (second column), and a combined amplitude and timing relationship (third column), are compared to actual data (fourth column). The first row depicts the patterns of trial-to-trial BOLD signal variability for each mechanism. Trials are divided into fast (black) and slow reaction time (red) sets defined by a median split. The average BOLD signal across all trials depicted in blue. The average residuals time series (second row) for fast and slow trials exhibit distinct patterns for each possible mechanism. The time integral of the average residuals makes this difference explicit: If a trial-to-trial relationship between the VME brain state and reaction time simply reflected trial-to-trial variability in the latency of the eye-movement and eye-movement evoked visual activity, then the integrals of the residual time series for fast and slow reaction time trials should both converge to zero (second column). However, the absence of this convergence in the mean VME brain state data (fourth column) is consistent with either an amplitude-based relationship or a mix of amplitude and latency. Where present, red and black envelopes represent ±1 SE of the mean.
Figure 6
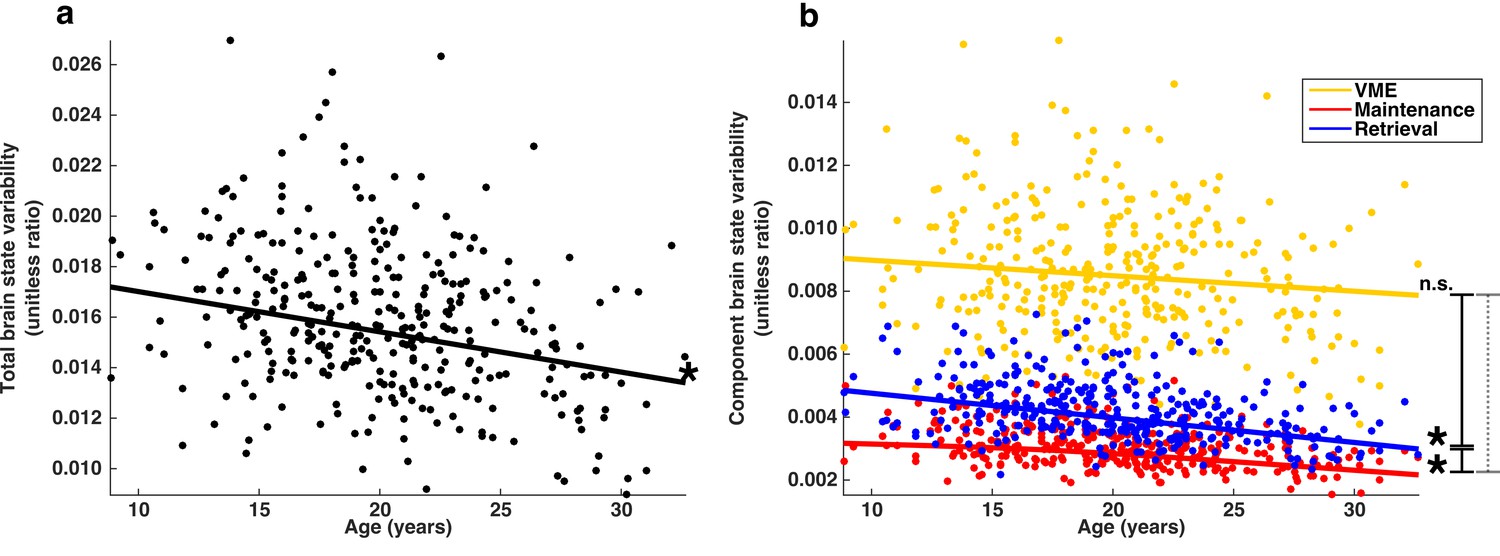
Developmental trajectories of brain state variability.
(a) Trajectory of total brain state variability, the ratio SSbrain/(SSbrain +SSerror) across age. A single point represents each session. (b) Depicts the developmental trajectories of the components of brain state variability: VME (yellow), maintenance (red) and retrieval (blue). Total brain state variability equal to the sum of the variability of each component. Single asterisks indicate significant individual slopes of brain state component variability; vertical lines connecting endpoints represent pairwise comparisons of slopes. Solid and dashed lines indicate a significant, and non-significant differences respectively.
Figure 7
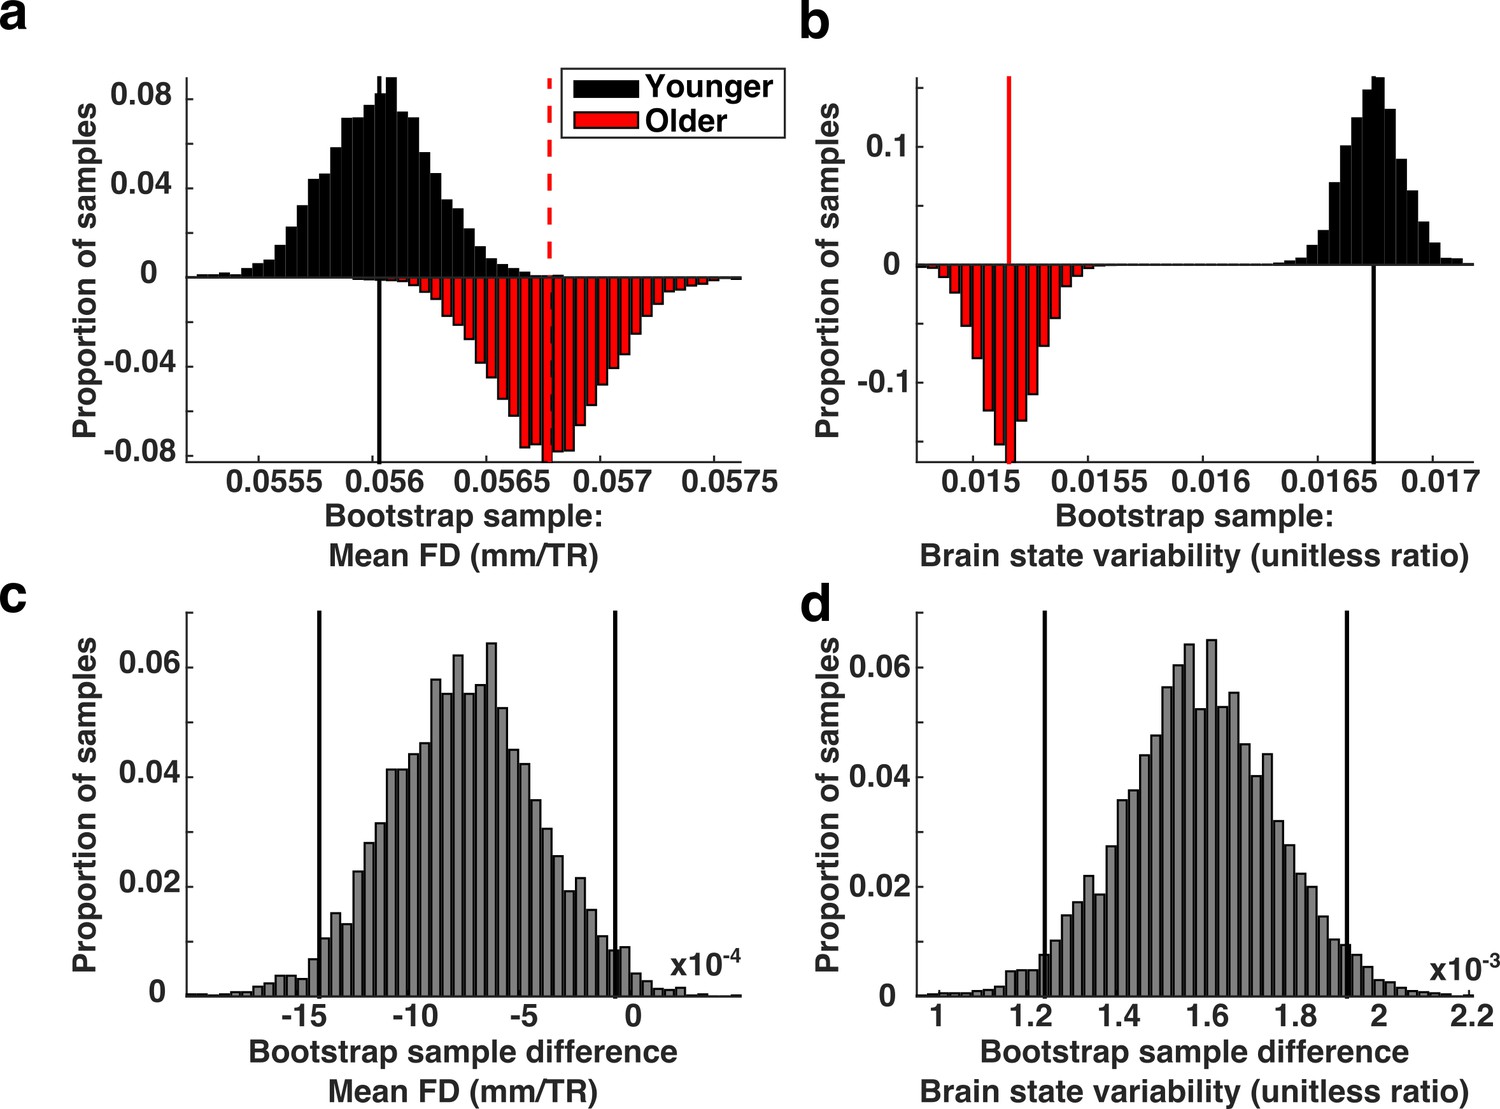
Brain state variability in high motion adults compared to low motion children.
(a) Biased bootstrap sample distribution of mean FD in which the older subjects (red histogram) moved more than younger subjects (black histogram). (b) The corresponding distributions of brain state variability demonstrate that brain state variability is still greater in younger subjects who moved more than adults. Vertical lines in the top two panels represent the means of the distributions. (c–d) The bootstrap differences for the corresponding distributions above. Vertical black lines indicate 95% confidence intervals.
Figure 8
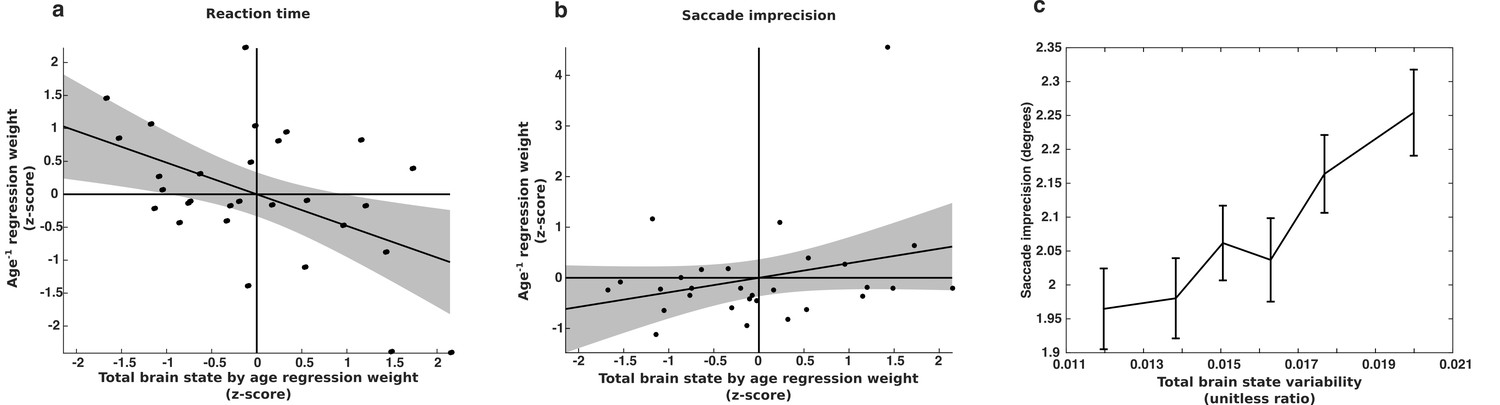
Longitudinal relationship between brain state variability and behavioral variability.
The relationship between changes in brain state variability and changes in a) reaction time variability and b) memory-guided saccade imprecision for a group subjects (n=29) for whom we had four of more complete sessions of data. The x-axes depict the slopes of age-related change in brain state variability, computed separately for each subject. They y-axes depict the regression weight for the age−1 term used to fit each subjects’ behavioral data. Thus, a negative relationship indicates that greater reduction in brain state variability is associated with a greater reduction in behavioral variability. (c) The relationship between saccade imprecision and brain state variability using our entire data sample. For presentation purposes, the data was adaptively binned so that each point contains the same amount of data and is centered on the median value for that bin. Error bars represent ±1 standard error of the mean.
Figure 9

Brain state analysis flowchart.
A flowchart outlining the major steps involved in the brain state analyses. Where appropriate, the descriptions include a cross-reference to relevant figures depicting major analyses based on the output of each process as well as a cross-reference to the relevant section of Materials and methods for further detailed information on how the process or analysis was implemented.
Figure 10
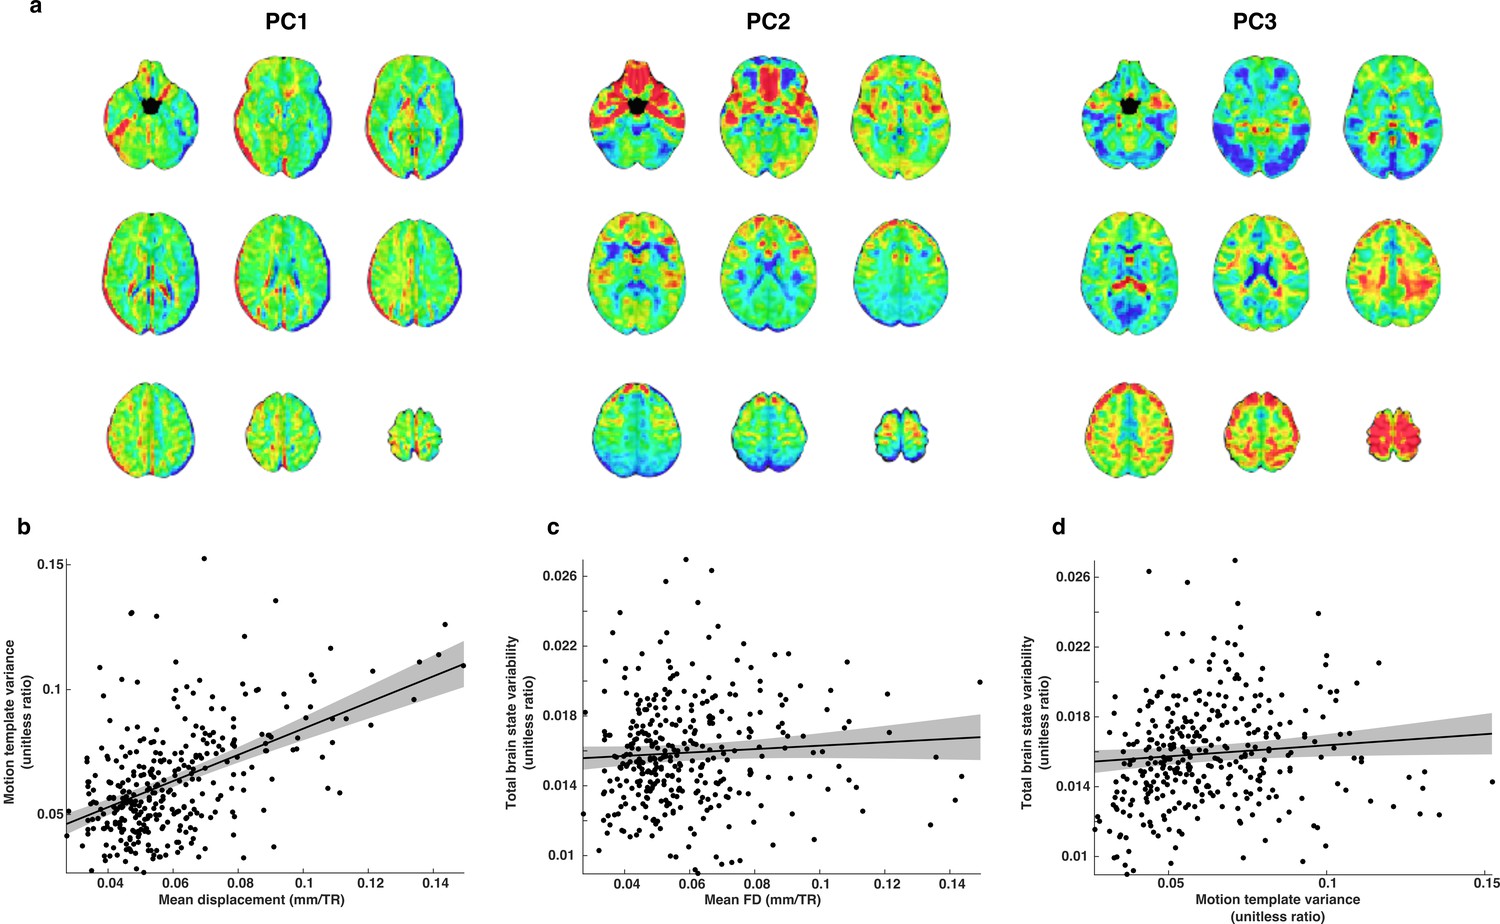
The relationship between motion and brain state variability.
(a) Illustrative examples of three whole-brain motion templates out of a total set of 19. We used this set of templates as nuisance regressors and to estimate motion related variability that remained in each TR of the whole-brain residual time series. (b) Motion template variance is greater for subjects that moved more in the scanner. (c) Brain state variability was not significantly related to estimates of mean FD. (d) There is a small relationship between motion template variability and brain state variability.
Additional files
-
Transparent reporting form
- https://doi.org/10.7554/eLife.25606.013
Download links
A two-part list of links to download the article, or parts of the article, in various formats.
Downloads (link to download the article as PDF)
Open citations (links to open the citations from this article in various online reference manager services)
Cite this article (links to download the citations from this article in formats compatible with various reference manager tools)
The expression of established cognitive brain states stabilizes with working memory development
eLife 6:e25606.
https://doi.org/10.7554/eLife.25606


