Selective and regulated trapping of nicotinic receptor weak base ligands and relevance to smoking cessation
- University of Chicago, United States
- National Institute of Dental and Craniofacial Research at the National Institutes of Health, United States
- Northwestern University, Feinberg School of Medicine, United States
- Marine Biological Laboratory, United States
Figures
Figure 1 with 3 supplements
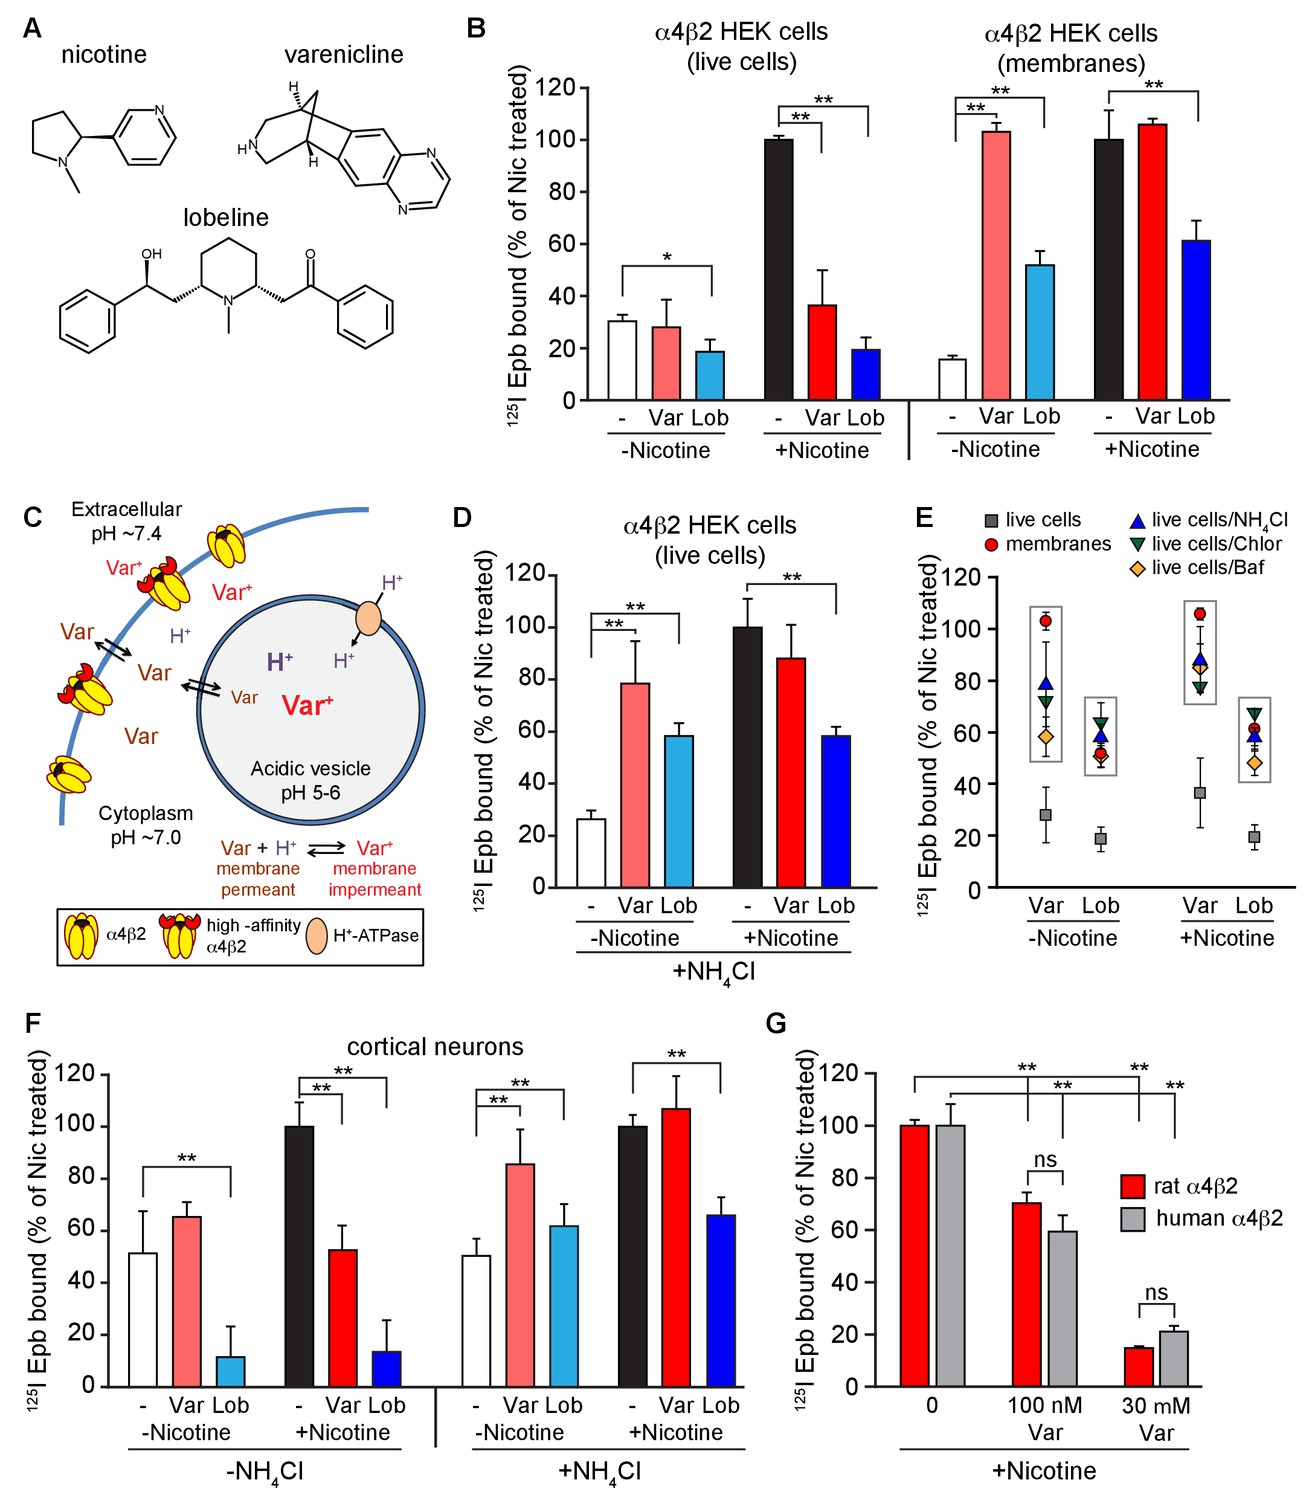
Effect of smoking cessation reagents on α4β2R upregulation.
(A) Nicotine, varenicline and lobeline chemical structures. (B) Varenicline and lobeline reduced nicotine upregulation of α4β2Rs for live cells, but not membranes. 125I-epibatidine binding performed on live α4β2R-expressing HEK cells (left) (n = 3) or membranes (right) (n = 3). Cells were treated for 17 hr with 30 μM varenicline or 30 μM lobeline with or without 10 μM nicotine. Specific epibatidine binding was represented as % of binding relative to nicotine upregulated cells (C) Model of varenicline (Var) trapping in acidic vesicles. Varenicline is trapped when protonated in the acidic vesicle lumen.α4β2Rs on the plasma membrane are depicted in two states: α4β2Rs with and without high-affinity binding sites consistent with the findings of Vallejo et al. (Benowitz et al., 2009). (D) An intracellular acidic compartment is required for varenicline and lobeline effects on upregulation. 125I-epibatidine binding performed on live α4β2R HEK cells with 20 mM NH4Cl treatment for 10 min. Cells were exposed to 30 μM varenicline or 30 μM lobeline with or without 10 μM nicotine for 17 hr as in (B) (n = 4). (E) A distribution plot comparing the reduction in upregulation (125I-epibatidine binding) by varenicline and lobeline to the recovery after disruption of intracellular pH gradient by membrane preparation or various agents that raise pH in intact cells. Each point represents the mean and the standard error of the mean (s.e.m) from the indicated columns in Figure 1B,D, and Figure 1—figure supplement 2A,B. (F) 125I-epibatidine binding on live cortical neurons without (left) or with (right) 20 mM NH4Cl treatment. Neurons were exposed to varenicline or lobeline as in B) in the presence or absence of 1 μM nicotine (n = 3). (G) Varenicline reduced nicotine induced upregulation of human α4β2Rs. 125I-epibatidine binding was performed on live cells either stably expressing rat α4β2R or transiently expressing human α4β2Rs. HEK cells were transfected with human α4 and β2 subunits for 24 hr. Cells were treated with 100 nM or 30 μM varenicline in the presence of 10 μM nicotine for 17 hr prior to 125I-epibatidine binding (n = 3). In all the column graphs in (B, D, F, G): *p<0.05; **p<0.00 one by one-way ANOVA with Bonferroni’s multiple comparison test; n indicates number of independent experiments performed on separate days and cultures. Columns represent group mean and error bars are the standard error of the mean (s.e.m).
Figure 1—figure supplement 1

Dose dependence of varenicline and lobeline effects on upregulation.
(A) Dose dependence of varenicline upregulation. α4β2R-expressing cells were treated with increasing concentration of varenicline for 17 hr. Cells were washed with PBS prior to 125I-epibatidine binding and with (red-filled circles) or without 20 mM NH4Cl (black-filled circles) treatment for 10 min (n = 3). (B) Dose dependence of varenicline on nicotine upregulation. Cells were treated with increasing concentration of varenicline with 10 μM nicotine for 17 hr and treated with (red-filled squares) or without 20 mM NH4Cl (black-filled squares) treatment for 10 min as in (A) (n = 3). (C) Dose dependence of lobeline upregulation. α4β2R-expressing cells were treated with increasing concentration of lobeline for 17 hr and treated with (blue-filled circles) or without 20 mM NH4Cl (black-filled circles) treatment for 10 min as in A (n = 3). (D) Dose dependence of lobeline on nicotine upregulation (n = 3). For all the points in (A, B, C, D): error bars represent mean ± s.e.m. n indicates number of independent experiments performed on separate days and cultures.
Figure 1—figure supplement 2

Altering intracellular pH of acidic vesicles alters the effects of varenicline and lobeline.
(A) 125I-epibatidine binding on α4β2R-expressing HEK cells exposed to varenicline or lobeline 17 hr at 30 μM and then incubated twice (5 min each) with Bafilomycin A (50 nM), an inhibitor of vacuolar type H+ -ATPase (proton pump), prior to performing radio-ligand binding (n = 3). (B) 125I-epibatidine binding on α4β2R-expressing HEK cells exposed to varenicline or lobeline 17 hr at 30 μM and then incubated twice (5 min each) with a weak base chloroquine (150 μM) prior to performing radio-ligand binding (n = 3). In column graphs in A and B: ***p<0.001 by one-way ANOVA with Bonferroni’s multiple comparison test. n indicates number of independent experiments performed on separate days and cultures and error bars indicate mean ± s.e.m.
Figure 1—figure supplement 3
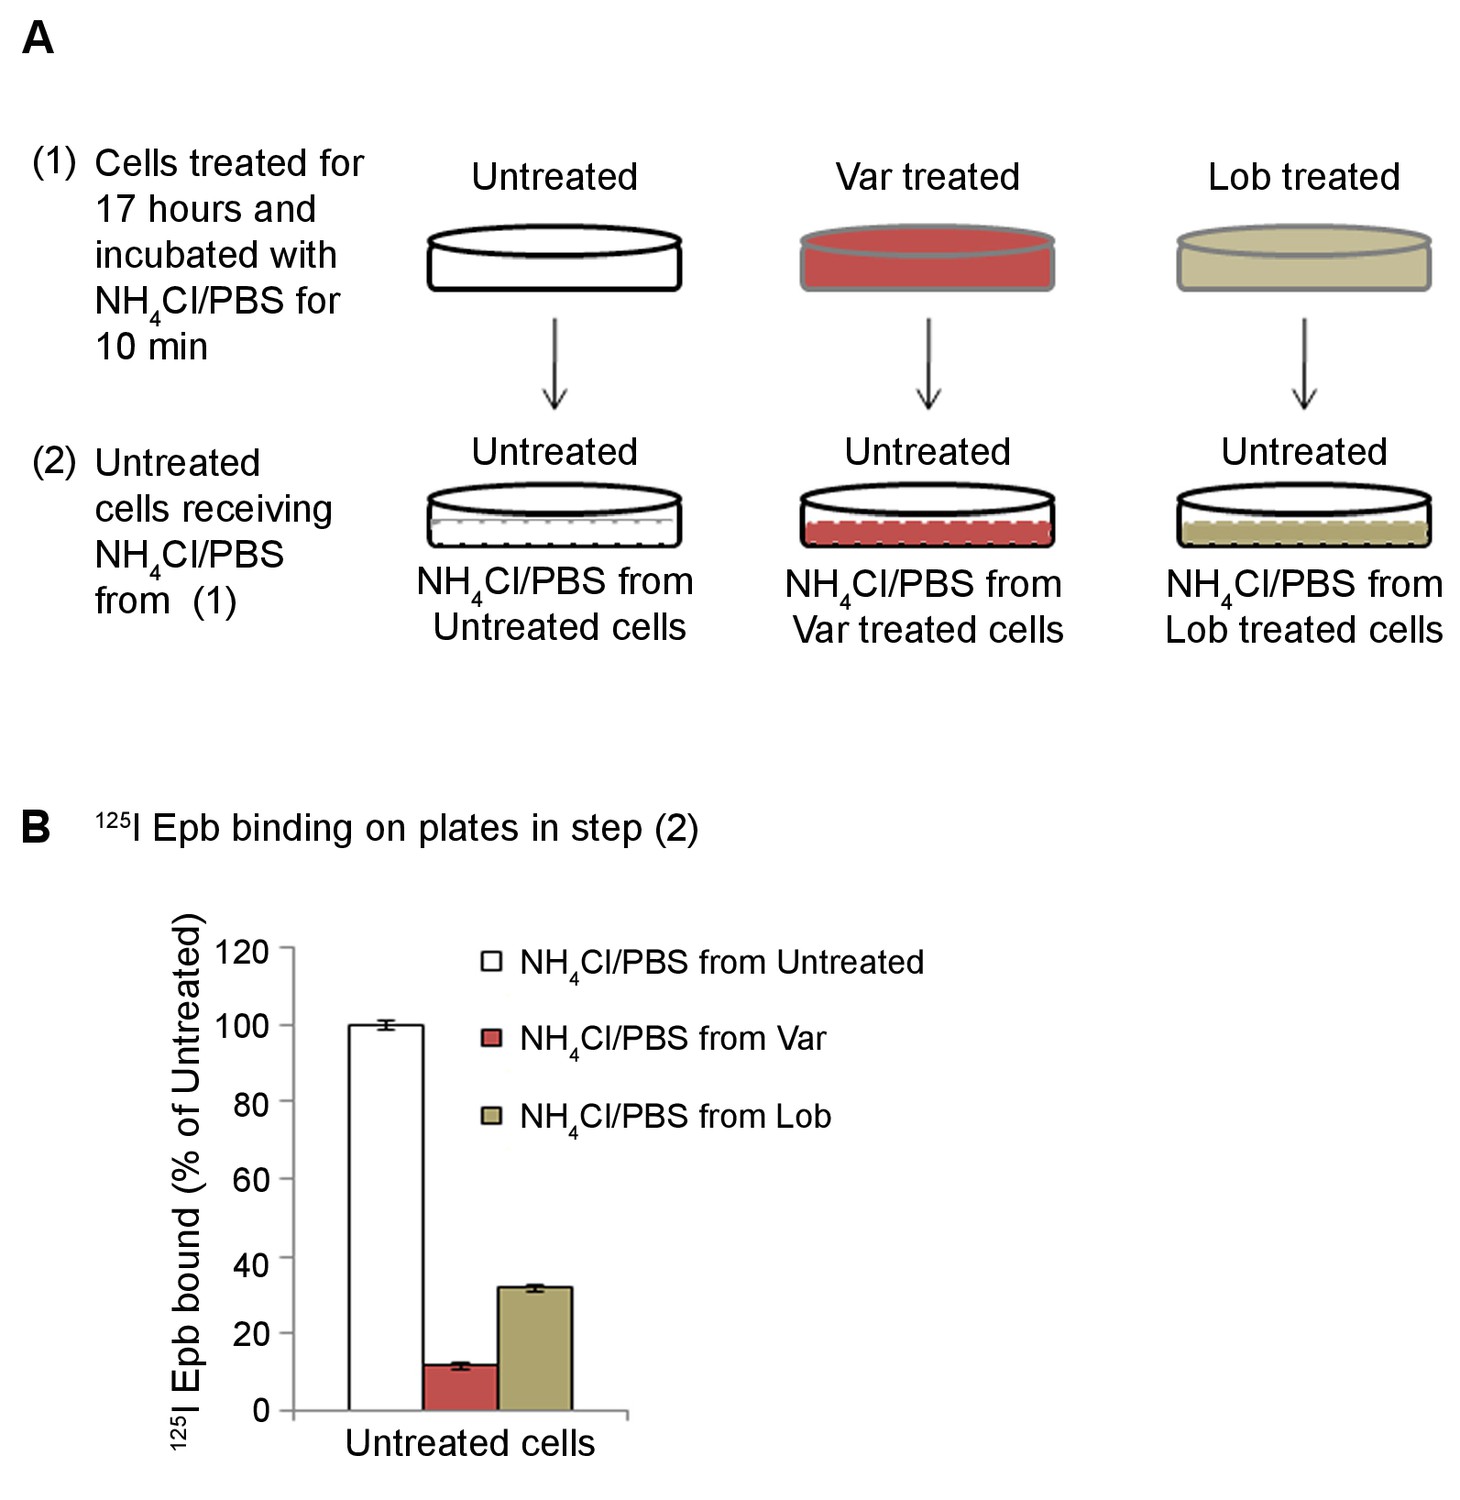
Release by NH4Cl treatment of α4β2R ligands trapped inside the acidic compartment.
(A) Schematic of the experimental details. (National Center for Chronic Disease Prevention and Health Promotion (US) Office on Smoking and Health, 2014). HEK cells stably expressing α4β2Rs were untreated or treated with 30 μM varenicline or lobeline for 17 hr. Cells incubated in 20 mM NH4Cl/PBS for 10 min. (Agboola et al., 2015). Untreated cells receiving NH4Cl/PBS from untreated, varenicline or lobeline pre-treated cells. (B) 125I-epibatidine binding was performed on untreated cells receiving NH4Cl/PBS from cells that had been treated as in (Agboola et al., 2015). Error bars represent mean ± standard deviation (s.d) from triplicate samples.
Figure 2
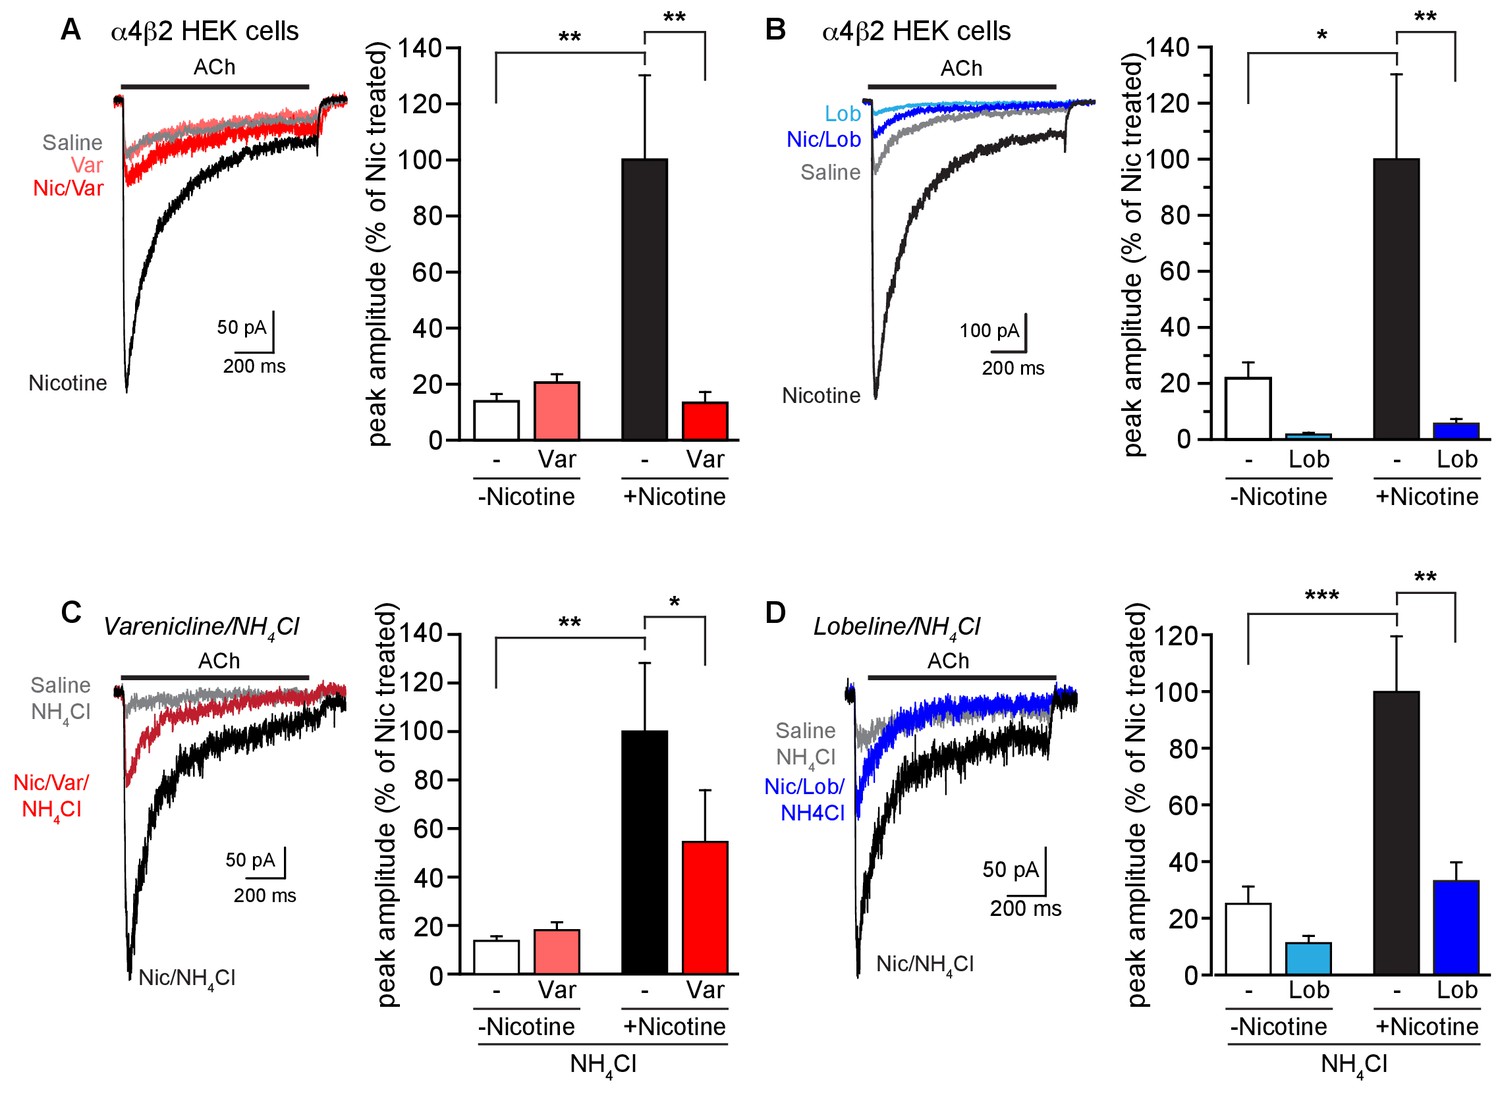
Effect of smoking cessation reagents on functional upregulation.
(A) In this and other recordings, a 17–20 hr treatment with nicotine (Nic, 10 μM) induced a robust, ~5 fold, increase in peak current amplitudes evoked by 1 mM ACh from α4β2R-expressing HEK cells. Varenicline (Var, 30 μM) treatment for an equivalent time had no effect on ACh-evoked peak current amplitudes alone but prevented upregulation of nAChR function when co-incubated with nicotine. Traces represent currents evoked by ACh in cells that were untreated or treated for 17 hr with vehicle, nicotine, varenicline, or with varenicline and nicotine. The number of recordings were 16, 18, 18, and 17, respectively. (B) Chronic lobeline (Lob, 30 μM) exposure reduced the peak ACh current amplitude relative to control and prevent nicotine upregulation. Traces represent currents evoked by ACh in cells that were untreated or treated for 17 hr with vehicle, nicotine, lobeline, or with lobeline and nicotine. The number of recordings were 13, 18, 13, and 15, respectively. (C) NH4Cl treatment (two 10 min washes) partially reverses the suppressive effects of varenicline on nicotine-induced functional upregulation. Traces show representative currents evoked by ACh from cells pretreated for 17–20 hr with vehicle, nicotine, or nicotine and varenicline before exposure to NH4Cl. The varenicline-alone condition is omitted for clarity. The graph is as in (A) except that the cells were treated with NH4Cl as noted. The profound reduction in nicotine-induced upregulation caused by varenicline co-incubation was lessened following treatment with NH4Cl. The number of recordings were 21, 22, 25, and 25, respectively. (D) Traces show representative currents evoked by ACh from cells pretreated for 17–20 hr with vehicle, nicotine, or nicotine and lobeline before exposure to NH4Cl. In this dataset, lobeline-induced suppression of nicotine upregulation was modestly attenuated by treatment with NH4Cl. The number of recordings were 14, 15, 16, and 19, respectively. In all the column graphs: * p<0.05; **p<0.01; ***p<0.001 by one-way ANOVA with Tukey’s multiple comparison test. Columns show group mean and error bars are the s.e.m.
Figure 3 with 1 supplement
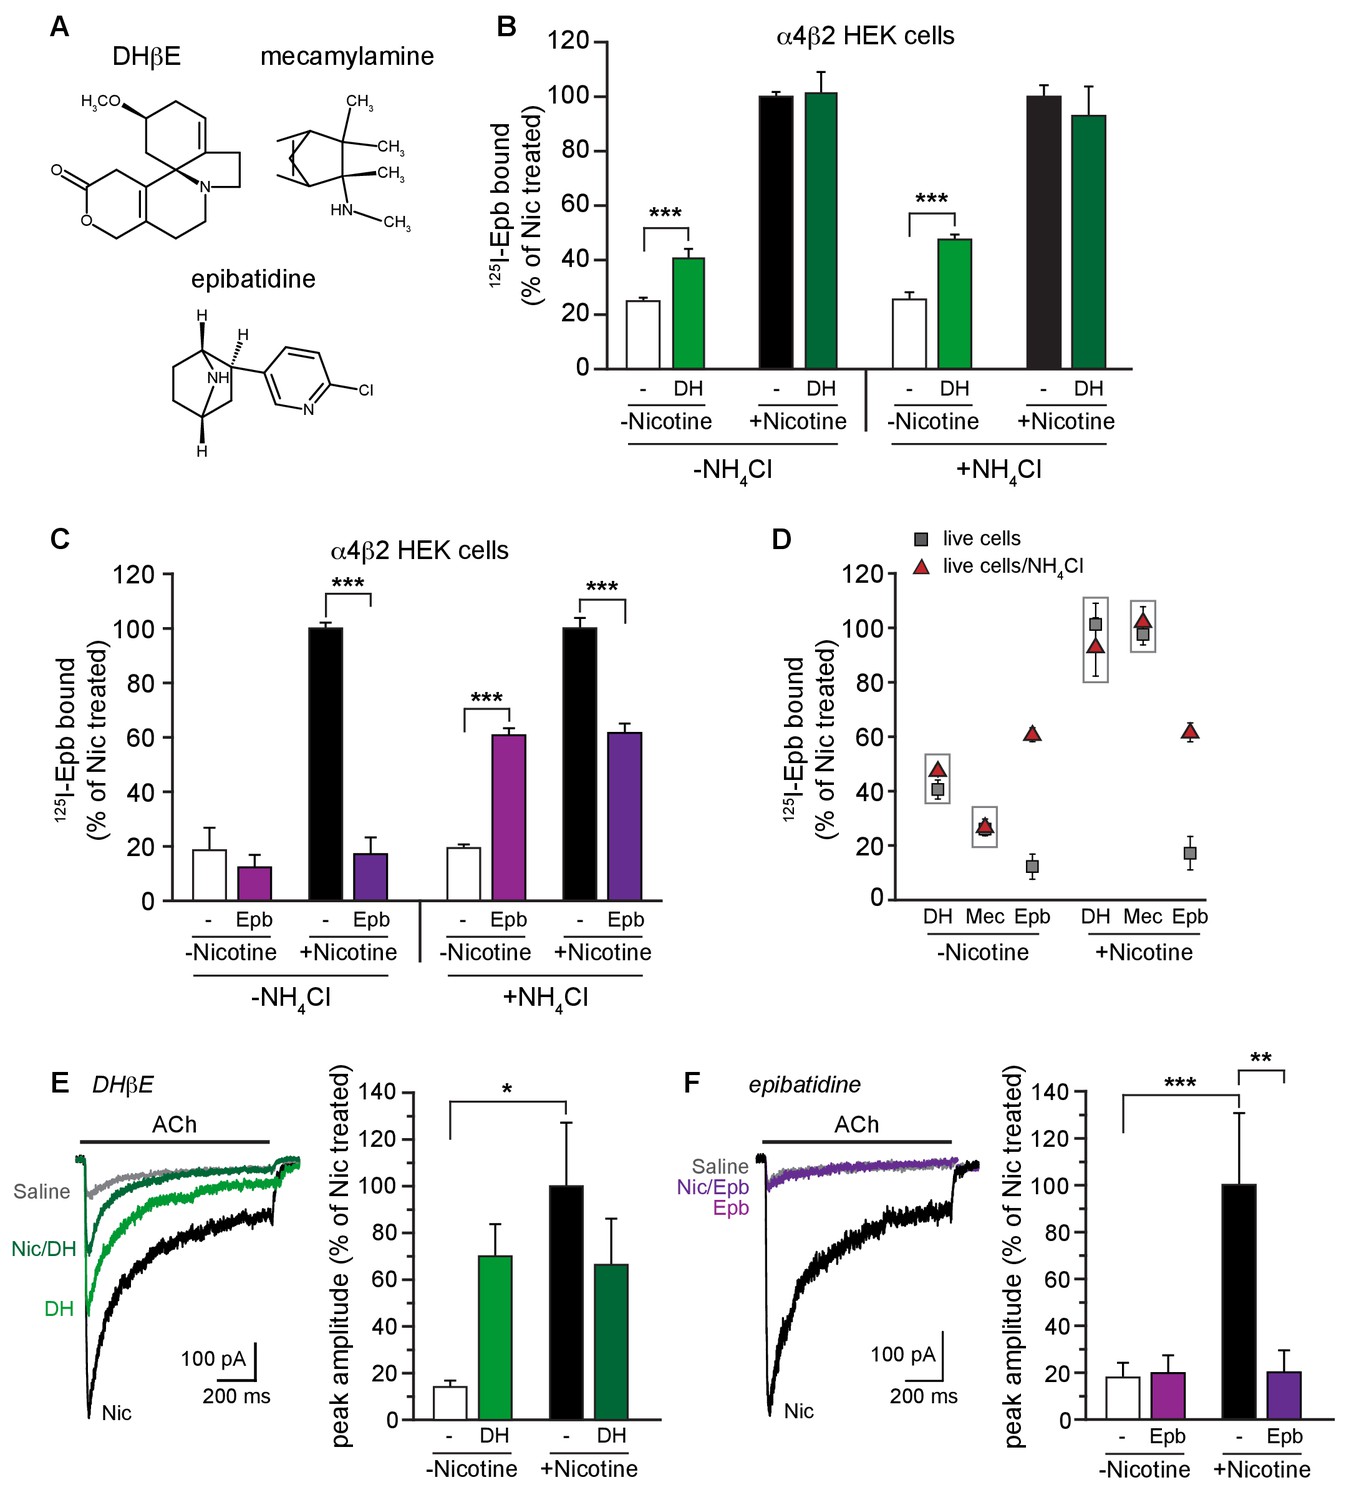
α4β2R weak base ligands exhibit different degrees of intracellular trapping.
(A) DHβE, mecamylamine and epibatidine chemical structures. (B) NH4Cl treatment does not alter DHβE (DH) upregulation. 125I-epibatidine binding performed on live α4β2R-expressing cells without (left) or with (right) NH4Cl treatment as in Figure 1D. Cells were treated for 17 hr with 100 μM DHβE with or without 10 μM nicotine (n = 6: -NH4Cl; n = 4: +NH4Cl)). The profile was similar to cells washed with PBS, indicating no effect of pH on DHβE. (C) Intact cells were treated with 30 μM epibatidine (Epb) and 125I-epibatidine binding were performed after incubating the cells with (left) or without (right) 20 mM NH4Cl/PBS (n = 3). Column graphs in (B, C): ***, p<0.001 by one-way ANOVA with Bonferroni’s multiple comparison test. n indicates number of independent determinations on separate days and cultures. (D) A distribution plot comparing upregulation (125I-epibatidine binding) by DHβE, mecamylamine and epibatidine before and after disruption of intracellular pH gradient by various agents that raise pH in intact cells. Each point represents the mean and s.e.m from the indicated columns in Figure 3B,C with the exception of the mecamylamine data, where the data are not displayed elsewhere, and the points are the means and s.e.m (n = 4) where n indicates number of independent determinations on separate days and cultures. (E) ACh-evoked currents following 17–20 hr treatment of α4β2-expressing HEK cells with vehicle, nicotine, DHβE (DH, 100 μM), or nicotine and DHβE. The number of recordings were 17, 21, 15 and 21, respectively. DHβE appeared to upregulate ACh function but the currents were variable in their amplitude and the mean was not statistically different from the vehicle group. No attenuation of nicotine upregulation was observed with DHβE. (F) Epibatidine (Epb, 30 μM) shows effects on ACh currents similar to that of varenicline. Current amplitudes were similar to the vehicle control when cells were incubated with epibatidine alone, but co-incubation with nicotine prevented functional upregulation. The number of recordings were 14, 22, 17 and 24, respectively. In all the column graphs: *p<0.05; **p<0.01; ***p<0.001 by one-way ANOVA with Tukey’s multiple comparison test; n indicates the number of experimental repetitions. Columns show group mean and error bars are the s.e.m.
Figure 3—figure supplement 1
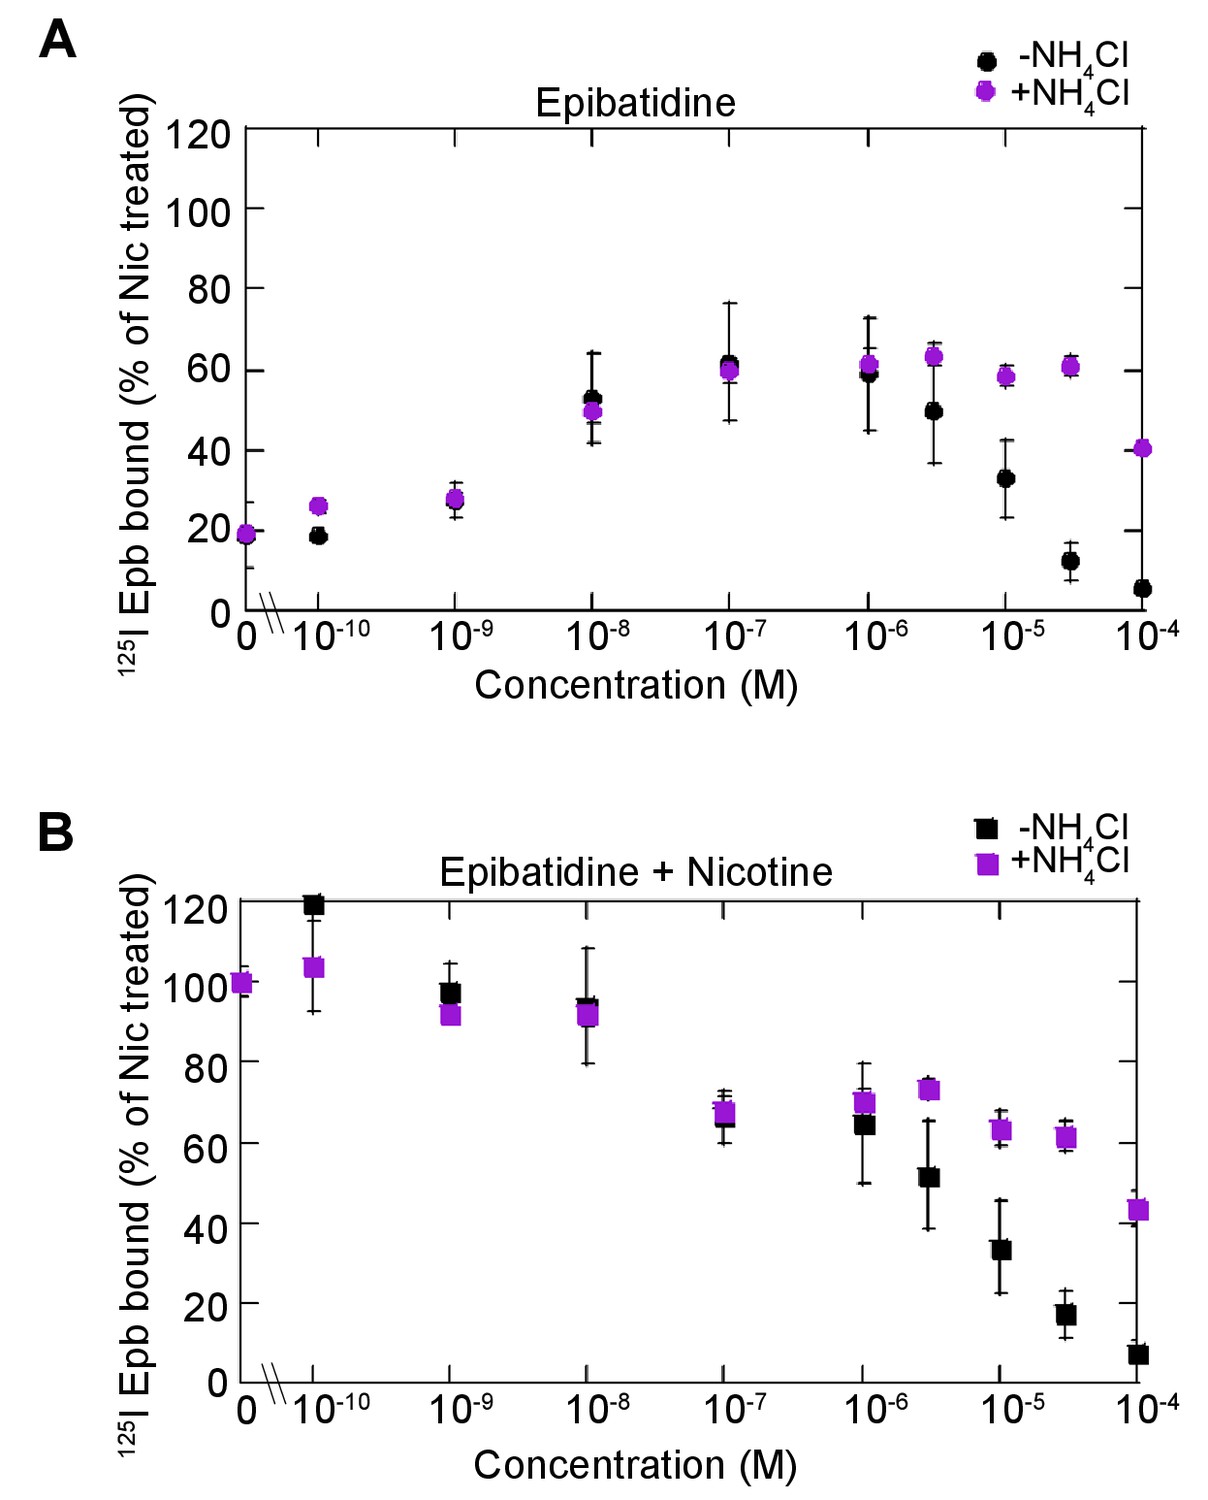
Dose dependence of epibatidine effects on upregulation.
(A) Dose dependence of epibatidine upregulation. α4β2R-expressing cells were treated with increasing concentration of epibatidine for 17 hr. Cells were washed with PBS prior to 125I-epibatidine binding and with (magenta-filled circles) or without 20 mM NH4Cl (black-filled circles) treatment for 10 min (n = 3). (B) Dose dependence of epibatidine on nicotine upregulation. Cells were treated with increasing concentration of epibatidine with 10 μM nicotine for 17 hr and treated with (magenta -filled squares) or without 20 mM NH4Cl (black-filled squares) treatment for 10 min as in (A) (n = 3). For all the points in (A, B): error bars represent mean ± s.e.m. n indicates number of independent experiments performed on separate days and cultures.
Figure 4 with 1 supplement
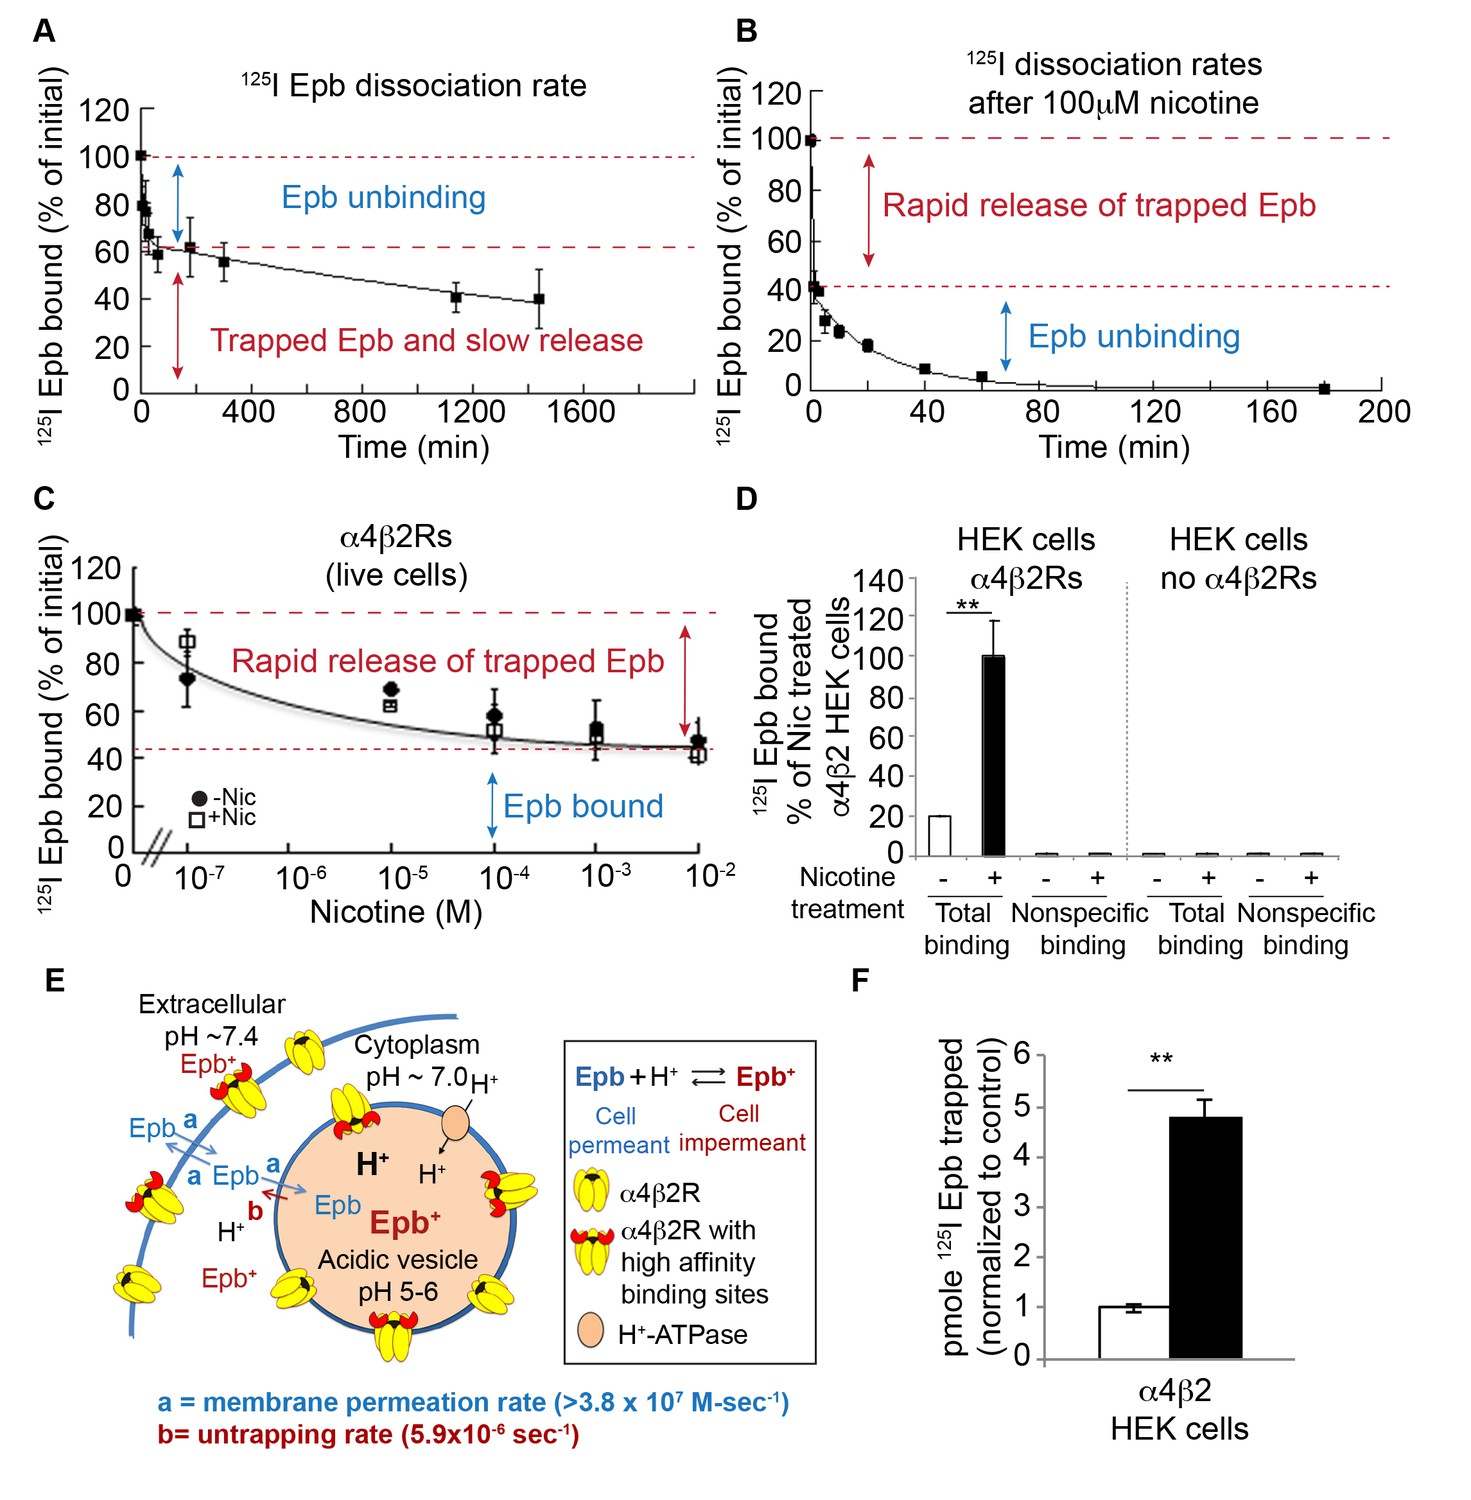
Direct measurements of 125I-epibatidine trapping.
(A) The biphasic dissociation of 125I-epibatidine from α4β2R HEK cells measured at 37°C. Bound 125I-epibatidine is normalized to % bound at time 0. The line through the data represents a least-squares fit of a double exponential function: % Bound(t) = Af exp(-kft) + As exp(-kst) where Af(38 ± 6%) and As (62 ± 8%) are the % bound 125I-epibatidine at time (t) = 0 for the fast and slow component respectively; kf (1.5 ± 0.6×10⁻³ sec−1) and ks (6.0 ± 1.4×10⁻⁶ sec−1) are the time constants for the fast and slow component respectively (n = 4). (B) Addition of 100 μM nicotine causes the rapid release of slowly dissociating bound 125I-epibatidine. Dissociation of 125I-epibatidine measured at 37°C as in A except after adding 100 μM nicotine at to start the dissociation measurement. The line through the data with the exception of the initial data point represents a least-squares fit of a single exponential function: % Bound(t) = Af exp(-kft) where kf was 7.0 ± 1.3×10⁻⁴ sec−1 (n = 3). (C) The rapid dissociation of bound 125I-epibatidine measured after washing the cells with increasing concentrations of nicotine. α4β2R HEK cells were with treated with 10 μM nicotine (dark circles) or left untreated (white squares) for 17 hr. The cells were washed. Cells were washed with PBS followed by three washes with indicated concentrations of nicotine prior to performing 125I-epibatidine binding (n = 3). For all the points in A, B, C: error bar represents mean ± s.e.m. (D) 125I-epibatidine binding to α4β2R-expressing HEK cells versus HEK cells lacking α4β2Rs. 1 mM nicotine was added during 125I-epibatidine binding to estimate nonspecific binding (n = 3). (E) Altered model of ligand trapping with high-affinity α4β2Rs in the acidic vesicles. (F) Nicotine exposure increases trapped 125I-epibatidine. The levels of trapped 125I-epibatidine were determined with the addition of 100 μM nicotine to start the dissociation. Trapped 125I-epibatidine was released within 1 min of the nicotine addition as in Figure 4B and C for cells untreated (-Nic) or treated with 10 μM nicotine (+Nic) for 17 hr. Plotted is the released 125I-epibatidine in pmoles normalized to untreated cells (n = 3). For (D, F): error bar represents mean ± s.e.m. **p<0.001 by Student’s t-test. (A-D,F): n indicates number of independent experiments performed on separate days and cultures.
Figure 4—figure supplement 1

Association rate of 125I-epibatidine.
Live cells were bound with 0.1 nM 125I-epibatidine at room temperature for the indicated times. The line through the points represents a least-squares fit to the normalized 125I-epibatidine uptake for the α4β2R-expressing HEK cells plotted as the fraction [125I-Epb]up(t) / [125I-Epb]up(0) and fit by the equation [125I-Epb]up(∞) / [125I-Epb]up(0)(1 - (exp(-kt))+1, where [125I-Epb]up(t) is the 125I-epibatidine uptake at time t, [125I-Epb]up(0) at time 0, [125I-Epb]up(∞) at saturation and k the association rate. Three independent experiments were performed on separate days and cultures. For all the points in the plot, error bars represent mean ± s.e.m from three independent experiments.
Figure 5 with 1 supplement
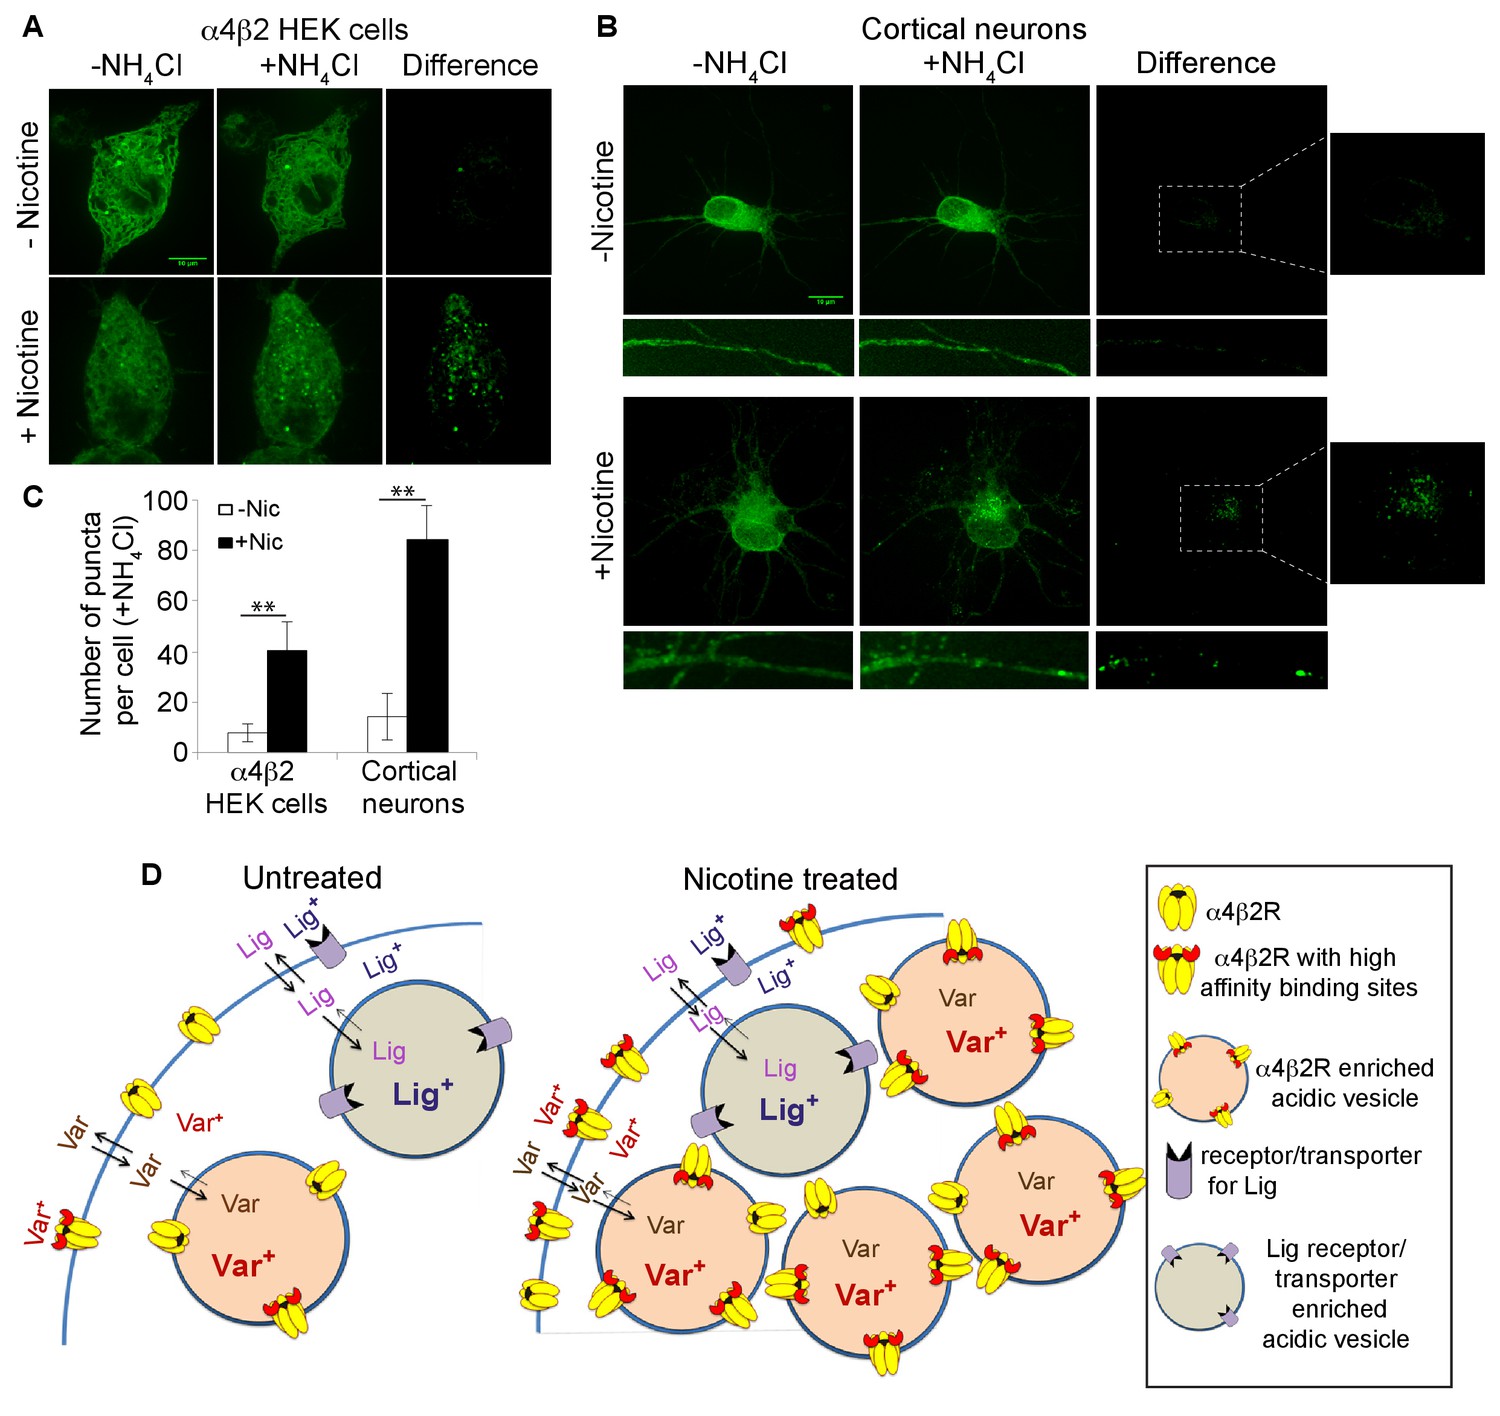
Nicotine exposure increased the number of α4β2R-containing acidic vesicles.
(A) Imaging α4β2R-containing acidic vesicles and the effect of nicotine exposure. α4SEP was transfected into the α4β2R-expressing HEK cells. Image (100 x) of 3 merged slices near the cell surface from untreated (top) and nicotine-treated (bottom) cells. Cell was imaged without NH4Cl (left panel) and after adding NH4Cl (5 min; middle panel). In the right panel (difference) the total fluorescent intensity in -NH4Cl image was subtracted from +NH4Cl image. Scale bar is 10 μm. (B) Imaging α4β2R-containing acidic vesicles in cultured neurons and the effect of nicotine exposure. α4SEP and β2HA subunits was transfected into cortical neurons (DIV 9). Image as in A of untreated (top) and nicotine-treated (bottom) neurons. Both soma and dendrites from the same cells are shown. Right panel and inset shows the difference obtained by subtracting -NH4Cl image from +NH4Cl image. (Scale bar:10 μm). (C) Quantification of the numbers of acidic vesicles from the difference images. The fluorescent vesicles were counted and plotted for HEK cells (22 cells, for both untreated and nic treated, n = 4) and cortical neurons (10 cells for untreated and 8 cells for nic treated, n = 3). Error bar represents mean ± s.e.m. **p<0.001 by student t test. n indicates number of independent experiments performed on separate days and cultures. (D) Model illustrating how trapping in acidic vesicles of weak base ligands like varenicline, lobeline and epibatidine is selective and regulated by nicotine. Ligand trapping is a function of weak base pKa and its affinity of the ligands for α4β2Rs in the case of α4β2R weak base ligands. As illustrated in the figure weak base ligands (Lig) for other receptors or transporters could also be trapped selectively.
Figure 5—figure supplement 1
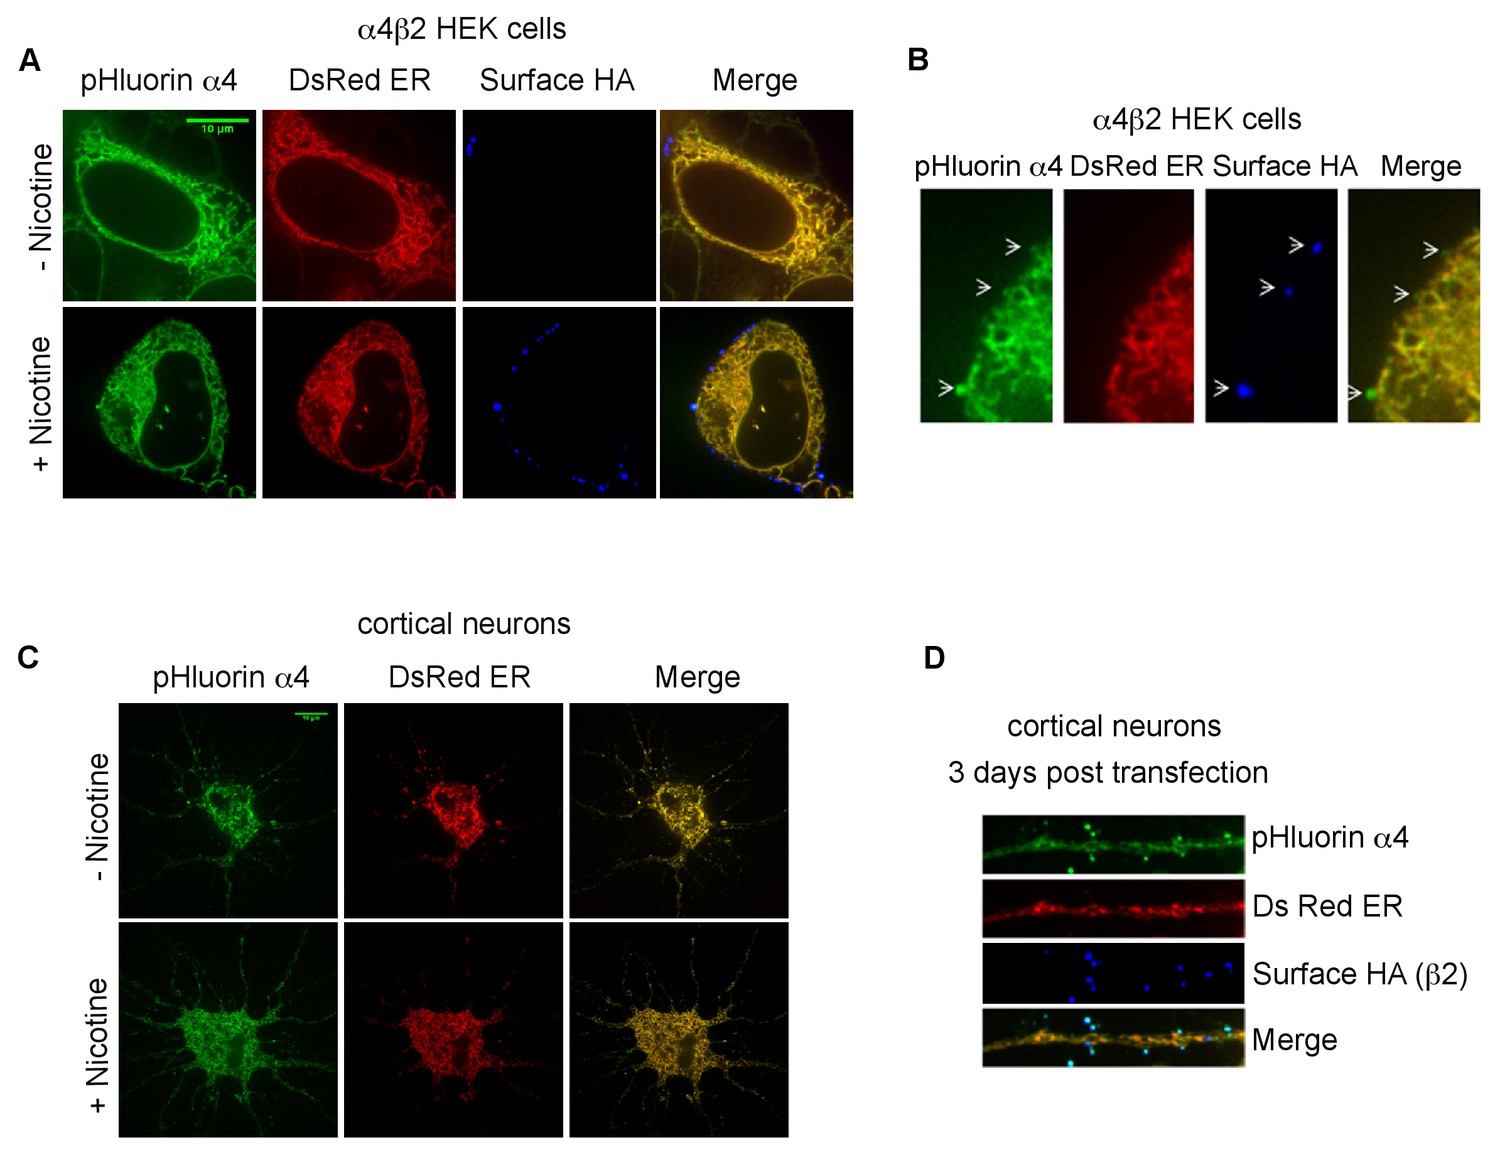
Subcellular distribution of pHluorin tagged α4 subunit (α4SEP) in α4β2R-expressing HEK cells and cortical neurons.
(A) HEK cells are displayed 36 hr post transfection. Transfected α4SEP subunits (green) and DsRed ER (red) are imaged in untreated (top panel) or nicotine treated (10 μM for 17 hr; bottom panel) cells. Stably transfected β2 subunits have an HA epitope (blue) at its C-terminal extracellular tail. Cell-surface receptors were labeled on live cells with anti-HA antibody and Alexa Fluor 647 conjugated anti-mouse secondary antibody. (B) Higher magnified images of the α4SEP subcellular distribution with the ER marker and surface labeling. (C) Cortical neurons (DIV9) are displayed 36 hr post transfection. Transfected α4SEP subunits (green), DsRed ER (red) and cell-surface β2HA (blue) are imaged in untreated (top panel) or nicotine treated (1 μM for 17 hr; bottom panel) cells. 36 hr post transfection α4SEP (green) showed co-localization with DsRed ER (red) with little to no surface expression. Scale bar is 10 μm. (D) Higher magnified images of the α4SEP subcellular distribution with the ER marker and surface labeling. Cell surface expression of α4SEP in cortical neuron dendrite three days post transfection. The surface expressed α4SEP co-localized with surface labeled β2HA in the dendrites. The α4SEP in the shaft showed typical ER distribution and co-localized with DsRed ER.
Tables
Table 1
pKas and Kis for the studied weak base α4β2R ligands
| Weak base | pKa (Basic) | Ki | Trapping |
|---|---|---|---|
| Varenicline (partial agonist) | 9.2 (Unal et al., 2012) | 0.4 nM (Rollema et al., 2010) | Yes |
| Lobeline (partial agonist) | 8.8 (Drugbank, 2016) | four nM (Damaj et al., 1997) | Yes |
| Epibatidine (agonist) | 9.5 (ChEMBL, 2017) | 0.01–0.05 nM (Whiteaker et al., 1998; Badio et al., 1994) | Yes |
| Nicotine (agonist) | 8.0 (Barlow and Hamilton, 1962) | eight nM (Whiteaker et al., 1998) | No |
| DHβE (competitive antagonist) | 7.3 (ChEMBL, 2017) | 0.3 μM (Whiteaker et al., 1998) | No |
| Mecamylamine (noncompetitive antagonist) | 11.2 (Remington and Beringer, 2006; Nangia et al., 1996) | >1 mM (Whiteaker et al., 1998) | No |
Download links
A two-part list of links to download the article, or parts of the article, in various formats.
Downloads (link to download the article as PDF)
Open citations (links to open the citations from this article in various online reference manager services)
Cite this article (links to download the citations from this article in formats compatible with various reference manager tools)
Selective and regulated trapping of nicotinic receptor weak base ligands and relevance to smoking cessation
eLife 6:e25651.
https://doi.org/10.7554/eLife.25651


