Lineage tracing of genome-edited alleles reveals high fidelity axolotl limb regeneration
- Yale University, United States
Figures
Figure 1 with 3 supplements

Comparison of CRISPR-generated alleles in original and regenerated axolotl limbs.
(A) Schematic of alleles generated by CRISPR-induced mutagenesis in original and regenerated axolotl limbs. Axolotls were zygotically injected with cas9 mRNA and single gRNA (top left), producing differing indels at the targeted site that are inherited in different cell lineages (top right, yellow depicts the putative cut site in an intact sequence of egfp, dashes depicted deleted sequence, red text depicts inserted sequences). This allelic mosaicism is revealed in NGS of an amputated limb. We allowed amputated limbs to regenerate to determine the extent to which the allelic mosaicism resembles that of the original limb (bottom). (B) Comparison of all alleles tracked in this study between original and regenerated limbs of 19 animals. The log scores of reads per million (RPM) of every allele in the original limb are significantly correlated with those of the secondary limb. All source data is found in Figure 1—source data 1.
-
Figure 1—source data 1
All allele counts in all animals.
- https://doi.org/10.7554/eLife.25726.008
Figure 1—figure supplement 1
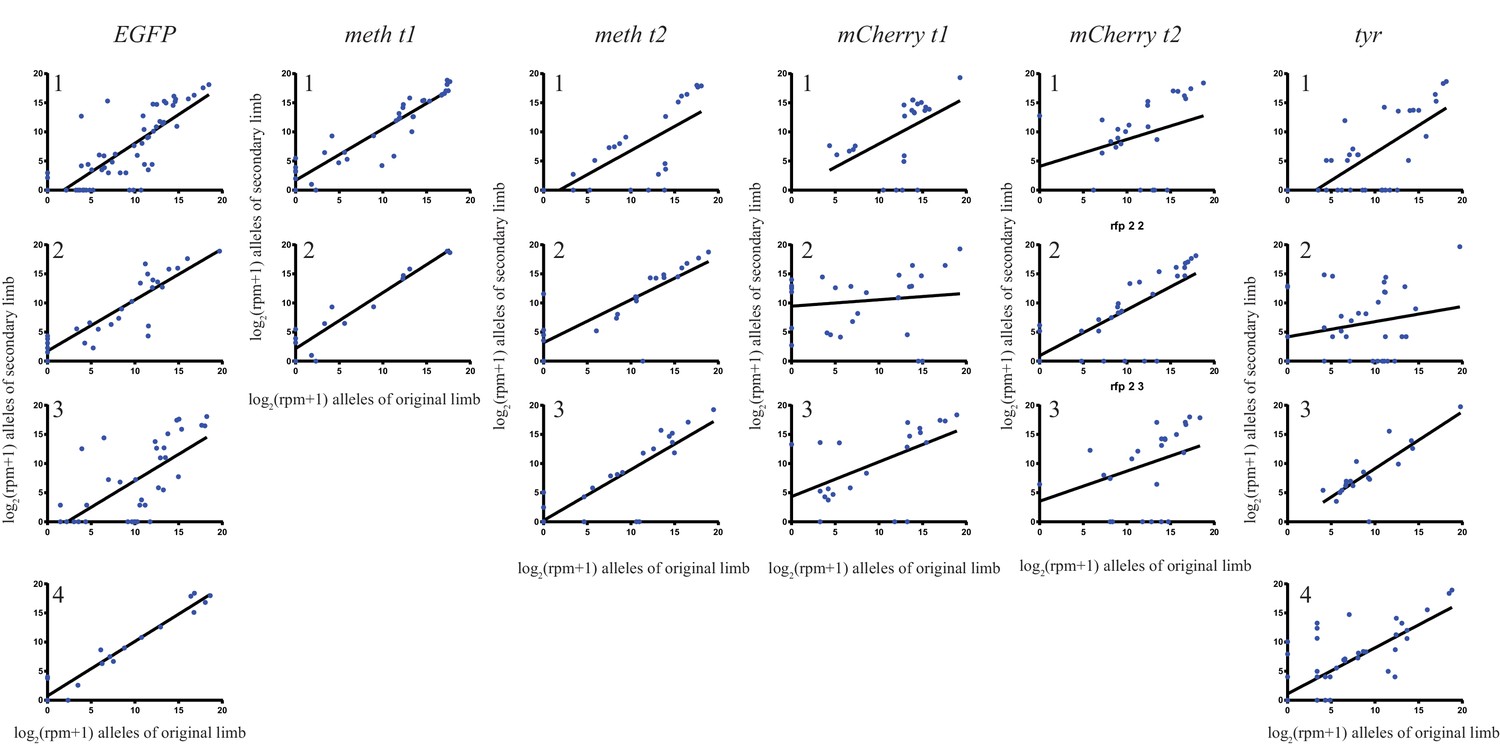
The log scores of reads per million (RPM) of every allele in the original limb compared with those of the secondary limb for each individual animal used in this study.
https://doi.org/10.7554/eLife.25726.003
Figure 1—figure supplement 2
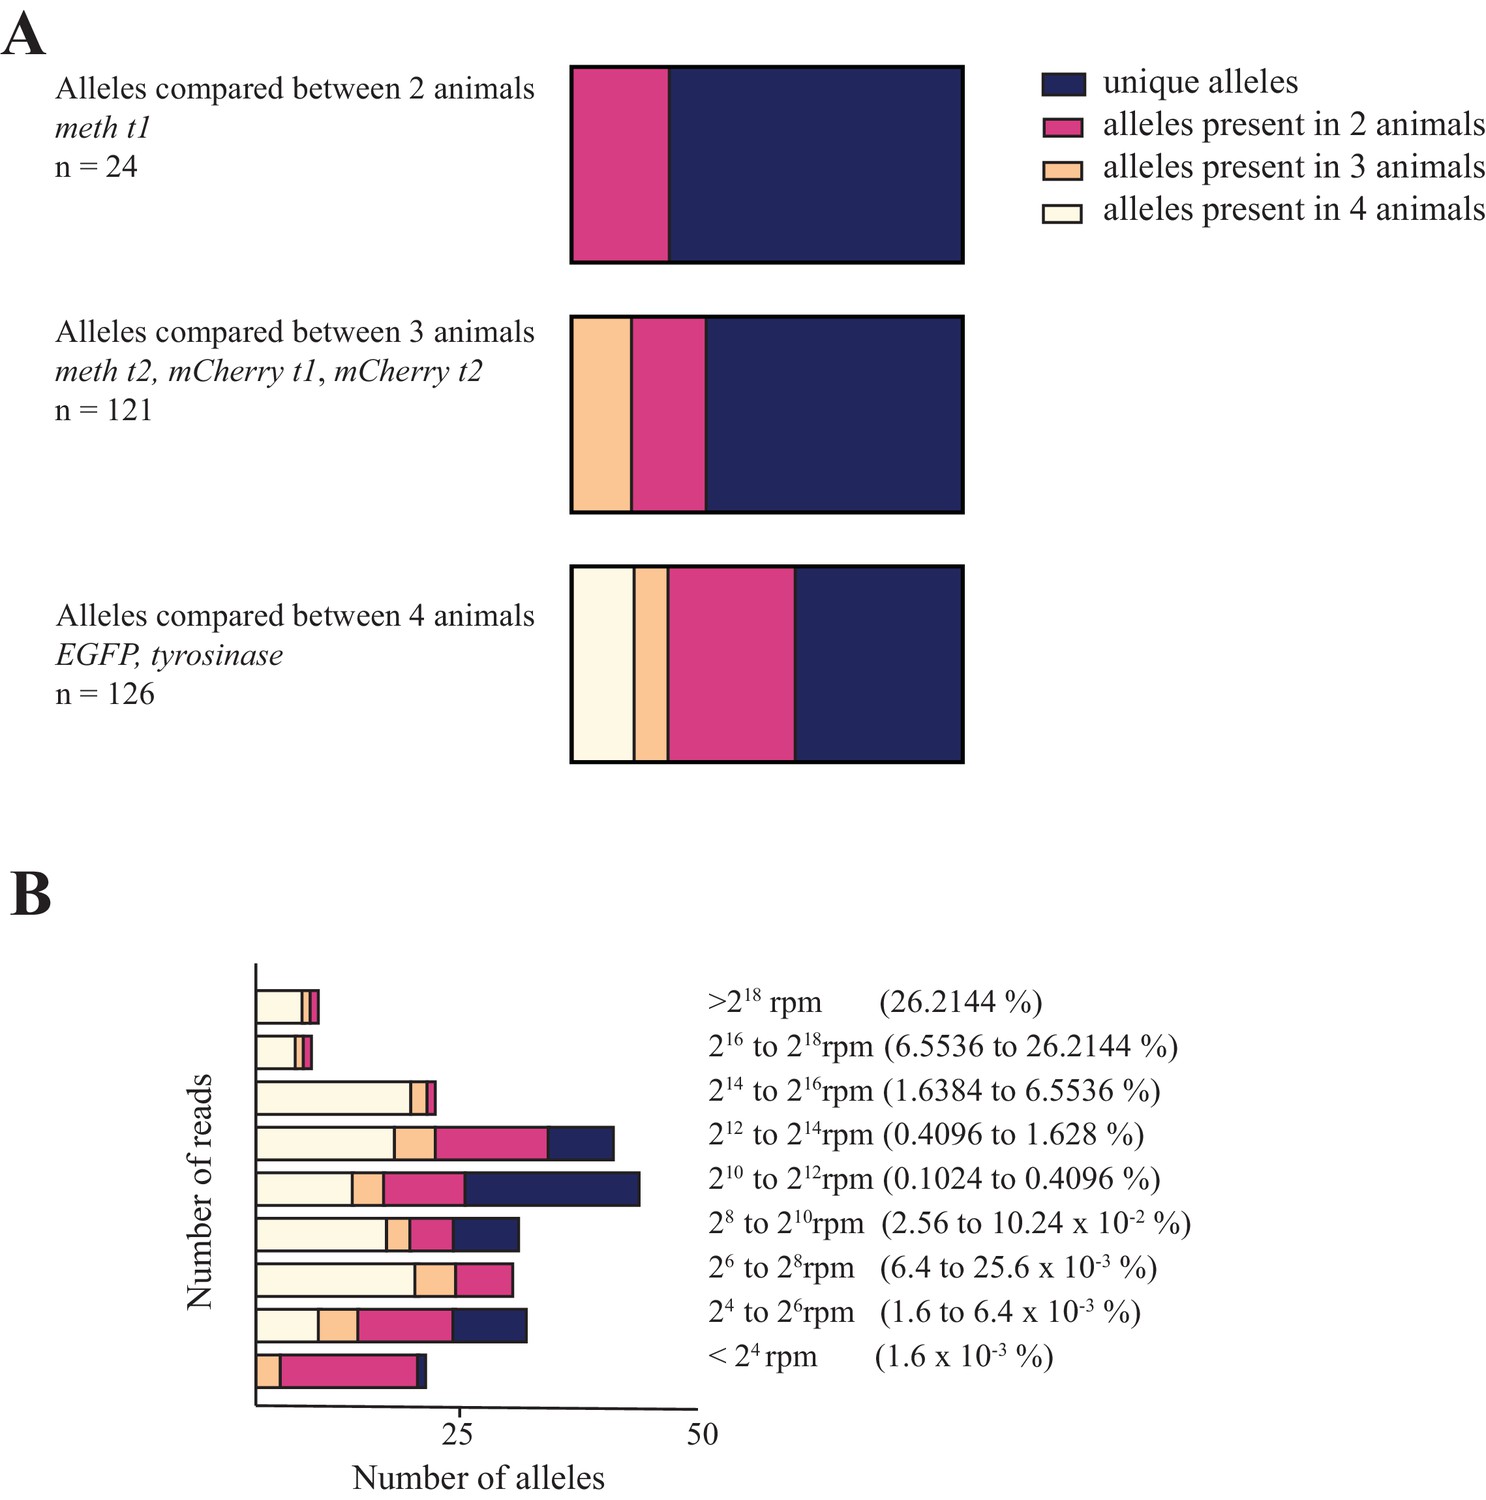
Characterization of the frequency with which alleles co-occur in different animals.
(A) Distribution of unique and shared indel sequences across animals injected with same gRNA. When individual allele sequences detected in animals injected with the same gRNAs are compared across animals, most alleles are found to be unique. (B) Distribution of alleles sorted by the number of reads and number of animals in which they occur in for gRNAs used to mutagenize four animals (egfp and tyrosinase). While all alleles receiving more than 1.6% of all reads in individual animals were non-unique, the majority of alleles receiving fewer reads in individual animals were found in only one or two animals. These data are available in Figure 1—figure supplement 2—source data 1.
-
Figure 1—figure supplement 2—source data 1
Counts of alleles that are unique and shared between animals.
- https://doi.org/10.7554/eLife.25726.005
Figure 1—figure supplement 3
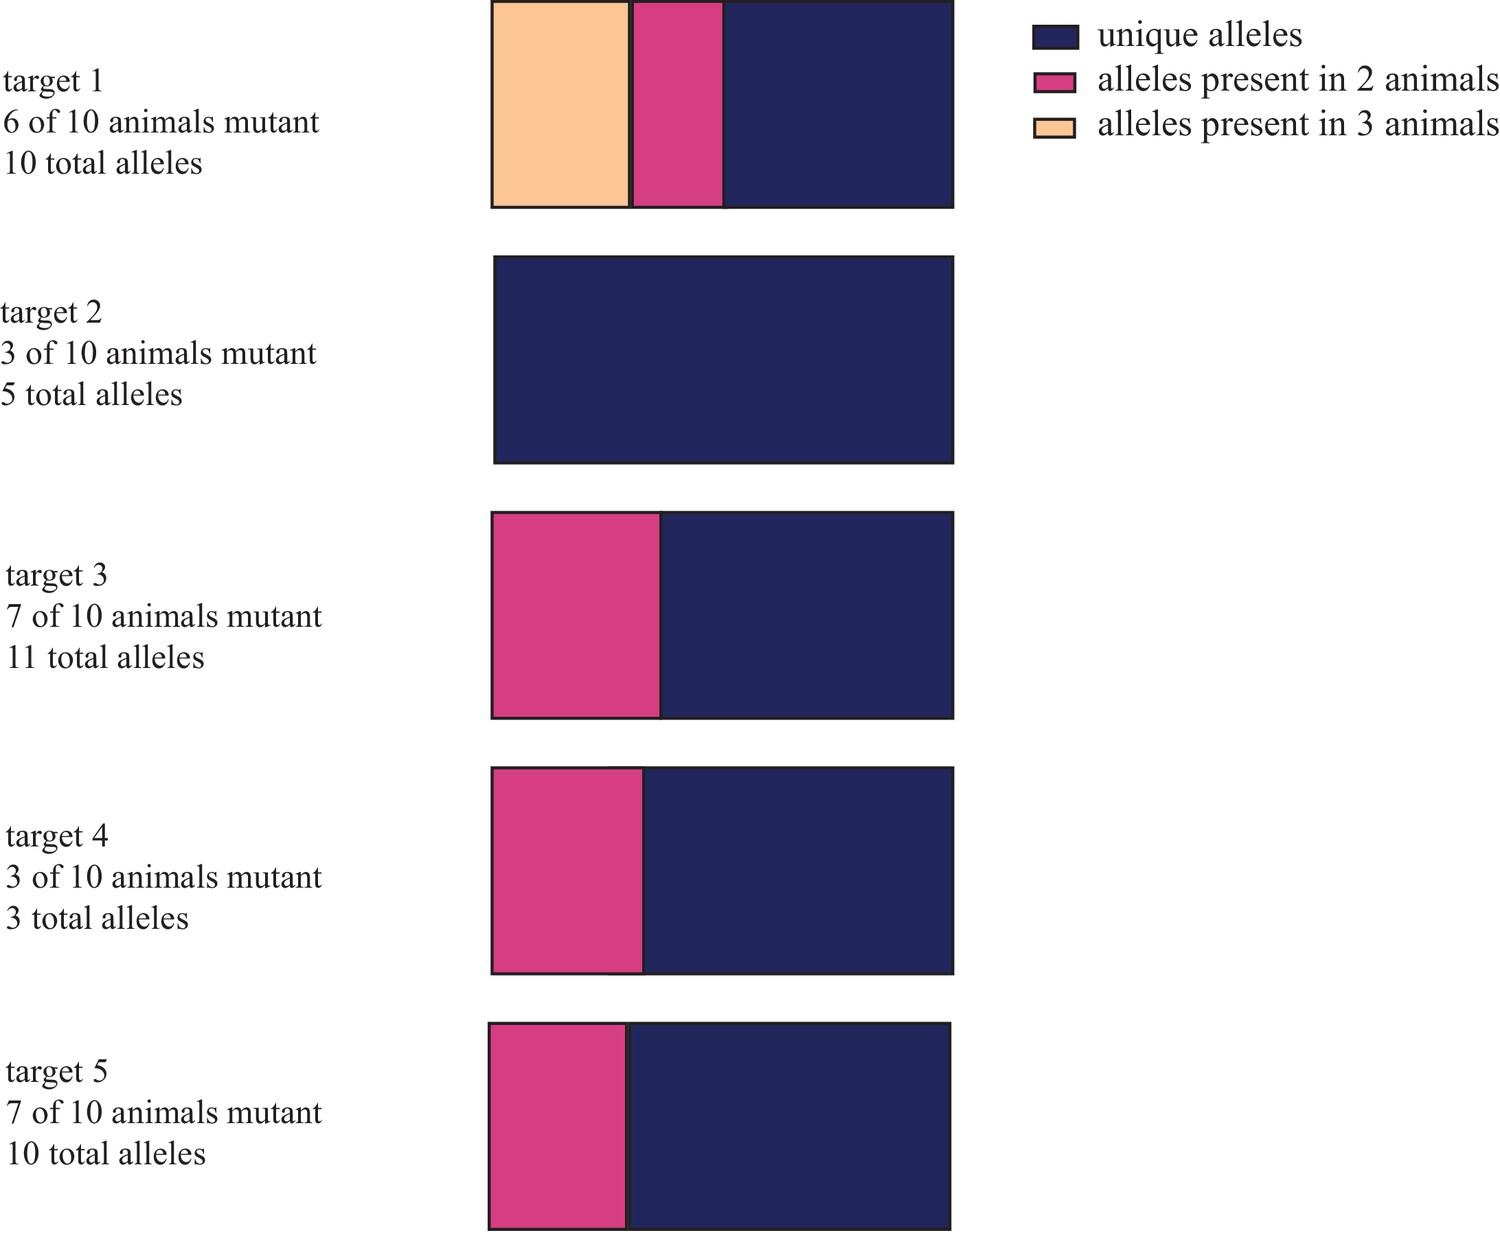
Distribution of unique and shared indel sequences across animals injected with reduced concentrations of cas9 and gRNAs.
Individual embryos were injected with 5 pg of each of 5 guide RNAs and either 100 or 1000 pg of cas9 mRNA. NGS of amplified targets from genomic DNA extracted two weeks post-injection from entire larvae revealed that individual animals had low frequency of mutagenesis with few or no alleles. 26 of 39 allele sequences detected were found in only one animal. Results here are separated by target. These data are available in Figure 1—figure supplement 3—source data 1.
-
Figure 1—figure supplement 3—source data 1
Counts of all alleles in animals injected with varying concentrations of cas9 and gRNAs.
- https://doi.org/10.7554/eLife.25726.007
Figure 2
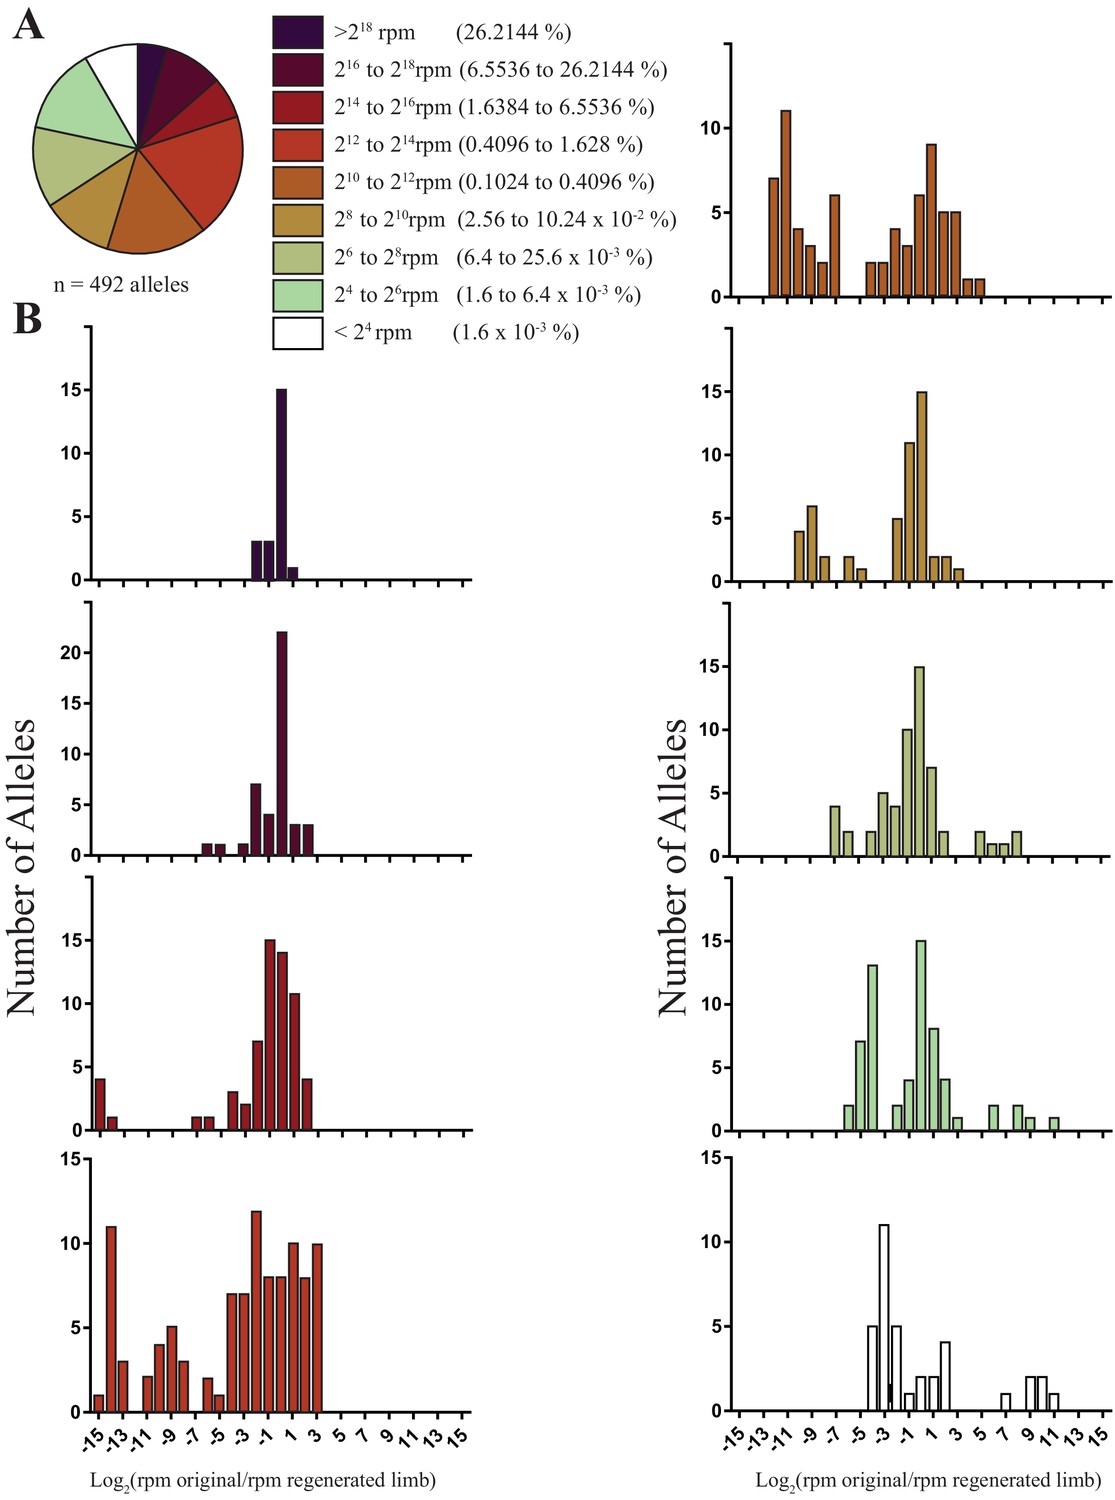
The sizes and fold changes of all alleles found in original and regenerated limbs in this study.
(A) Pie chart depicting numbers of all alleles identified in original limbs binned by RPM. The majority of alleles detected are low frequency (i.e., represent less than 1.6% of all sequence reads in limb). (B) Histograms depicting the log of fold change for all alleles after limb regeneration. The majority of low frequency alleles are retained.
Figure 3
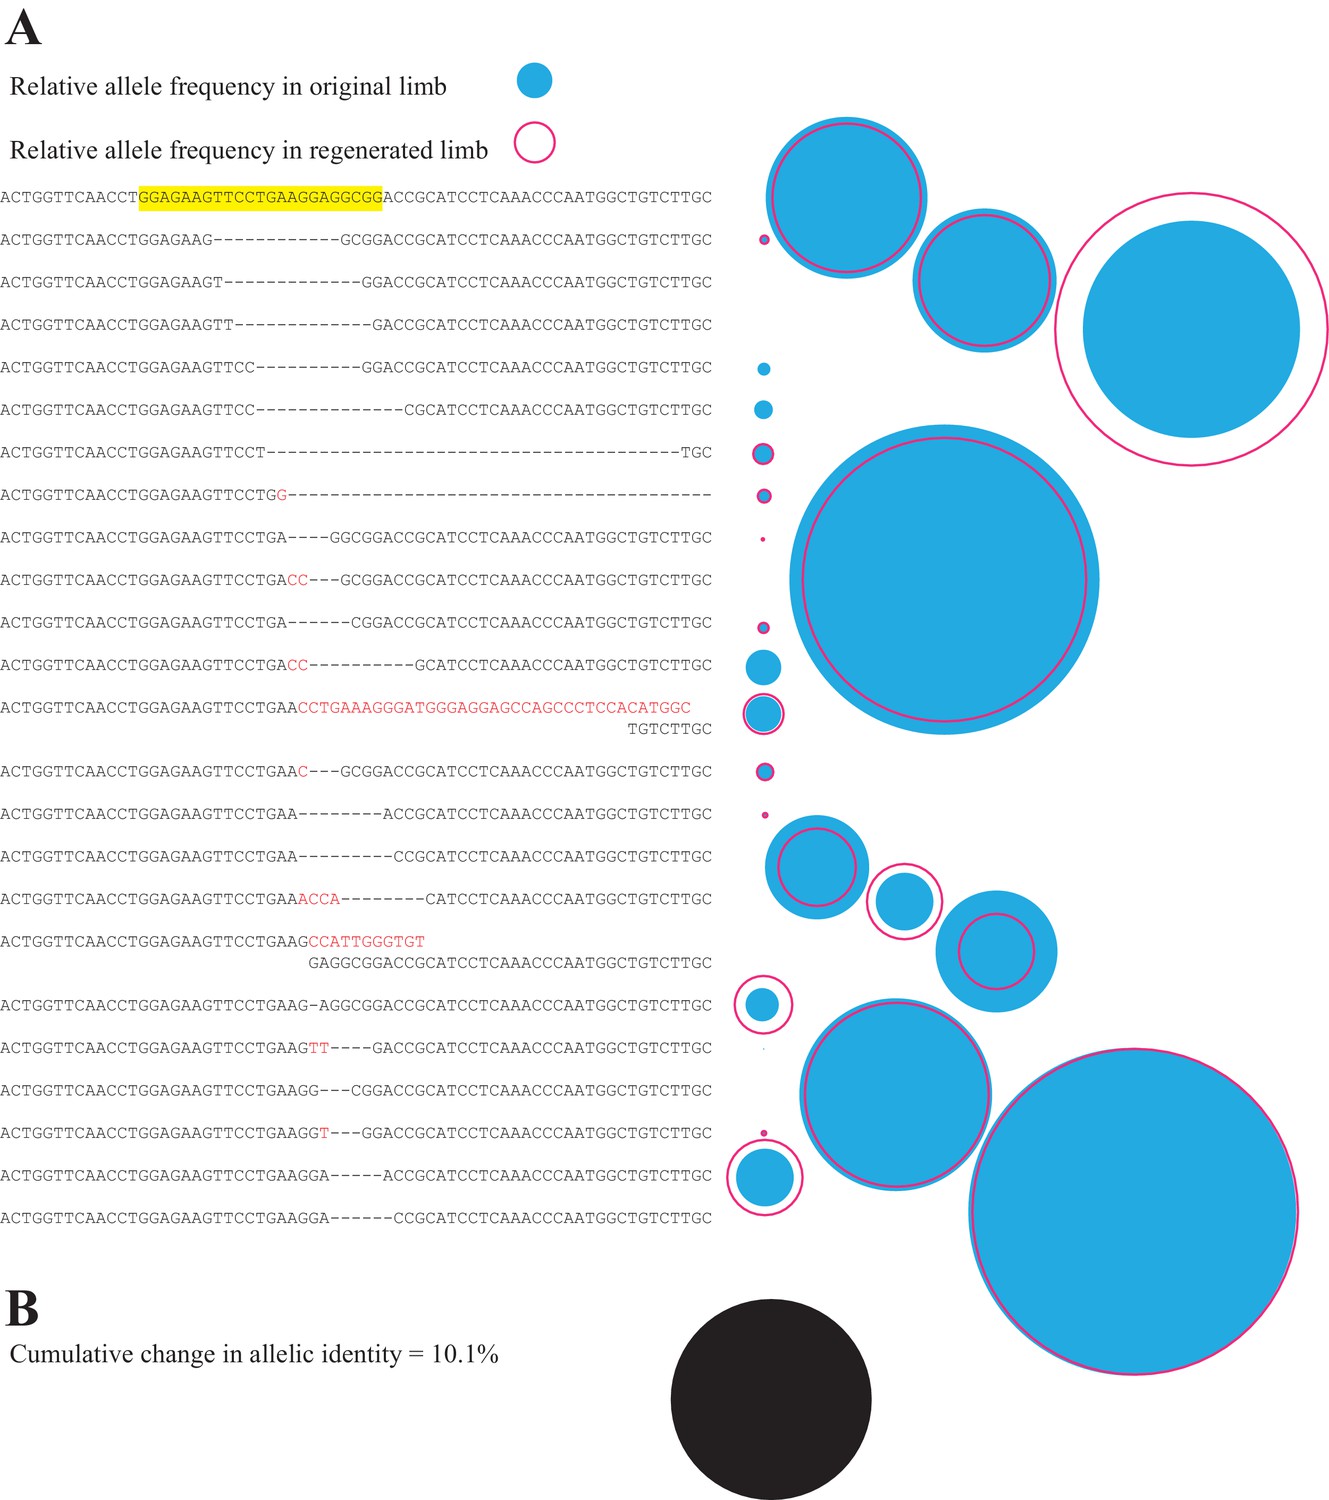
Comparison of all alleles in primary and secondary limb in one representative animal.
(A) Depiction of all identified alleles and their relative sizes in primary and secondary limbs of one individual mutagenized with meth t2 gRNA. The sequence of the gRNA and protospacer adapter motif of the intact highlighted sequence are depicted in yellow. The relative number of reads of each allele in the original (filled blue circle) or secondary limbs (open red circle) are depicted to the right of each allele. (B) The cumulative difference between all alleles of original and secondary limbs for the depicted animal represents 10.1% of all reads (filled black circle, drawn to the same scale employed in A).
Figure 4 with 2 supplements
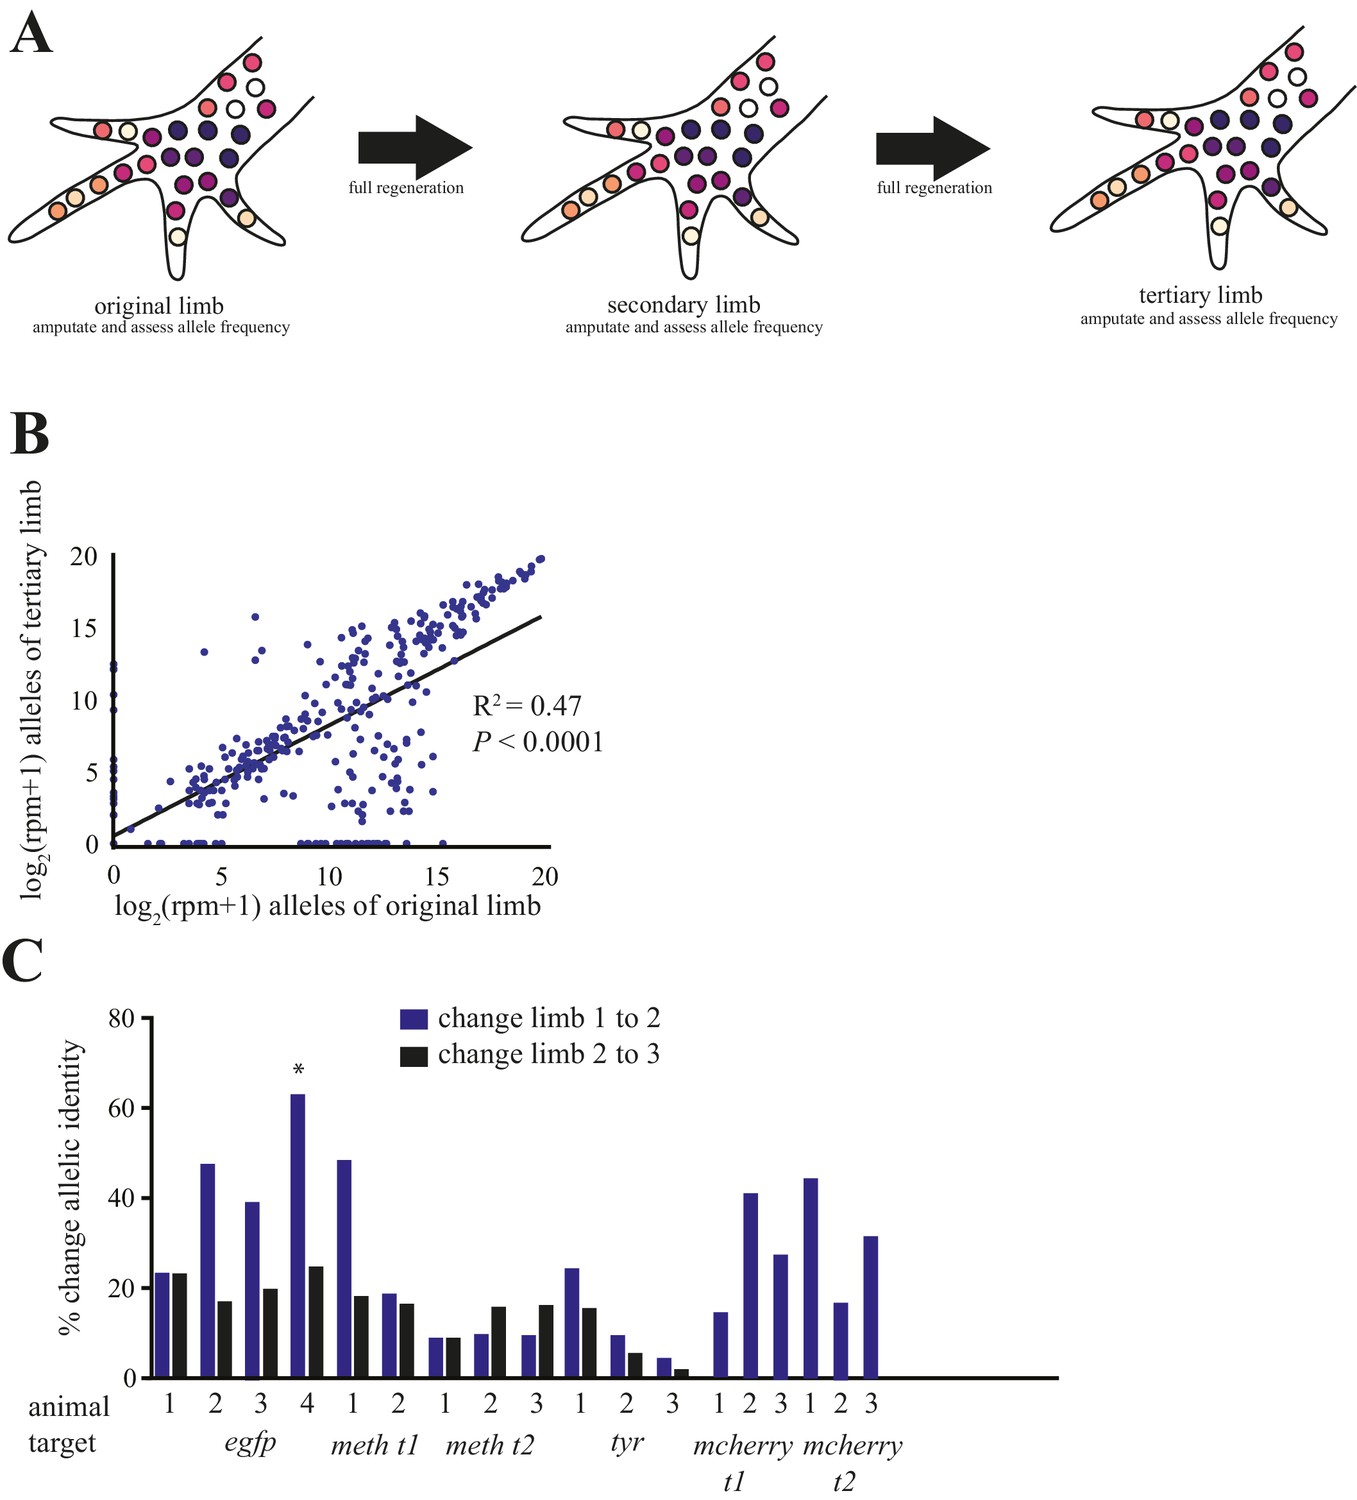
Comparison of alleles detected in primary, secondary, and tertiary limbs.
(A) Schematic depicting quantification of alleles in primary, secondary, and tertiary limbs. Mutagenized primary limbs were amputated, allowed to fully regenerate to produce secondary limbs, again amputated, allowed to fully regenerate to produce tertiary limbs, and amputated. (B) Comparison of frequency of all alleles tracked in this study between primary and tertiary limbs of 12 animals. The log scores of the normalized read number of every allele in the original limb are significantly correlated with those of the tertiary limb; data in Figure 1—source data 1. (C) The total percent changes in allelic identity for each secondary (blue) and tertiary (black) limb for each animal when compared to allelic frequencies of previous limb. The asterisk marks the single primary limb that exhibited polydactyly. These data are Figure 4—source data 1.
-
Figure 4—source data 1
Mutation frequency and allelic change in all animals.
- https://doi.org/10.7554/eLife.25726.014
Figure 4—figure supplement 1
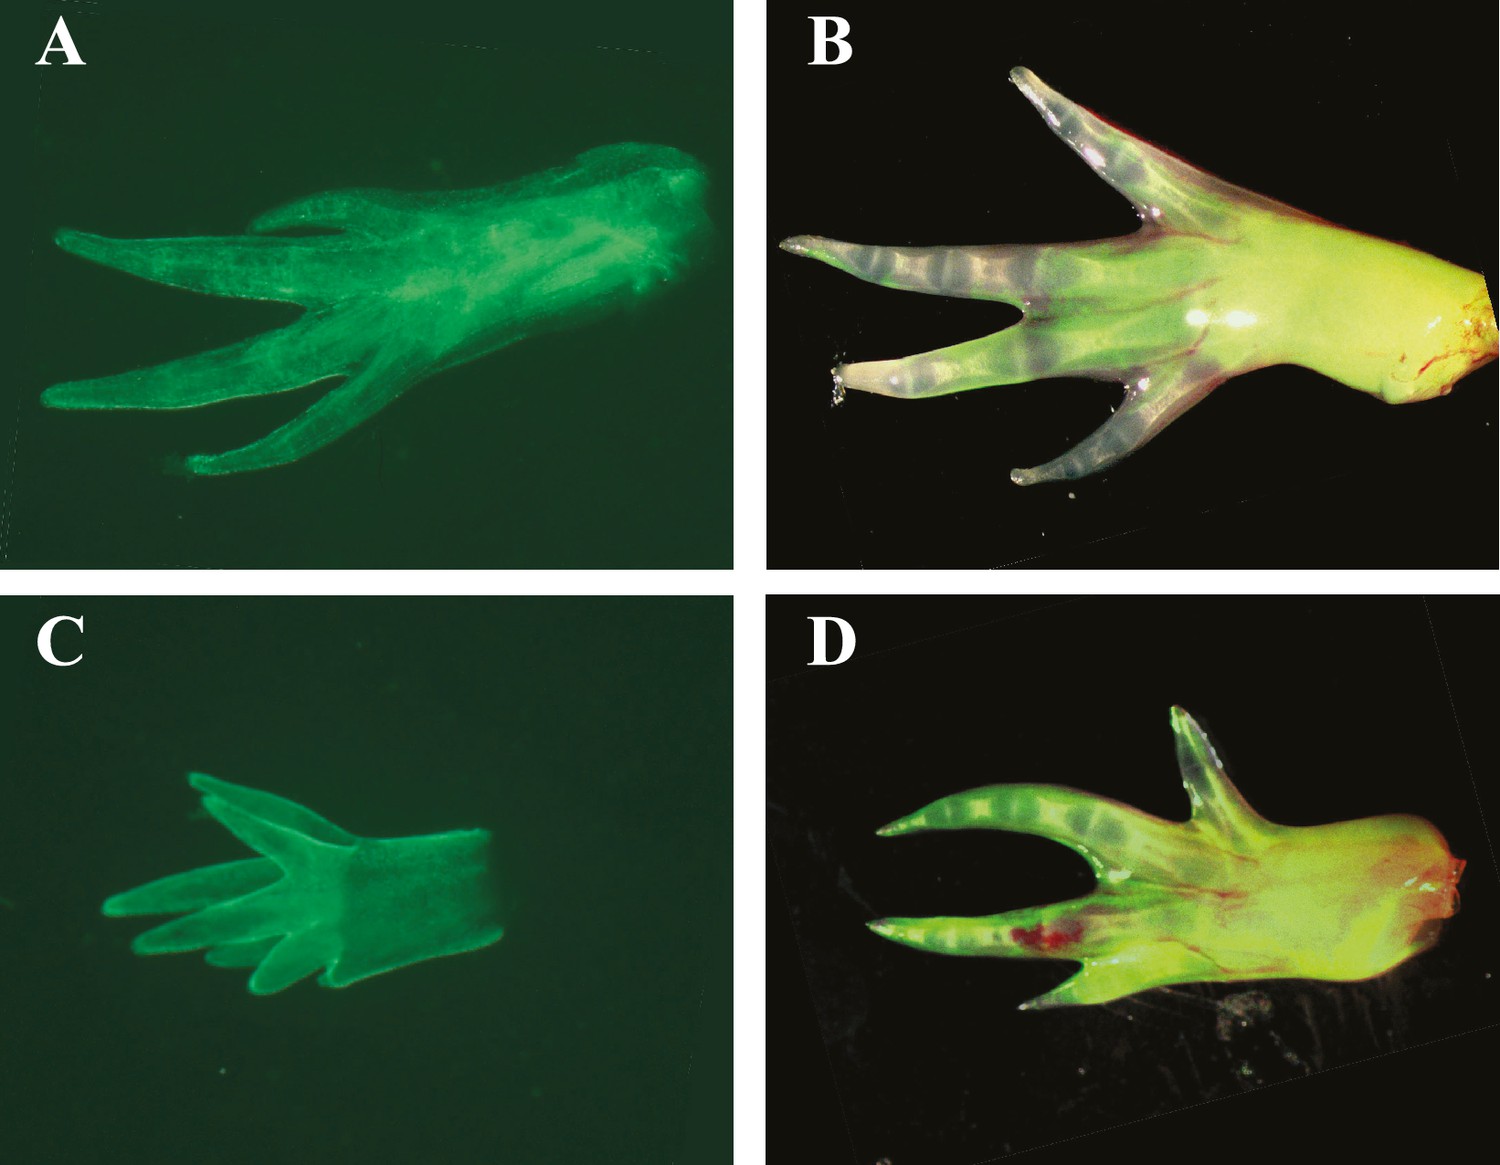
Spontaneous polydactyly in animal exhibiting dissimilar primary and secondary limb allelic identities.
(A) Original amputated limb of animal in which egfp has been targeted (EGFP 2) revealing normal development at time of amputation (green channel only). (B) Secondary limb of same animal depicted in A was morphologically normal at the time of second amputation (green and white overlay). (C) Original amputated limb of animal in which egfp has been targeted (EGFP 4) revealing morphologically abnormal development and spontaneous polydactyly at time of amputation (green channel only). (D) Secondary limb of same animal depicted in C was morphologically normal at the time of second amputation (green and white overlay).
Figure 4—figure supplement 2
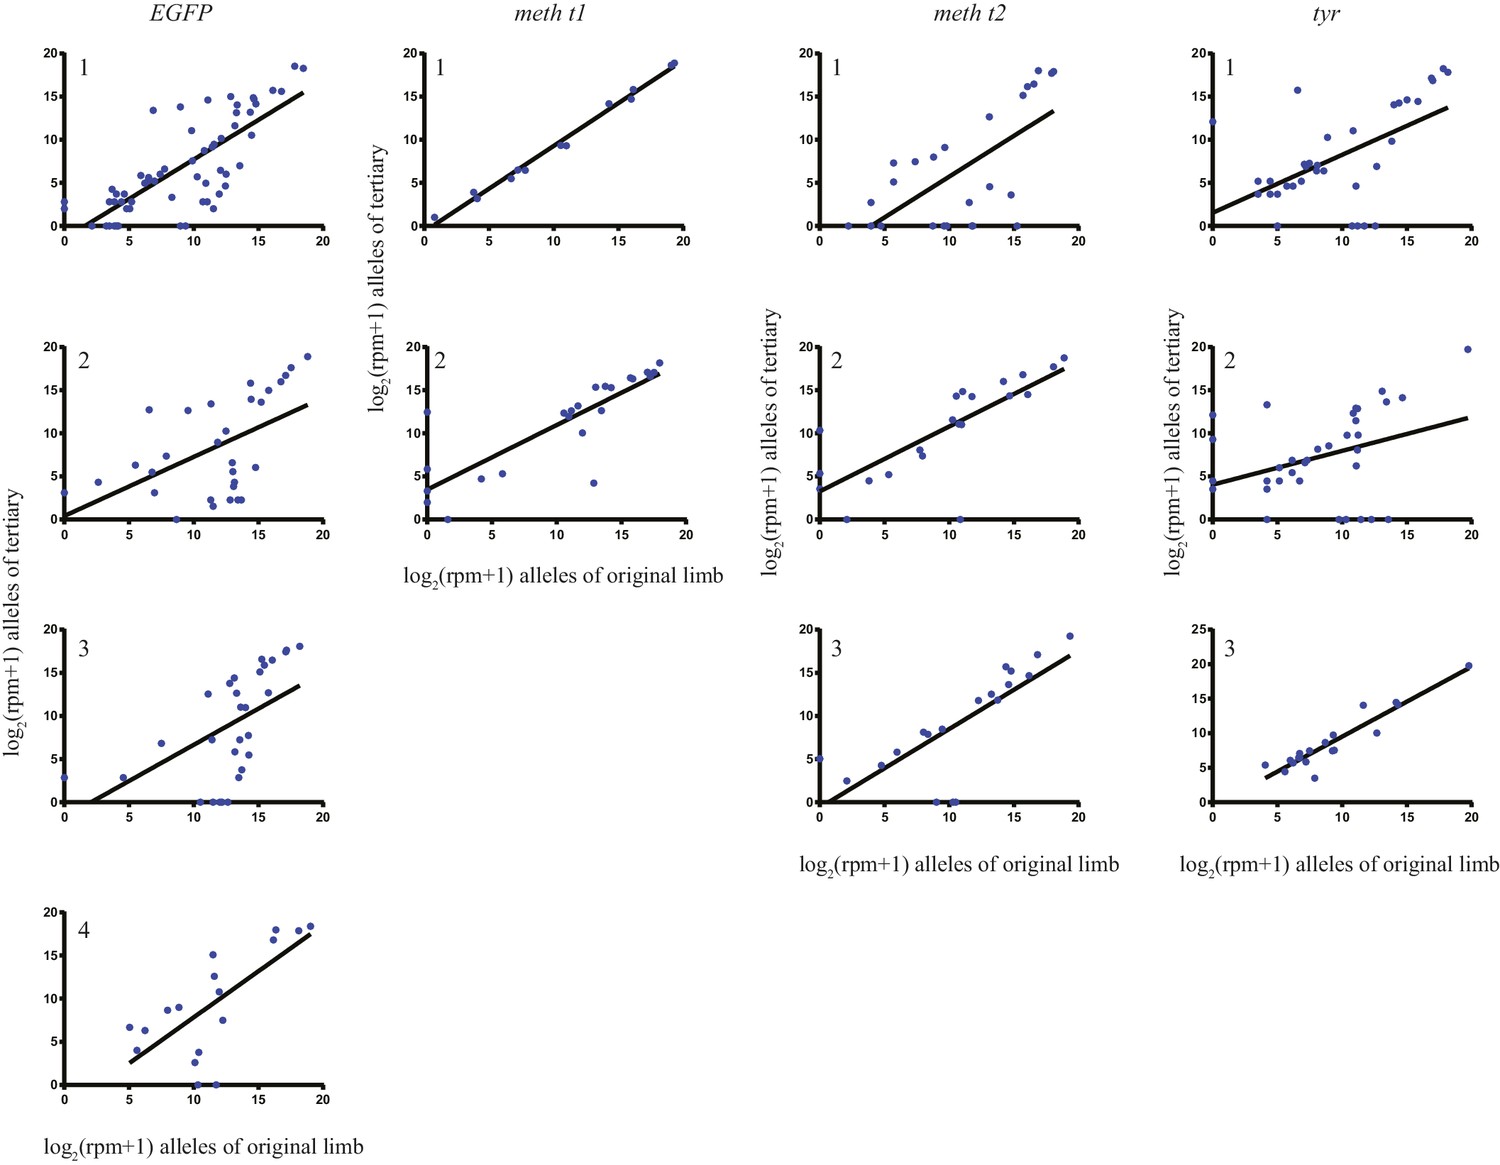
The log scores of reads per million (RPM) of every allele in the original limb compared with those of the tertiary limb for each individual animal that underwent secondary amputations.
https://doi.org/10.7554/eLife.25726.013
Figure 5 with 2 supplements
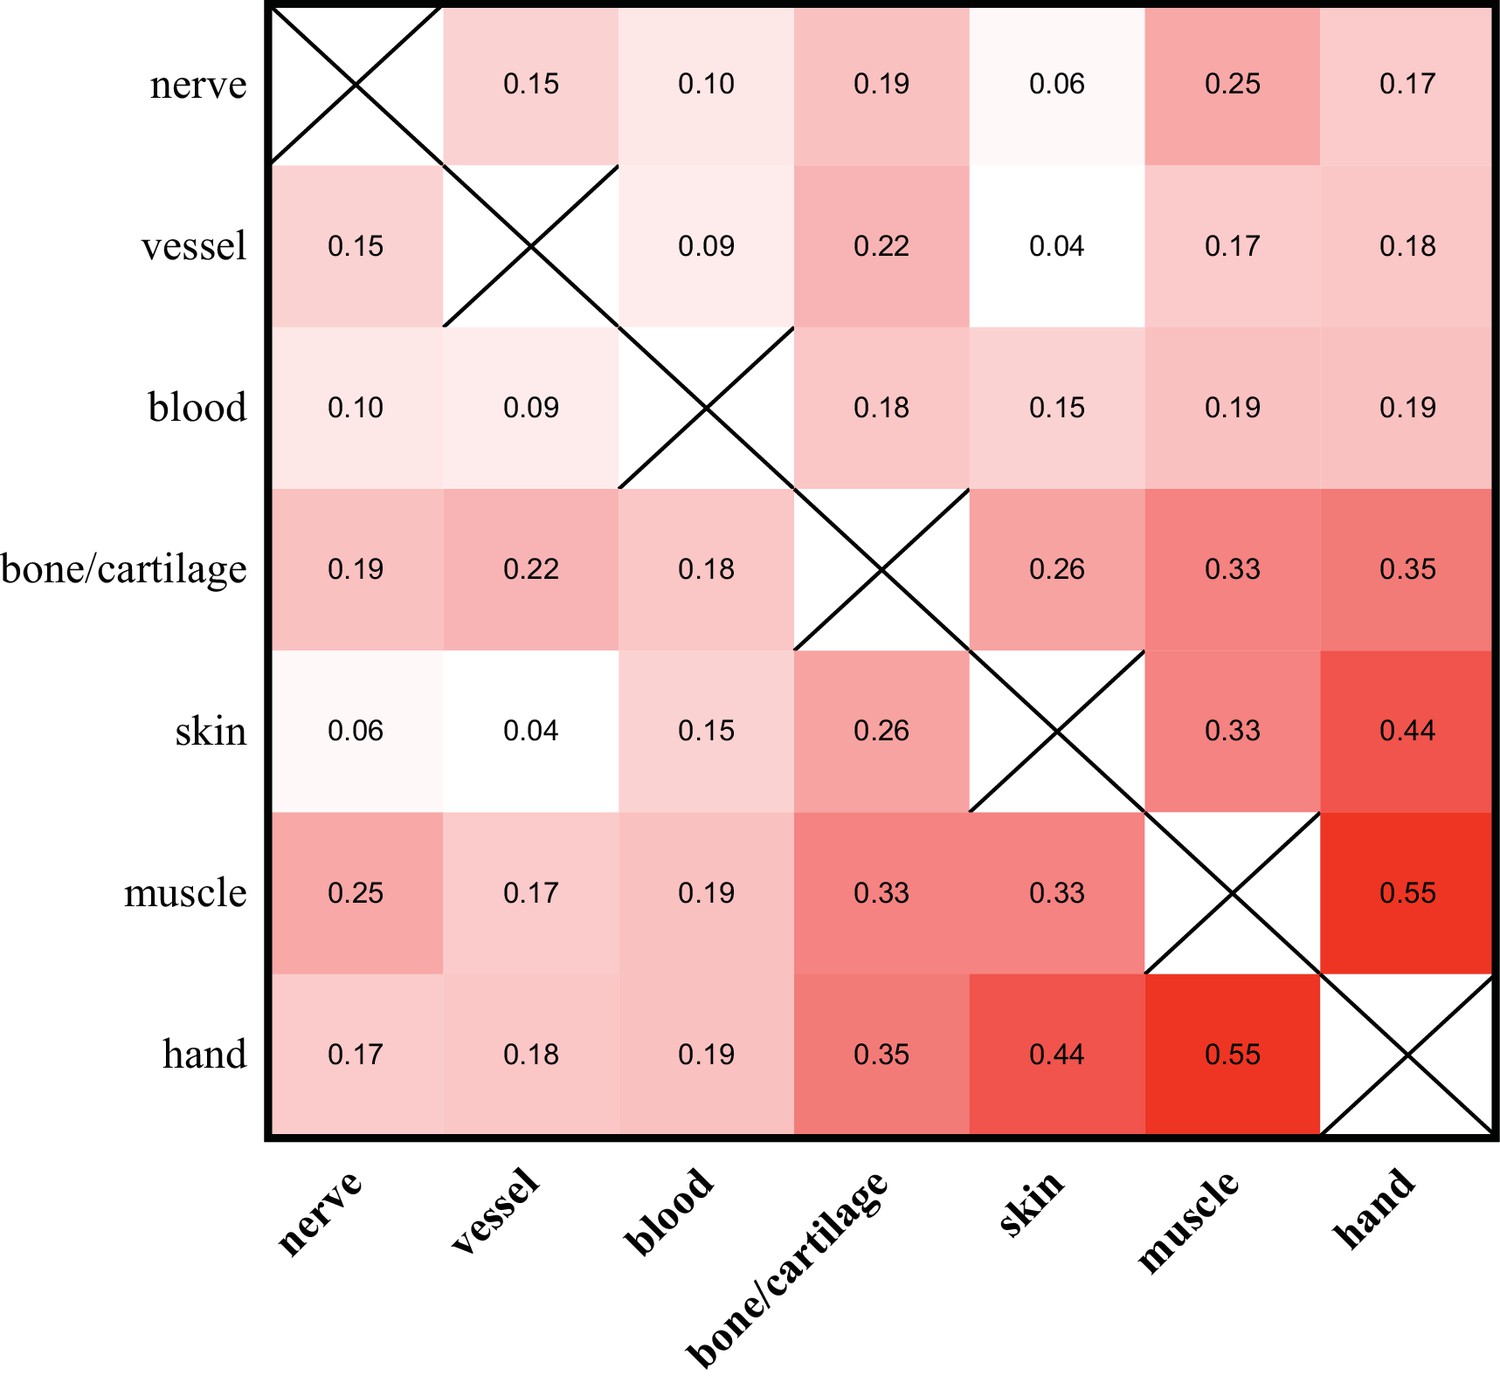
Allelic compositions of tissue-enriched samples vary relative to each other.
The heat map of the r2 log scores of normalized RPM +1 values for alleles of all tissue-enriched samples from four quaternary limbs and hands. More isolatable samples (nerve, vessel, and blood) display both low correlations to each other and to the hand, while more heterogeneous samples (bone/cartilage, skin, and muscle) are more correlated to each other and to the hand. These data are in Figure 5—source data 1.
-
Figure 5—source data 1
All allele counts in all tissues.
- https://doi.org/10.7554/eLife.25726.018
Figure 5—figure supplement 1

Identification and quantification of tissue-enriched alleles.
(A) Log scores of RPM of 171 alleles detected in tissue-enriched samples and hands from four quaternary limbs. Each column represents one allele across 6 tissue-enriched samples and hand. Alleles found at a high frequency in the hands of animals (most rightward 15 columns) are present at high frequency across most tissue samples (mean = 5.4 of 6 tissues, s.d. =±1.1, n = 15/171 alleles,). Tissue-enriched alleles are collected among alleles that are low-frequency in the hand (57/58; 27/58 not detected). (B) Pie chart depicting tissue-enriched alleles across tissues. Tissue-enriched alleles overrepresented in two tissue types are categorized by the single tissue in which they are most represented. (C) Heat map depicting P values of Fisher’s Exact tests comparing observed and expected distributions of tissue-enriched alleles among those that changed in frequency from primary to secondary, secondary to tertiary, and primary to tertiary limbs. Data in Figure 5—source data 1.
Figure 5—figure supplement 2
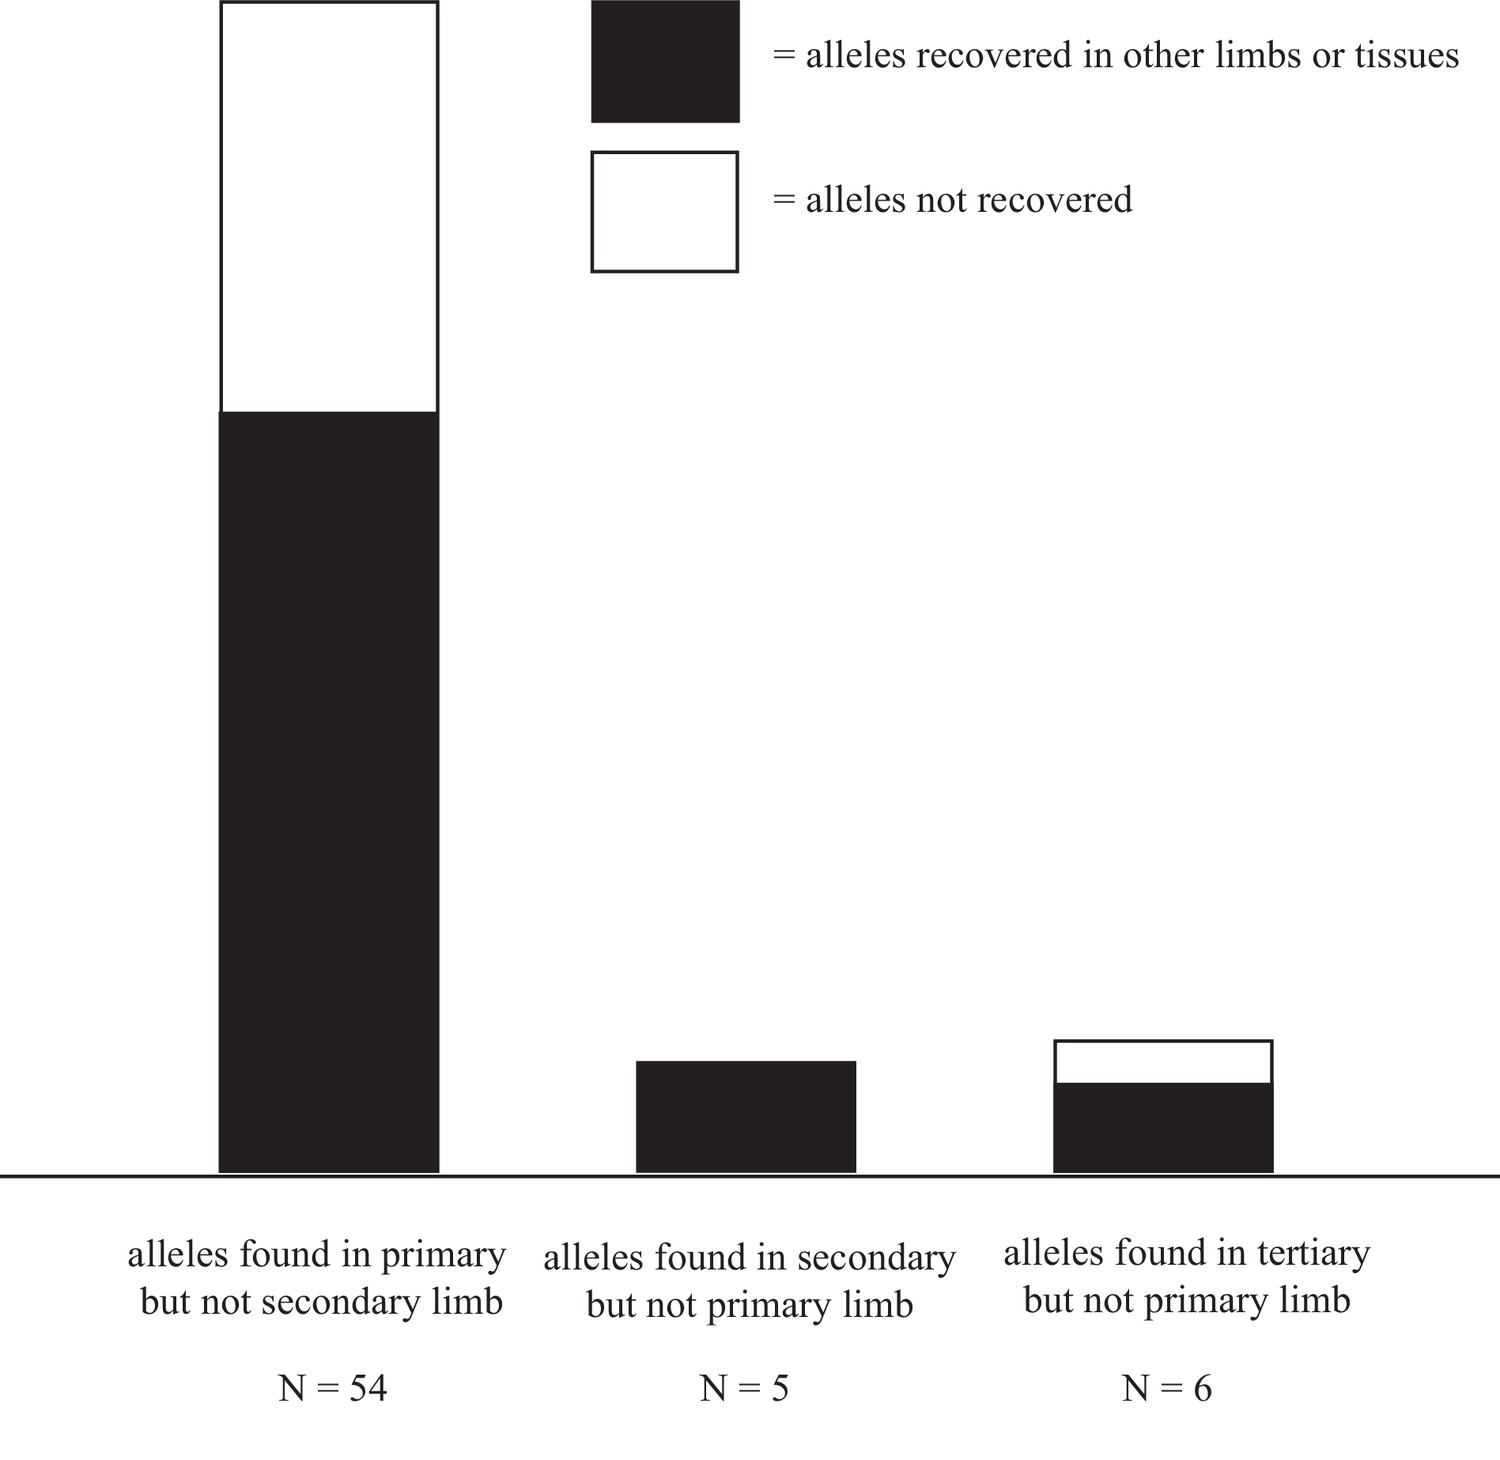
Alleles are disproportionally lost after first amputation.
36/54 alleles detected in the primary limb but not in the secondary, were also detected in the tertiary limb or tissue-enriched samples from the quaternary limb. 5/5 alleles present in the secondary limb but not in the primary were detected in the tertiary limb or tissue-enriched samples from the quaternary limb. 4/6 alleles detected in the tertiary limb but not in the primary were detected in the secondary limb or tissue-enriched samples from the quaternary limb. The relative abundance of both recovered and unrecovered alleles in the primary limb likely reflect the true loss of cell lineages after amputation and the greater allelic density in the DNA samples extracted from the primary limb, as this limb is the smallest of all sampled limbs. Data in Figure 5—source data 1.
Additional files
-
Supplementary file 1
Primers and gRNA target sequences.
- https://doi.org/10.7554/eLife.25726.019
-
Transparent reporting form
- https://doi.org/10.7554/eLife.25726.020
Download links
A two-part list of links to download the article, or parts of the article, in various formats.
Downloads (link to download the article as PDF)
Open citations (links to open the citations from this article in various online reference manager services)
Cite this article (links to download the citations from this article in formats compatible with various reference manager tools)
Lineage tracing of genome-edited alleles reveals high fidelity axolotl limb regeneration
eLife 6:e25726.
https://doi.org/10.7554/eLife.25726


