A bioactive peptide amidating enzyme is required for ciliogenesis
- University of Connecticut Health Center, United States
- University of California Los Angeles, United States
- University of California, Los Angeles, United States
Figures
Figure 1 with 3 supplements
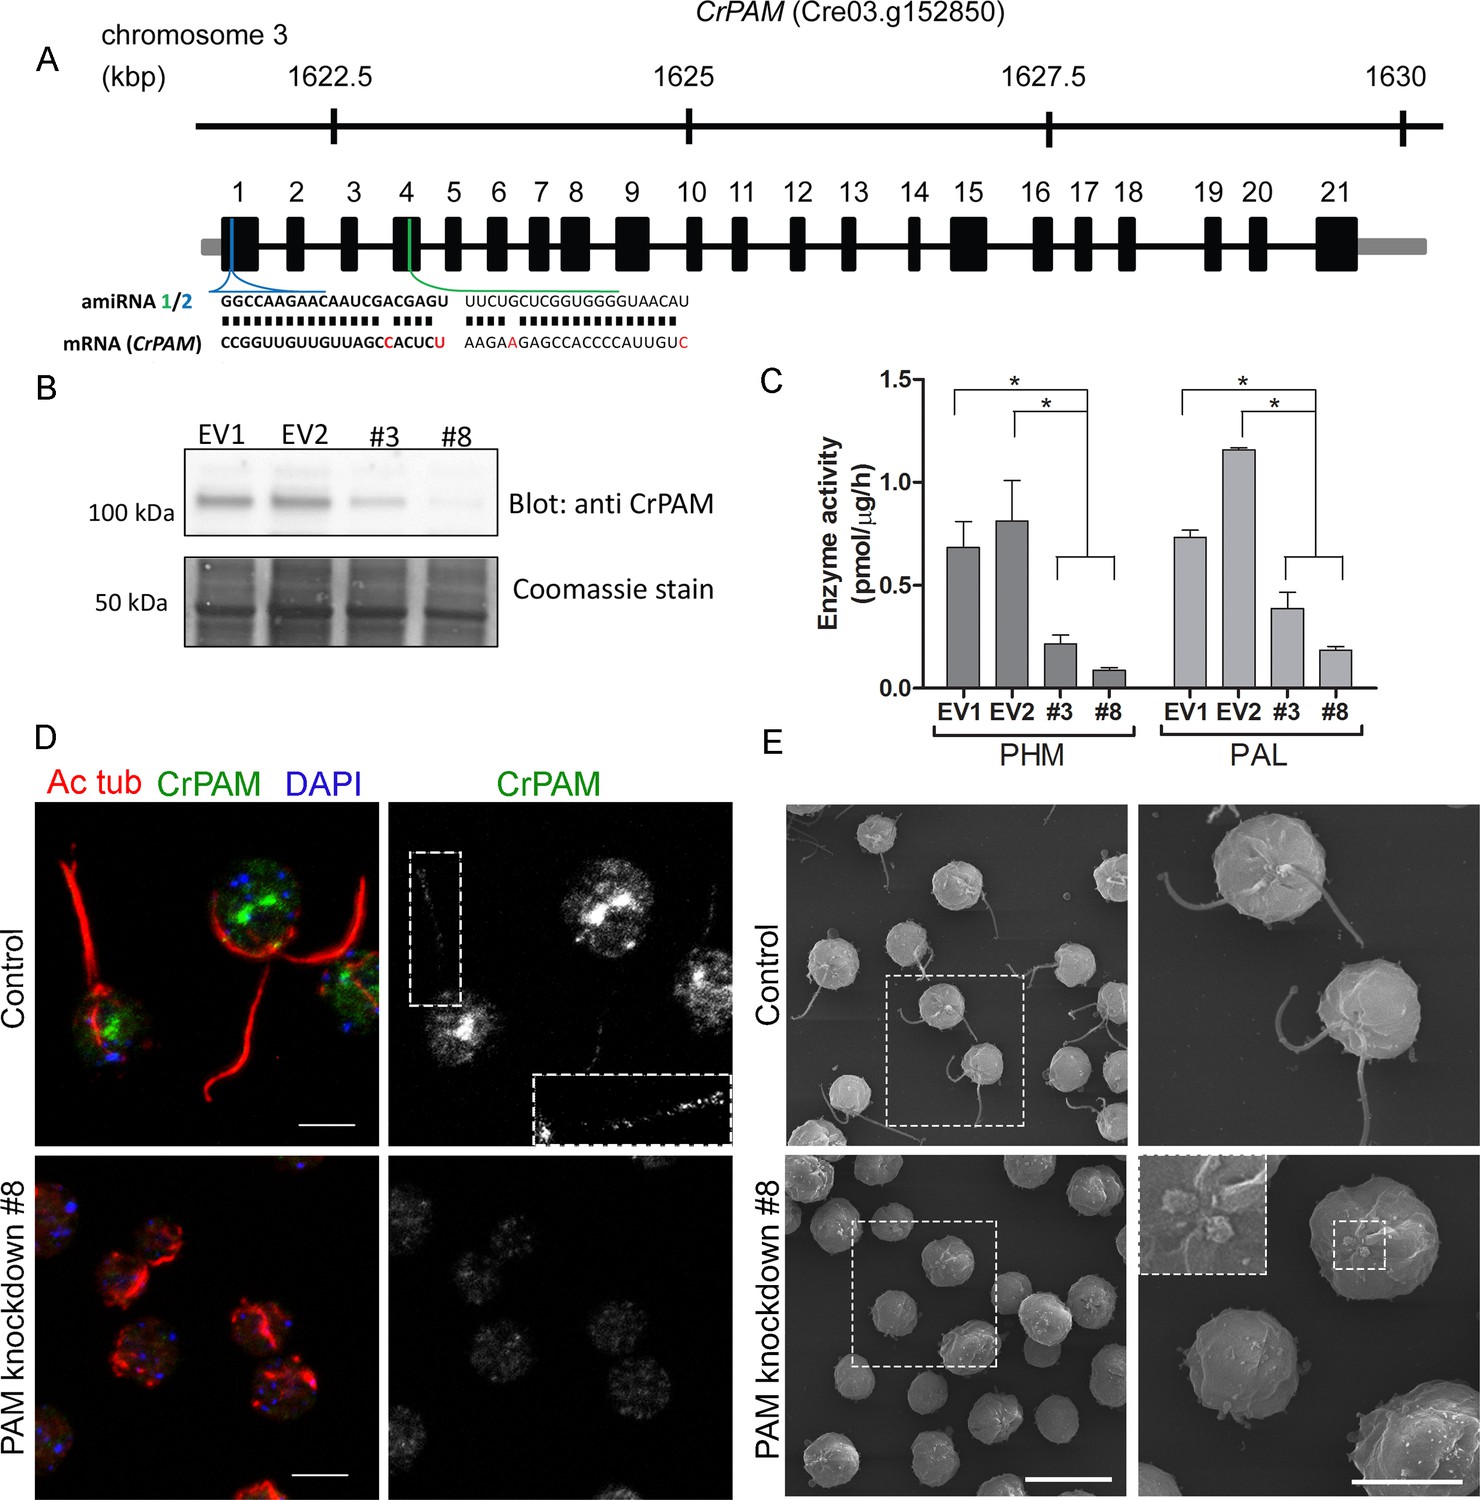
Knockdown of PAM disrupts ciliogenesis in C. reinhardtii.
(A) Schematic showing CrPAM (Cre03.g152850) gene structure and amiRNA target sequences near the 5’ end of the CrPAM mRNA (amiRNA1, green; amiRNA2, blue). 5’- and 3’-untranslated regions (gray bars), exons (numbered rectangles) and introns (black lines) drawn to scale. (B) Cell lysates prepared from control strains transformed with empty vector (EV1 and EV2) and knockdown strains transformed with the CrPAM amiRNA2 construct (#3 and #8) were subjected to western blot analysis using an antibody to the C-terminal domain of CrPAM. Top panel shows reduction of CrPAM band intensity (110 kDa) in the two knockdown strains. Coomassie staining of the membrane (bottom panel) shows equal loading. (C) PHM and PAL specific activities in cell lysates from triplicate assays (mean ± SD). Asterisks indicate p<0.05 in a one-way Anova. (D) Immunofluorescence images of C. reinhardtii control and PAM amiRNA2 #8 cells stained with antibodies to acetylated tubulin (red) and CrPAM (green) acquired at equal exposure. Right panels show CrPAM staining in the cilium (inset) and Golgi, which is lost in knockdown cells. Acetylated tubulin staining shows loss of cilia; cortical microtubules are still visible in knockdown cells. Scale bar, 5 µm. (E) Scanning electron micrographs of control (top panels) and PAM amiRNA2 #8 cells (bottom panels) at low (left panels, scale bar, 10 µm) and high (right panels, scale bar, 5 µm) magnification.
Figure 1—figure supplement 1
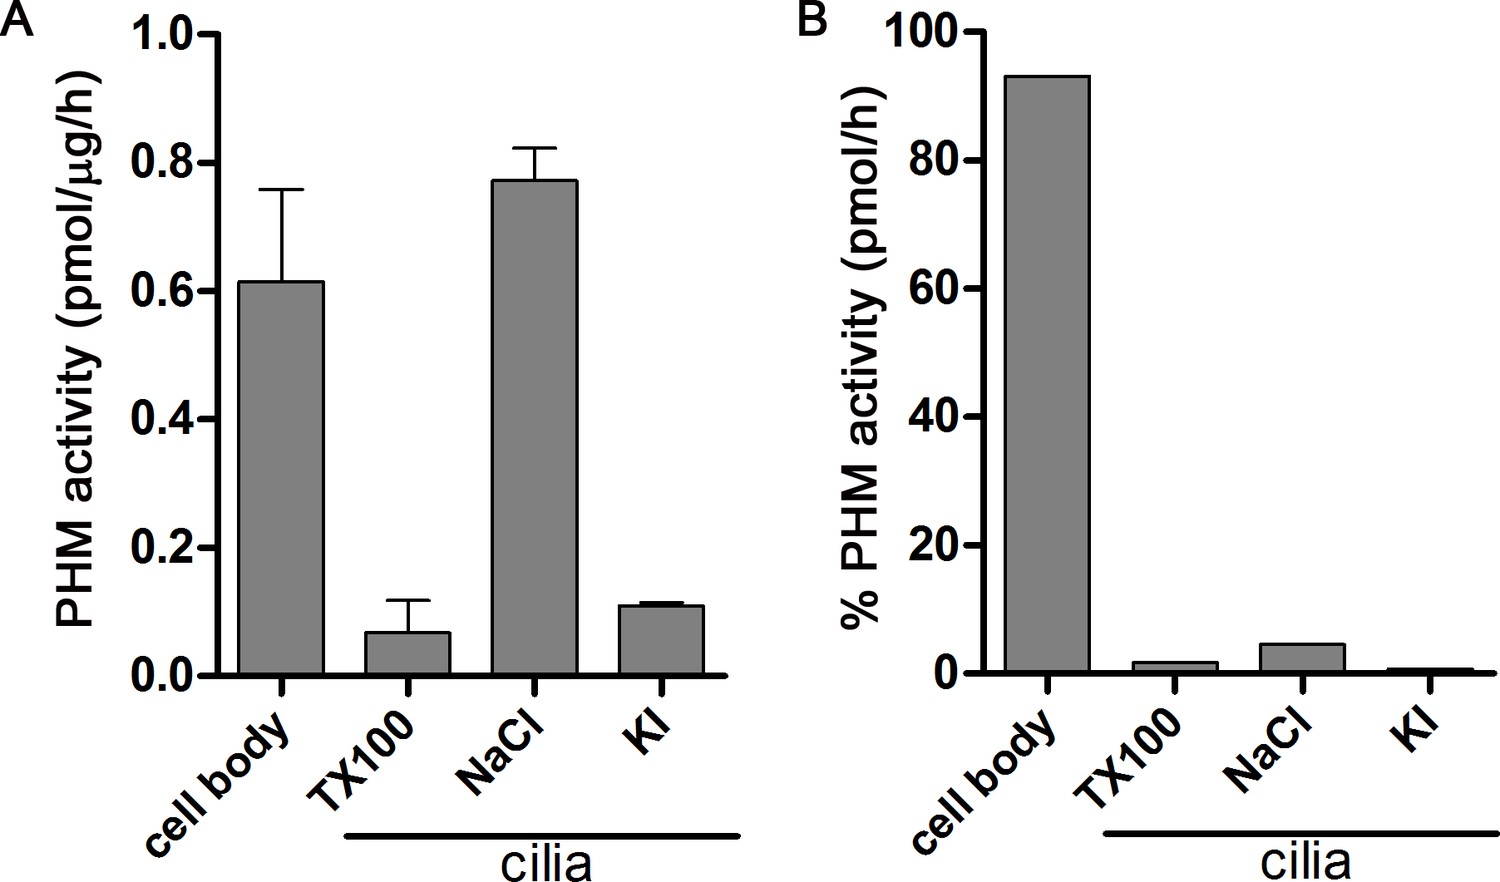
Distribution of PHM activity in cilia and cell bodies of C. reinhardtii.
(A) PHM specific activity in deciliated cell bodies and detergent (Triton X-100) and salt (NaCl and KI) extracted ciliary fractions. As shown previously (Kumar et al., 2016b), ciliary PAM associates with the axoneme and is released by 0.6 M NaCl treatment. (B) Percent PHM activity in different cellular fractions; only 7% of the total activity is present in cilia.
Figure 1—figure supplement 2
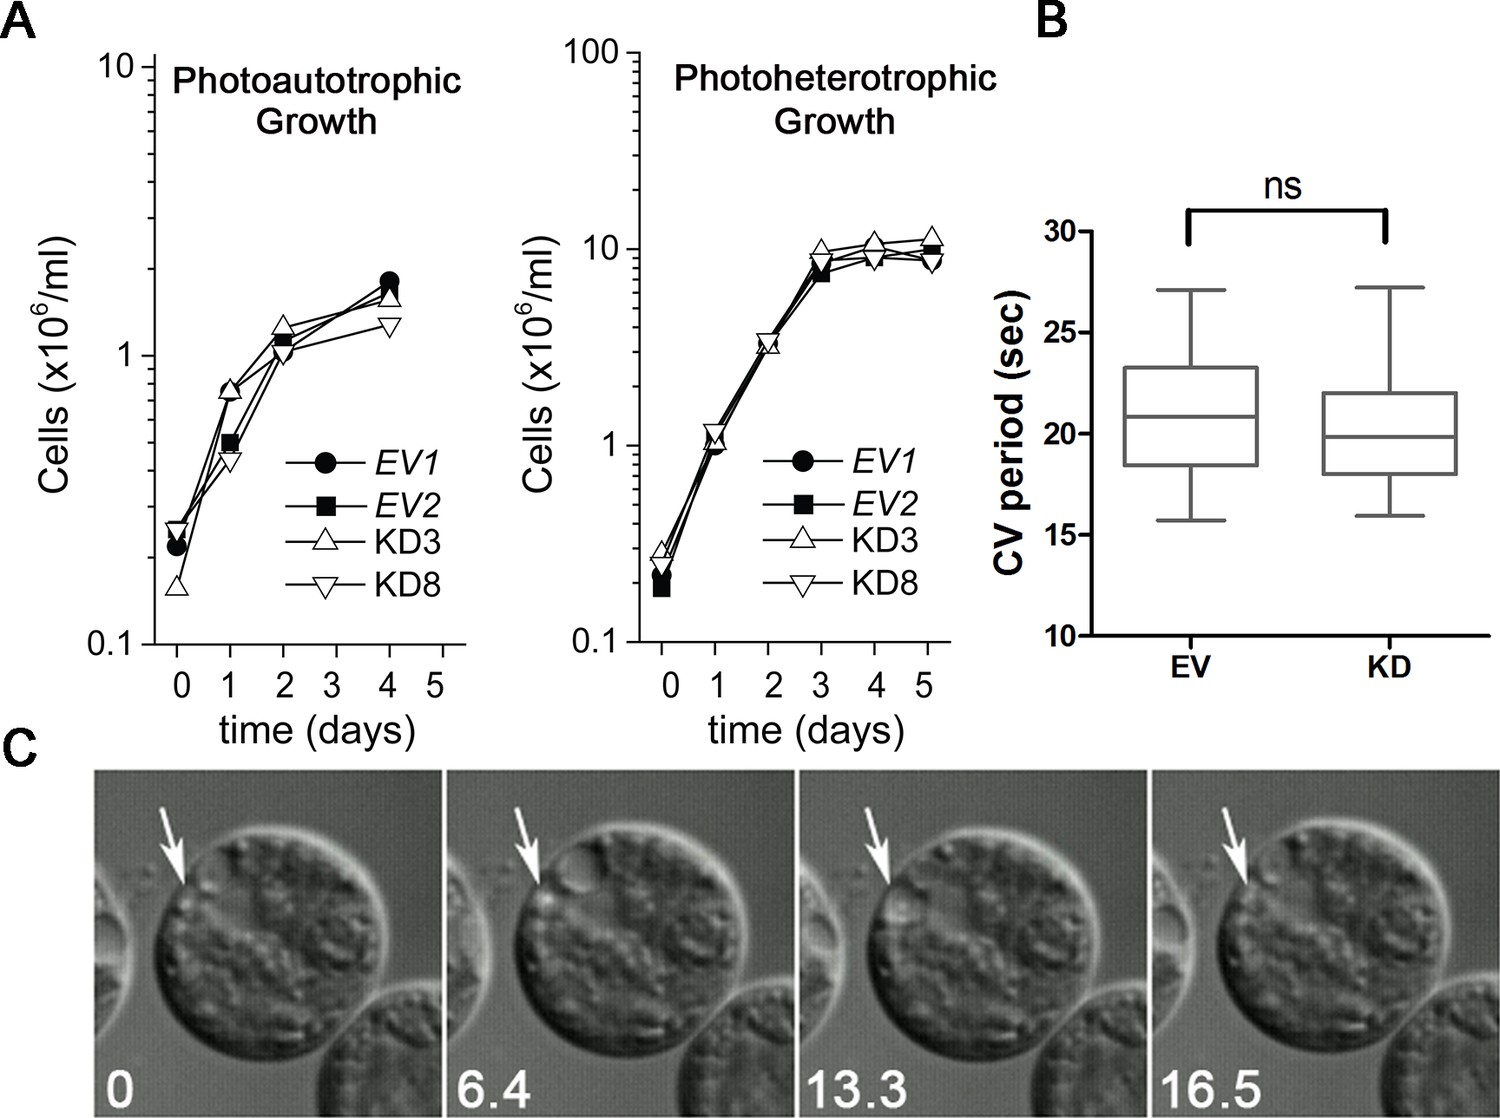
Knockdown of PAM does not affect cell growth or the contractile vacuole cycle.
(A) Empty vector (EV1 and EV2) and PAM knockdown strains (#3 and #8) were grown in minimal medium with CO2 as the sole carbon source (photoautotrophic growth) or in acetate-containing TAP medium (photoheterotrophic growth). The knockdown strains grew at the same rate as controls under both conditions. (B) The contractile vacuole cycle period (from beginning of diastole to end of systole) was determined for the EV and PAM knockdown strain (#8) (box and whiskers, min to max; n = 24 for EV and n = 28 for #8); no significant difference was observed. (C) Differential interference contrast images from a video of a PAM knockdown cell illustrating the contractile vacuole cycle (white arrows mark the contractile vacuole); numbers at lower left indicate seconds.
Figure 1—figure supplement 3
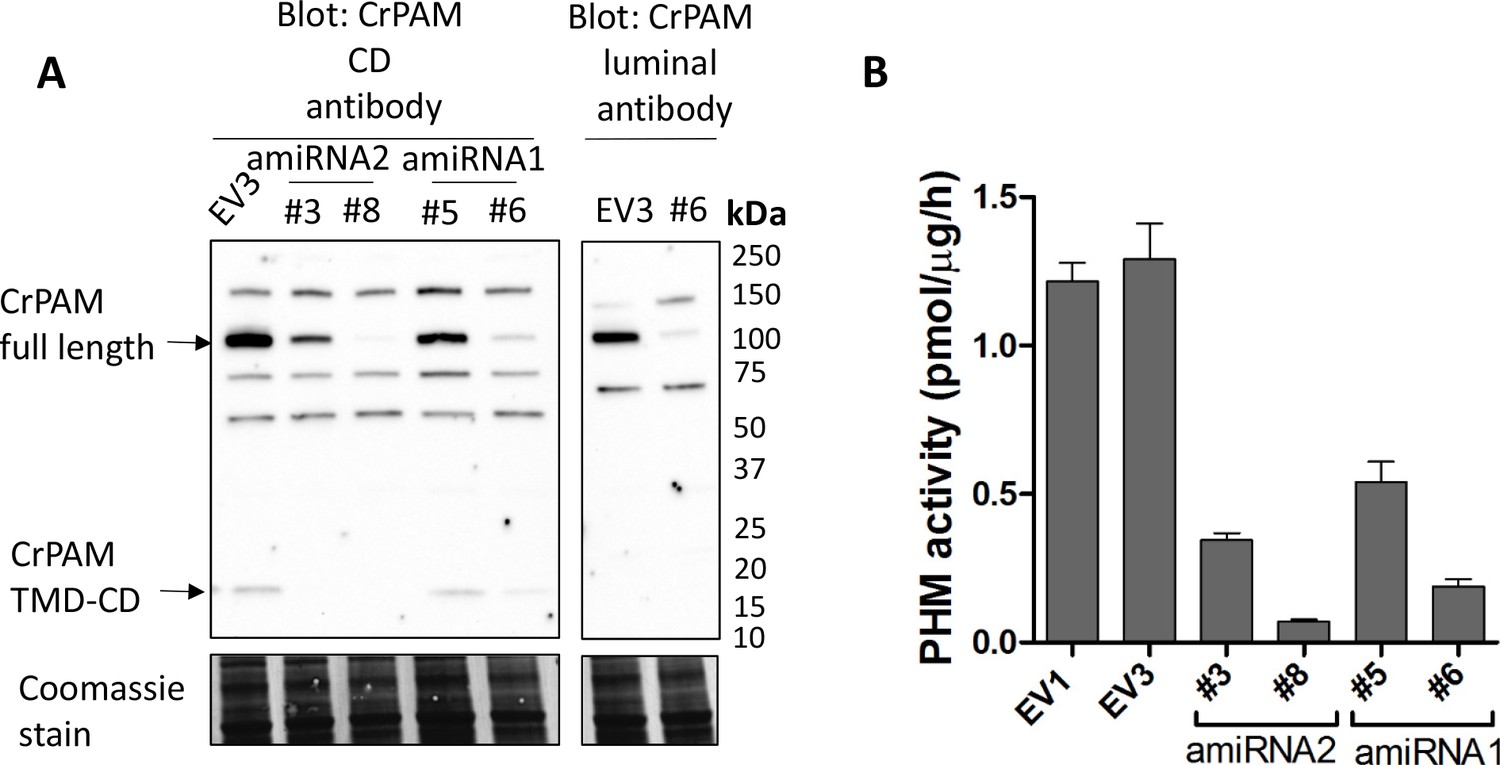
Knockdown of PAM expression by two different amiRNAs leads to ciliogenesis defects.
(A) Immunoblots of cell lysates from empty vector (EV3) and both amiRNA1(#5 and #6) and amiRNA2(#3 and #8) strains probed with antibody against CrPAM-CD; EV3 and amiRNA1 strain #6 were also probed with the CrPAM luminal antibody. Full-length CrPAM (110 kDa) and the processed TMD-CD region (16 kDa) are indicated. Both amiRNAs resulted in reduced CrPAM protein levels; non-specific bands did not change. Coomassie stain indicates equal protein loading. (B) PHM-specific activity for control (EV1 and EV3), amiRNA2 (#3 and #8) and amiRNA1 (#5 and #6) strains; the knockdown strains all exhibited reduced PHM-specific activity.
Figure 2 with 2 supplements
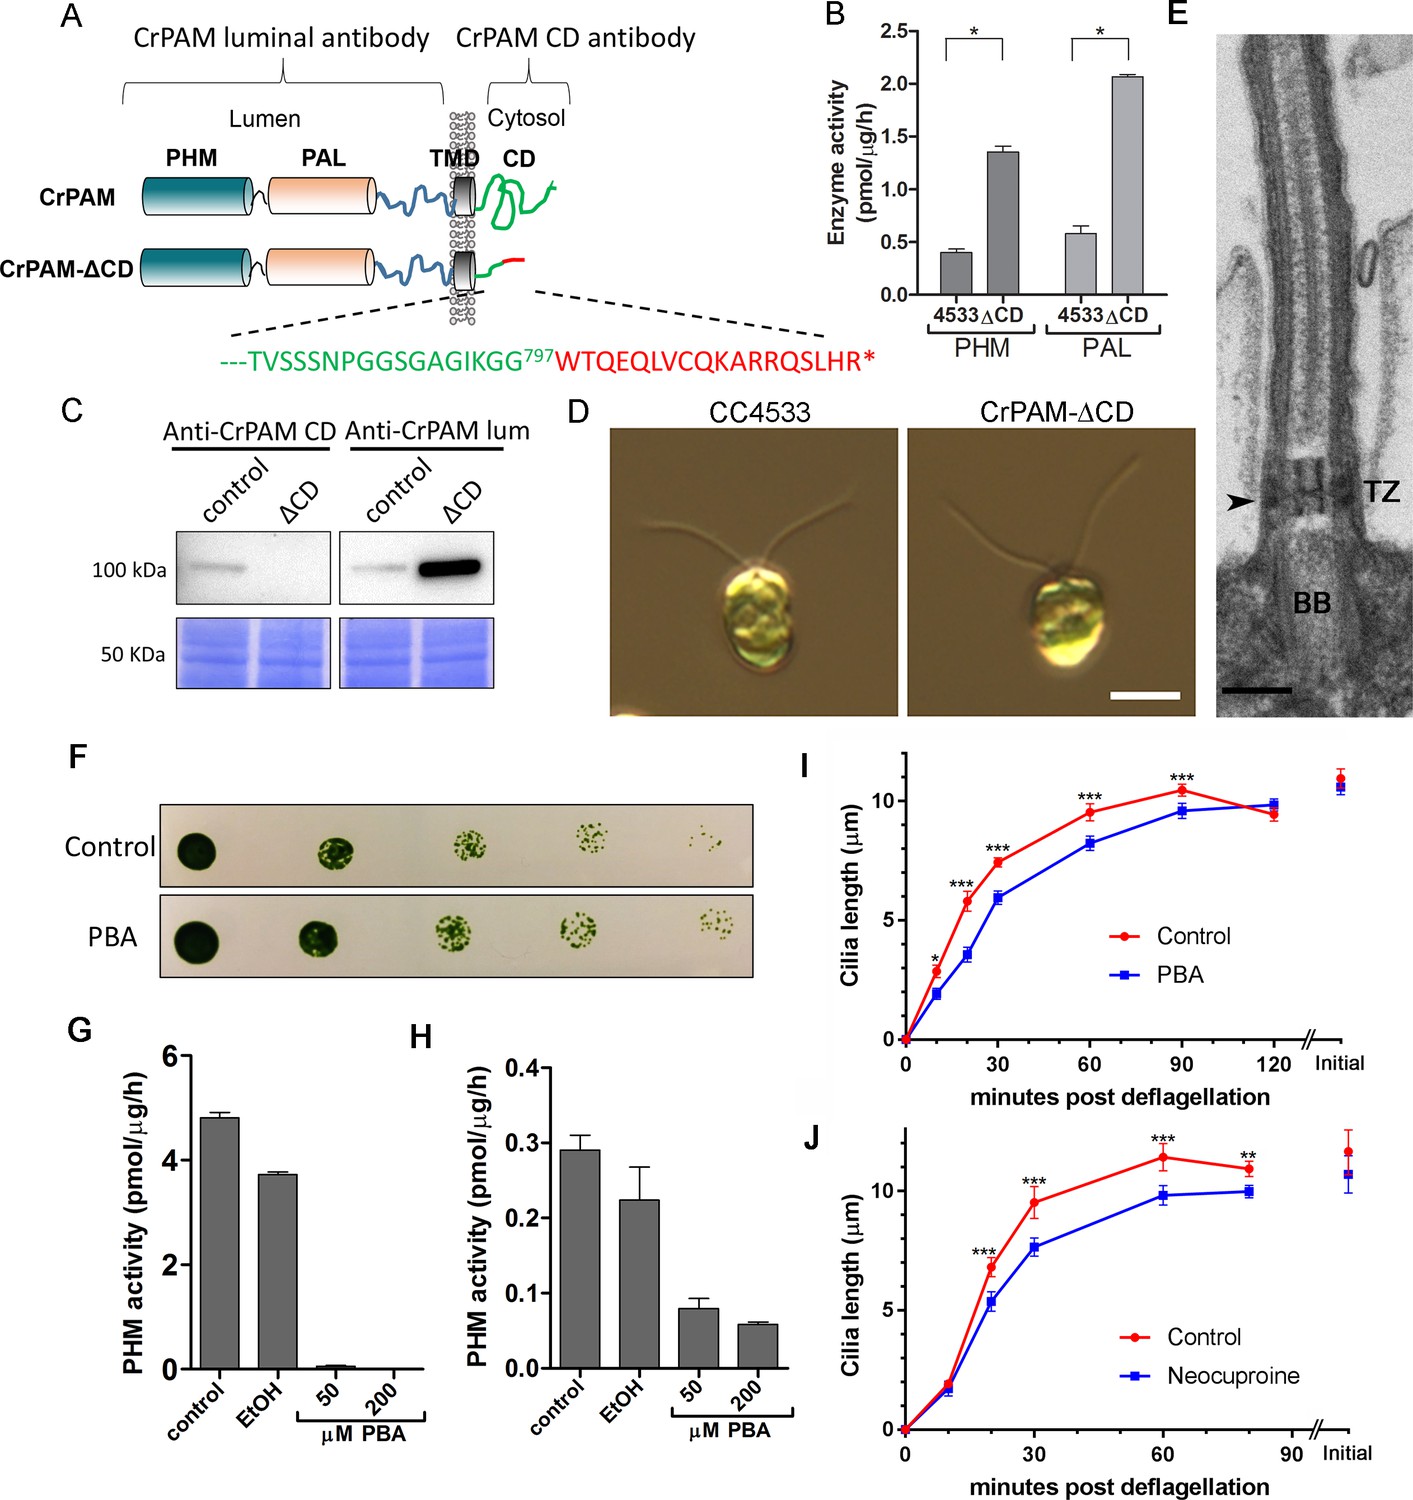
C. reinhardtii strain lacking the C-terminal domain of PAM assembles cilia.
(A) Schematic showing disruption of the cytosolic domain of CrPAM in the CrPAM-ΔCD strain. Residues corresponding to the C-terminus of CrPAM (green) and insertion cassette (red) are shown. (B) PHM and PAL specific activities in control (CC-4533) and CrPAM-ΔCD strain lysates (mean ± SD). Both PHM and PAL activity increased in CrPAM-ΔCD cells (p<0.05 using unpaired t-test). (C) Western blot of control and CrPAM-ΔCD strain lysates with C-terminal domain and luminal antibodies. As predicted by its sequence, CrPAM-ΔCD could be detected by the PAM luminal domain antibody, but not by the PAM cytosolic domain antibody. (D) Differential interference contrast images of control and CrPAM-ΔCD cells showing the presence of cilia in both (Scale bar, 5 µm). (E) Transmission electron micrograph showing normal ciliary structure in CrPAM-ΔCD strain. Basal body (BB), transition zone (TZ) and Y-linkers (arrowhead) appear normal (Scale bar, 200 nm). (F) Growth of 5-fold serially diluted CC-124 wildtype C. reinhardtii on TAP plates containing 0 (control) or 200 μM phenylbutenoic acid (PBA) 6 days post-innoculation. (G and H) Cell lysates were prepared from mouse corticotropes expressing rat PAM (G) and from C. reinhardtii CC-124 cells (H); PHM assays were carried out after addition of the indicated amount of PBA or vehicle (ethanol, EtOH). PHM specific activity was greatly reduced in both lysates in the presence of PBA. (I and J) Wildtype C. reinhardtii CC-124 cells were preincubated for 3 hr with PBA or neocuproine, deciliated by pH shock, which releases cilia immediately distal to the transition zone, and allowed to regrow cilia in the presence of 200 μM PBA (I) or 10 μM neocuproine (J). Error bars represent 95% confidence intervals; 80–100 measurements were made for each point (***p<0.001; **p<0.01; *p<0.05). Differences between control and experimental plots are significant (unweighted means analysis; p<0.0001; variance = 1.94% for PBA and 2.07% for neocuproine). Graphs are from one of two experiments which yielded similar results.
Figure 2—figure supplement 1
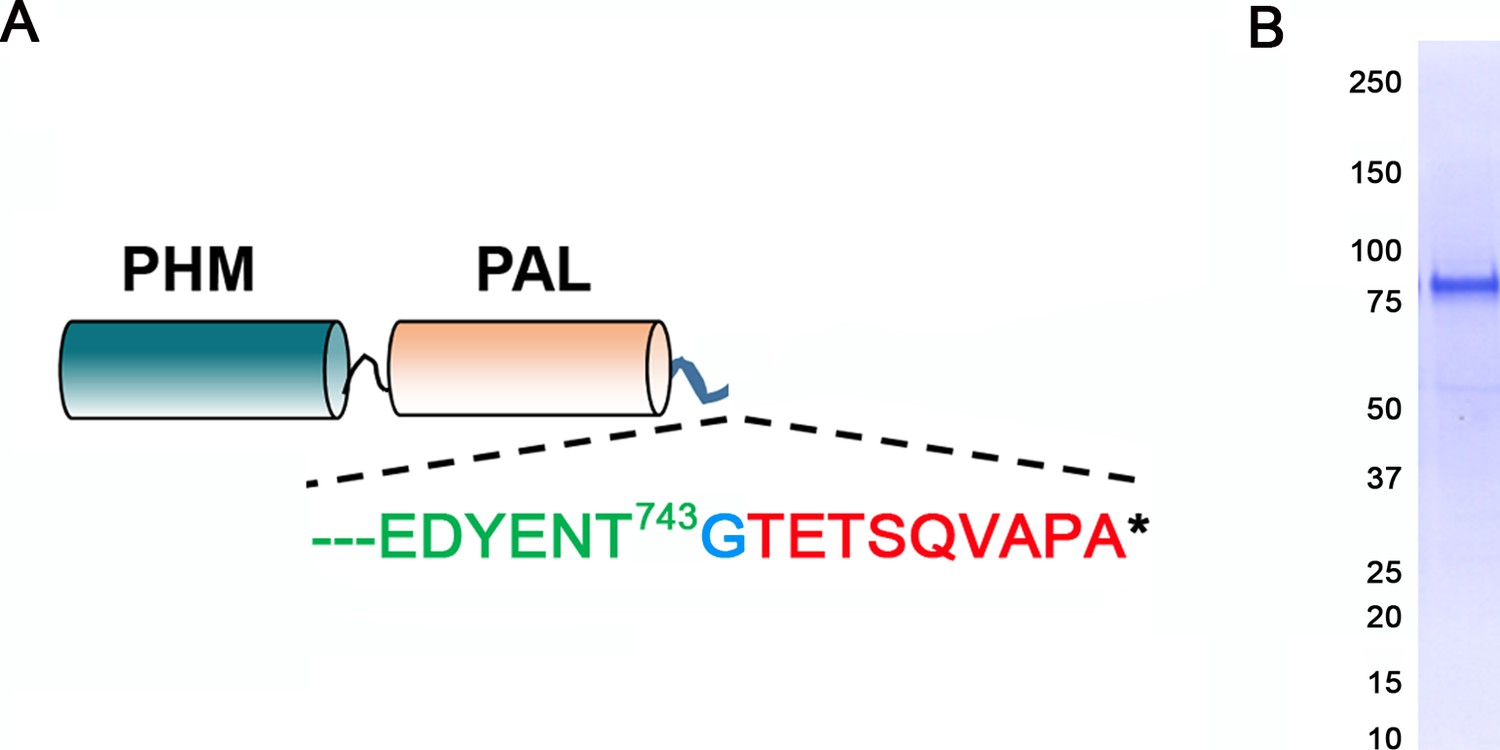
Generation of antibody to the luminal domains of CrPAM.
(A) Map of the truncated luminal PHM-PAL protein indicating the CrPAM sequence (green lettering) terminates before the TMD; a single inserted Gly (blue) precedes the rhodopsin epitope tag (red). (B) The epitope-tagged CrPHM-PAL domain protein was expressed in CHO-DG4 cells, and purified from the spent medium by ion exchange chromatography; protein purity is indicated by the Coomassie blue stained membrane.
Figure 2—figure supplement 2
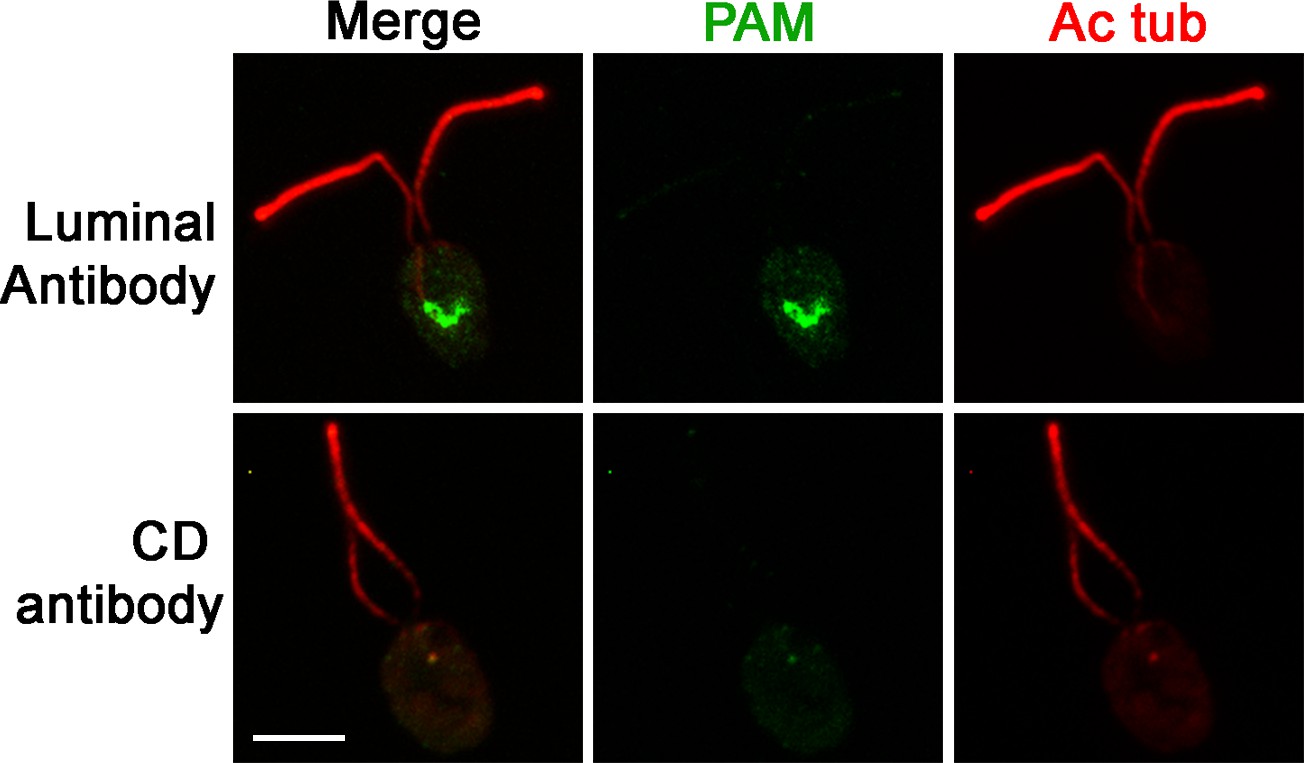
PAM is present in the perinuclear region of PAM-ΔCD cells.
Immunofluorescence micrographs of PAM-ΔCD cells probed with antibodies against the CrPAM luminal domain and CrPAM-CD. PAM was detected in the perinuclear region by the luminal antibody; no staining was observed with the CD antibody, further confirming the specificity of the staining observed in control cells (see Figure 1D).
Figure 3
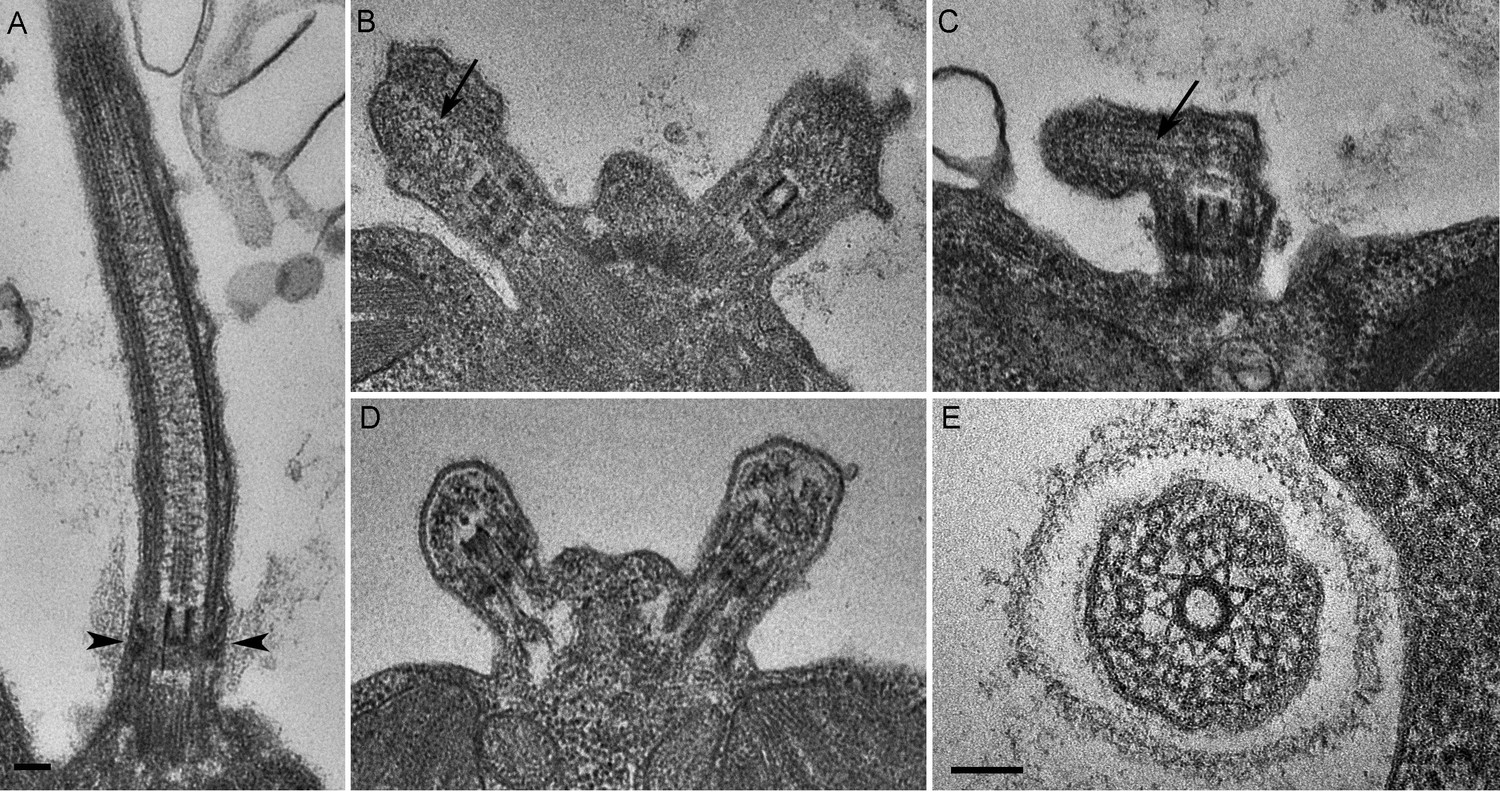
C. reinhardtii PAM knockdown cells fail to assemble cilia beyond the transition zone.
(A) Transmission electron micrograph of control cilium showing an ultrastructurally normal basal body, transition zone and axoneme. Wedge shaped Y linkers connecting the microtubules to the membrane in the transition zone are visible (arrowheads). (B–D) Examples of ciliary stubs seen in PAM knockdown cells. Longitudinal sections through the anterior portion of the cell show an ultrastructurally normal basal body, although Y linkers appeared to be disrupted. Electron dense material accumulated in the stubs (B, C and D) and microtubule fragments (arrows in B and C) were randomly oriented. (E) Cross-section of a transition zone from PAM amiRNA cell showed stellate centrin fibers and outer doublet microtubules surrounded by a ciliary membrane. Electron dense material fills the space between the microtubules and the membrane (Scale bar, 100 nm).
Figure 4
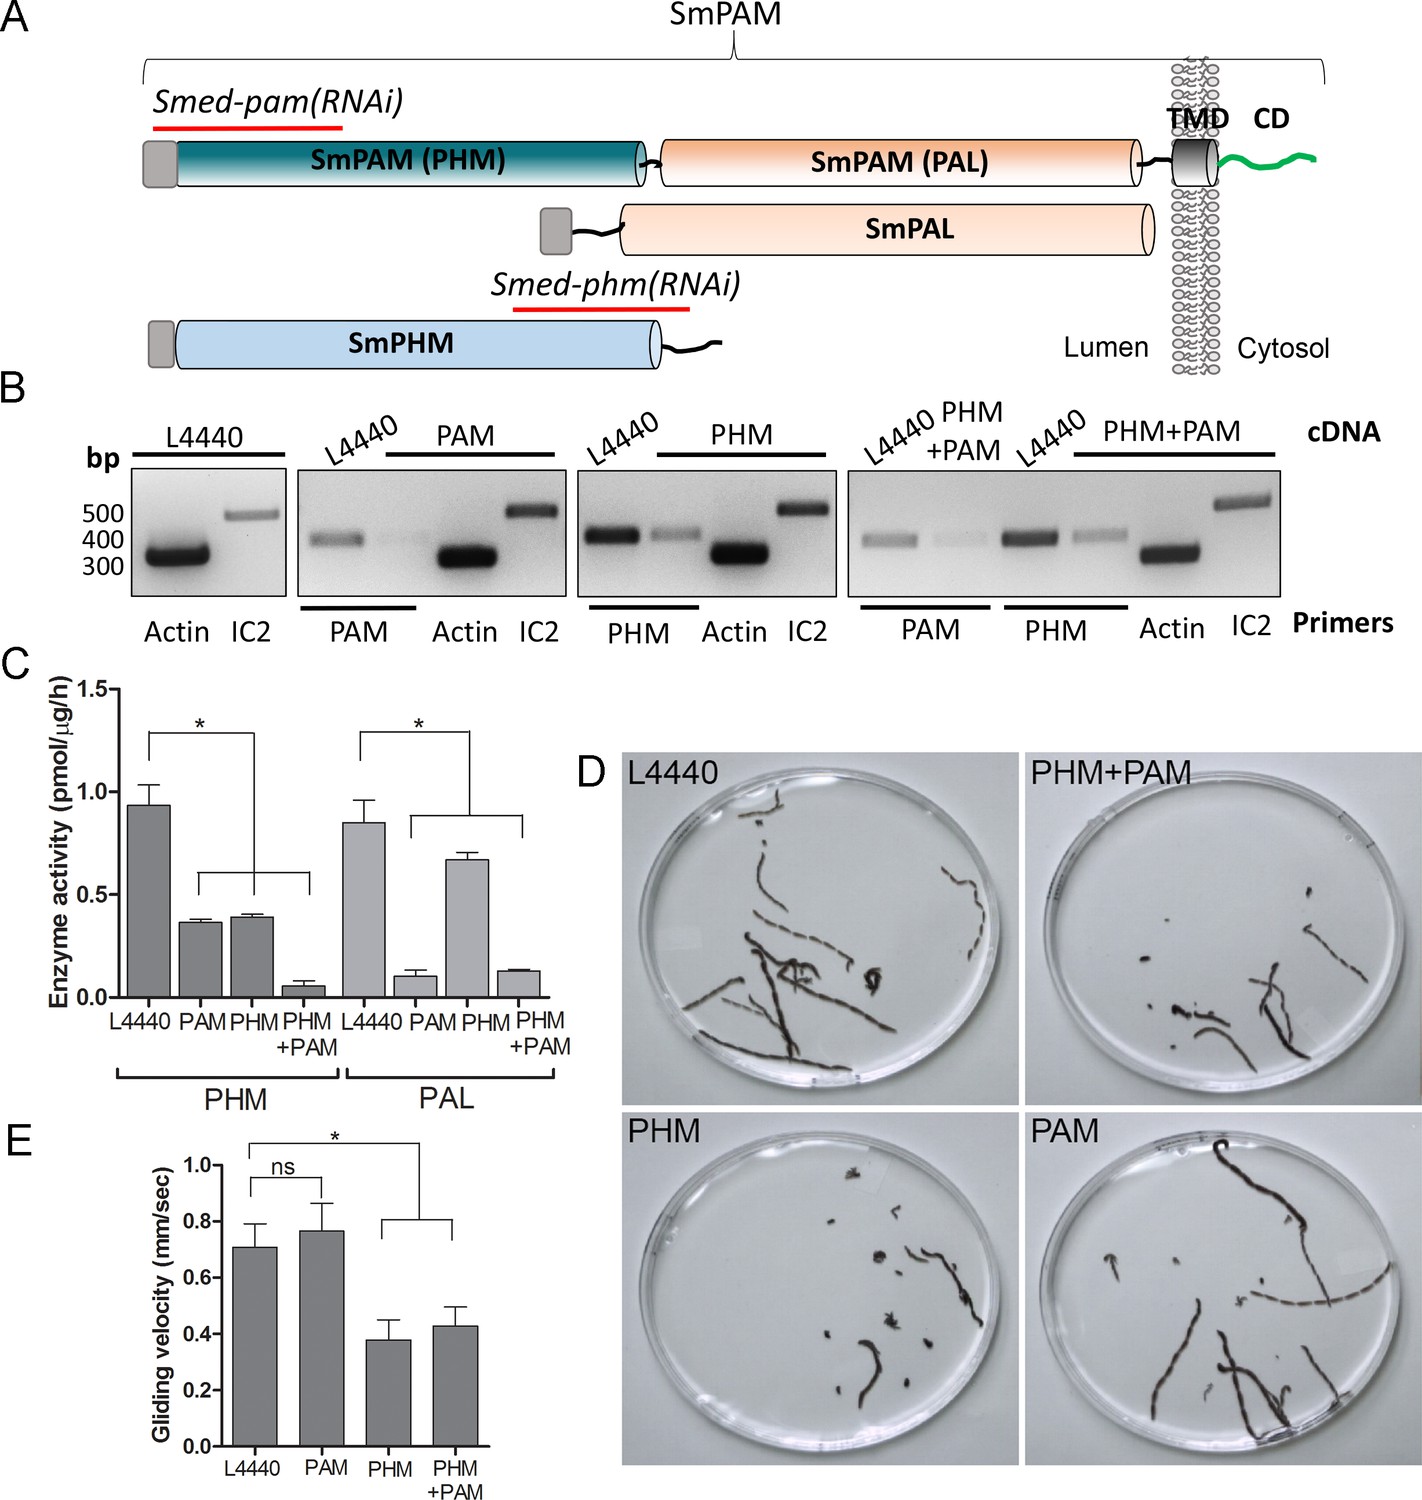
Knockdown of PHM gene in planaria causes motility defects.
(A) Schematic of S. mediterrania bifunctional membrane PAM, monofunctional PAL and monofunctional soluble PHM showing the regions used to generate RNAi constructs (red lines). Signal sequences, grey; transmembrane domain in SmPAM, black; cytosolic domain, CD, green. (B) RT-PCR analysis of mRNA from flatworms fed with the L4440 (control), PAM, PHM or PHM+PAM dsRNA. The cDNA source is shown above the image, and the primer pairs used for RT-PCR are listed below the image. Actin and dynein IC2 primers were used as controls. (C) PHM and PAL specific activities in planarian lysates plotted as mean ± SD from triplicate assays (asterisks indicate p<0.05 in a one-way Anova). (D) Overlays of frames from deconvolved videos of control and RNAi planaria showing the tracks taken over 60 s. (E) PHM and PHM+PAM RNAi animals displayed reduced gliding velocities plotted as mean ± SEM compared to L4440 and PAM RNAi animals (asterisks indicate p<0.05 in an unpaired t test).
Figure 5
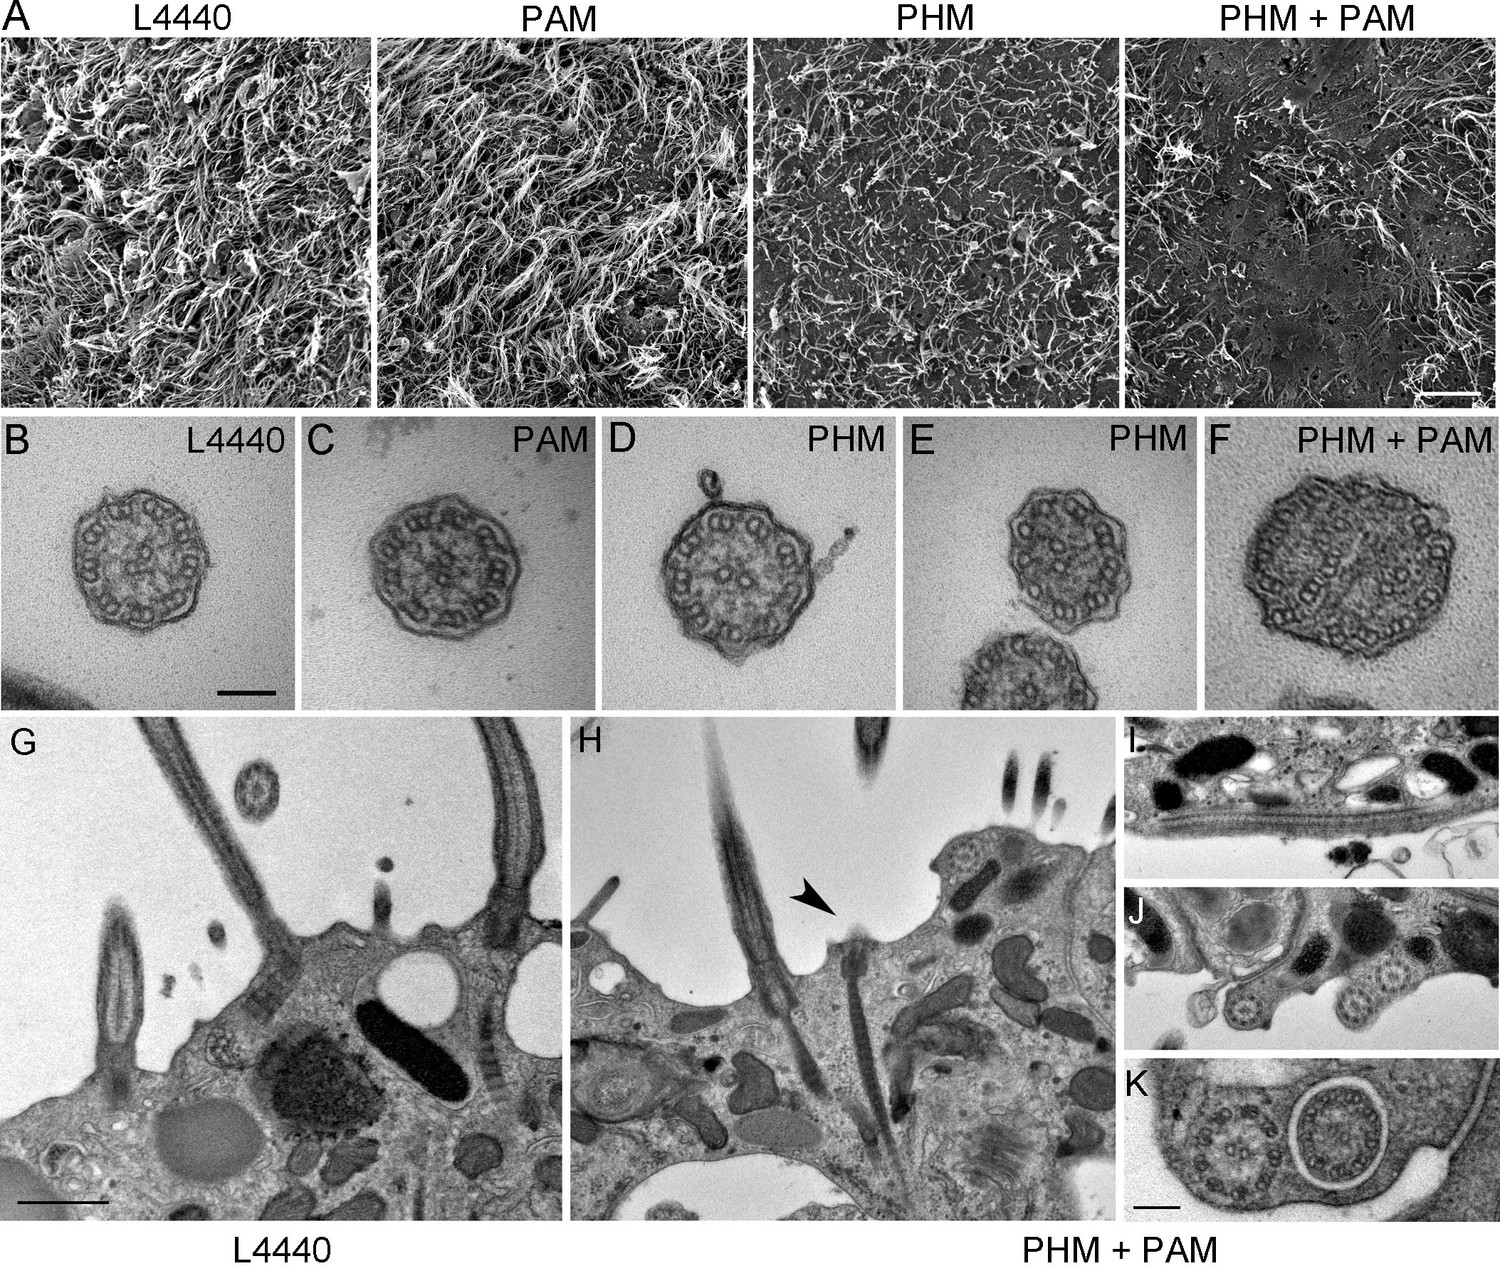
Ciliary morphology is affected in Smed-phm(RNAi) and Smed-phm+pam(RNAi) planaria.
(A) Scanning electron micrographs of the ventral surface of an L4440-fed control planarian showed tightly packed cilia, while ciliary density was reduced in Smed-phm(RNAi) and Smed-phm(RNAi)+Smed-pam(RNAi) planaria; short ciliary stubs were visible on the ventral surface. Smed-pam(RNAi) animals displayed a modest, intermediate phenotype. Scale bar, 10 µm. (B–D) Transmission electron micrographs of ciliary cross sections showed normal 9 + 2 axonemal architecture in L4440, Smed-pam(RNAi) and Smed-phm(RNAi) planaria. (E–F) Singlet and doublet microtubules visible in the same plane in a Smed-phm(RNAi) cilium and abnormal, disorganized doublet microtubules in a Smed-phm+pam(RNAi) planarian cilium. Scale bar, 100 nm. (G) Transmission electron micrographs of ciliated ventral epithelium of L4440 and Smed-phm+pam(RNAi) (H–K) animals. Normal basal body docking and microtubule extension was visible in L4440; scale bar, 500 nm. In the double knockdowns, ciliary stubs (arrowhead, (H) and numerous cytosolic axonemes were visible (H–K). (I) Longitudinal section of a cytosolic axoneme parallel to the plasma membrane. (J) Cytosolic axonemes cut in cross section and all oriented with their distal tips towards the head of the animal. (K) A cytosolic axoneme next to a cilium contained in a ciliary pocket (right). Scale bar, 250 nm.
Figure 6
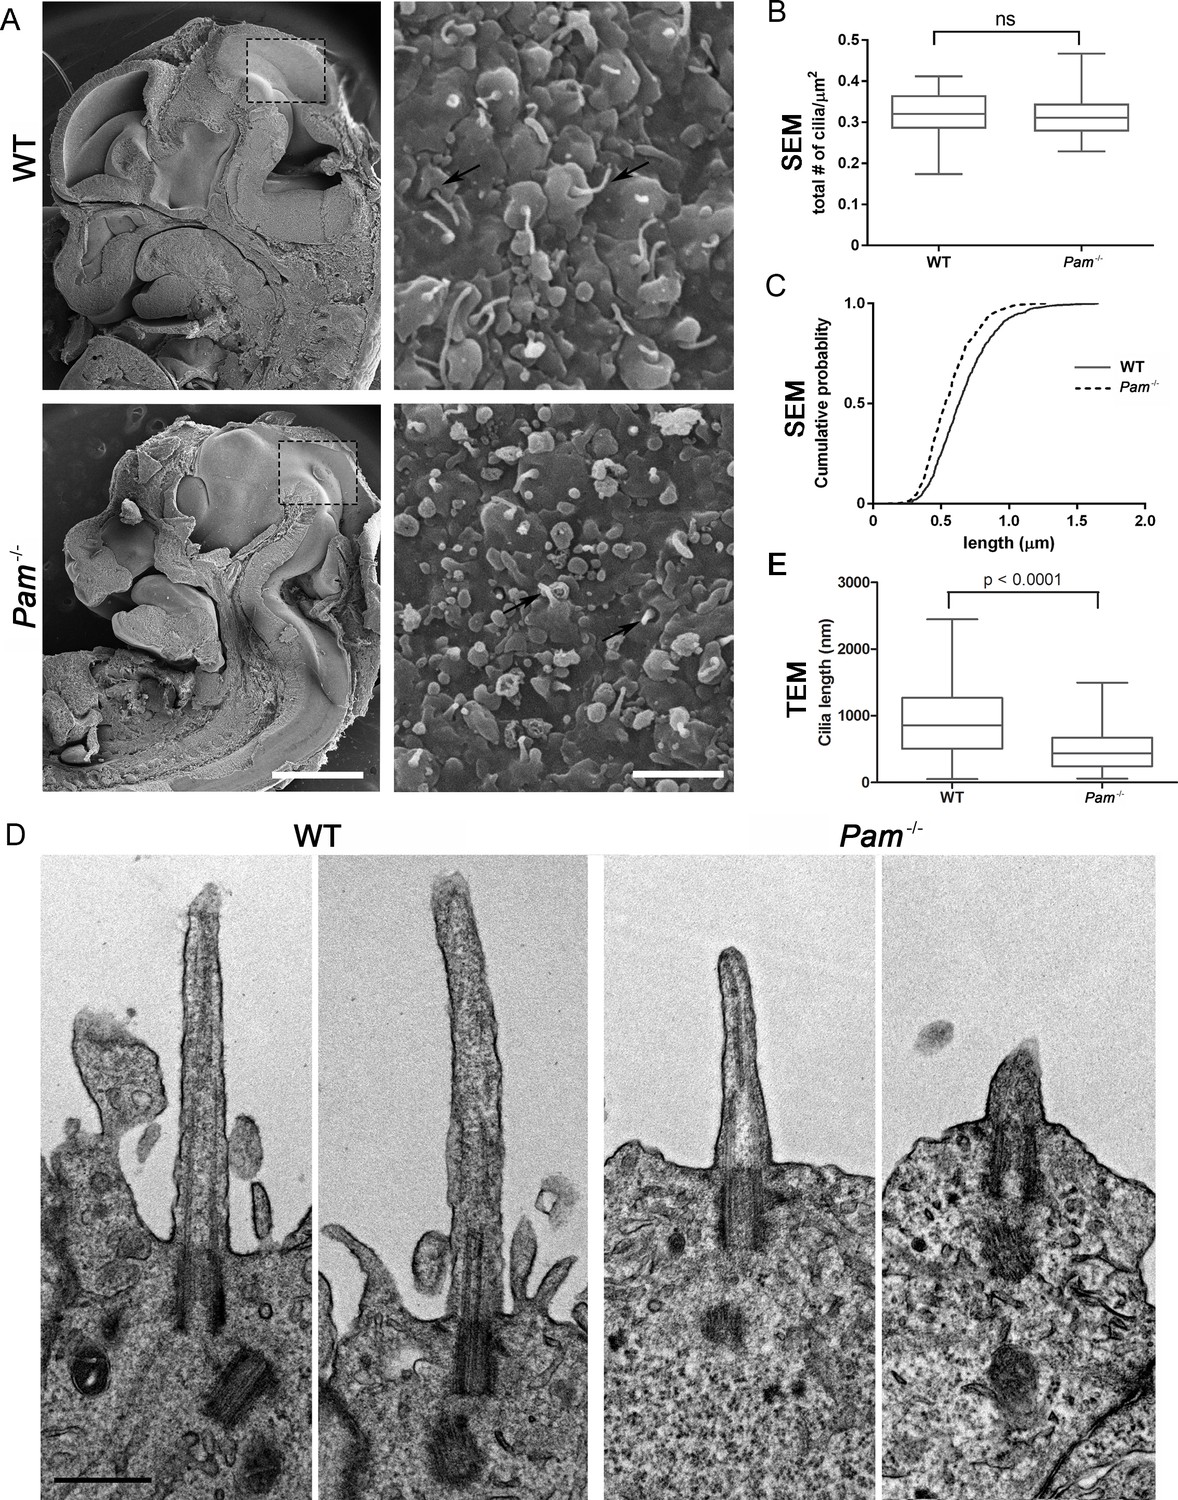
Primary cilia are shorter in Pam-/- neuroepithelial cells.
(A) Low magnification scanning electron micrographs of longitudinal sections through E12.5 WT and Pam-/- mouse embryos are on the left. Scale bar, 1 mm. The panels on the right show neuroepithelial cell cilia on the ventricular surface of WT and Pam-/- embryos. Scale bar, 2 µm. (B) Ciliary density (number of cilia/µm2, measured from SEM images) was not significantly different between WT and PAM-/-. (C) Cumulative distribution of ciliary lengths measured from SEM images differed in Pam-/- vs WT control (Kolmogorov-Smirnov test, p<0.0001 for n > 500 measurements). Mean ciliary length in WT was 0.66 ± 0.01 μm (mean ± SEM) and in Pam-/- was 0.55 ± 0.01 μm. (D) Representative transmission electron micrographs from E12.5 WT and PAM-/- mouse embryo neuroepithelium. Scale bar, 500 nm. (E) Cilia (measured from TEM images) were significantly shorter (p<0.0001, unpaired t-test) in the Pam-/- neuroepithelial cells (0.51 ± 0.04 µm, n = 69) compared to WT cells (0.90 ± 0.08 µm, n = 45).
Figure 7 with 1 supplement
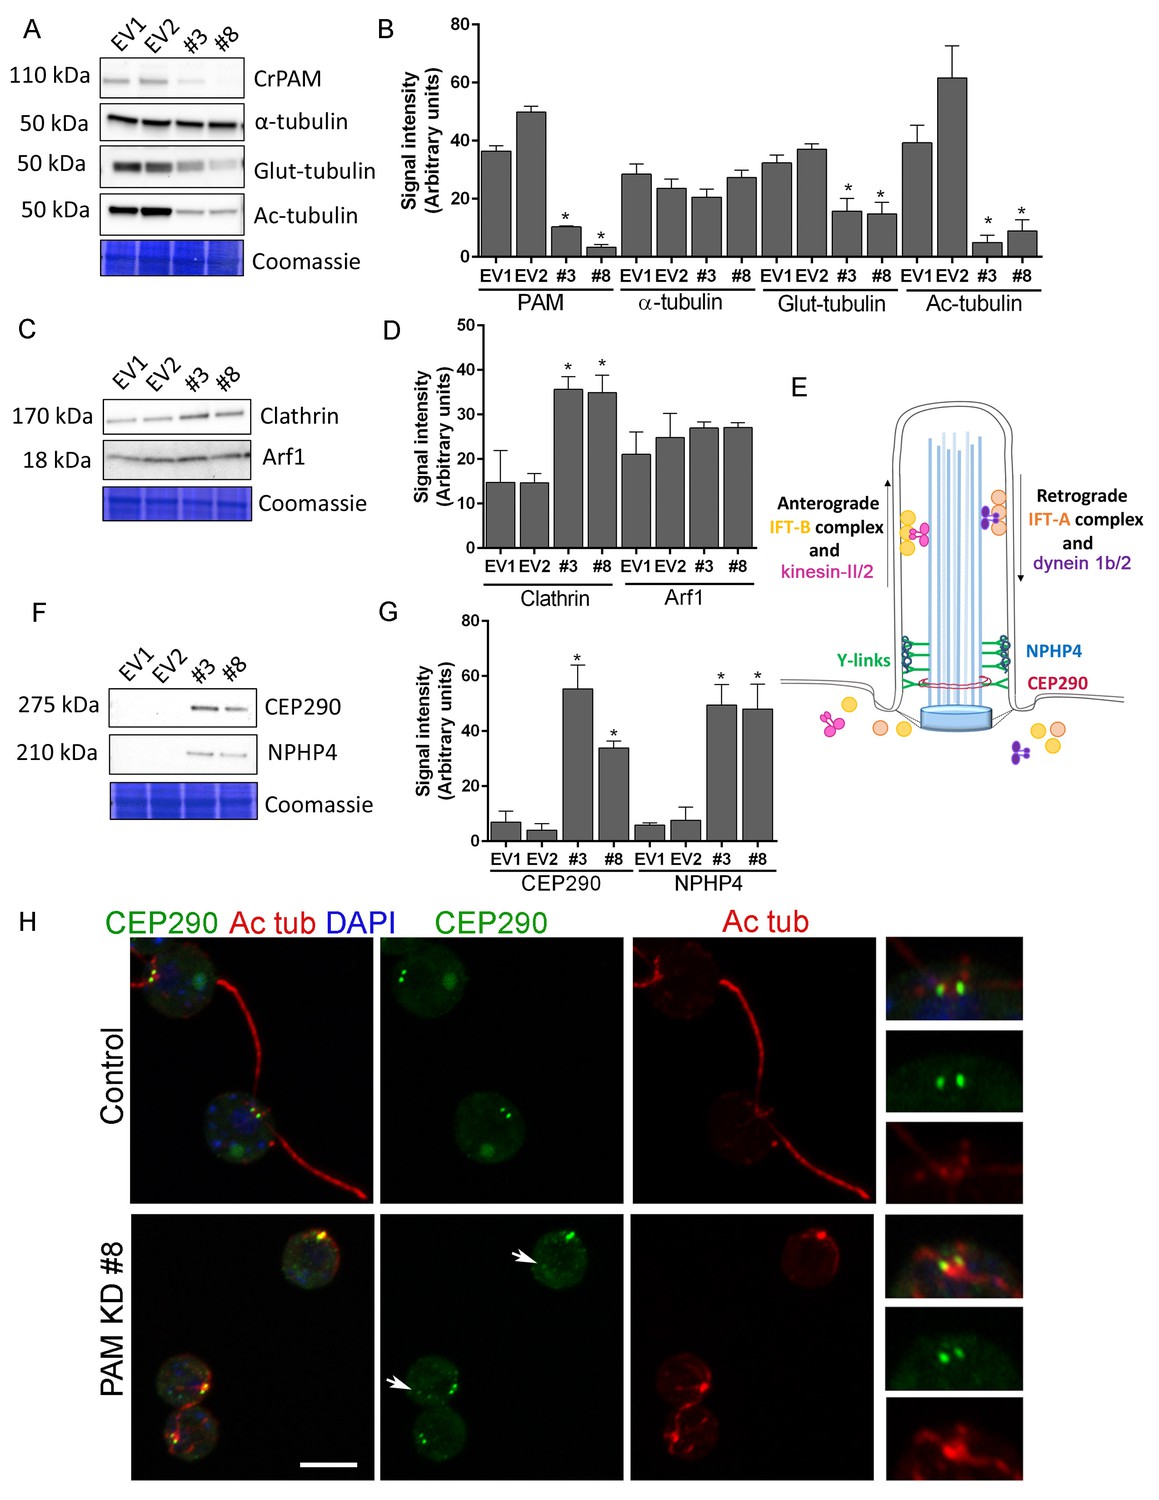
Knockdown of CrPAM alters levels and localization of transition zone proteins.
At least three lysates of EV1, EV2, #3 and #8 cells were subjected to western blot analysis. Representative blots and Coomassie-stained gels are shown (A, C, F); bar graphs indicate mean normalized intensity from all analyses +/- SEM (B, D, G). Statistical analysis was performed using one-way Anova. * indicates p<0.05 for both EV strains vs both PAM amiRNA strains. (A, B) Antibodies to CrPAM and modified forms of tubulin were used; acetylated and poly-glutamylated tubulin levels were lower in PAM amiRNA strains, but levels of α-tubulin were unchanged. (C, D) Antisera to clathrin heavy chain and Arf1 were used; PAM amiRNA strains had higher levels of clathrin heavy chain; Arf1 levels were not different. (E) Schematic of IFT and transition zone components in cilia; for the IFT motors, both Chlamydomonas and mammalian nomenclatures are shown. (F, G) Antisera to transition zone components CEP290 and NPHP4 were used; levels of both transition zone components were increased in PAM amiRNA mutant strains. (H) Maximum projection of optical sections of EV and PAM amiRNA C. reinhardtii cells labeled with antibodies to CEP290 (green) and acetylated tubulin (Ac tub, red). Merged images also show DAPI (blue), to locate the nucleus. Arrows point to CEP290 foci in the cell body. Enlargements at right show CEP290 localization at the base of cilia.
Figure 7—figure supplement 1
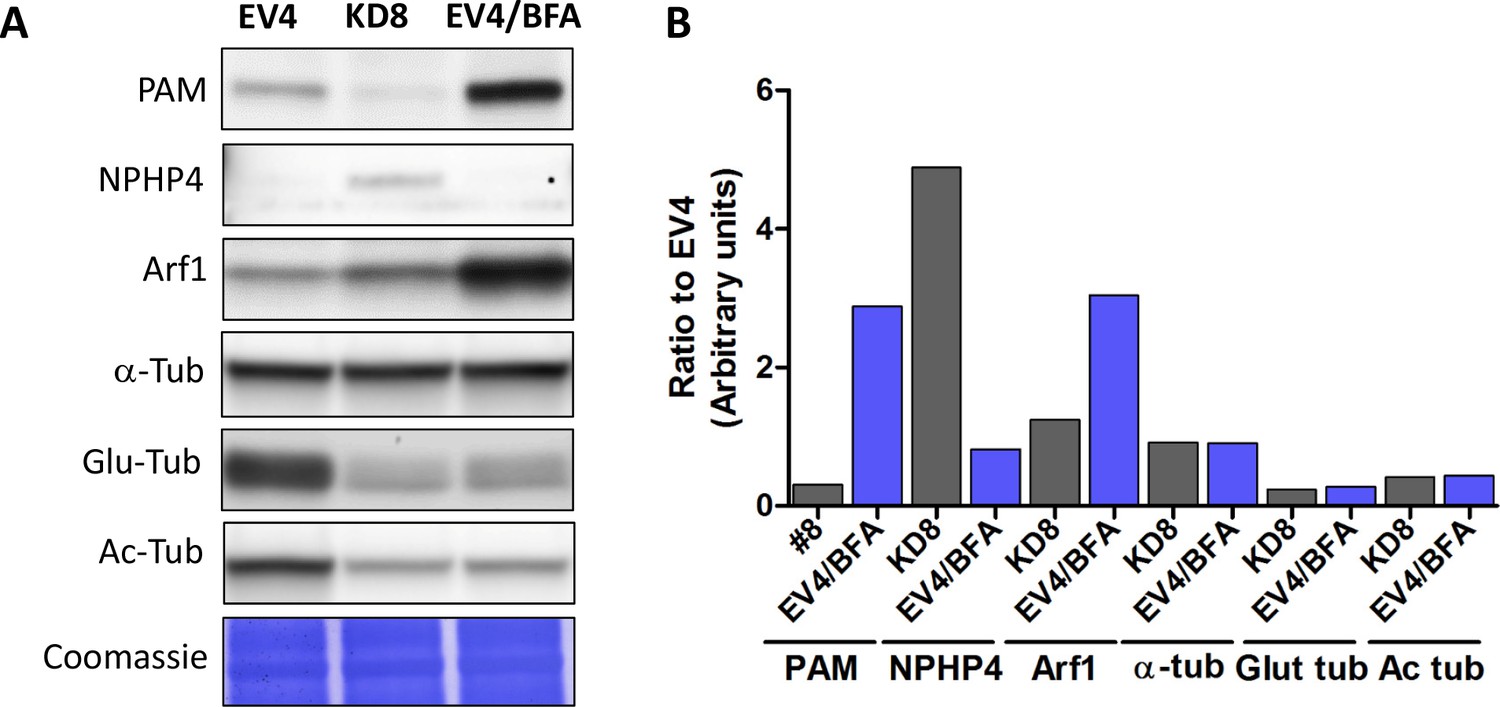
Effect of Golgi disruption by brefeldin A on tubulin post-translational modification and transition zone protein levels.
(A) Immunoblots of cell lysates from control (EV4), PAM knockdown (#8) and EV4 following treatment with brefeldin A for 3 hr; equal protein loading is shown by Coomassie stain. (B) Bar graphs indicate signal intensity in PAM knockdown strain #8 and brefeldin A-treated EV4 lysates as a ratio to untreated EV4. Levels of acetylated and glutamylated tubulin were decreased in both PAM knockdown and brefeldin A-treated cells. In contrast, the increase in NPHP4 seen in the PAM knockdown strain was not observed following brefeldin A treatment, and an increase in Arf1 following brefeldin A treatment was not seen in the PAM knockdown strain. This suggests that PAM defects are not the result of generalized Golgi dysfunction.
Figure 8
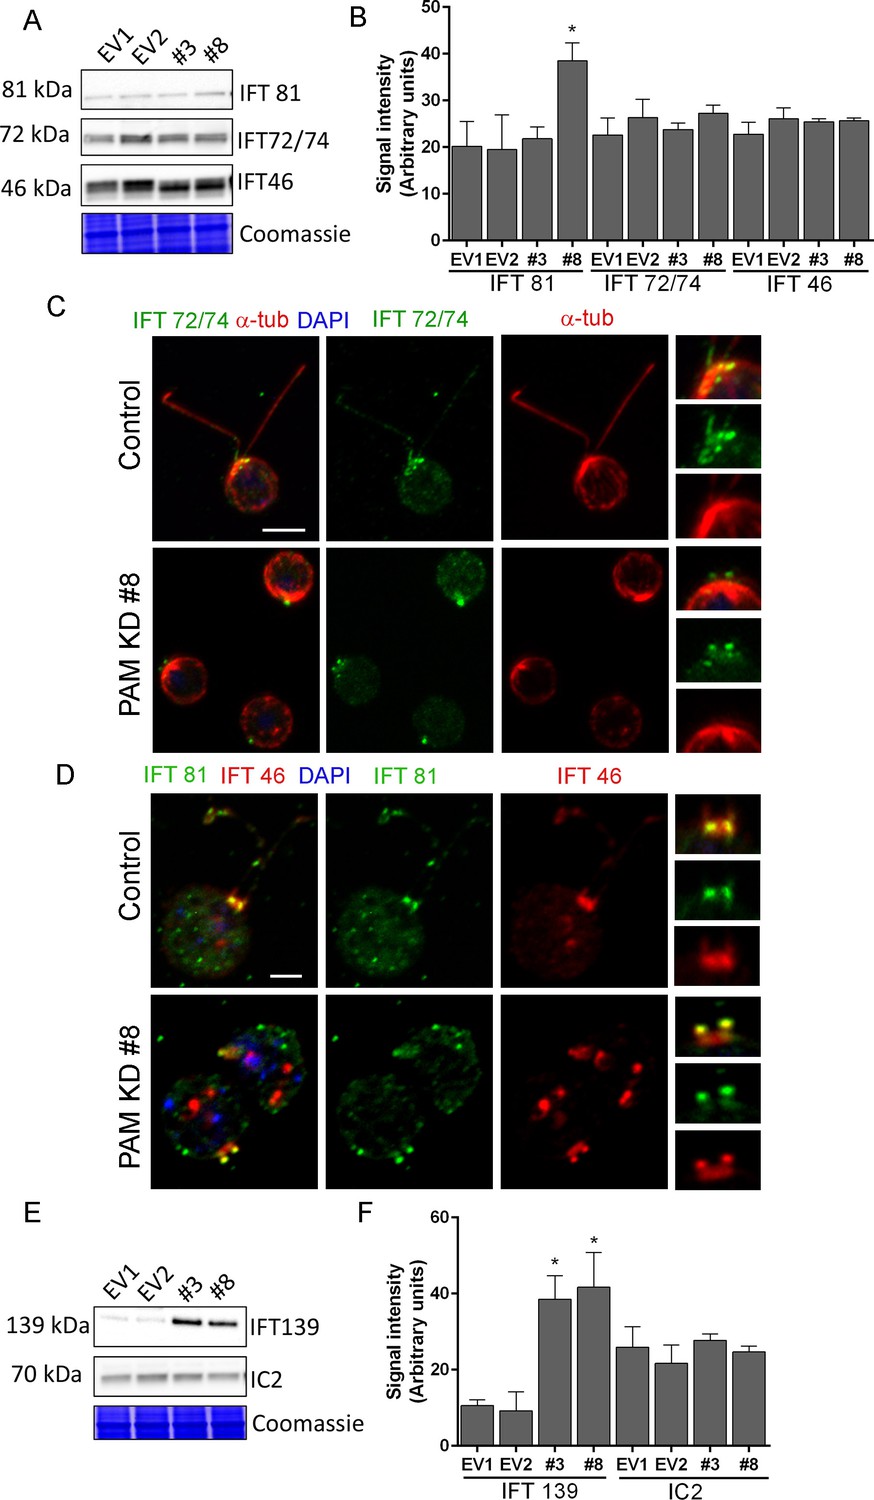
Knockdown of CrPAM alters levels and localization of selected IFT components.
(A and B) C. reinhardtii EV and PAM amiRNA cell lysates immunoblotted with antibodies to IFT-B components, IFT81, IFT72/74 and IFT46 and quantified as described for Figure 7; levels of IFT81 were increased in PAM amiRNA #8 strain compared to EV controls. Representative Coomassie-stained gels show equal loading. (C) In control cells, IFT72/74 (green) was located at the base of the cilium (enlargement at right) and along its length (marked by antibodies to alpha-tubulin (red)). Images acquired at the same exposure settings showed IFT72/74 in the ciliary stubs and decreased immunofluorescence in the peri-basal body region (enlargement at right) in PAM amiRNA cells. Scale bar, 5 µm. (D) C. reinhardtii control and PAM amiRNA #8 cells co-stained with antibodies to IFT81 (green) and IFT46 (red). Images acquired at similar exposure settings showed redistribution of both proteins into ciliary stubs in PAM amiRNA cells (enlargements at right) compared to predominantly peri-basal body localization in controls. (E and F) Representative western blot of a retrograde ciliary transport protein; levels of IFT-A component IFT139, were higher in cell lysates from PAM amiRNA C. reinhardtii cells compared to EV control strains; axonemal outer arm dynein IC2 levels did not differ.
Figure 9
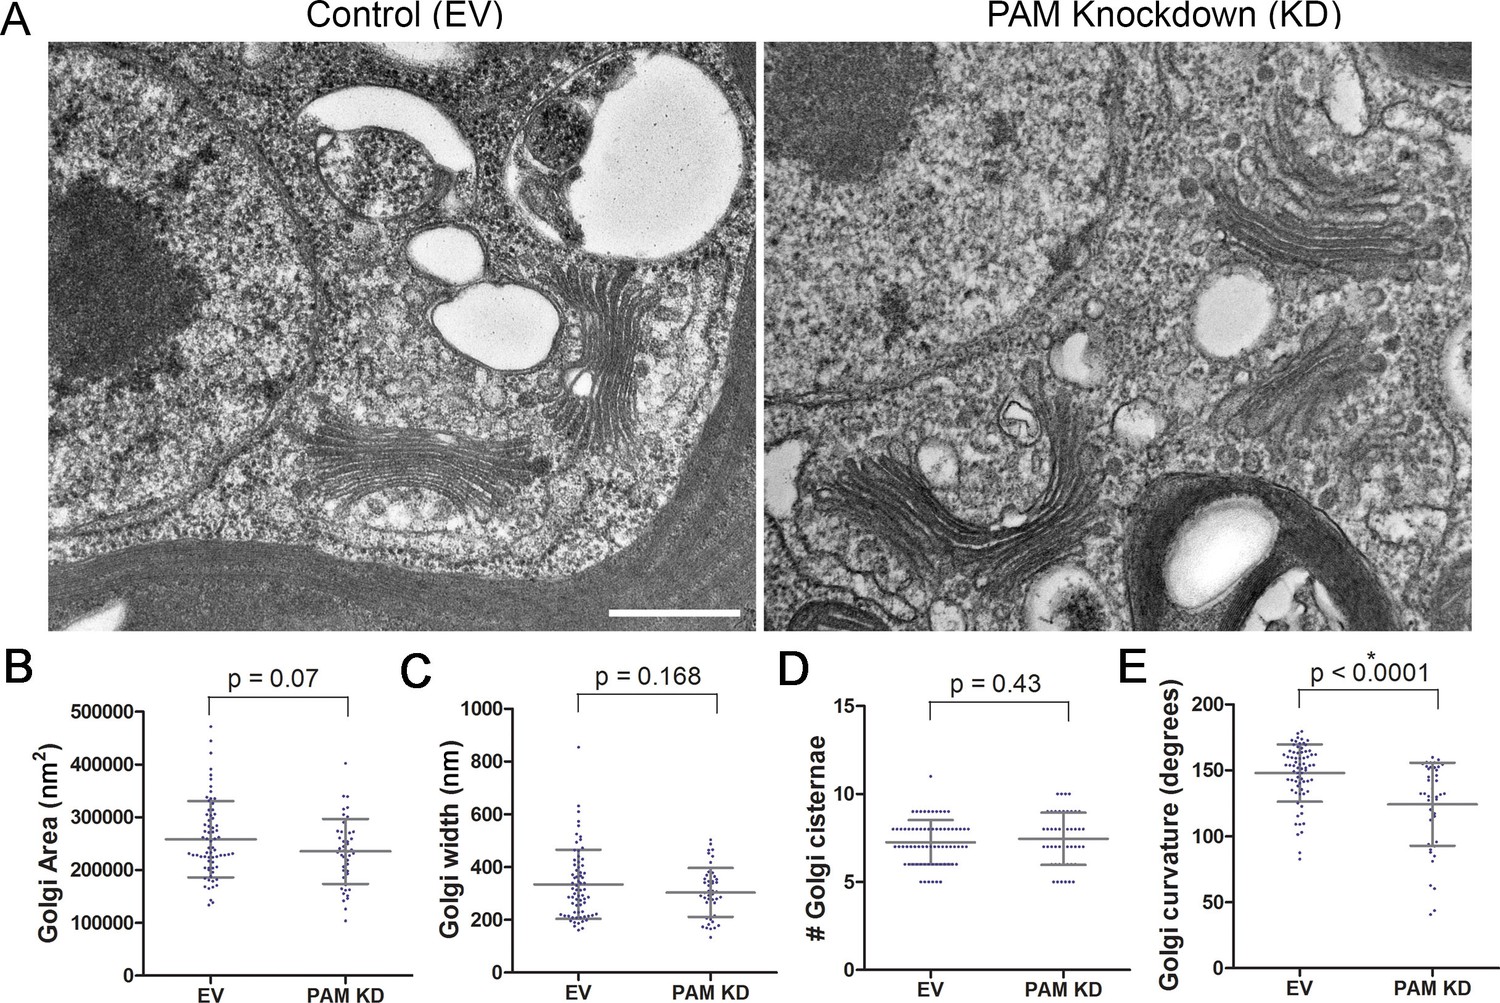
Golgi ultrastructure is altered in PAM amiRNA cells.
(A) Transmission electron micrographs showing Golgi morphology in control and PAM amiRNA C. reinhardtii cells. Scale bar, 500 nm. Total area occupied by Golgi stacks (B), width of Golgi cisternae at the center of each stack (C) and number of Golgi cisternae (D) did not differ in PAM knockdown vs control cells. The degree of curvature of the Golgi cisternae from the center of the stack to the tip was significantly lower in PAM knockdown cells compared to controls (E). For all graphs, data were plotted as a scatter dot plot with mean ± SD values; unpaired t-test was used for statistical analysis in each case.
Figure 10 with 1 supplement
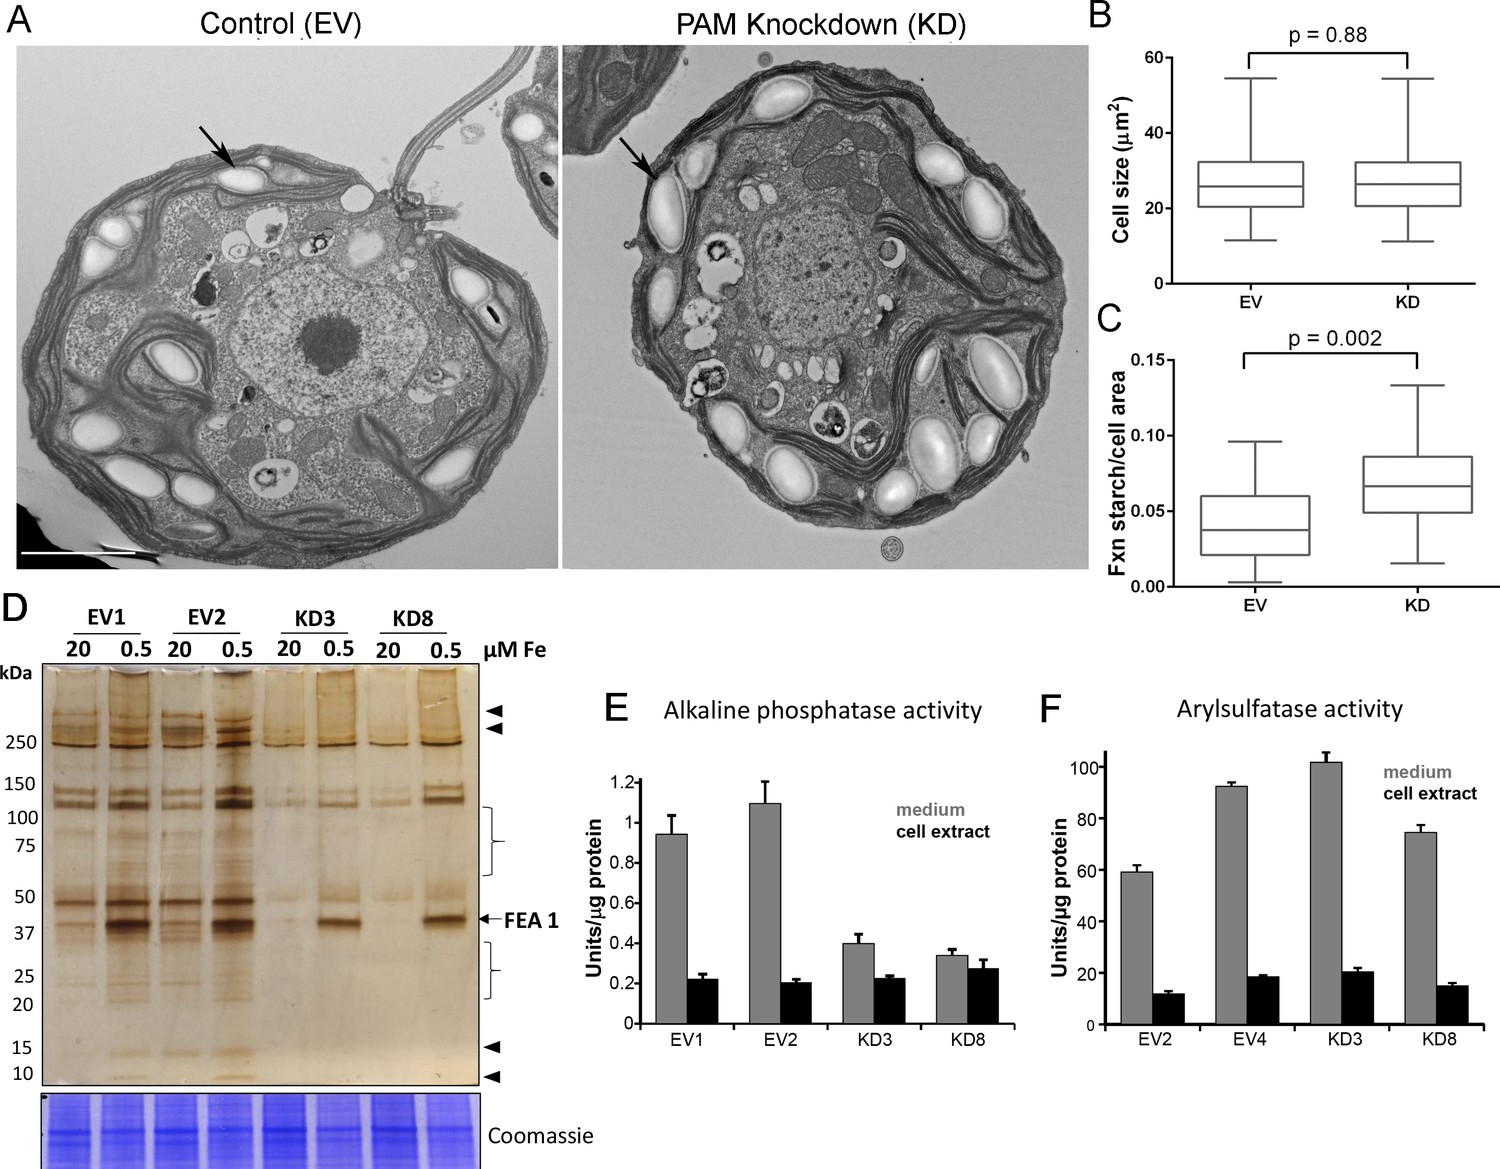
Golgi function is selectively compromised in C. reinhardtii PAM knockdown cells.
(A) Transmission electron micrographs showing enlarged starch grains in a representative PAM amiRNA cell compared to a control cell. Scale bar, 2 µm. (B) Control and PAM amiRNA cells did not differ in cell size (n > 500 measurements from scanning electron micrographs) (C) Starch grains occupied a larger fraction of cell area in PAM amiRNA cells compared to controls (n ~20 measurements from TEM images). Unpaired t-test was used to analyze values in box and whisker plots. (D) Control and PAM amiRNA cells cultured in normal (20 µM Fe) and iron deficiency (0.5 µM Fe) conditions showed altered secretion of FEA1 and many other proteins (arrowheads and braces). For each strain, spent medium from an equal amount of total cell protein (verified by Coomassie staining of cell lysates) was analyzed by silver staining. (E) Alkaline phosphatase activity (units/µg cell protein) was assessed in cell lysates and spent media (collected after 24 hr) from two different phosphate-deprived PAM amiRNA and control strains. one unit = 1 nmole/h. (F) Arylsulfatase activity (units/µg cell protein) was assessed in cell lysates and spent media (collected after 24 hr) from two different sulfate-deprived PAM amiRNA and control strains. one unit = 1 nmole/h.
Figure 10—figure supplement 1
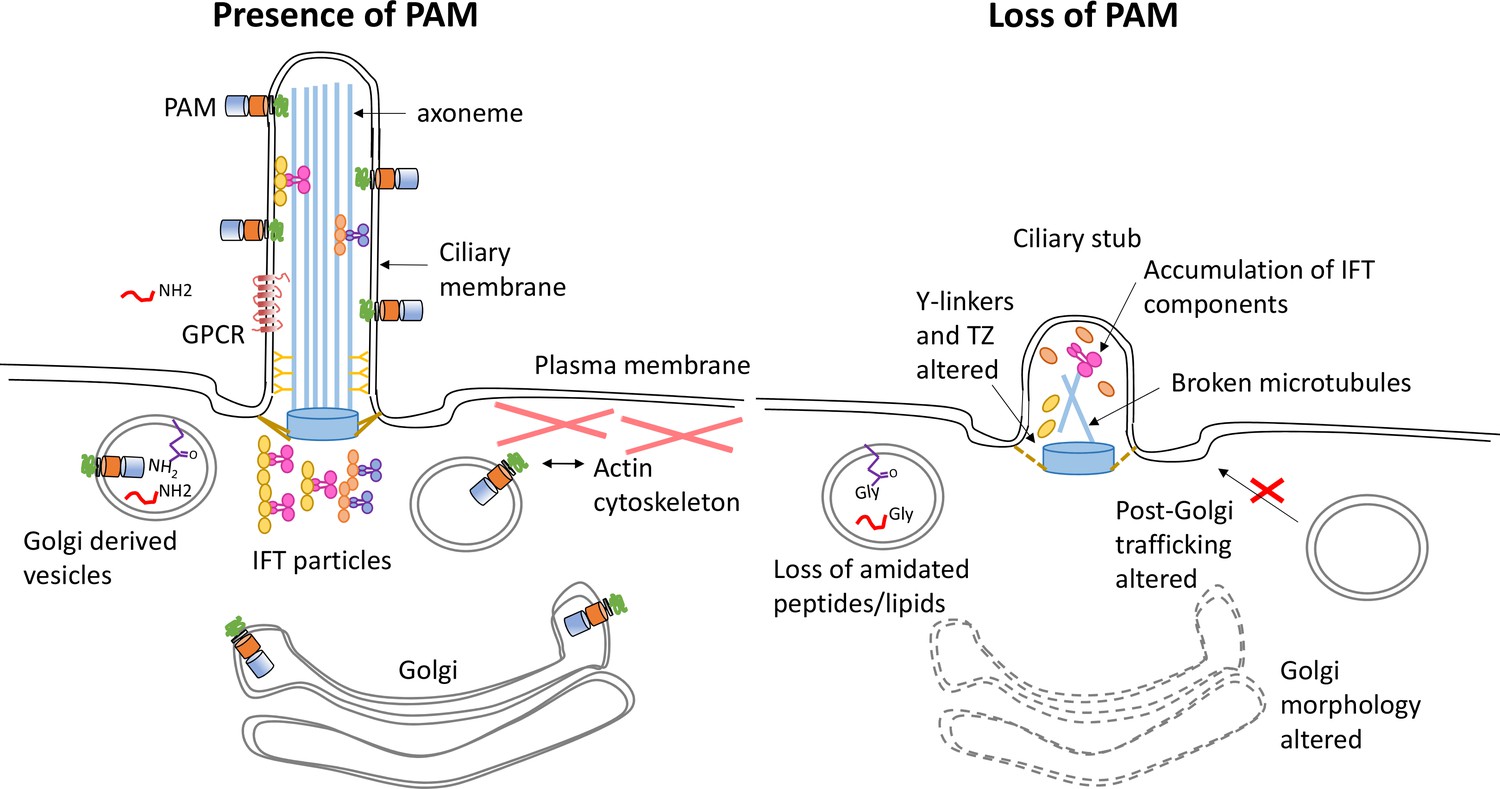
Model illustrating how loss of PAM affects ciliogenesis.
Diagram illustrating the location and trafficking of key ciliogenesis factors in the presence of PAM (left) and the consequences of PAM loss (right). The PAM catalytic domains are in the lumen of the secretory pathway, where they act on glycine-extended peptides and lipids to yield amidated products. In the cilium, these PAM domains are exposed to the extracellular environment. In the absence of PAM, Golgi morphology and function are altered, PAM substrates can no longer be amidated, there are abnormal accumulations of transition zone and intraflagellar transport components, and cilia fail to assemble.
Videos
Video 1
Gliding Motility of Control and RNAi Planaria.
Combined videos showing the movement of control (L4440), Smed-phm+pam(RNAi), Smed-phm(RNAi) and Smed-pam(RNAi) animals in 9 cm Petri dishes. Videos were captured at 15 fps for 60 secs and play back at 10× real-time.
Video 2
Ciliary Motility of Control and Smed-phm+pam(RNAi) Planaria.
Videos of ventral cilia of control (L4440) and Smed-phm+pam(RNAi) planaria were taken at 150 fps and play back at 1/10th real-time.
Tables
Table 1
Quantification of ciliated cells in amiRNA knockdown strains. The % ciliated cells in asynchronous cultures was determined by microscopic examination following formaldehyde fixation (n > 100 for all samples). All amiRNA strains had reduced numbers of ciliated cells.
| Strain | % Ciliated cells (n > 100) |
|---|---|
| EV3 | 58% |
| amiRNA1 #5 | 24% |
| amiRNA1 #6 | 8.7% |
| amiRNA2 #8 | 0% |
Table 2
Quantification of planarian motility. The table indicates the % immotile animals observed and gliding velocity and ciliary beat frequency for control and Smed-pam(RNAi), Smed-phm(RNAi) and Smed-phm+pam(RNAi) planaria. Knockdown of PHM alone or PHM+PAM resulted in significant decreases in both gliding velocity and beat frequency.
| Planaria sample | % immotile animals | Gliding velocity in mm/sec (mean ± SEM) | Ciliary beat frequency (Hz) |
|---|---|---|---|
| L4440 | 10 | 0.70 ± 0.08 | 26 |
| PHM+PAM | 27 | 0.43 ± 0.06 | 17 |
| PHM | 32 | 0.37 ± 0.07 | 18 |
| PAM | 17 | 0.76 ± 0.09 | 30 |
Table 3
Quantification of basal bodies and cytosolic axonemes in control and Smed-phm+pam(RNAi) planaria. The number of basal bodies docked at the cell surface with or without a ciliary extension and the number of observed cytosolic axonemes was determined for the indicated length of the ventral epithelium by TEM analysis. Numerous cytosolic axonemes were observed in PHM+PAM knockdown planaria, but none were found in controls.
| Planaria sample | Length scanned (µm) | # Docked Basal Bodies | # Cytosolic Axonemes | |
|---|---|---|---|---|
| + ciliary extension | No ciliary extension | |||
| L4440 | 145 | 45 | 1 | 0 |
| PHM+PAM | 94 | 17 | 4 | 29 |
Additional files
-
Supplementary file 1
Changes in gene expression of ciliary components in control and PAM-amiRNA cells analyzed by RNA sequencing.
Transcript abundance of genes encoding intraflagellar transport (IFT), transition zone (TZ), Bardet-Biedl syndrome (BBS) and trafficking components in three control and three PAM amiRNA strains. Mean ± SD RPKM (reads per kilobase per million mapped reads) values from control and PAM amiRNA strains are tabulated.
- https://doi.org/10.7554/eLife.25728.025
-
Supplementary file 2
Antibodies used in this study.
The source of each of the antibodies used in this study and the dilutions employed for immunofluorescence (IF) and western blot (WB) analysis are tabulated.
- https://doi.org/10.7554/eLife.25728.026
Download links
A two-part list of links to download the article, or parts of the article, in various formats.
Downloads (link to download the article as PDF)
Open citations (links to open the citations from this article in various online reference manager services)
Cite this article (links to download the citations from this article in formats compatible with various reference manager tools)
A bioactive peptide amidating enzyme is required for ciliogenesis
eLife 6:e25728.
https://doi.org/10.7554/eLife.25728


