Repression by PRDM13 is critical for generating precision in neuronal identity
- UT Southwestern Medical Center, United States
Figures
Figure 1
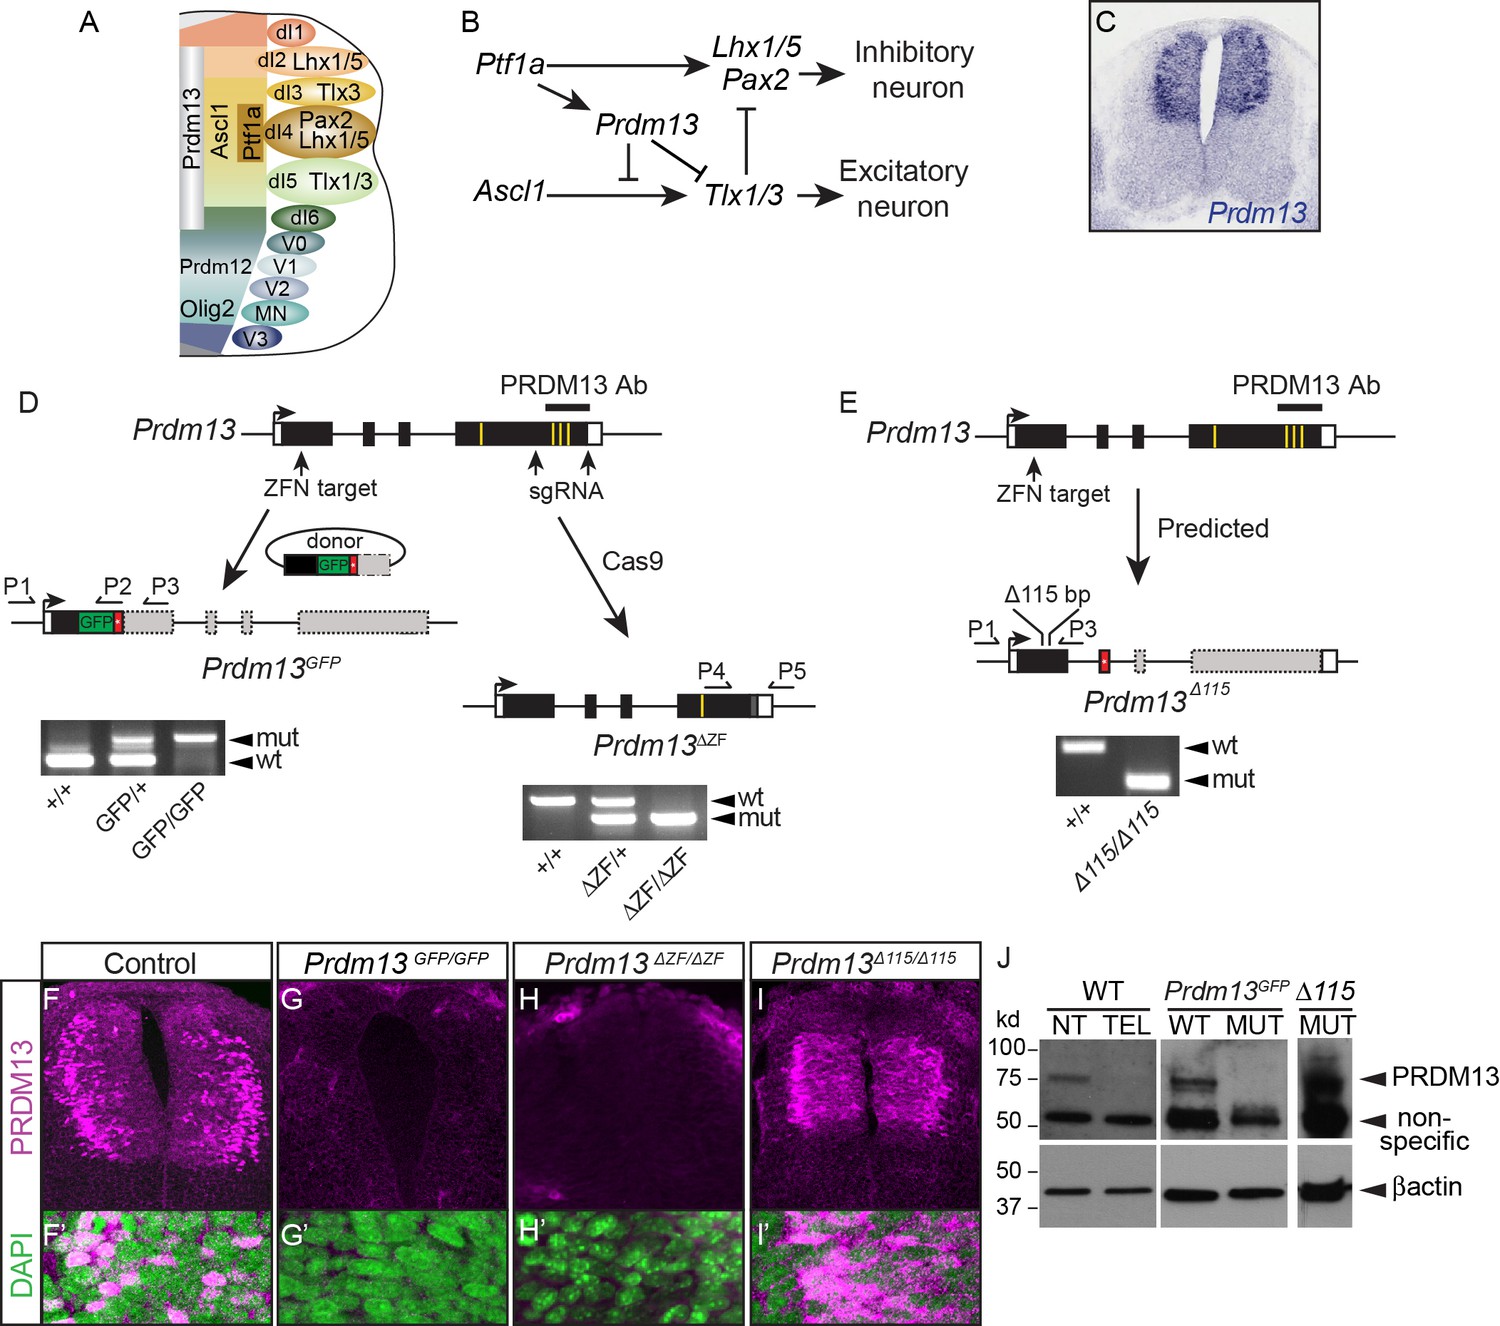
Generation of multiple mutant mouse alleles of Prdm13.
(A) Diagram of half an E10.5 neural tube highlighting expression domains of TFs used in this study. The ventricular zone containing neural progenitors (left) and differentiated neuronal populations (right) are shown. See (Lai et al., 2016) for a more comprehensive picture of the TFs patterning the neural tube at this stage. (B) Transcription factor network functioning in the dorsal neural tube generating inhibitory and excitatory neurons. (C) Prdm13 mRNA is restricted to the dorsal neural tube in mice at E11.5. (D–E) Three different targeting strategies resulting in Prdm13GFP, Prdm13∆ZF, and Prdm13 ∆115 mutant mouse strains. PCR on tail DNA with primers P1-P5 confirm the genotype of the mutant mice. Red box indicates an inserted stop codon. Yellow lines indicate individual ZFs. (F–I) Immunofluorescence showing PRDM13 (magenta) in wildtype (WT) and Prdm13 mutant strains in E11.5 neural tube. (F’–I’) Higher magnification including DAPI (green) to label nuclei. (J) Western blot from verifying loss of PRDM13 protein in neural tube of Prdm13GFP/GFP mutants and the expression of the mutant PRDM13 protein in Prdm13 ∆115/∆115 mutants. PRDM13 detected in wildtype mouse neural tube and telencephalon are positive and negative controls, respectively. βactin is the loading control.
Figure 2
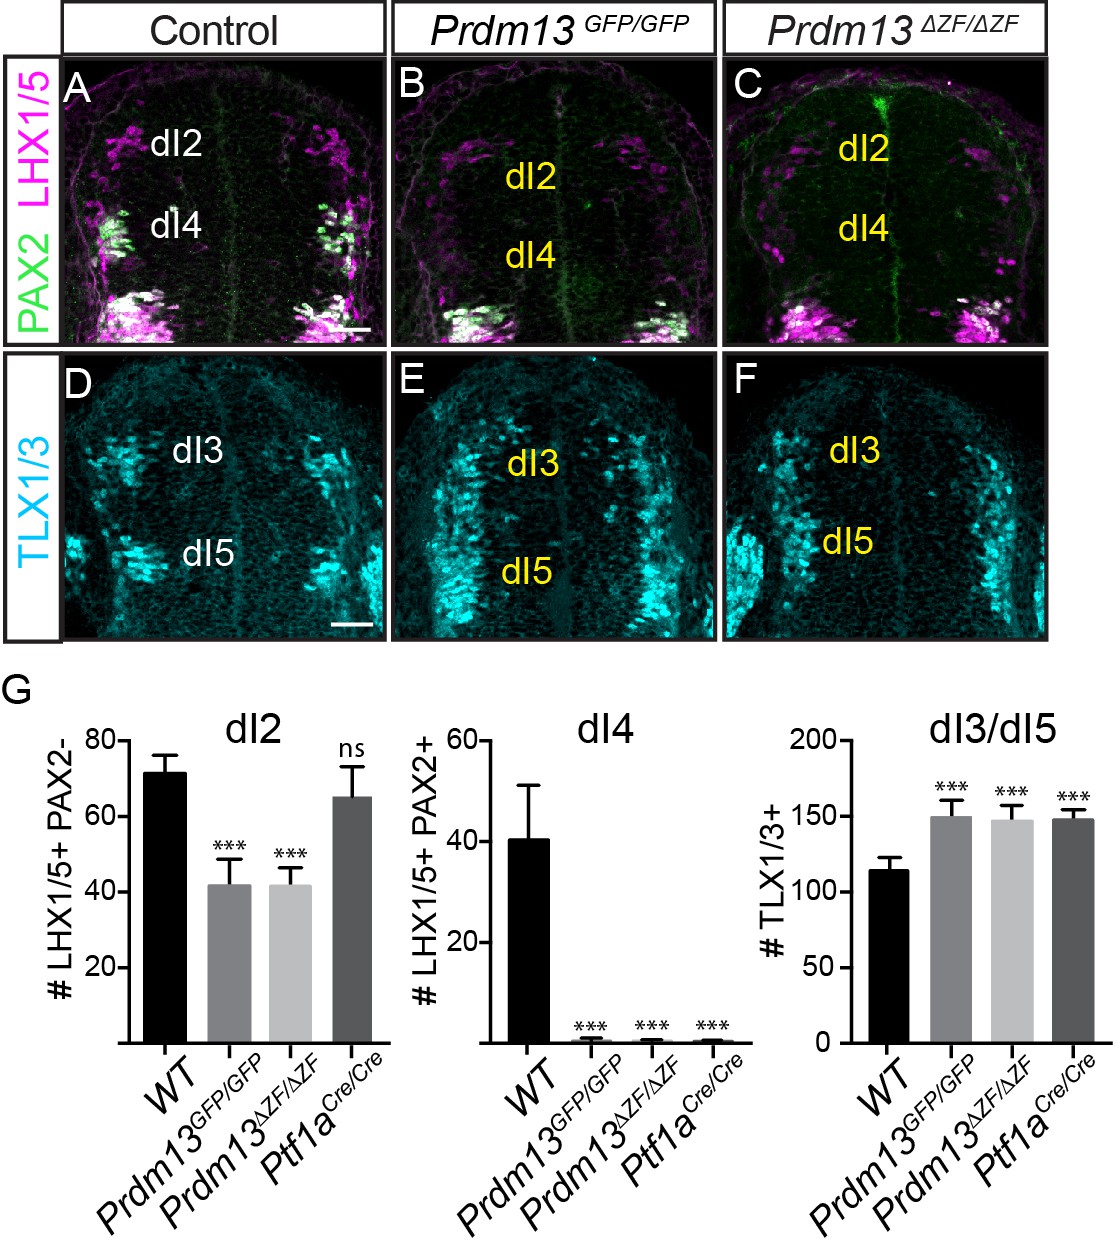
PRDM13 is required for specification of dorsal interneurons in the spinal cord.
(A–C) PAX2 (green) and LHX1/5 (magenta) immunofluorescence show the loss of dI4 and decrease of dI2 interneurons in the Prdm13 mutants relative to WT at E10.5. (D–F) TLX1/3 (cyan) immunofluorescence shows an increase in the number of dI3/5 interneurons in the Prdm13 mutants relative to WT. Scale bar: 50 µM. (G) Quantification reporting the number of dI2 (LHX1/5+;PAX2-), dI4 (PAX2+;LHX1/5+) and dI3/dI5 (TLX1/3+) cells per neural tube section in WT, Prdm13 mutants, and for comparison, Ptf1aCre nulls. Error bars indicate SEM. Student’s t-test was used to determine significant differences relative to WT (***p<0.001, NS = not significant) (n ≥ 5 embryos for each genotype).
-
Figure 2—source data 1
PRDM13 is required for specification of dorsal interneurons in the spinal cord.
Associated with Figure 2G. Quantification of the number of dI2 (Tab LHX1/5), dI4 (Tab PAX2 LHX1/5) and dI3/dI5 (Tab TLX1/3) cells per neural tube section in WT, Prdm13 mutants, and for comparison, Ptf1aCre nulls. Cell numbers from transverse section at forelimb level were counted for each half of the neural tube and average was considered for the analysis. The numbers of embryos for each genotype are indicated. SEM was used for error bars. Student’s t-test was used to determine significant differences relative to WT.
- https://doi.org/10.7554/eLife.25787.004
Figure 3
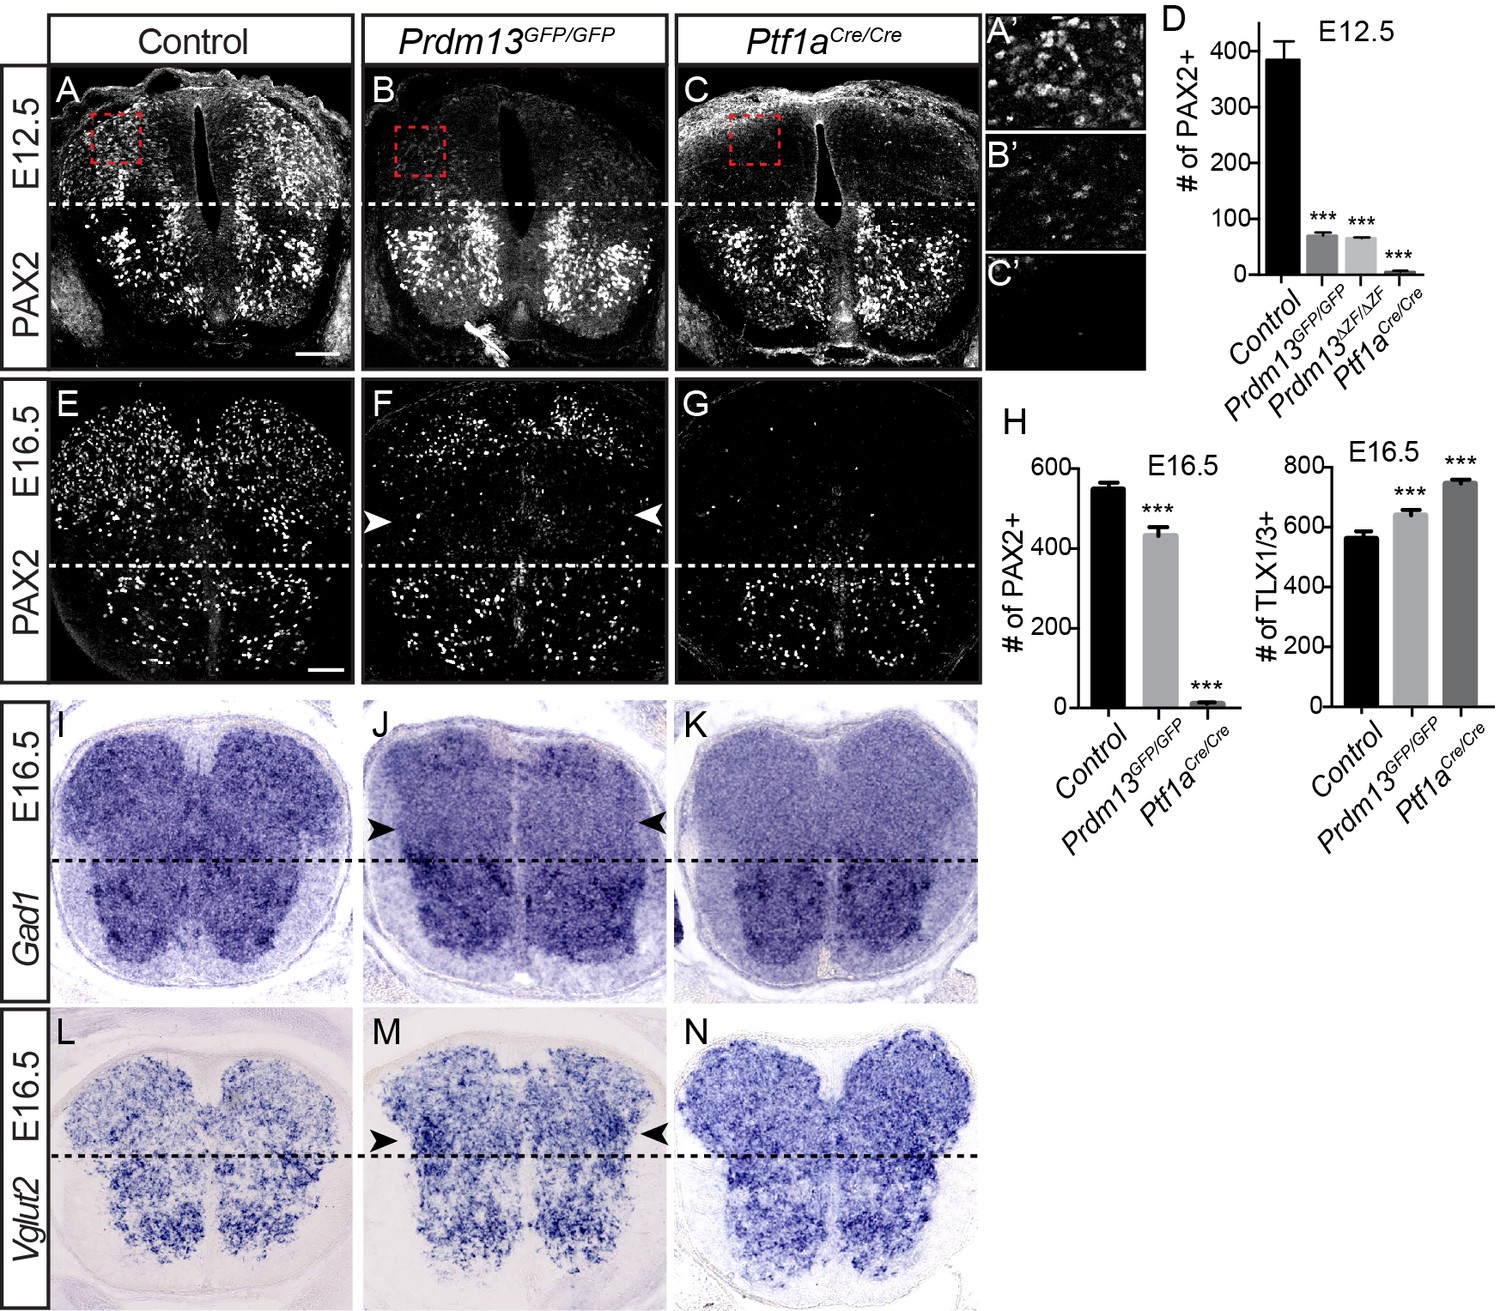
PRDM13 is not required for specification of dorsal interneurons during the late wave of neurogenesis.
Transverse sections of mouse neural tube. (A–C, E–G) Immunofluorescence for PAX2 highlights the reduced numbers of PAX2 positive neurons in the dorsal neural tube in Prdm13 mutants compared to no PAX2+ neurons in Ptf1a mutants at E12.5 (A–C) and E16.5 (E–G). (A’–C’) Higher magnification images of the red box highlighted (A–C). (D,H) Quantification reporting the number of PAX2+ or TLX1/3+ cells per neural tube section in WT, Prdm13 mutants, and for comparison, Ptf1aCre nulls. Error bars indicate SEM. Student’s t-test was used to determine significant differences relative to WT (***p<0.001) (n ≥ 8 for each genotype). Scale bar: 50 µM. (I–N) In situ hybridizations for Gad1 mRNA (I–K) shows the loss of inhibitory neurons in Prdm13 and Ptf1a mutants which is compensated by increase in excitatory neurons shown by Vglut2 (Slc17a6) mRNA (L-N arrowheads) at E16.5. Note the loss of dorsal Gad1 is more complete in the Ptf1a versus the Prdm13 mutants (J,K).
-
Figure 3—source data 1
PRDM13 is not required for specification of dorsal interneurons during the late wave of neurogenesis.
Associated with Figure 3D. Quantification of the number of dI4 (Tab E12.5 PAX2) cells per neural tube section in WT, Prdm13 mutants, and for comparison, Ptf1aCre nulls at E12.5. Associated with Figure 3H. Quantification of the number of dI4 (Tab E16.5 PAX2) cells and dI3/5 (Tab E16.5 TLX1/3) at E16.5. Cell numbers from transverse section at forelimb level were counted for each half of the embryo and average was considered for the analysis. The numbers of embryos for each genotype are indicated. SEM was used for error bars. Student’s t-test was used to determine significant differences relative to WT.
- https://doi.org/10.7554/eLife.25787.006
Figure 4
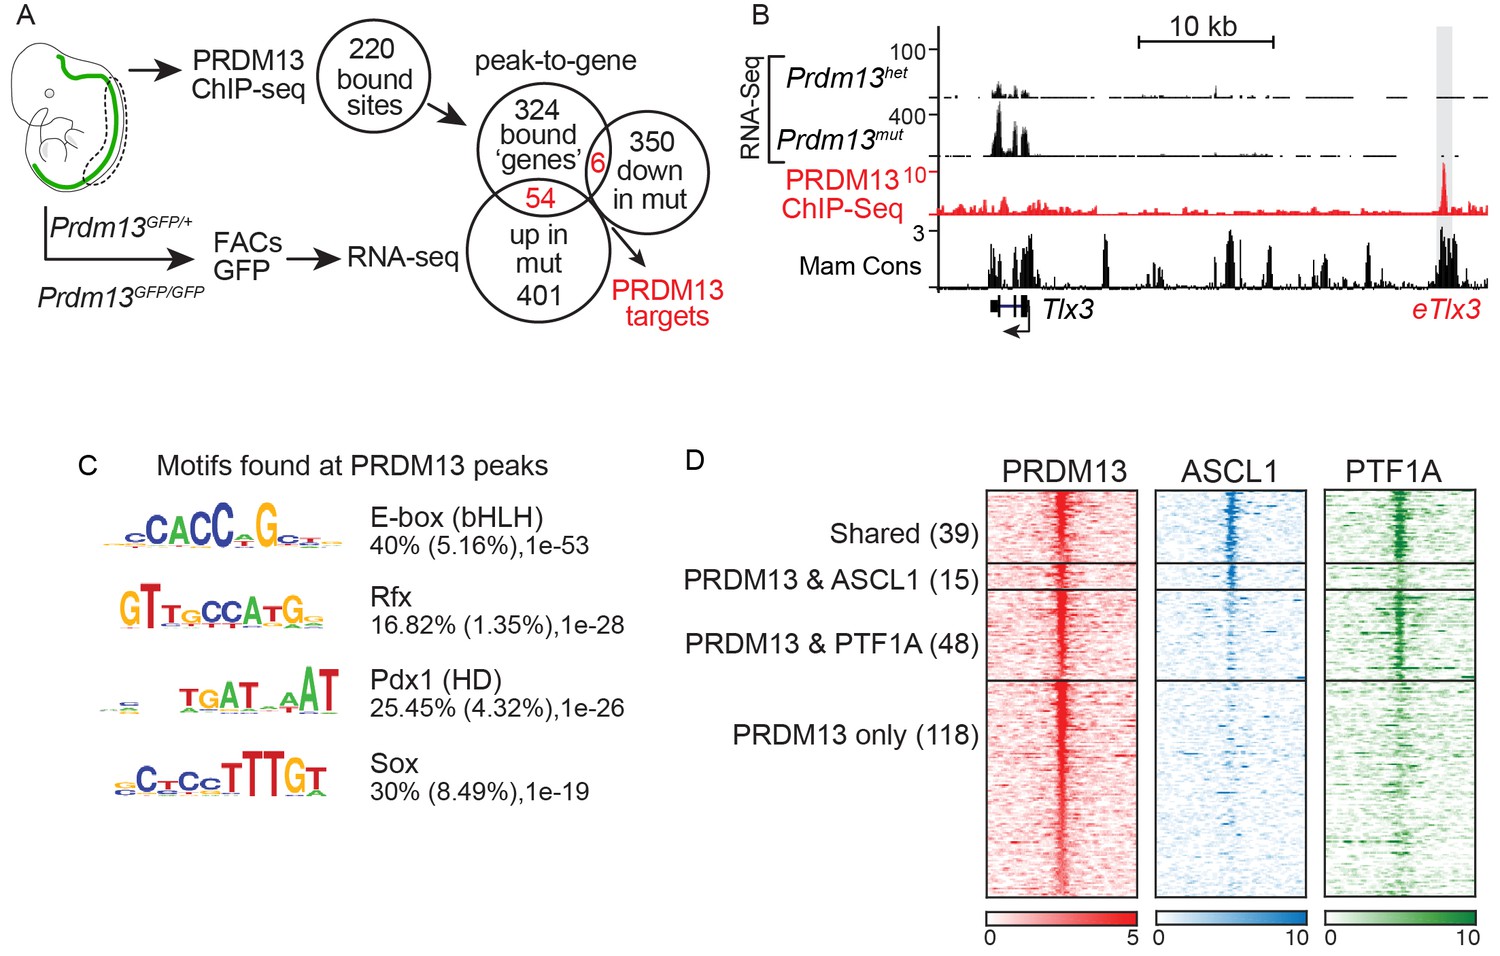
PRDM13 binds to the genome at many sites also bound by ASCL1 and PTF1A.
(A) Strategy to determine transcriptional targets of PRDM13 in E11.5 neural tubes. Venn diagrams illustrate the number of PRDM13 bound sites from ChIP-Seq (220), the genes associated with these sites (384), the genes upregulated in neural tubes from Prdm13GFP/GFP versus Prdm13GFP/+ (455), and the genes downregulated in mutant neural tubes (356). The overlap represents PRDM13 targets (60) increased (54, p-value=1.26e-27) and decreased (6, p-value=0.16) in Prdm13 mutants relative to controls. (B) Genome tracks at the Tlx3 locus showing the RNA-Seq from Prdm13 mutants, the PRDM13 ChIP-Seq, and mammalian sequence conservation. The known enhancer of Tlx3 (eTlx3) is highlighted. (C) De novo motif enrichment in PRDM13 bound regions (150 bp around each peak summit) using HOMER package v4.2. The motif with the most enrichment is an Ebox found in 40% of the sites. (D) Heat map of the 220 PRDM13 (red) bound sites from ChIP-seq from E11.5 mouse neural tube. A subset of these regions is also bound by ASCL1 (blue) and/or PTF1A (green).
Figure 5 with 1 supplement
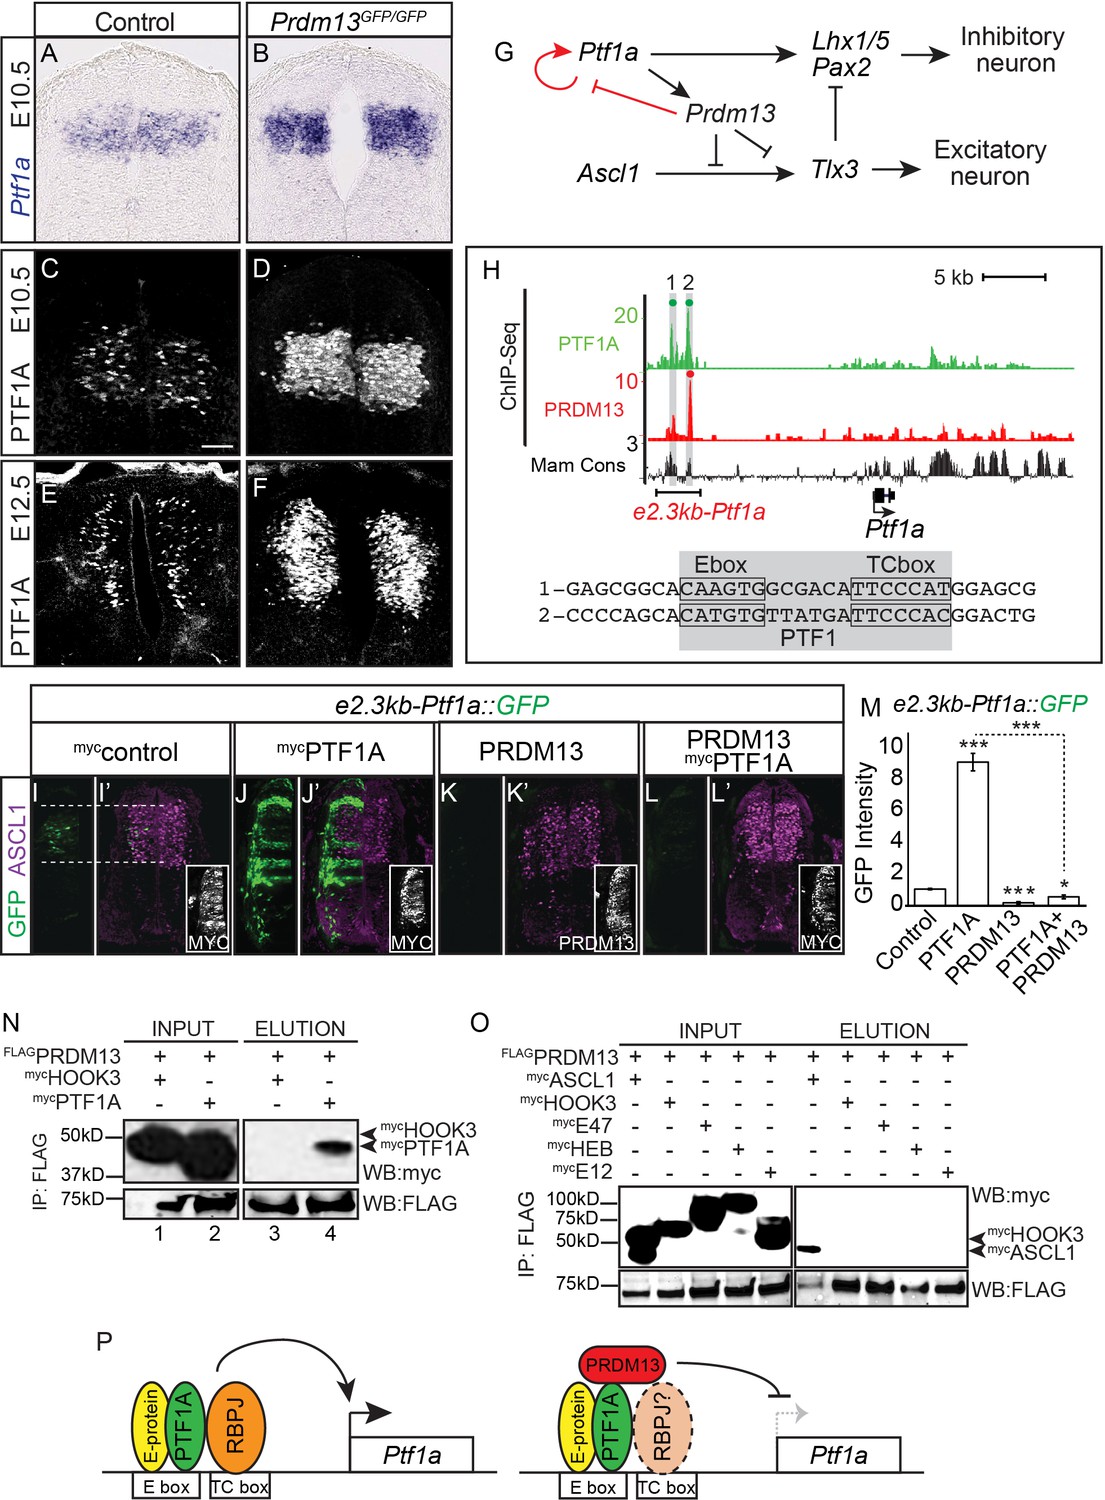
PRDM13 represses transcription of its upstream regulator Ptf1a through the Ptf1a auto-regulatory enhancer.
(A–B) In situ hybridization shows increase in Ptf1a mRNA in the Prdm13 mutant at E10.5 relative to wildtype. (C–F) Immunofluorescence confirms the increased levels of PTF1A in Prdm13 mutants at E10.5 (D) and E12.5 (F). (G) The transcription network highlighting PRDM13 inhibition of its upstream regulator Ptf1a. (H) Genome tracks showing ChIP-Seq data for PRDM13 and PTF1A at the Ptf1a locus. The two PTF1A bound sites in the Ptf1a autoregulatory enhancer are highlighted. The sequence at the center of each PTF1A ChIP peak is shown with the Ebox and TCbox sites boxed, which make up the PTF1 trimer binding motif (shaded). (I–L) Representative images from transverse sections of chick neural tubes co-electroporated with a GFP reporter driven by the 2.3kb-Ptf1a autoregulatory enhancer with the indicated expression vectors at HH13-14 and harvested 24 hr later. (I’–L’) ASCL1 (magenta) is shown as reference for the dP3-dP5 domains. Antibodies to MYC-epitope tag for control or PTF1A, or to PRDM13 are used to show the electroporation efficiency and/or the ectopic expression of PTF1A or PRDM13 (insets). PTF1A induces reporter expression while PRDM13 represses both the endogenous enhancer activity as well as the induced expression driven by PTF1A. (M) Quantification of GFP intensity for experiments shown in (I–L). Student t-test was used for significance relative to control except where indicated, *p<0.05, ***p<0.001. Error bars indicate SEM (n ≥ 8 embryos). (N–O) Western blots using antibodies against MYC-tag or FLAG-tag showing FLAG-immunoprecipitates from HEK293 cells ectopically expressing indicated factors. FLAG-tagged PRDM13 pulls down MYC-tagged PTF1A but not the negative control HOOK3 or the E-proteins (E47, E12, HEB). ASCL1 and HOOK3 are positive and negative controls respectively. (P) Proposed model for PRDM13 inhibition of Ptf1a expression by abrogating Ptf1a autoregulation. PTF1A functions in a trimeric complex (PTF1) with an E-protein and RBPJ (Meredith et al., 2009). Specifics on how PRDM13 interacts with DNA and the complex are not known. Scale bar: 50 µM.
-
Figure 5—source data 1
PRDM13 represses transcription of its upstream regulator Ptf1a through the Ptf1a auto-regulatory enhancer.
Associated with Figure 5M. Quantification of GFP intensity from transverse sections of chick neural tubes co-electroporated with a GFP reporter driven by the 2.3kb-Ptf1a autoregulatory enhancer (Tab Ptf1a enhancer). Electroporation of the enhancer with ectopic expression of PTF1A or PRDM13 are labelled accordingly. GFP intensity was calculated using ImageJ software for both electroporated and control side of the neural tube, and the difference between these was analyzed. The numbers of embryos for each electroporation condition are indicated. SEM was used for error bars. Student’s t-test was used to determine significant differences relative to control enhancer expression.
- https://doi.org/10.7554/eLife.25787.011
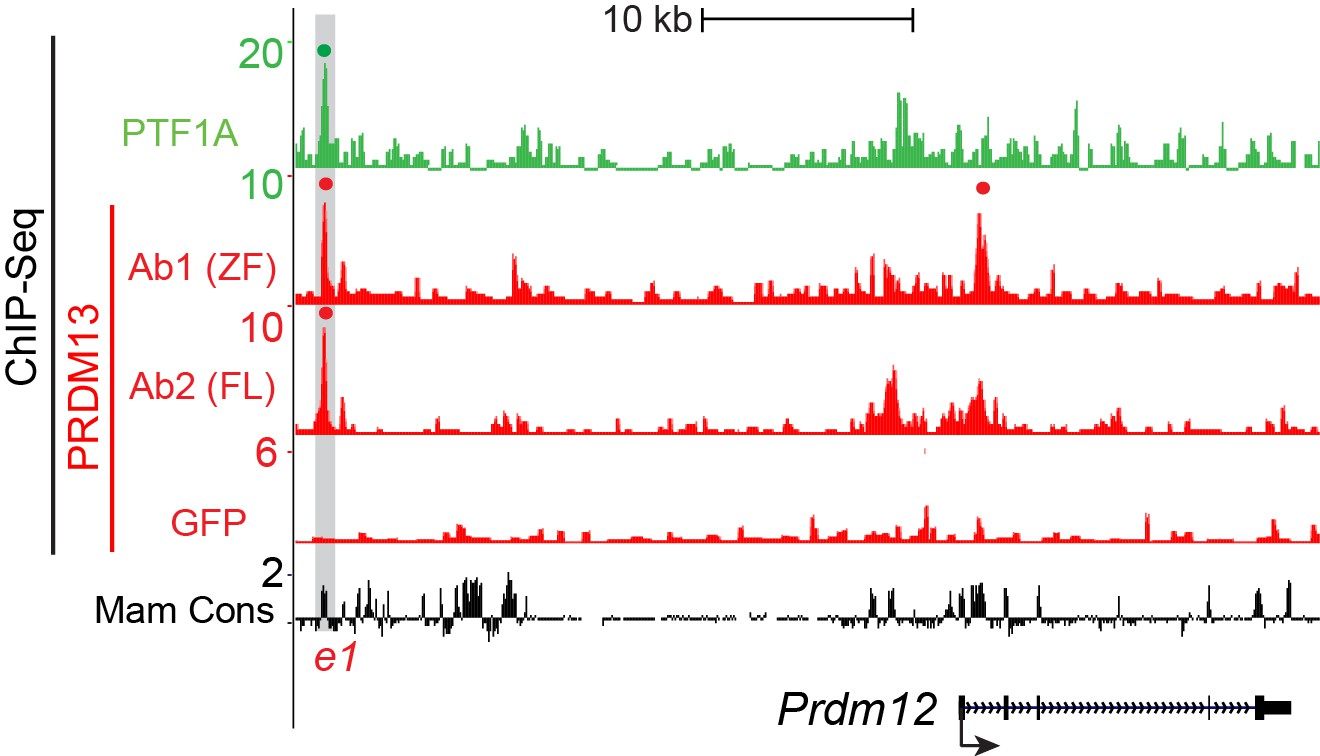
Figure 5—figure supplement 1
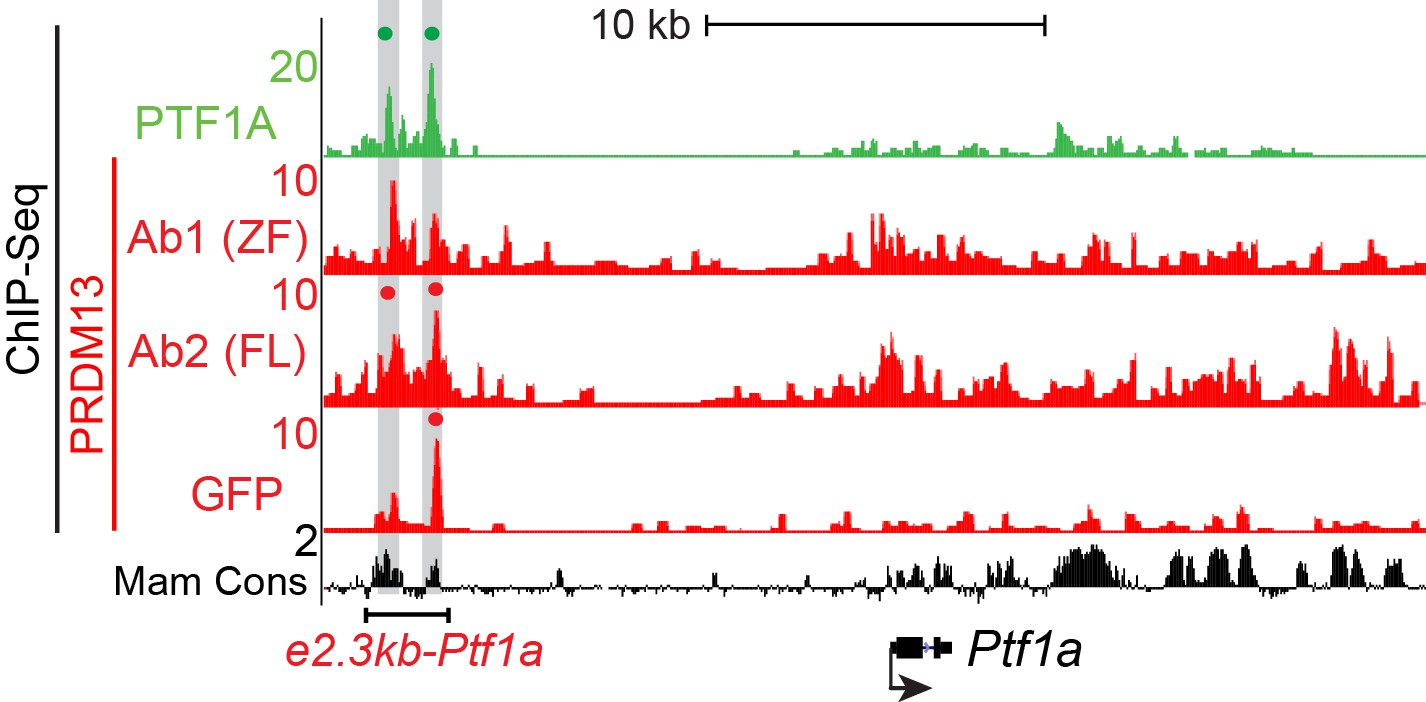
Genome tracks showing ChIP-Seq data for PTF1A and the 3 PRDM13 experiments at the Ptf1a locus.
The two PTF1A bound sites in the Ptf1a autoregulatory enhancer are highlighted and a dot above the peak indicates if the site was called as significant. ChIP using PRDM13-Ab1 (ZF) and PRDM13-Ab2 (FL) was performed in wildtype neural tubes (ICR) while GFP ChIP was performed on Prdm13fusGFP/fusGFP neural tubes. Peaks significant in at least 2 out of 3 PRDM13 ChIPs were considered.
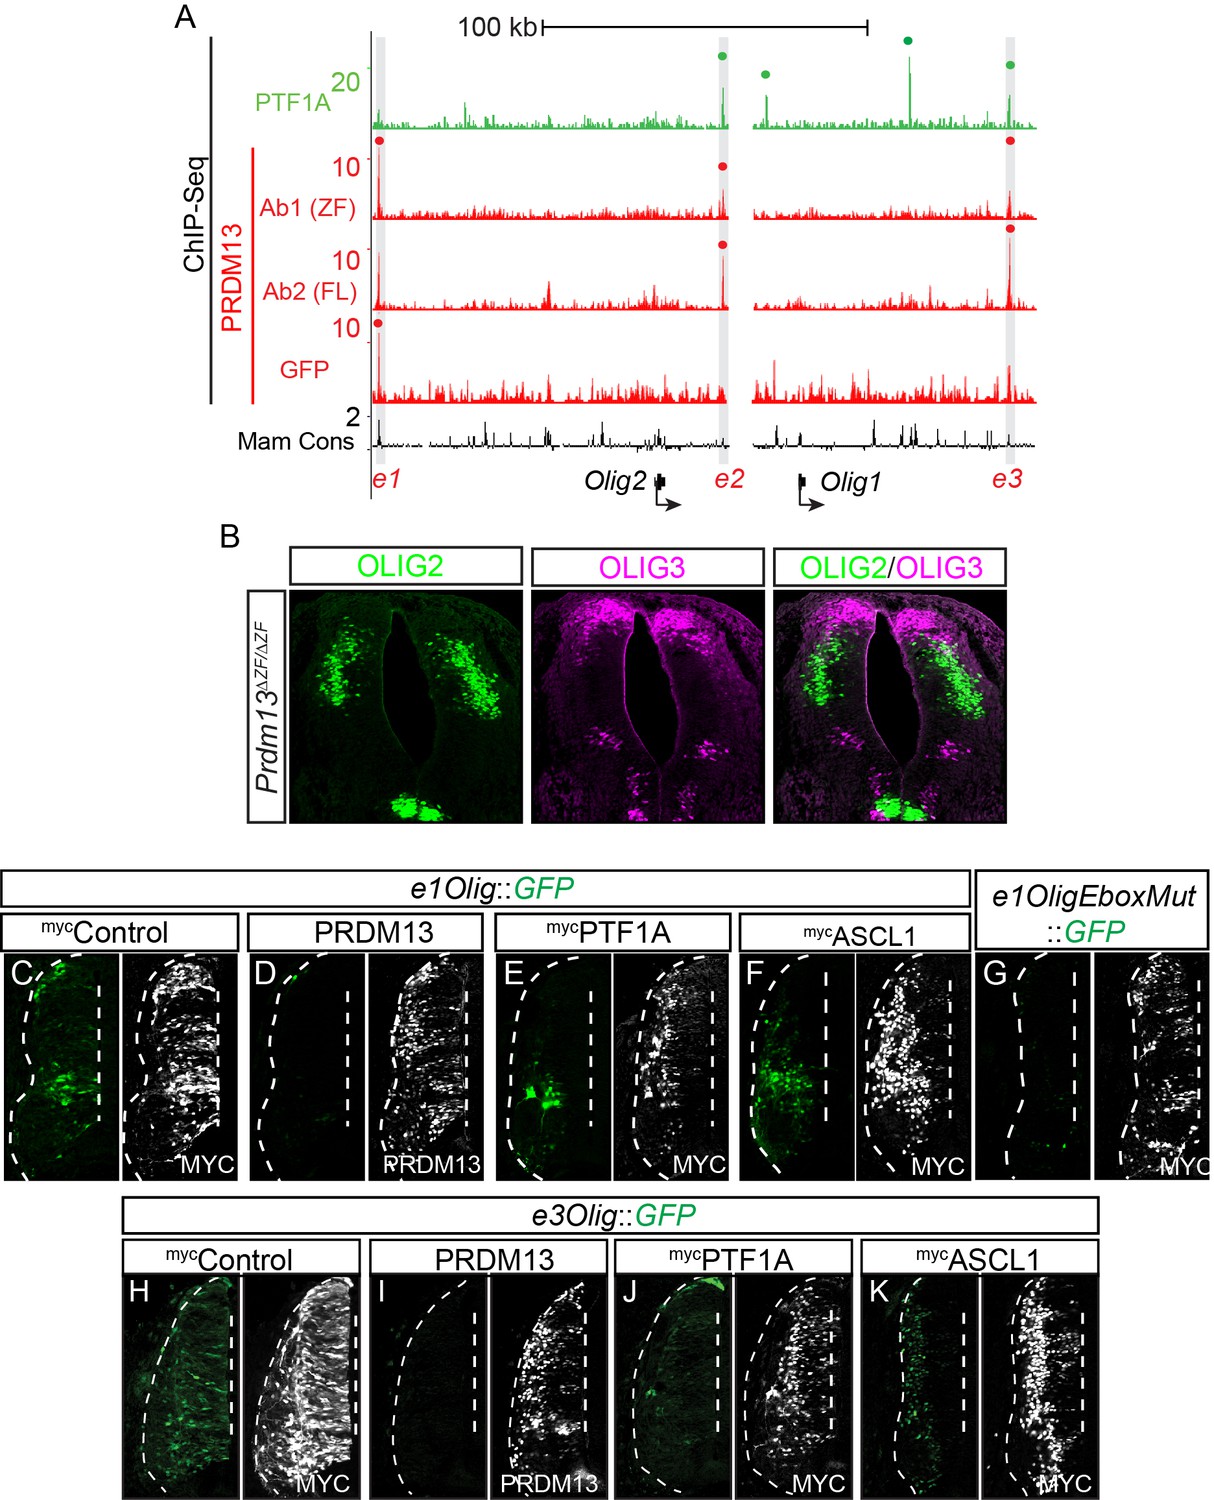
Figure 6 with 1 supplement

PRDM13 is required to block Olig2 expression in the dorsal neural tube via inhibition of PTF1A.
(A–D) Immunofluorescence shows ectopic OLIG2 in the dorsal neural tube in Prdm13 but not Ptf1a mutants at E11.5. (E–H) In the Prdm13 mutant, the PTF1A+ and TLX1/3+ cells are co-expressed with the ectopic OLIG2. (E’–H’) High magnification of (E–H) highlight the co-expression (white). (I) Genome tracks showing ChIP-Seq data from mouse neural tube tissue for PRDM13, PTF1A, and ASCL1 at the Olig2/Olig1 locus. The PRDM13 peaks are highlighted and a dot above the peak indicates if the site was called as significant (see Materials and methods). Regions e1Olig-e3Olig were tested in reporter assays. (J) The sequence at the center of the PRDM13 ChIP peaks contains a compound Ebox/TCbox with the proper spacing, which makes the PTF1 motif, is only present in e2Olig (shaded). (K–N, P–S) Representative images from transverse sections of chick neural tubes co-electroporated with e2Olig::GFP or e2Olig-PTF1Mut::GFP or e2Olig-allEboxMut::GFP reporter constructs and expression vectors as indicated at HH13-14 and harvested 24 hr later. Antibodies to MYC-epitope tag or PRDM13 (white) confirm the electroporation efficiency and the overexpression of the respective transcription factor. (K–O) PRDM13 overexpression inhibits e2Olig::GFP expression. PTF1A is sufficient to induce e2Olig2::GFP, but this activity is repressed by PRDM13. (P–T) e2Olig::GFP enhancer activity and its induction by PTF1A is lost when E-boxes that conform to the PTF1 motif or all Eboxes are mutated. (O,T) Quantification of GFP intensity for experiments shown in (K–N, P–S). (U,V) PRDM13 overexpression inhibits e1Olig::GFP and e3Olig::GFP expression while neither PTF1A or ASCL1 alter levels. Student’s t-test was used for significance relative to control except where indicated, **p<0.01, ***p<0.001, ns = not significant. Error bars indicate SEM (n ≥ 8 embryos). (W) Model for how expression of the Olig locus is inhibited by PRDM13 in the dorsal neural tube. Loss of this inhibition in the Prdm13 mutant leads to PTF1A driven ectopic expression. Scale bar: 50 µM.
-
Figure 6—source data 1
PRDM13 is required to block Olig2 expression in the dorsal neural tube via inhibition of PTF1A.
Associated with Figure 6O,T,U,V. Quantification of GFP intensity from transverse sections of chick neural tubes co-electroporated with a GFP reporter driven by the e2Olig enhancer, e2Olig-PTF1Mut and e2Olig-allEboxMut (Tab e2Olig), e1Olig enhancer (Tab e1Olig) and e3Olig enhancer (Tab e3Olig). Electroporation of the enhancer with ectopic expression of PTF1A, ASCL1 or PRDM13 are labelled accordingly. GFP intensity was calculated using ImageJ software for both electroporated and control side of the neural tube, and the difference between these was analyzed. The numbers of embryos for each electroporation condition are indicated. SEM was used for error bars. Student’s t-test was used to determine significant differences relative to control enhancer expression.
- https://doi.org/10.7554/eLife.25787.014
Figure 6—figure supplement 1
(A) Genome tracks showing ChIP-Seq data for PTF1A and the 3 PRDM13 experiments at the Olig2/Olig1 locus.
The PRDM13 peaks are highlighted and a dot above the peak indicates if the site was called as significant. ChIP using PRDM13-Ab1 (ZF) and PRDM13-Ab2 (FL) was performed in wildtype neural tubes while GFP ChIP was performed on Prdm13fusGFP/fusGFP neural tubes. Peaks significant in at least 2 out of 3 PRDM13 ChIPs were considered. (B) In the Prdm13ΔZF/ΔZF, the OLIG3+ cells are not co-expressed with the ectopic OLIG2. (C–K) Representative images from transverse sections of chick neural tubes co-electroporated with e1Olig::GFP, e1OligEboxMut::GFP or e3Olig::GFP reporter constructs and expression vectors as indicated at HH13-14 and harvested 24 hr later. Antibodies to MYC-epitope tag or PRDM13 (white) confirm the electroporation efficiency and the overexpression of the respective transcription factor. PRDM13 overexpression inhibits e1Olig::GFP and e3Olig::GFP expression while neither PTF1A nor ASCL1 alter levels. Quantification is shown in Figure 6U,V. (G) Mutating the Ebox disrupts the activity of e1Olig::GFP.
Figure 7 with 1 supplement
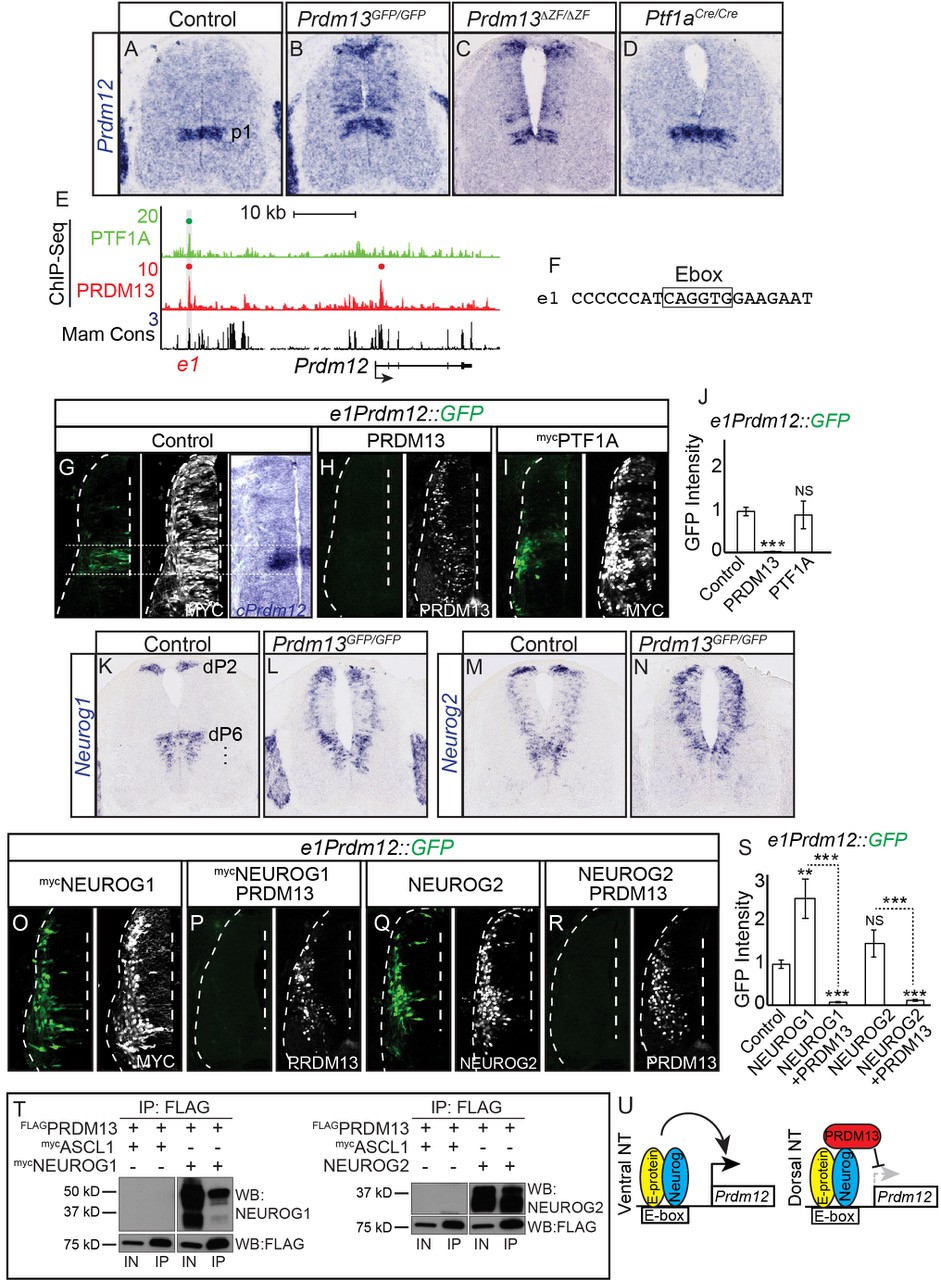
PRDM13 is required to restrict Prdm12 from expression in the dorsal neural tube via inhibition of NEUROG1/2.
(A–D) In situ hybridization shows ectopic Prdm12 mRNA in the dorsal neural tube in Prdm13 mutants but not Ptf1a mutants at E11.5. (E) Genome tracks showing ChIP-Seq data from mouse neural tube tissue for PRDM13 and PTF1A at the Prdm12 locus. The PRDM13 peaks are highlighted and a dot above the peak indicates if the site was called as significant (see Materials and methods). Region e1 was tested in reporter assays. (F) The sequence at the center of the PRDM13 ChIP peak shows e1 has an Ebox. (G-I, O-R,) Representative images from transverse sections of chick neural tubes co-electroporated with e1Prdm12::GFP reporter constructs and expression vectors as indicated at HH13-14 and harvested 24 hr later. Antibodies to MYC-epitope tag or PRDM13 (white) confirm the electroporation efficiency and the overexpression of the respective transcription factor. (G) In situ hybridization shows endogenous cPrdm12. The dotted lines indicate the V1 domain. (G–I) PRDM13 overexpression inhibits e1Prdm12::GFP expression whereas PTF1A has no effect. (O–R) NEUROG1 and NEUROG2 induce e1Prdm12::GFP expression and this is inhibited by PRDM13. (J, S,) Quantification of GFP intensity from chick electroporation experiments. Student’s t-test was used for significance relative to control except where indicated, **p<0.01, ***p<0.001, ns = not significant. Error bars indicate SEM (n ≥ 8 embryos). (K–N) In situ hybridization shows ectopic Neurog1 and Neurog2 mRNA in the dorsal neural tube in the Prdm13 mutants at E10.5 relative to wildtype. (T) Western blot showing Co-IP of NEUROG1 and NEUROG2 by PRDM13 from HEK293 cells ectopically expressing these factors. (U) Model for how Prdm12 expression is inhibited by PRDM13 in the dorsal neural tube. Loss of this inhibition in the Prdm13 mutant leads to NEUROG driven ectopic expression of Prdm12. Scale bar: 50 µM.
-
Figure 7—source data 1
PRDM13 is required to restrict Prdm12 from expression in the dorsal neural tube via inhibition of NEUROG1/2.
Associated with Figure 7—figure supplement 7S. Quantification of GFP intensity from transverse sections of chick neural tubes co-electroporated with a GFP reporter driven by the e1Prdm12 (Tab e1Prdm12) and e2Prdm12 enhancer (Tab e2Prdm12). Electroporation of the enhancer with ectopic expression of PTF1A, NEUROG1, NEUROG2 or PRDM13 are labelled accordingly. GFP intensity was calculated using ImageJ software for both electroporated and control side of the neural tube, and the difference between these was analyzed. The numbers of embryos for each electroporation condition are indicated. SEM was used for error bars. Student’s t-test was used to determine significant differences relative to control enhancer expression.
- https://doi.org/10.7554/eLife.25787.017
Figure 7—figure supplement 1
Genome tracks showing ChIP-Seq data for PTF1A and the 3 PRDM13 experiments at the Prdm12 locus.
The PRDM13 peaks are highlighted and a dot above the peak indicates if the site was called as significant. ChIP using PRDM13-Ab1 (ZF) and PRDM13-Ab2 (FL) was performed in wildtype neural tubes while GFP ChIP was performed on Prdm13fusGFP/fusGFP neural tubes. Peaks significant in at least 2 out of 3 PRDM13 ChIPs were considered.
Figure 8 with 1 supplement

Summary of the transcriptional repressor functions of PRDM13 required for correct specification of spinal cord neurons.
Three modes of PRDM13 repression that involve different neural bHLH factors (PTF1A, ASCL1, and NEUROG1/2) are diagrammed, as are the wildtype versus the Prdm13 mutant phenotypes in hemi segments of the E10.5/E11.5 neural tube. (A) PRDM13 represses transcription of its activator PTF1A in a negative feedback loop. (B) PRDM13 is central to the bistable fate switch between the PAX2+ dI4 inhibitory neurons and the TLX1/3+ dI5 excitatory neurons by repressing transcription of TLX3 via an ASCL1 regulated enhancer. (C) PRDM13 functions to exclude ventral neural tube specification factors from being transcribed in the dorsal neural tube.
Figure 8—figure supplement 1
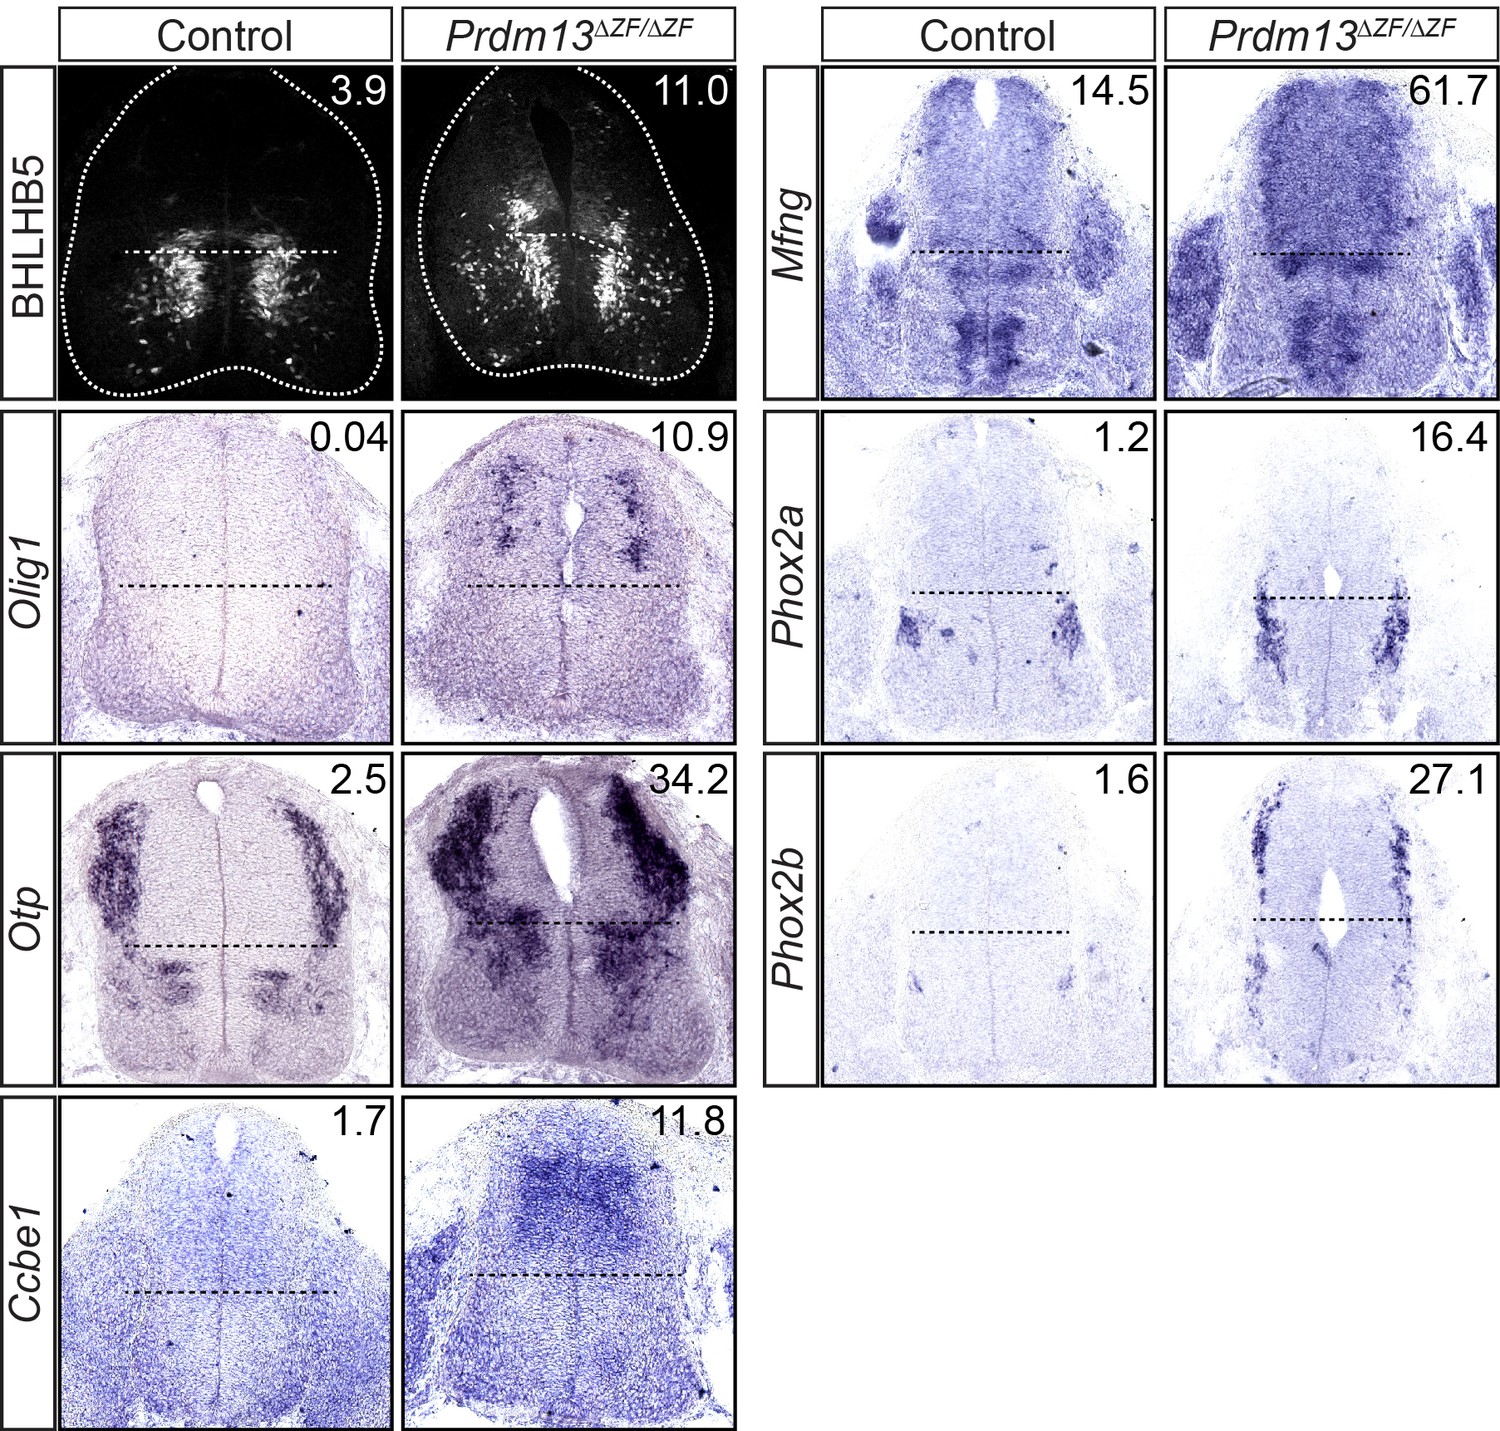
Immunohistochemistry for BHLHB5 and in situ hybridization for Olig1, Otp, Ccbe1, Mfng, Phox2a and Phox2b mRNA show ectopic dorsal neural tube expression in the Prdm13ΔZF/ΔZF mutants at E11.5 relative to controls.
FPKM for each gene from the RNA-Seq is indicated in the top right corner.
Tables
Table 1
Select differentially expressed genes (DEG) in the dorsal neural tube of mouse Prdm13 mutants (Prdm13GFP/+ versus Prdm13GFP/GFP).
Genes with associated PRDM13 ChIP-seq peaks in two of three experiments are bolded. See Supplementary files 1 and 3 for a full list of DEG and PRDM13 binding site coordinates.
TFs | Fold up in mutants | Neural related Factors | Fold up in mutants | TFs | Fold down in mutants | Neural related Factors | Fold down in mutants |
|---|---|---|---|---|---|---|---|
| Olig2 | 1114 | Calb2 | 7.3 | Hmx2 | 6.8 | Gad2 | 6.2 |
| Olig1 | 217 | Syt13 | 5.2 | Pax2 | 6.3 | Slc6a5 | 5.9 |
| Prdm12 | 24 | Slc1a3 | 4.4 | Lhx1 | 5.7 | Slc32a1 | 5.6 |
| Tlx3 | 17 | Frzb | 4.2 | Pax8 | 5.6 | Nrxn3 | 5.4 |
| Phox2b | 17 | Mfng | 4.2 | Hmx3 | 5.5 | Cacna2d3 | 4.9 |
| Otp | 13 | Slc17a6 | 4.1 | Lhx5 | 4.4 | Gad1 | 4.6 |
| Phox2a | 13 | Ddc | 3.9 | Gsx2 | 3.4 | Slc30a3 | 4.4 |
| Shox2 | 12 | Slc17a7 | 3.7 | Skor2 | 3.3 | Epha2 | 3.4 |
| Lmx1b | 12 | Cbln2 | 3.5 | Gbx2 | 2.9 | Gria1 | 3.4 |
| En1 | 5.1 | Slc31a2 | 3.6 | Foxd3 | 2.7 | Robo4 | 2.9 |
| Dlx3 | 5.1 | Ntrk1 | 3.5 | Mecom | 2.6 | Ret | 2.9 |
| Dbx1 | 4.8 | Cbln1 | 3.4 | Pax5 | 2.6 | Robo3 | 2.7 |
| Isl1 | 4.5 | Slc15a2 | 3.2 | Gsx1 | 2.3 | Npy | 2.6 |
| Tlx1 | 4.3 | Sncg | 3.1 | Nkx1.1 | 2.1 | Slc7a5 | 2.4 |
| Neurod4 | 3.8 | Chrna4 | 3.1 | Irx4 | 2.0 | Slc7a1 | 2.3 |
| Ptf1a | 3.5 | Ncald | 3.0 | Sez6 | 2.0 | ||
| Neurog1 | 3.4 | Lgr5 | 3.0 | ||||
| Pou4f1 | 3.0 | Cacna2d1 | 3.0 | ||||
| Pou3f1 | 2.9 | Kcnk2 | 2.8 | ||||
| Bhlhe22 | 2.8 | Nrn1 | 2.8 | ||||
| Pou4f2 | 2.6 | Chrna3 | 2.7 | ||||
| Prdm13 | 2.6 | Nphs1 | 2.6 | ||||
| Id1 | 2.3 | Chrnb4 | 2.5 | ||||
| Id4 | 2.0 | Kirrel2 | 2.4 | ||||
| Neurog2 | 1.7 | Nefm | 2.3 |
Additional files
-
Supplementary file 1
ChIP_seq_ZF sheet: Contains all Prdm13 bound regions in E11.5 mouse (ICR) neural tube from ChIP-Seq using Prdm13 Zinc finger antibody.
ChIP_seq_GFP sheet: Contains all Prdm13 bound regions in E11.5 mouse (Prdm13-GFP fusion mouse line) neural tube from ChIP-Seq using GFP antibody.ChIP_seq_FL sheet: Contains all Prdm13 bound regions in E11.5 mouse (ICR) neural tube from ChIP-Seq using full length Prdm13 antibody.ChIP_seq reads were mapped to mm10 genome build. Peaks were called using neural tube input for ZF and GFP samples, and telencephalon tissue for FL samples. Maximum of two target genes were assigned to each peak using GREAT software. The chromosome and the coordinates for the start and end are given for each peak. Data available GSE90938. Peaks-shared sheet: PRDM13 bound peaks called in at least 2 of the three experiments. RNA_seq sheet: Contains normalized expression (FPKM) values obtained from RNA-seq experiments performed on GFP sorted cells from E11.5 mouse neural tube (Prdm13-GFP/GFP = Prdm13 homo and Prdm13-GFP/+ = Prdm13 het). (I) An fpkm value of >1 was used to determine expression in the sample population.
- https://doi.org/10.7554/eLife.25787.020
-
Supplementary file 2
RNA-seq from Prdm13 Het samples (Prdm13^GFP/+) and Prdm13 Homo samples (Prdm13^GFP/GFP).
GFP cells were isolated by FACS from E11.5 neural tubes. Up_reg_in_HET_1.5FC sheet contains genes that are upregulated (Fold change >= 1.5; FPKM >= 1) in Prdm13^GFP/+compared to Prdm13^GFP/GFP. Down_reg_in_HET_1.5FC sheet contains genes that are downregulated (Fold change <= 1.5; FPKM >= 1) in Prdm13^GFP/+compared to Prdm13^GFP/GFP. Attached sheets contain over represented pathways in differentially expressed genes (DEGs) that are bound by Prdm13 and just DEGs alone.
- https://doi.org/10.7554/eLife.25787.021
-
Supplementary file 3
All PRDM13 ChIP peak-to-gene sheet contains the list of genes associated with PRDM13 binding sites and their expression data from the RNA-seq data inE11.5 neural tubes GFP sorted cells from Prdm13 wt vs mutants (from Table 1).
For these targets, PRDM13 binding site information was provided and also whether ASCL1 or PTF1A binding sites were shared with PRDM13 binding sites or not.PRDM13 targets sheet contains only those genes from the previous list that were differentially expressed in the Prdm13 wt vs mutants. The genes normally repressed by PRDM13 are highlighted in red and the genes induced by PRDM13 are highlighted in green.
- https://doi.org/10.7554/eLife.25787.022
Download links
A two-part list of links to download the article, or parts of the article, in various formats.
Downloads (link to download the article as PDF)
Open citations (links to open the citations from this article in various online reference manager services)
Cite this article (links to download the citations from this article in formats compatible with various reference manager tools)
Repression by PRDM13 is critical for generating precision in neuronal identity
eLife 6:e25787.
https://doi.org/10.7554/eLife.25787


