Optocontrol of glutamate receptor activity by single side-chain photoisomerization
- Ecole Normale Supérieure, CNRS, INSERM, PSL Research University, France
- University of California, San Francisco, United States
- Université Pierre-et-Marie-Curie, CNRS, France
Figures
Figure 1

General principle for genetic encoding photoswitchable UAAs into membrane receptors.
(a) Schematic representation of the UAA methodology applied to NMDARs. A gene encoding a membrane protein of interest (here shown for the NMDAR GluN1 subunit; blue) and containing an introduced Amber stop codon (TAG, red) at a desired position is co-transfected into HEK cells with vectors encoding a WT GluN2 subunit and an orthogonal suppressor tRNA (yellow) / aminoacyl synthetase (RS; grey) pair. The cells are incubated in the presence of the photoswitchable UAA (PSAA, green asterisks) in the culture medium. Within the cell, the orthogonal RS specifically aminoacylates the suppressor tRNA with the PSAA. At the ribosome level, the PSAA is incorporated in response to the Amber codon on the mRNA by the complementary anticodon CUA on the suppressor tRNA (red). After release from the ribosome, the full-length GluN1 polypeptide chain, site-specifically carrying the PSAA, assembles into a functioning receptor expressed at the cell surface. (b) Structure of the PSAA. The photoisomerizable azobenzene unit is highlighted in green. Additionally, a functional alkene group, which allows a covalent click reaction with nearby cysteines, is attached to the azobenzene unit. (c) Diagram of a NMDAR GluN1/GluN2 heterodimer carrying a PSAA at the ABD dimer interface. Toggling between the trans- and cis-configuration is induced by light exposure at 460 or 365 nm, respectively. This simple change in side chain geometry, when placed at a receptor key moving site, allows inducing remarkable structural changes that can impact receptor activity.
Figure 2 with 4 supplements
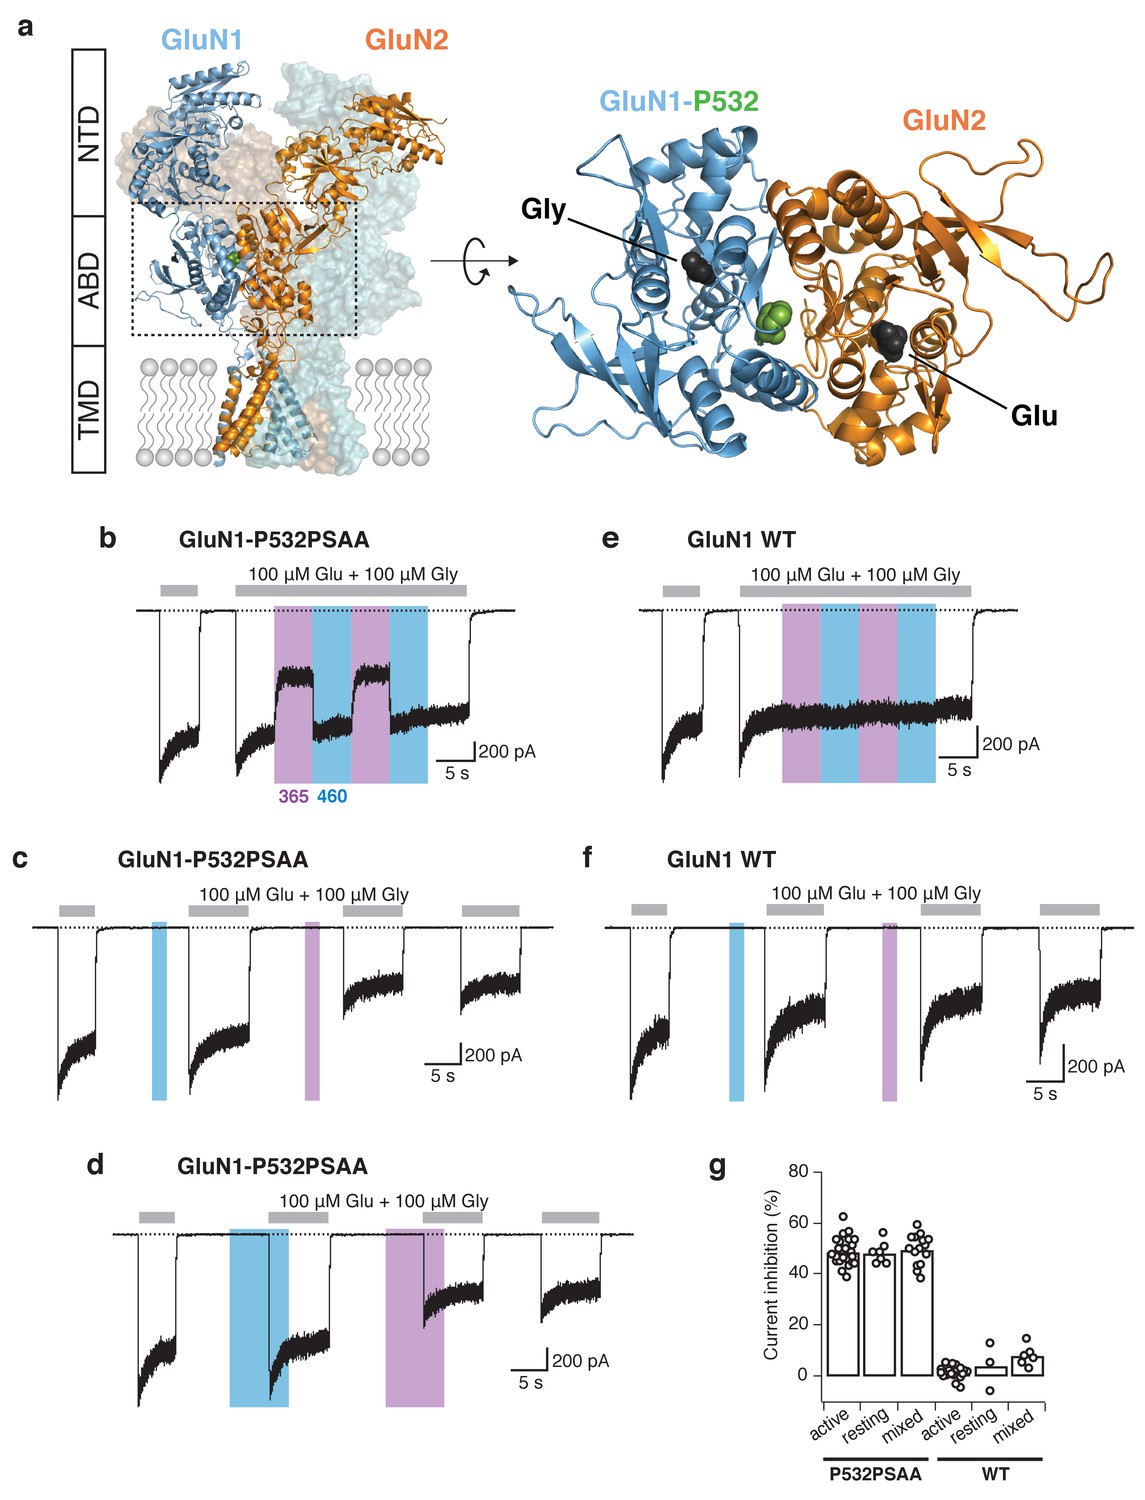
Reversible photomodulation of NMDARs with PSAA at the GluN1-P532 site.
(a) Structure of a heteromeric GluN1/GluN2B receptor (left panel). The two GluN1 subunits are shown in blue, the two GluN2 subunits in orange. One receptor dimer is highlighted by cartoon representation. The typical layered organization contains the N-terminal domains (NTDs), the agonist-binding domains (ABDs), and the transmembrane domain (TMD). The C-terminal domain (CTD) is absent in the structure. The Amber mutation site GluN1-P532 at the GluN1/GluN2 ABD heterodimer interface is shown as green spheres. The top view of one ABD dimer highlights the location of the PSAA insertion (right panel). (b) Representative current trace of GluN1-P532PSAA/GluN2A receptors showing reversible photomodulation following 5 s of UV and blue light during the application of saturating co-agonists. In this example, the UV-driven current reduction was 46%. (c) UV (2 s) in the resting state on the same cell as in b gave a current inhibition of 51%. (d) The photoinactivation degree was similar when UV was applied in the ‘mixed’ state (50%). (e) As in b, for WT GluN1/GluN2A receptors. Nearly no modulation of the current amplitude was observed (2% inhibition with UV). (f) As in c, for WT receptors (13% inhibition with UV). (g) Summary of UV inhibition degrees for the PSAA-mutant and WT receptors following UV exposures in different states. For the PSAA-mutant, mean photoinactivation values are (in %): Inhactive = 48.9 ± 1 (n = 23), Inhrest = 48.4 ± 2 (n = 7), Inhmixed = 49.7 ± 2 (n = 14). For WT receptors: Inhactive = 1.3 ± 0.6 (n = 18), Inhrest = 4 ± 5 (n = 3), Inhmixed = 7.9 ± 2 (n = 6).
Figure 2—figure supplement 1

: Summary of expression levels for wild-type receptors and all GluN1 Amber mutant receptors that exhibited photomodulation following introduction of PSAA.
The maximal peak current amplitudes, recorded in the dark state, were as follows (in pA): 2450 ± 280 (n = 18, WT), 760 ± 110 (n = 23, P532), 230 ± 90 (n = 9, Y535), 430 ± 90 (n = 5, F554), 50 ± 10 (n = 3, W563), 120 ± 40 (n = 14,Y647), 210 ± 60 (n = 12, F654), 1030 ± 310 (n = 6, Y109+GluN2A), IPeak320 ± 80 (n = 10, Y109+GluN2B). The current amplitudes represent the expression levels 24–72 hr following PEI transfection. The graph shows the peak currents of those cells that underwent statistical analysis following any kind of light protocols. Blank recordings were not taken into account in this illustration. All GluN1 mutants were co-expressed with GluN2A-WT subunits unless otherwise noted.
Figure 2—figure supplement 2
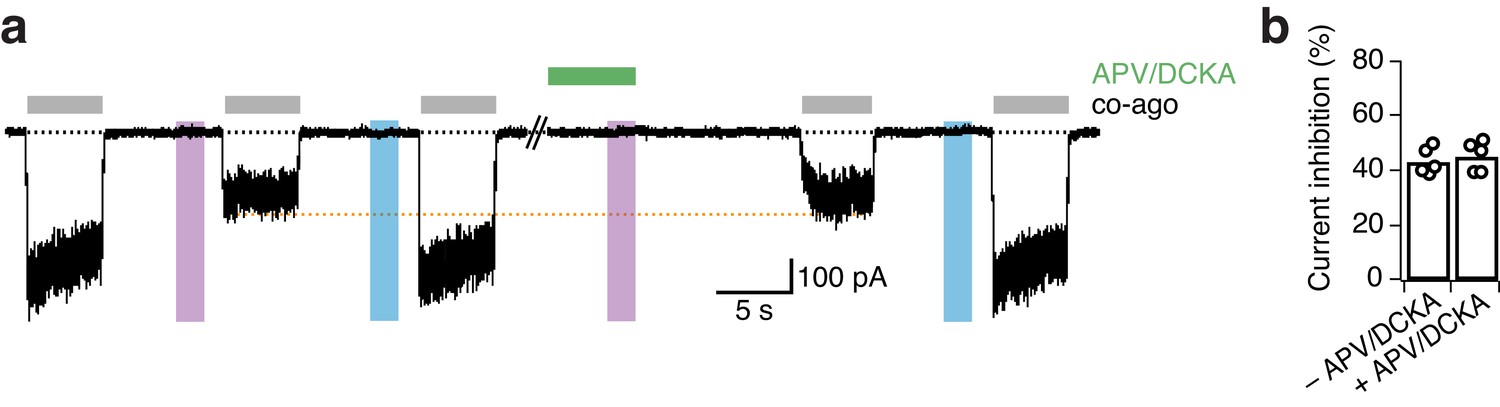
The presence of the competitive antagonists APV and DCKA does not impact the UV-mediated current inhibition for GluN1-P532PSAA/GluN2A mutant receptors.
(a) Representative trace showing the degree of inhibition of PSAA-mutant receptors in the absence (left part) and presence (right part) of APV (20 μM) and DCKA (5 μM) in the extracellular solution. The cell was exposed to the competitive antagonists for 6 s following their wash out for 10 s. The orange line indicates the lack of change in the extent of UV-driven photoinactivation. (b) The current inhibition degrees (in %) in a regular washing solution were 43.4 ± 2 (n = 5), and following antagonist application 45.3 ± 2.5 (n = 5; p=0.27). The degrees of inhibition were equal for the application of APV/DCKA on either the cis- or trans-isoform of the PSAA.
Figure 2—figure supplement 3
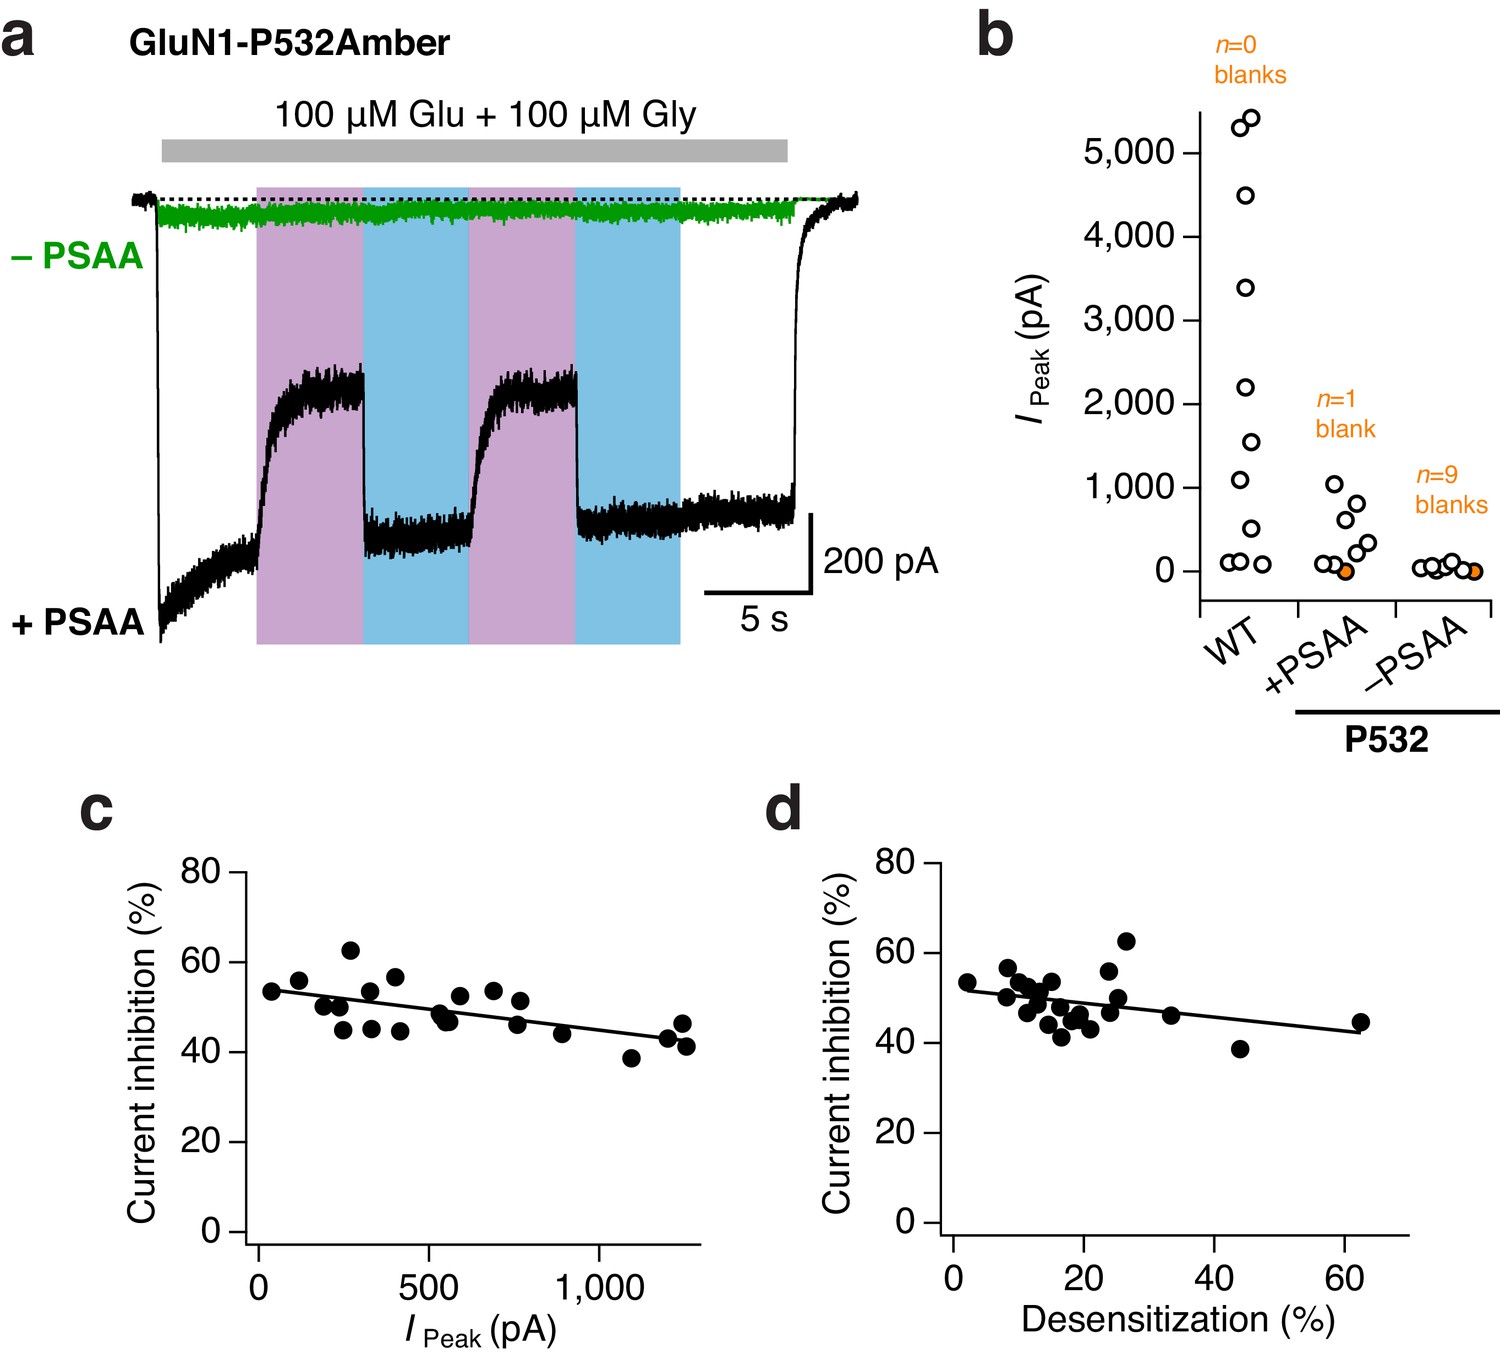
High efficiency of PSAA-incorporation at the GluN1-P532Amber site.
(a) Example traces from mutant GluN1/GluN2A receptors incubated either with (black trace) or without (green) PSAA in the culture medium. The unspecific readthrough of the Amber stop codon was minimal in the absence of PSAA. UV and blue light were equivalently applied during both experiments, but reversible photoinactivation was only seen for receptors incubated with the PSAA (here, 44% photoinhibition). (b) Pooled peak current amplitudes (in pA) for WT (24–48 hr post transfection) and Amber mutants (48 hr post transfection) incubated in the presence or absence of PSAA. On average, WT receptors gave currents amplitudes of 2200 ± 640 pA (n = 11). For PSAA-harboring receptors, seven cells gave co-agonist induced currents of 460 ± 110 pA, and one cell resulted in a blank recording. Amber mutant receptors lacking the PSAA had an average current amplitude of 50 ± 15 pA (n = 6), nine further cells did not express at all. Crucially, UV or blue light never modulated mutant receptor activity with unspecifically incorporated endogenous amino acids. In contrast, receptors site-specifically carrying the PSAA showed a clear UV-triggered photoinactivation (mean 45 ± 1.5%; n = 7). (c) The degree of photomodulation shows minimal dependence on peak current amplitude (in pA, measured immediately before the application of UV). A linear fit gave a correlation coefficient of R2 = 0.37 (n = 23). (d) Similarly, the degree of photomodulation is minimally affected by the extent of current desensitization (in %; compared to the absolute peak current). The correlation coefficient is R2 = 0.13 (n = 23).
Figure 2—figure supplement 4
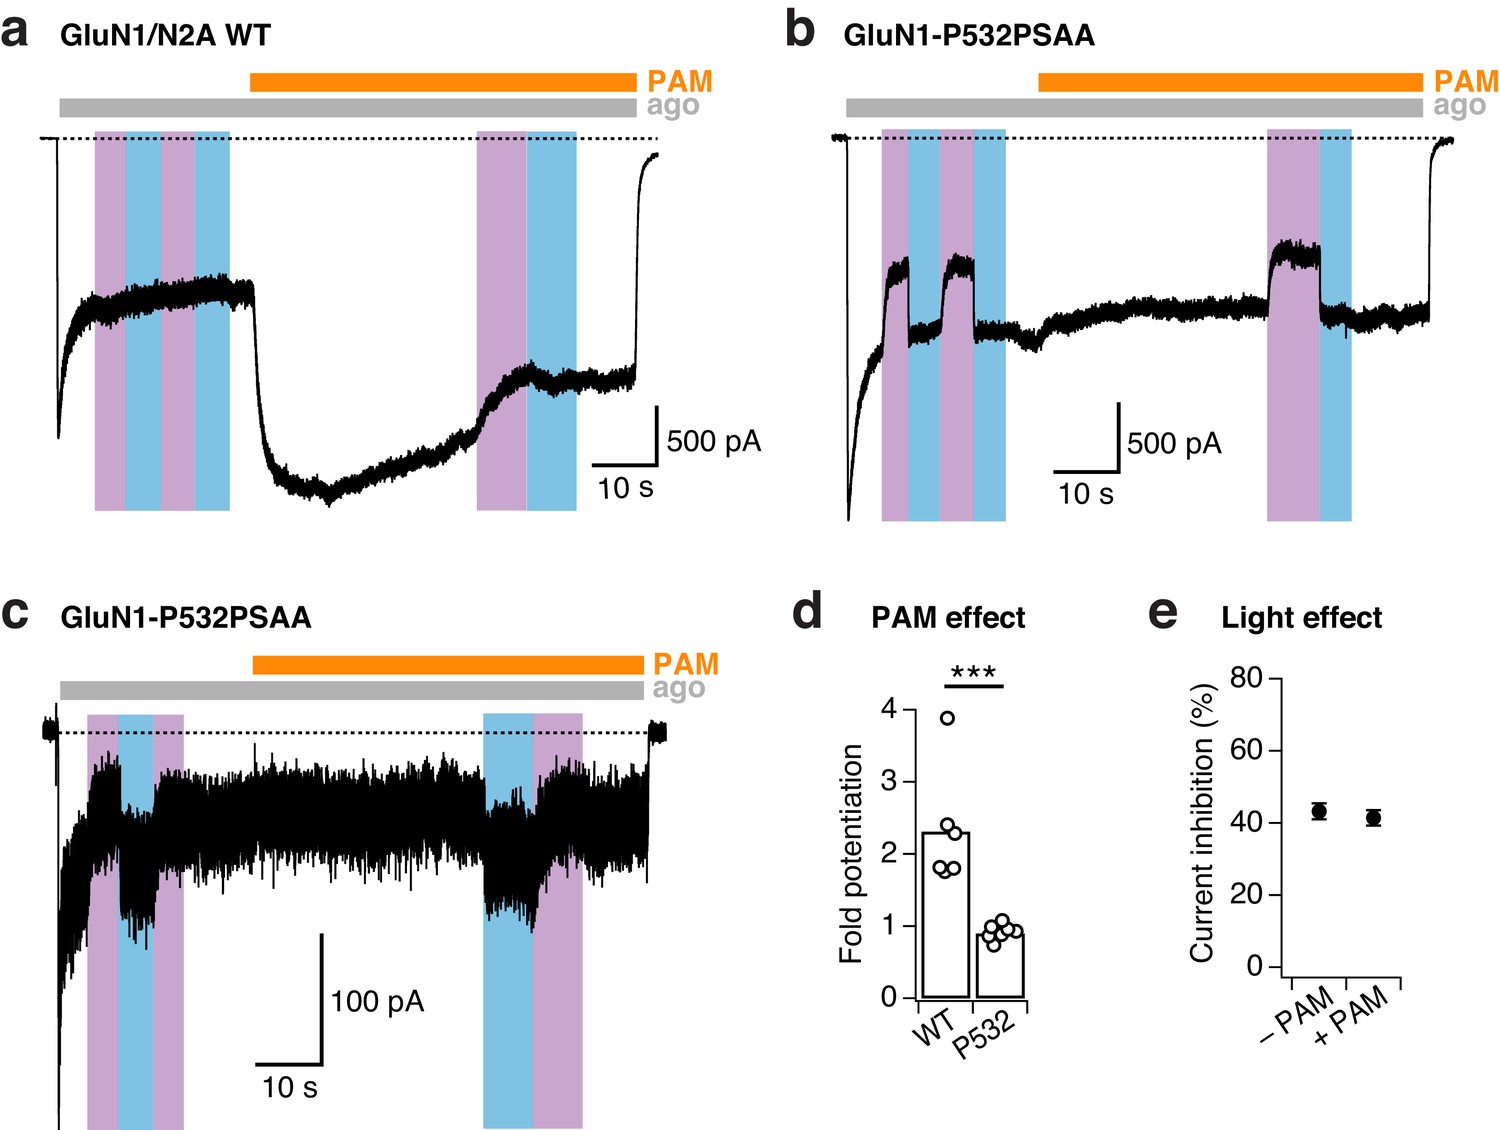
PSAA incorporation at the GluN1-P532 Amber site disrupts PAM action.
(a) Example trace demonstrating the strong potentiating effect of the positive allosteric modulator (PAM) GNE-6901 (30 µM) on WT GluN1/GluN2A receptors (here, 2.3-fold potentiation) that were alternatively exposed to UV or blue light. (b) As in a, for GluN1-P532PSAA/GluN2A receptors. In contrast to WT receptors, PAM does not potentiate mutant receptors with the PSAA switched into the trans-state. Moreover, the degree of photoinhibition is comparable in the absence and presence of PAM (37% vs. 32%, respectively). (c) As in b, for mutant receptors with the PSAA switched into the cis-state. Again, PAM has no potentiating effect and did not prevent UV photoinhibition (43% photoinhibition prior PAM application, 39% during the perfusion with PAM). (d) Mean fold-potentiation by PAM. Values are 2.3 ± 0.3 (n = 6) for WT receptors and 0.9 ± 0.04 (n = 7) for PSAA mutant receptors (***p<0.001). For mutant receptors, cells were pooled regardless of the photoisomeric state of PSAA before applying PAM (trans as in panel b, cis as in panel c). (e) Mean current photoinhibition degrees (in %) for the PSAA mutant. In the absence of PAM, the current was inhibited by 43.2 ± 2% (n = 7) by UV. In the presence of PAM, the extent of UV photoinactivation was similar with 41.5 ± 2% (n = 7, p=0.31). Again, for mutant receptors, cells were pooled regardless of the photoisomeric state of PSAA before applying PAM (trans as in panel b, cis as in panel c).
Figure 3 with 3 supplements
Photomodulation properties of GluN1-P532PSAA/GluN2A receptors.
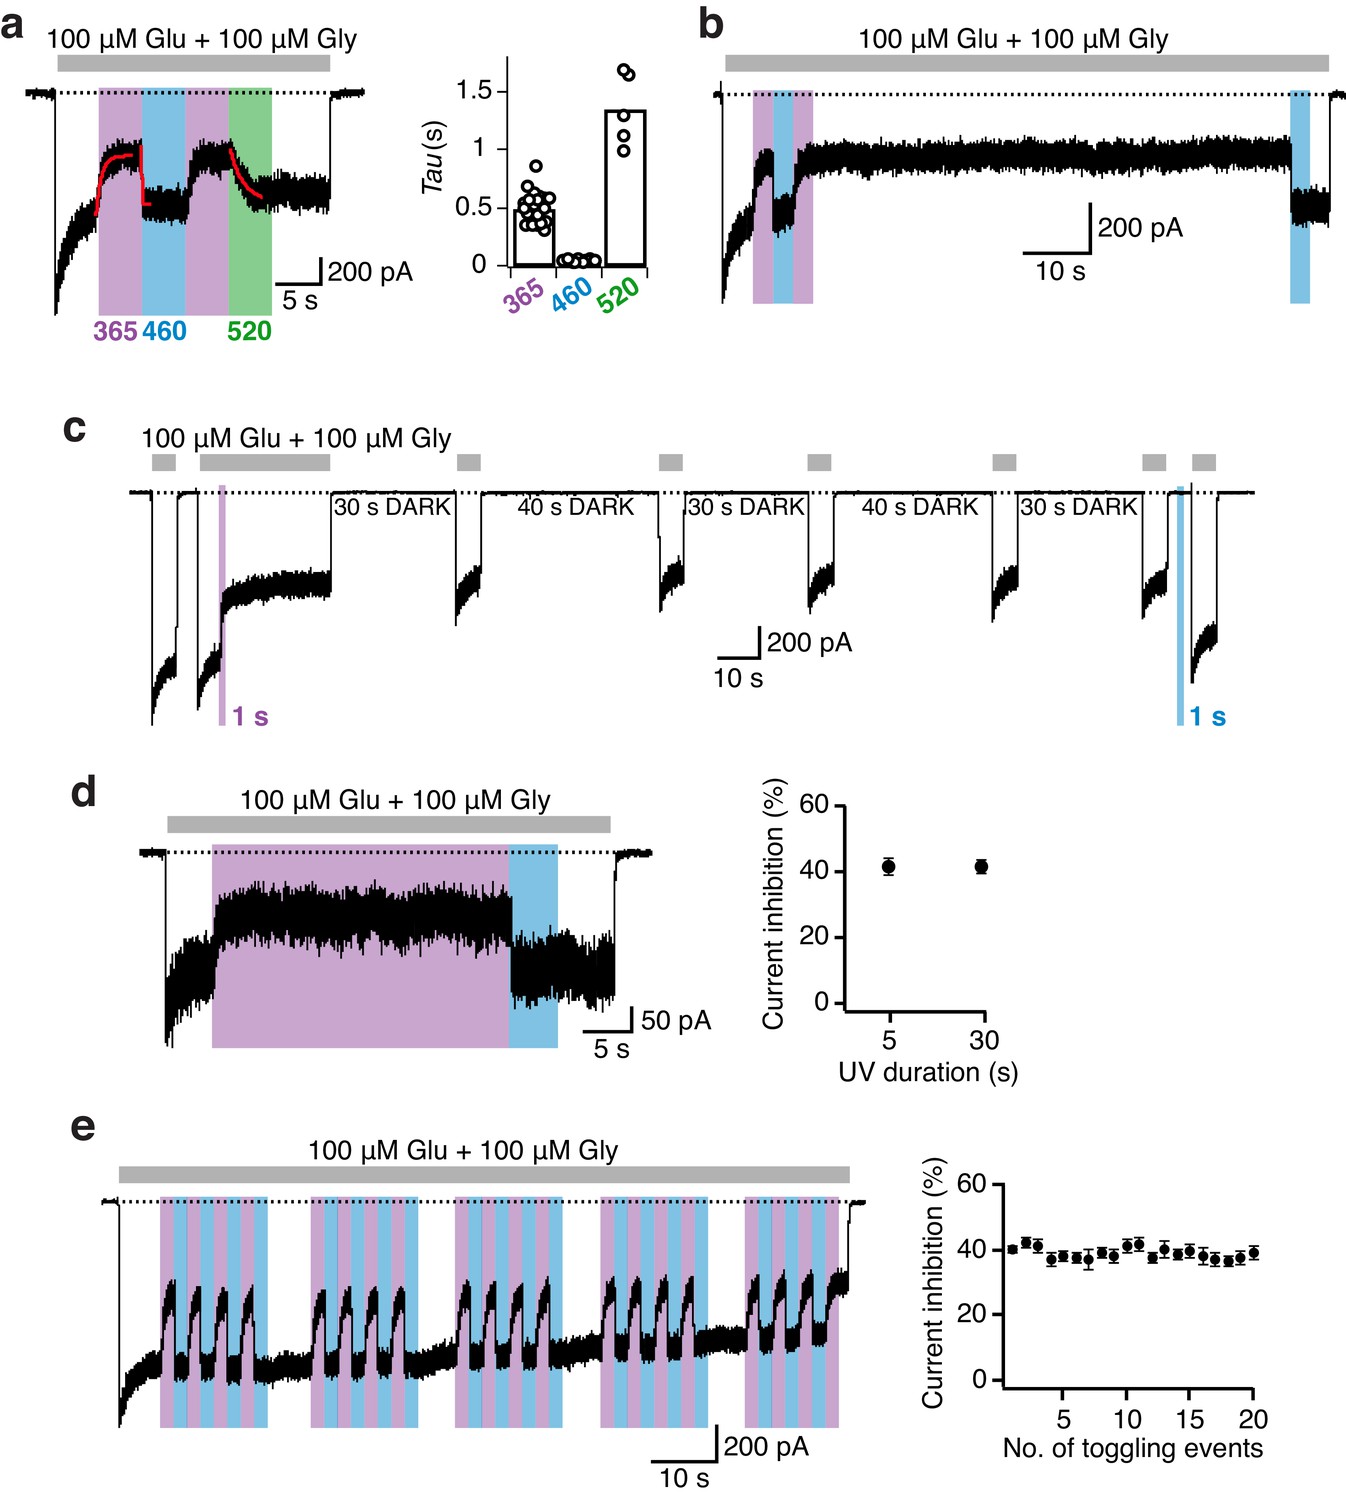
(a) Kinetics of photoinhibition and its recovery. Photoinactivation following UV (5 s) was slower (τ = 520 ms) compared to the re-activation induced by blue light (τ = 35 ms), as obtained by monoexponential fits. Much slower re-activation kinetics (τ = 1300 ms) and an intermediate state of recovery are observed upon green light exposure (left panel). The average exponential time constants for the different wavelengths of light (5 s each) are (in ms): τ365nm = 500 ± 30 (n = 23), τ460nm = 45 ± 1 (n = 23), τ520nm = 1350 ± 140 (n = 5) (right panel). (b) Representative current trace demonstrating the persistence of photoinhibition following a brief (3 s) UV illumination. (c) The cis-isoform, induced by UV (1 s), inhibited 40% of the current and was stable over minutes. Further co-agonist activation, interrupted by periods in the dark, did not affect the degree of the photoinhibition. A short pulse of blue light (1 s) allowed full recovery to the initial current amplitude. (d) Stability of the photoresponse during prolonged UV exposures (30 s), as shown in the example trace (left). The mean current inhibition degrees (in %) following 5 and 30 s of UV are: Inh5s = 42 ± 3, Inh30s = 41 ± 2 (n = 3; right panel). (e) Example trace demonstrating the stability of the photoresponse over 20 PSAA cis-trans toggling events. The degree of receptor modulation remained stable throughout the recording (left panel). On average, the first UV pulse gave a current reduction of 40 ± 1%. The averaged extent of UV inhibition following 20 toggling events was 39 ± 2% (n = 6; right).
Figure 3—figure supplement 1
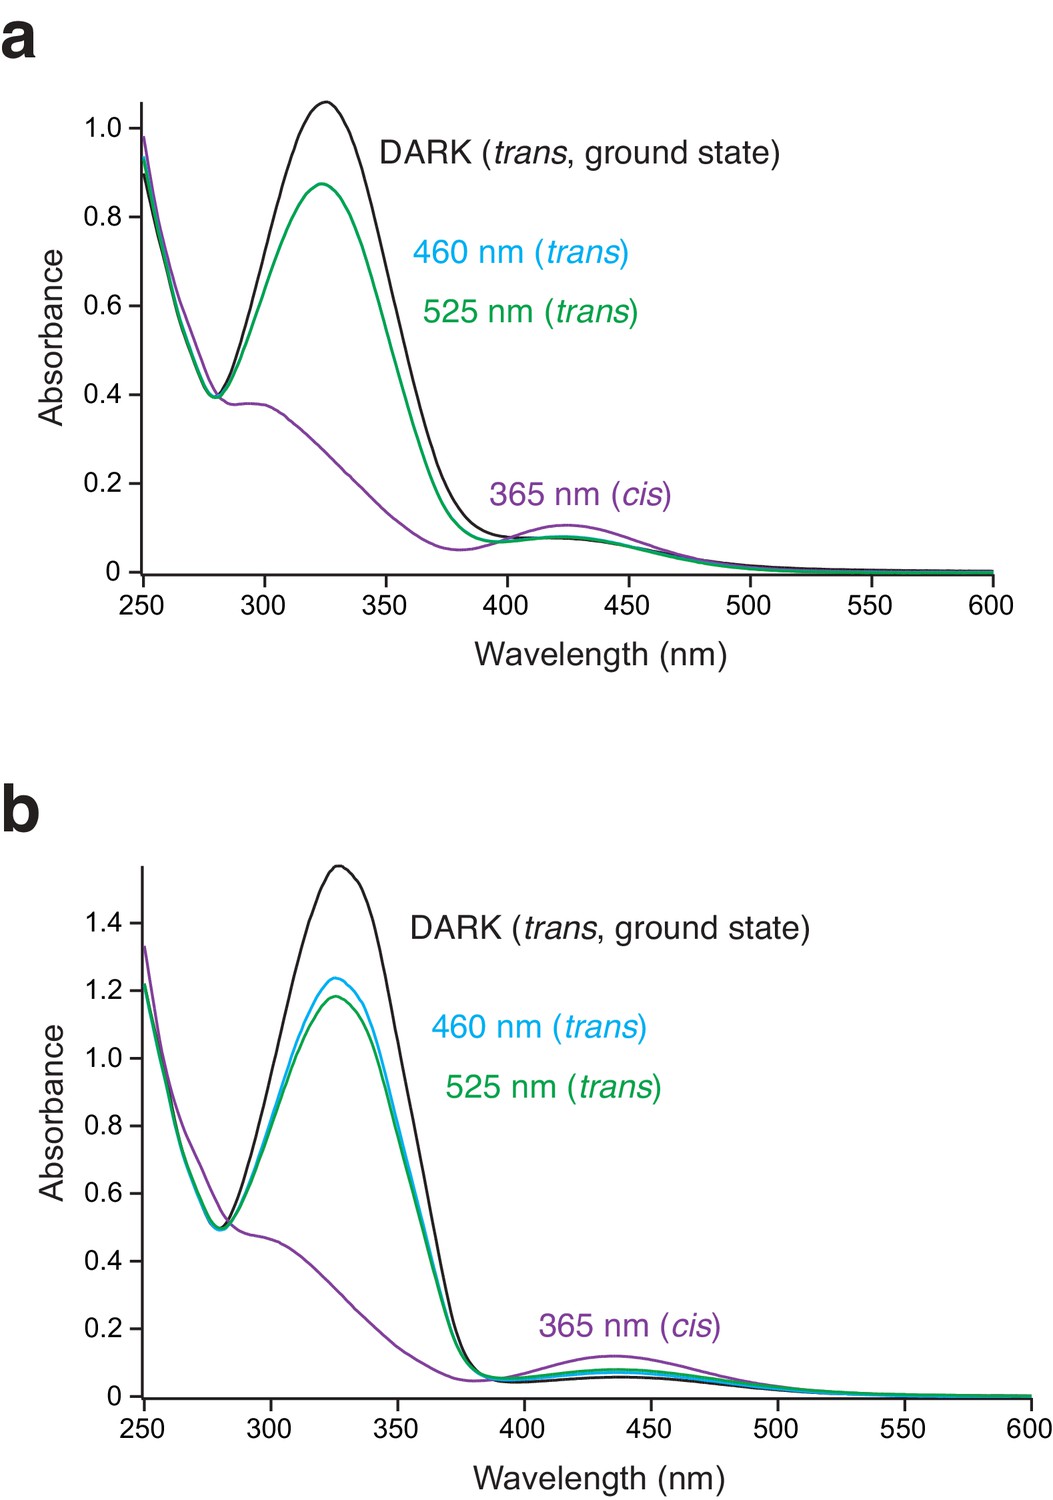
: The UV/Vis spectra of the different PSAA photoisomers.
(a) UV/Vis spectrum recorded in the extracellular (Ringer) solution after 5 min of illumination at 365, 460, or 525 nm. No difference in the spectra after irradiating at 460 and 525 nm was observed (here, the 460 and 525 nm spectra are superimposed). Typically, two absorbance peaks were observed representing π-π* and n-π* transitions. Upon trans-to-cis isomerization the π-π* absorption decreased, while the n-π* absorption increased. (b) As in a, but recorded in isopropanol after 5 min of illumination at 365, 460, or 525 nm. Here, irradiating at 525 nm gave a higher cis/trans ratio (69%) compared to irradiation at 460 nm (74%).
Figure 3—figure supplement 2
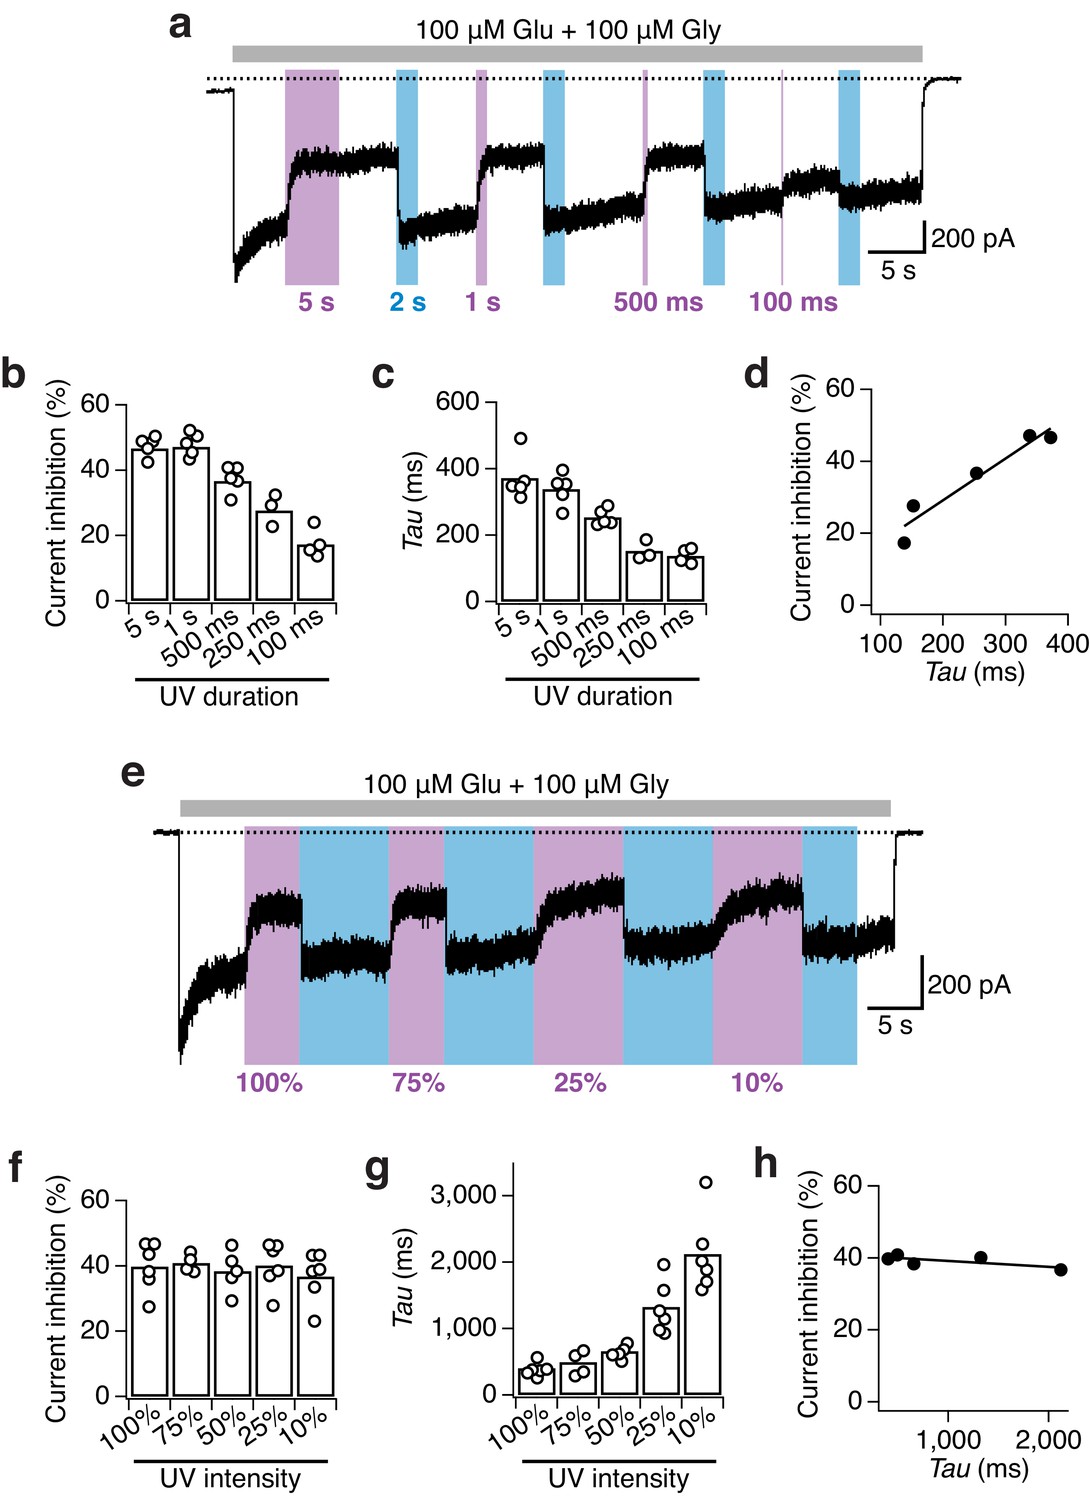
Impact of UV duration and intensity on the photomodulation properties of GluN1-P532PSAA/GluN2A receptors.
(a) Example current trace of the dependence of receptor photoinactivation on the UV duration. Different lengths of UV pulses between 100 ms and 5 s at full power were given. (b) The current inhibition degrees (in %) following illumination with different UV durations are: Inh5s = 47 ± 1 (n = 5), Inh1s = 47 ± 2 (n = 5), Inh500ms = 37 ± 2 (n = 5), Inh250ms = 28 ± 3 (n = 3), Inh100ms= 17 ± 2 (n = 4). At least 1 s of UV light is required to induce the maximal inhibitory effect. (c) Photoinhibition kinetics. The mean exponential time constants for the different UV durations used are: τ5s = 370 ± 30 (n = 5), τ1s = 340 ± 20 (n = 5), τ500ms = 250 ± 10 (n = 5), τ250ms = 150 ± 20 (n = 3), τ100ms = 140 ± 10 (n = 4). (d) The photoinhibition (in %) is correlated to the inactivation time constants (in ms) obtained using different lengths of UV pulses (R2 = 0.92). (e) Example current trace demonstrating the dependence of the photoinactivation on the UV light intensities. (f) The intensity of the UV-LED did not impact the degree of current inhibition. The mean inhibition extents (in %) are: Inh100% = 40 ± 3 (n = 6), Inh75% = 40 ± 1 (n = 4), Inh50% = 38 ± 3 (n = 5), Inh25% = 40 ± 3 (n = 6), Inh10% = 37 ± 3 (n = 6). (g) In contrast, the UV-LED intensity strongly impacted the inactivation kinetics. Mean values of exponential time constants are (in ms): τ100% = 400 ± 40 (n = 6), τ75% = 490 ± 90 (n = 4), τ50% = 660 ± 40 (n = 5), τ25% = 1300 ± 160 (n = 6), τ10% = 2100 ± 240 (n = 6). (h) The current inhibition (in %) shows no correlation to the photoinactivation time constants for the different intensities of UV used (R2 = 0.52).
Figure 3—figure supplement 3
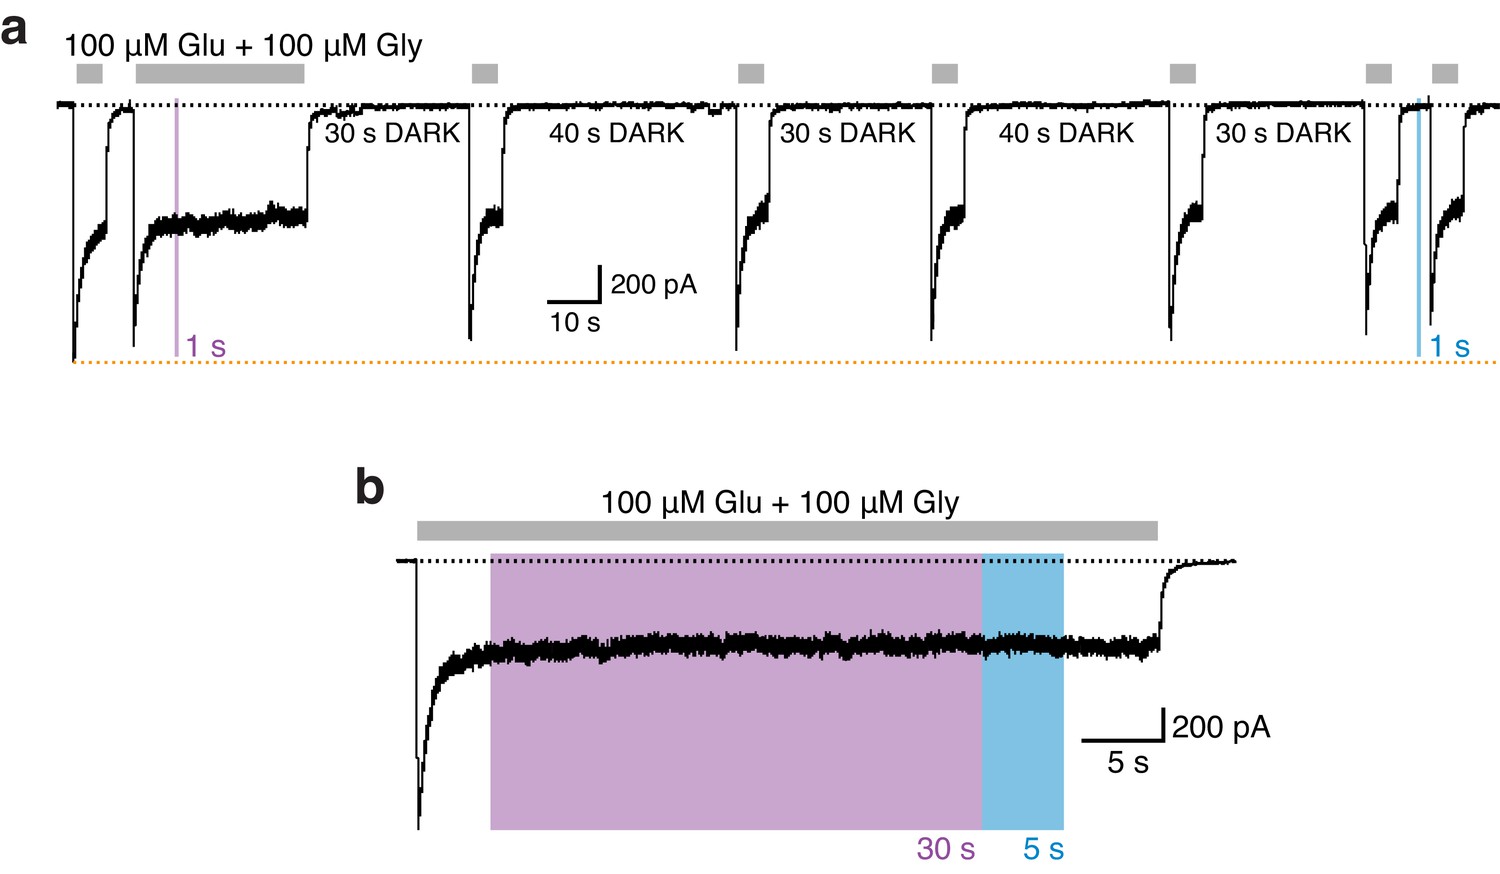
Absence of photoresponses in GluN1/GluN2A WT receptors.
(a) Example current trace showing that a short pulse (1 s) of UV or blue light does not affect the activity of WT receptors. Overall, the current amplitude remained stable over minutes. The orange line indicates the minor peak current run down during the long-lasting recording. (b) Equally, long exposures of UV (30 s) did not modulate WT receptor activity.
Figure 4 with 1 supplement
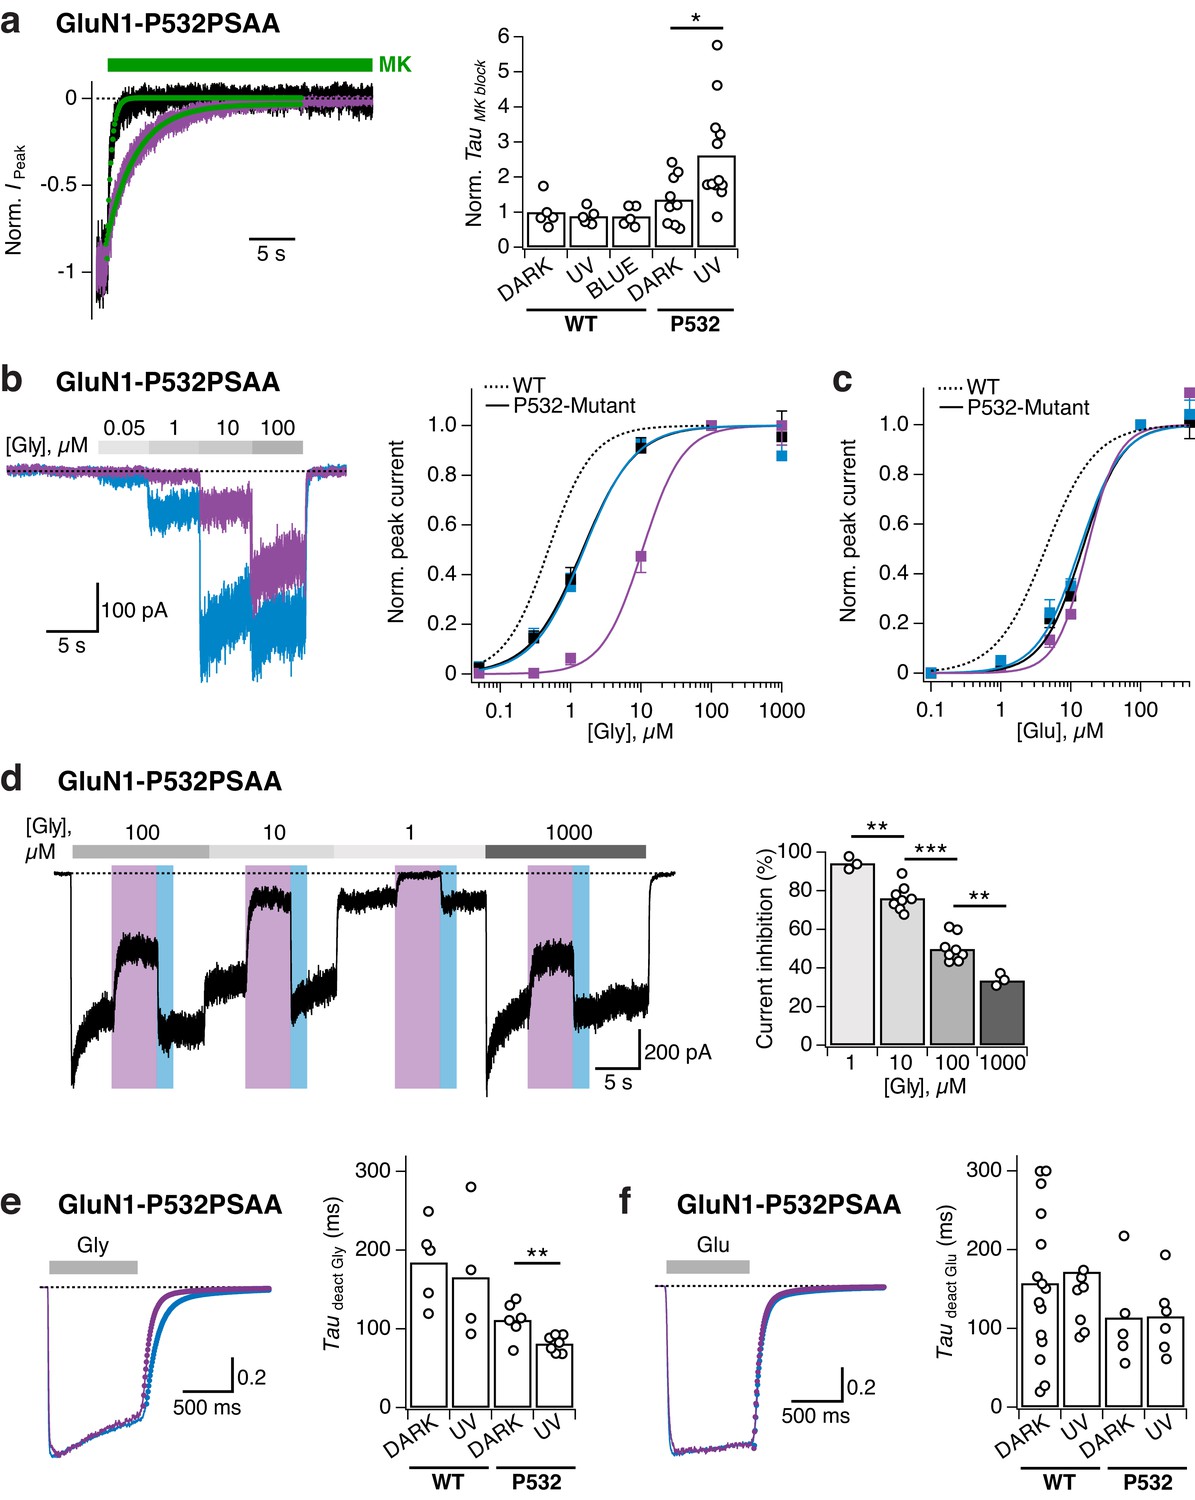
Reversible photomodulation of channel activity and glycine sensitivity of GluN1-P532PSAA/GluN2A receptors.
(a) Normalized example current traces demonstrating the distinct MK-801 inhibition kinetics in the dark and UV-state (τDARK = 470 ms, τUV = 3200 ms; left panel). Pooled values (right panel) under various light conditions for WT and PSAA-mutant receptors (*p=0.016). (b) Glycine dose-response traces under UV or blue illumination (left panel). Glycine DRCs (right panel) for WT (dashed line) and PSAA-mutant (full lines) in the dark (black line) or under UV or blue light. EC50 values are (in μM): EC50,DARK = 0.5 (n = 5 for each point) for WT and EC50,DARK = 1.5 (n = 3–12), EC50,BLUE = 1.5 (n = 3–8), EC50,UV = 10.5 (n = 3–7) for PSAA-mutant receptors. (c) As in b, sensitivity to glutamate. EC50 values are: EC50,DARK = 4.4 (n = 8–9) for WT and EC50,DARK = 14.6 (n = 4–11), EC50,BLUE = 13.3 (n = 3–8), EC50,UV = 17.1 (n = 3–8) for PSAA-mutants. (d) Representative current trace demonstrating the photomodulation properties under various glycine concentrations (1, 10, 100 or 1000 μM). The mean photoinhibition degrees are (in %, right panel): Inh1 = 94.3 ± 2 (n = 3), Inh10 = 76.1 ± 2 (n = 8), Inh100 = 49.9 ± 2.5 (n = 8), Inh1000 = 33.5 ± 2 (n = 3; ***p<0.001; **p<0.01). (e) Glycine deactivation kinetics. Example trace showing glycine dissociation under UV or blue light (τdeact,UV = 75.4 ms, τdeact,BLUE = 131.3 ms; left panel). The mean weighted deactivation time constants are (in ms; right panel): τdeact,DARK = 184 ± 16 (n = 5) and τdeact,UV = 166 ± 30 (n = 4; p=0.69) for WT, and τdeact,DARK = 111 ± 9 (n = 6) and τdeact,UV = 81 ± 4% (n = 7; **p<0.01) for PSAA-mutants. (f) As in e, for glutamate (τdeact,UV = 77.7 ms, τdeact,BLUE = 79.2 ms). The deactivation time constants are (in ms): τdeact,DARK = 157 ± 25 (n = 15) and τdeact,UV = 172 ± 30 (n = 8; p=0.92) for WT and τdeact,DARK = 113 ± 36 (n = 5) and τdeact,UV = 115 ± 21% (n = 6; p=0.97) for PSAA-mutants.
Figure 4—figure supplement 1
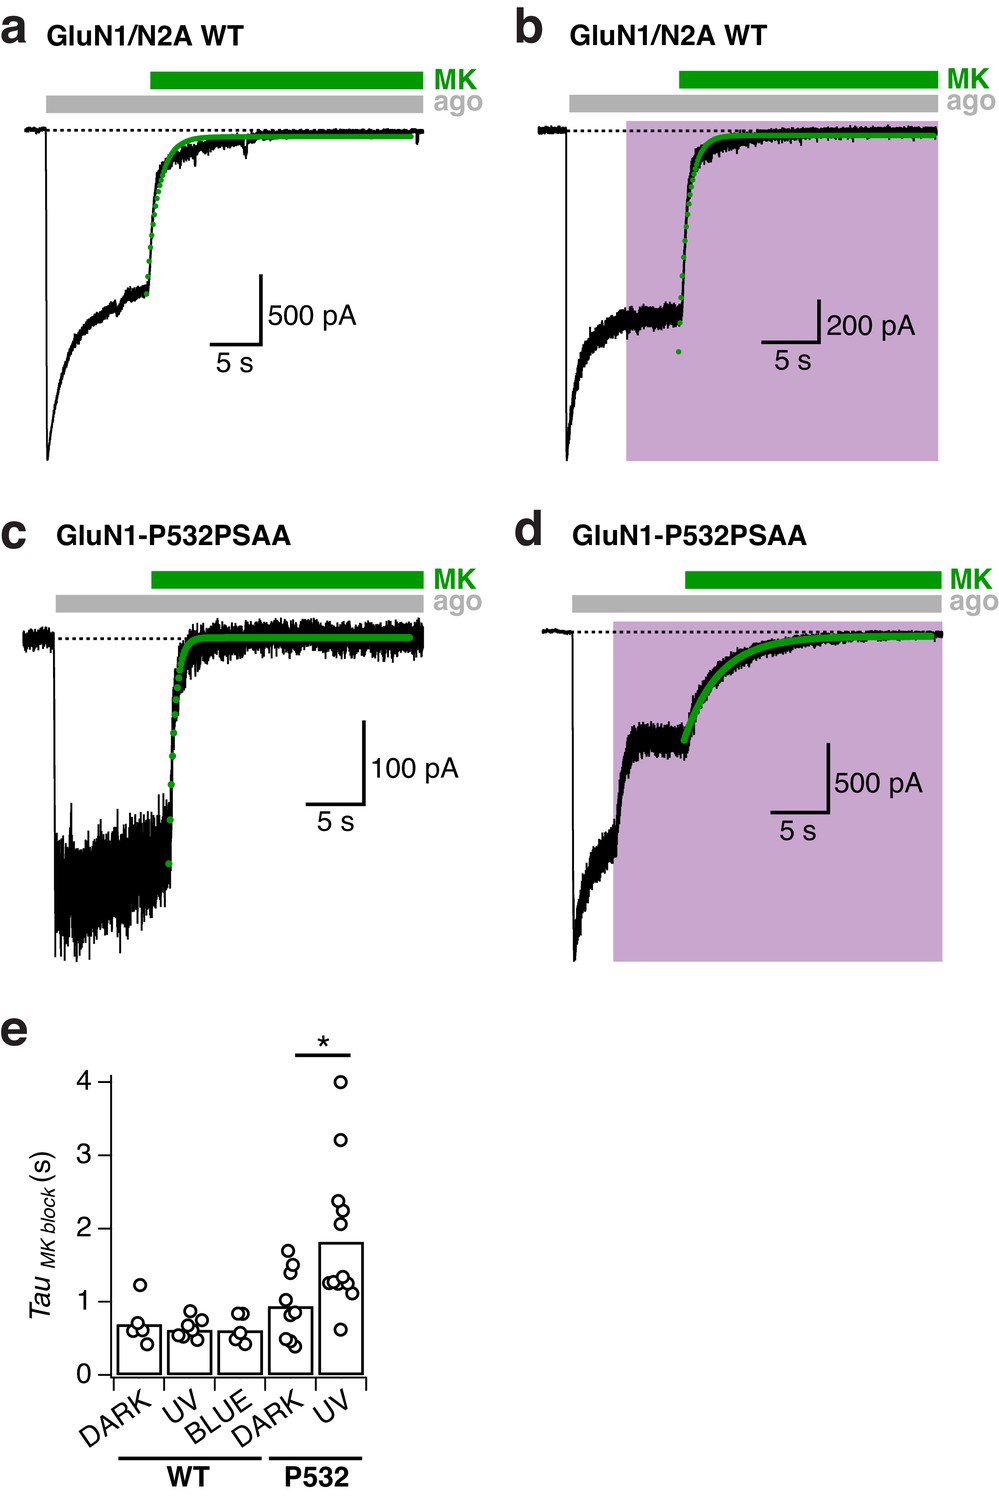
MK-801 inhibition kinetics for GluN1-P532PSAA/GluN2A mutant receptors.
(a) Representative current trace showing the inhibition of WT GluN1/GluN2A receptors by 1 µM MK-801 in the dark. In this example, the receptor activity was inhibited with an exponential time constant of τ = 600 ms (green line, mono-exponential fit). (b) As in a, under UV light(τ = 700 ms). (c) Inhibition by MK-801 of GluN1-P532PSAA/GluN2A receptors in the dark (τ = 470 ms). (d) As in c, under UV light (τ = 3200 ms). (e) Summary of the single-exponential time constants of MK-801 inhibition under different light conditions (normalized values are shown in Main Figure 4a). For WT, the inhibition half-times are (absolute values, in ms): τDARK = 690 ± 140 (n = 5), τUV=620±50 (n = 7), τBLUE=610±90 (n = 5). For the P532PSAA mutant, the values are: τDARK=940±160 (n = 9), τUV=1820±290 (n = 12; *p=0.016).
Figure 5
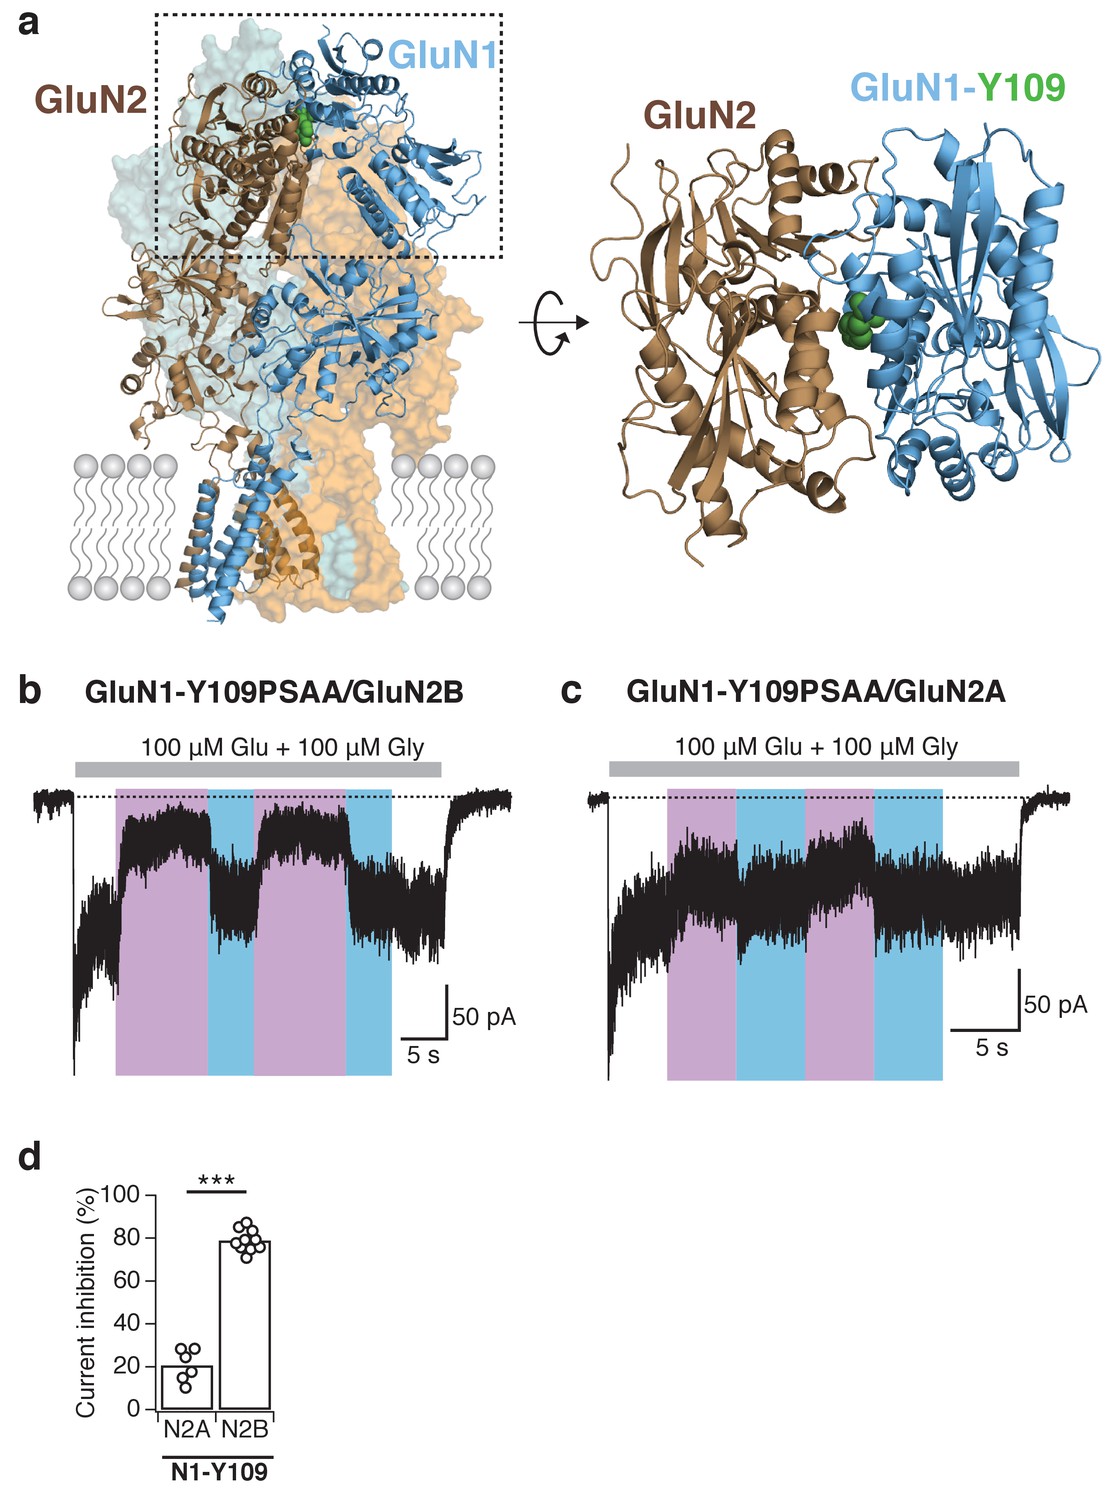
Reversible and subunit-specific photocontrol of GluN1-Y109PSAA/GluN2A receptors.
(a) Structure of a heteromeric GluN1/GluN2B receptor (left panel) with PSAA inserted at the Amber mutation site GluN1-Y109 (green spheres) at the NTD heterodimer interface. The top view of one ABD dimer highlights the location of the PSAA insertion (right panel). (b) Representative current trace of GluN1-Y109PSAA/GluN2B receptors. In this example, the reduction of activity upon UV was 78%. (c) As in b, but for GluN1Y109PSAA/GluN2A receptors. Here, the UV-mediated photomodulation was only 28%. (d) Summary of peak current inhibition degrees upon exposure to UV for the GluN1-Y109PSAA mutant co-expressed with either GluN2A or GluN2B. On average, the photoinactivation (in %) is: InhGluN2B = 79 ± 2 (n = 10), InhGluN2A = 21 ± 3 (n = 6), ***p<0.001.
Figure 6 with 2 supplements
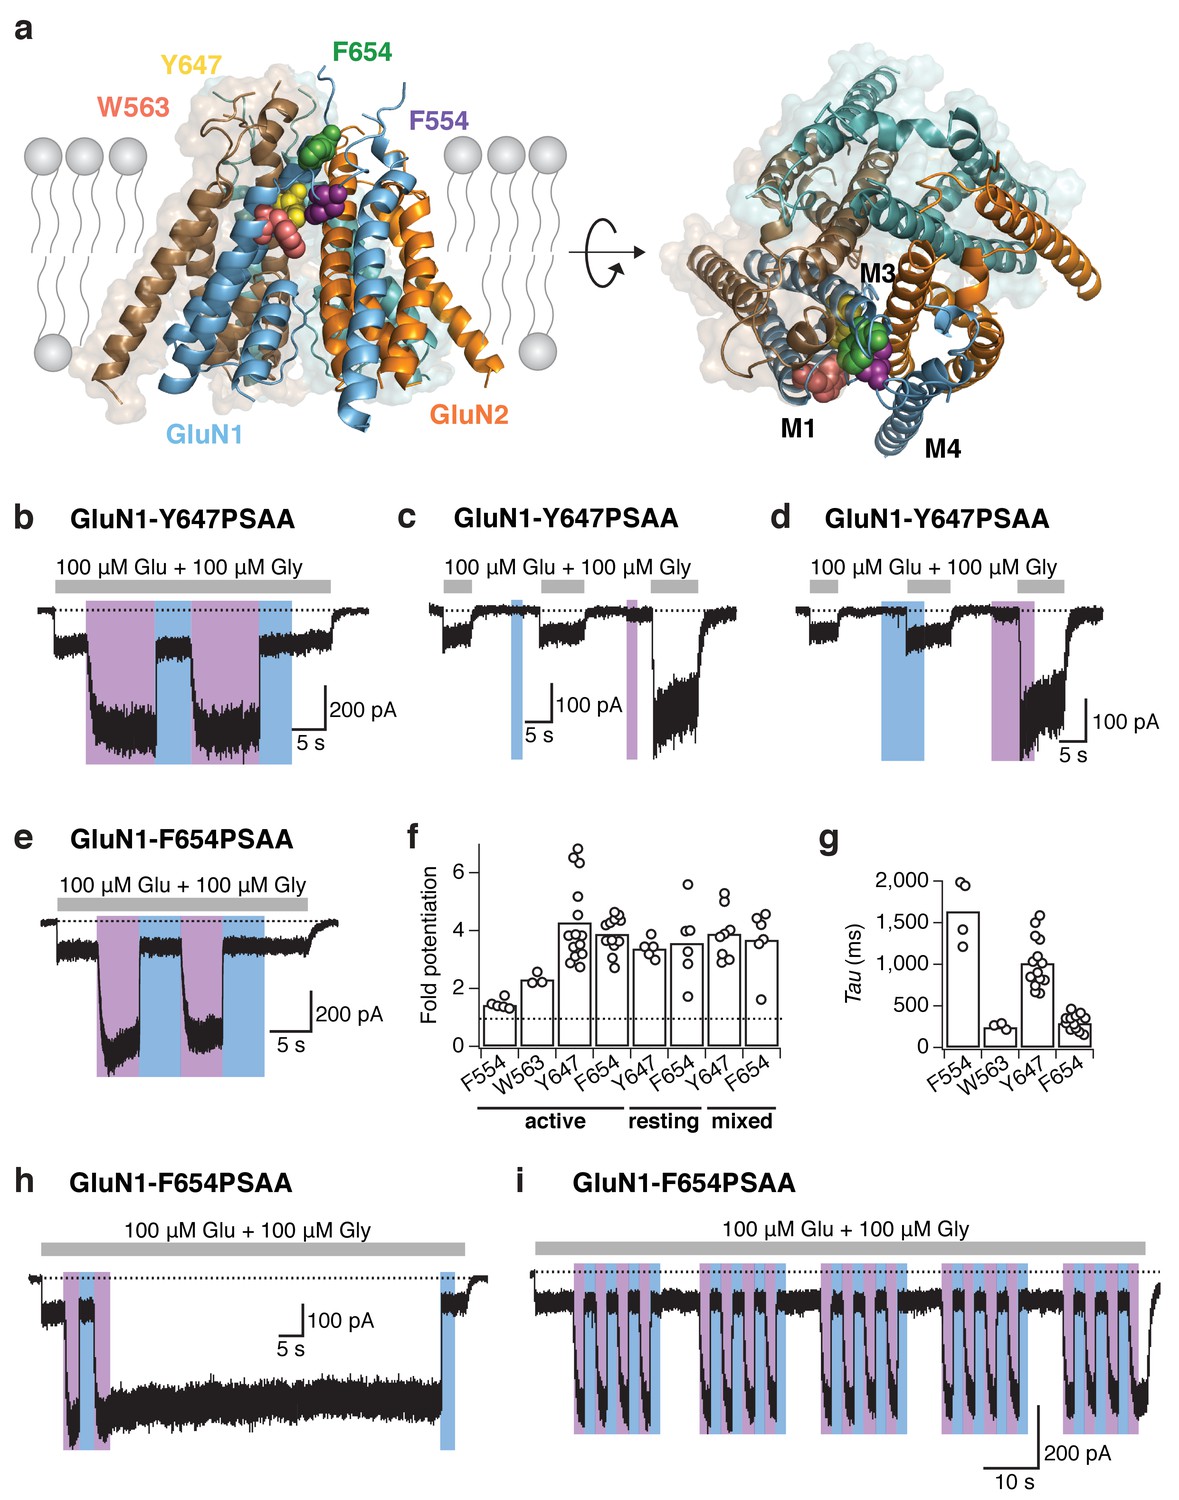
Reversible NMDAR photopotentiation with PSAA at various pore sites.
(a) Structure of the GluN1/GluN2 TMD represented by a side (left panel) and top view (right panel). The four sites of the hydrophobic cluster, where PSAA was incorporated, are illustrated as spheres in different colors. (b) Example recording for GluN1-647PSAA/GluN2A mutants. UV illumination in the presence of the co-agonists resulted in a 3.4-fold potentiation of receptor activity. (c) Same cell as in b, with light applied in the resting state. Here, the UV-driven potentiation was 3.9-fold. (d) Same cell as in b, with light applied in the ‘mixed’ states. In this example, the current increased by 5-fold. (e) As is b, for the GluN1-654PSAA/GluN2A mutant. Here, UV light induced a 4.6-fold potentiation. (f) The fold-potentiation of activity differed between the mutants, but not between their functional states. On average, the photopotentiation in the active state is: PotF554 = 1.4 ± 0.1 (n = 5), PotW563 = 2.3 ± 0.1 (n = 3), PotY647 = 4.3 ± 0.4 (n = 14), PotF654 = 3.9 ± 0.2 (n = 12). UV in the resting state resulted in PotY647 = 3.4 ± 0.2 (n = 5) and PotF654 = 3.6 ± 0.5 (n = 6); and in the ‘mixed’ state in PotY647 = 3.9 ± 0.3 (n = 8) and PotF654 = 3.7 ± 0.5 (n = 6). The dashed line indicates a potentiation of 1 (i.e. no potentiation). (g) Kinetics of photopotentiation. The mean photopotentiation exponential time constants are (in ms): τF554= 1640±170 (n = 4), τW563 = 240 ± 20 (n = 3), τY647 = 1020 ± 80 (n = 14), τF654 = 290 ± 30 (n = 8). (h) Example trace showing that the UV-induced potentiation, once initiated, is highly stable even after UV light has been turned off (here, for 70 s). (i) Example trace demonstrating the stability of the photoresponse over numerous trans-cis illumination cycling events.
Figure 6—figure supplement 1
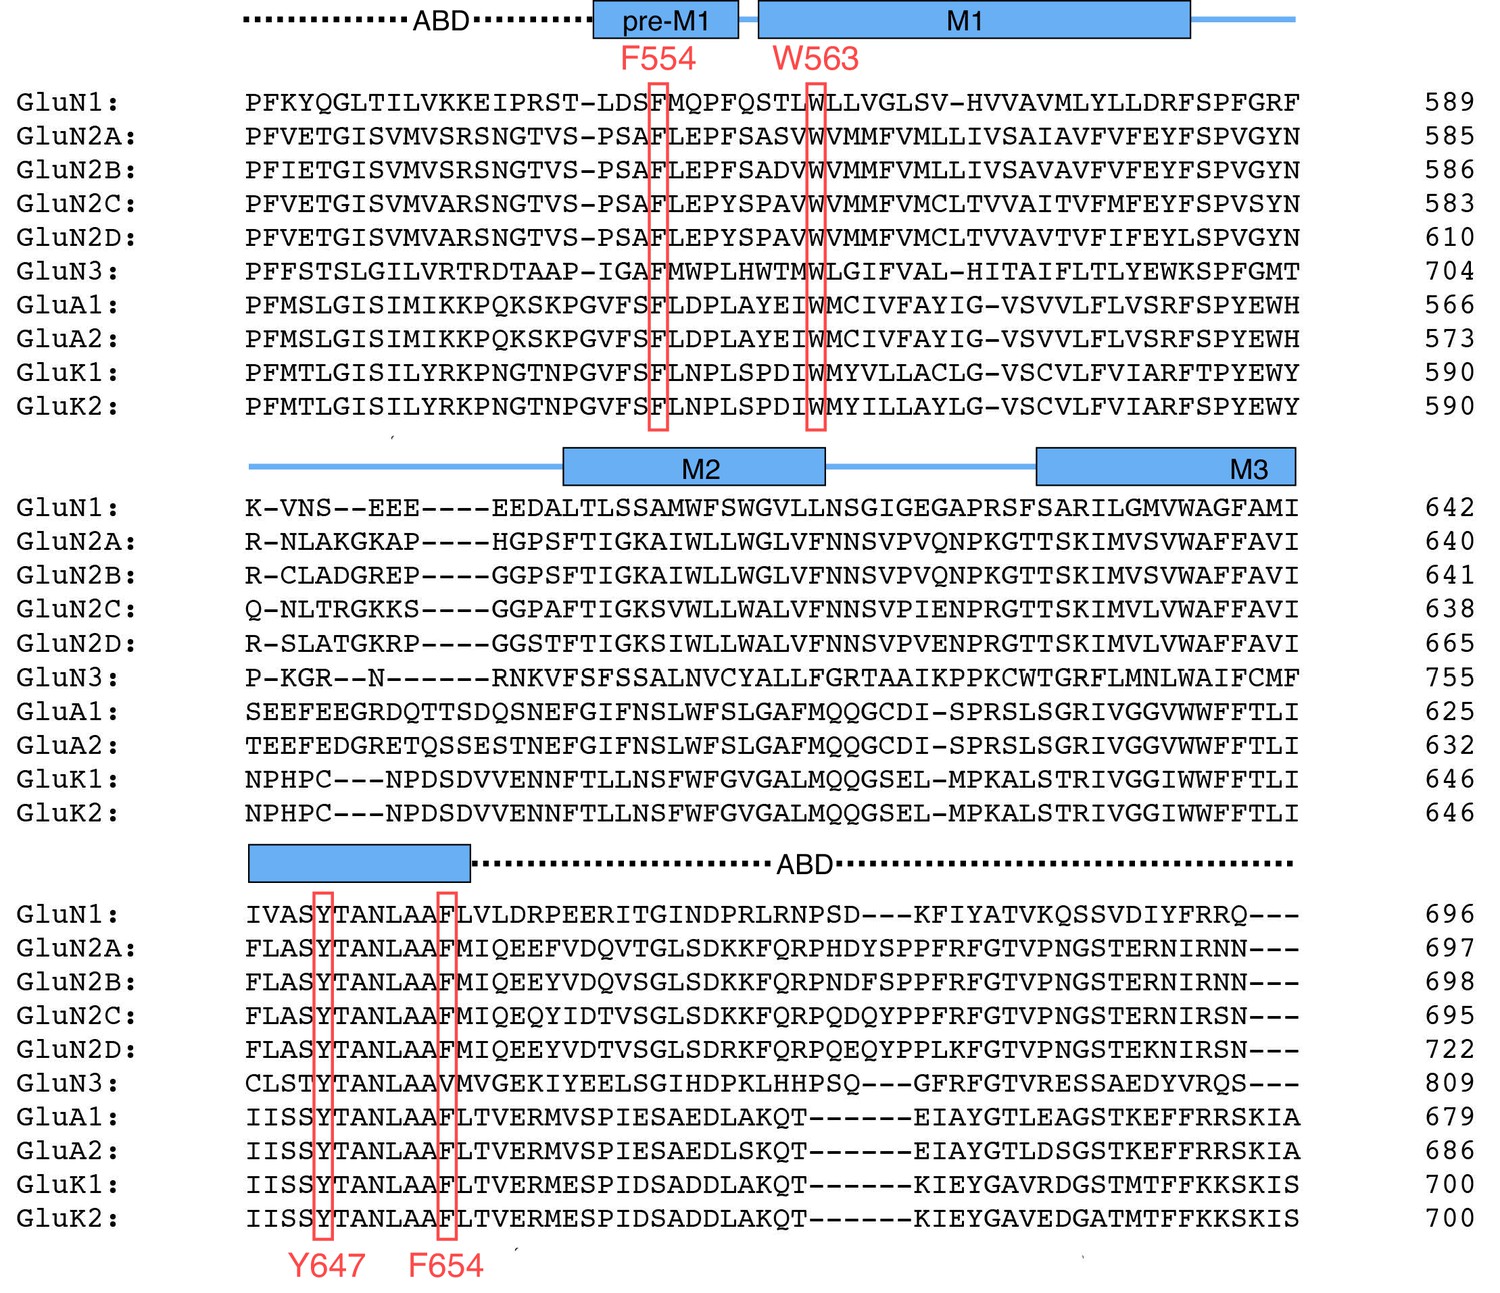
Multiple sequence alignment in the TMD region across multiple iGluR family subunits (NMDA, AMPA, and kainate receptor subunits).
A section of the entire sequence around the TMD is shown. The TMD is shown in blue, the helices pre-M1 and M1 to M3 are highlighted as blue boxes. The four highly conserved GluN1 positions of the TMD hydrophobic cluster that were tested in this study are highlighted in red. All subunits are from rat.
Figure 6—figure supplement 2
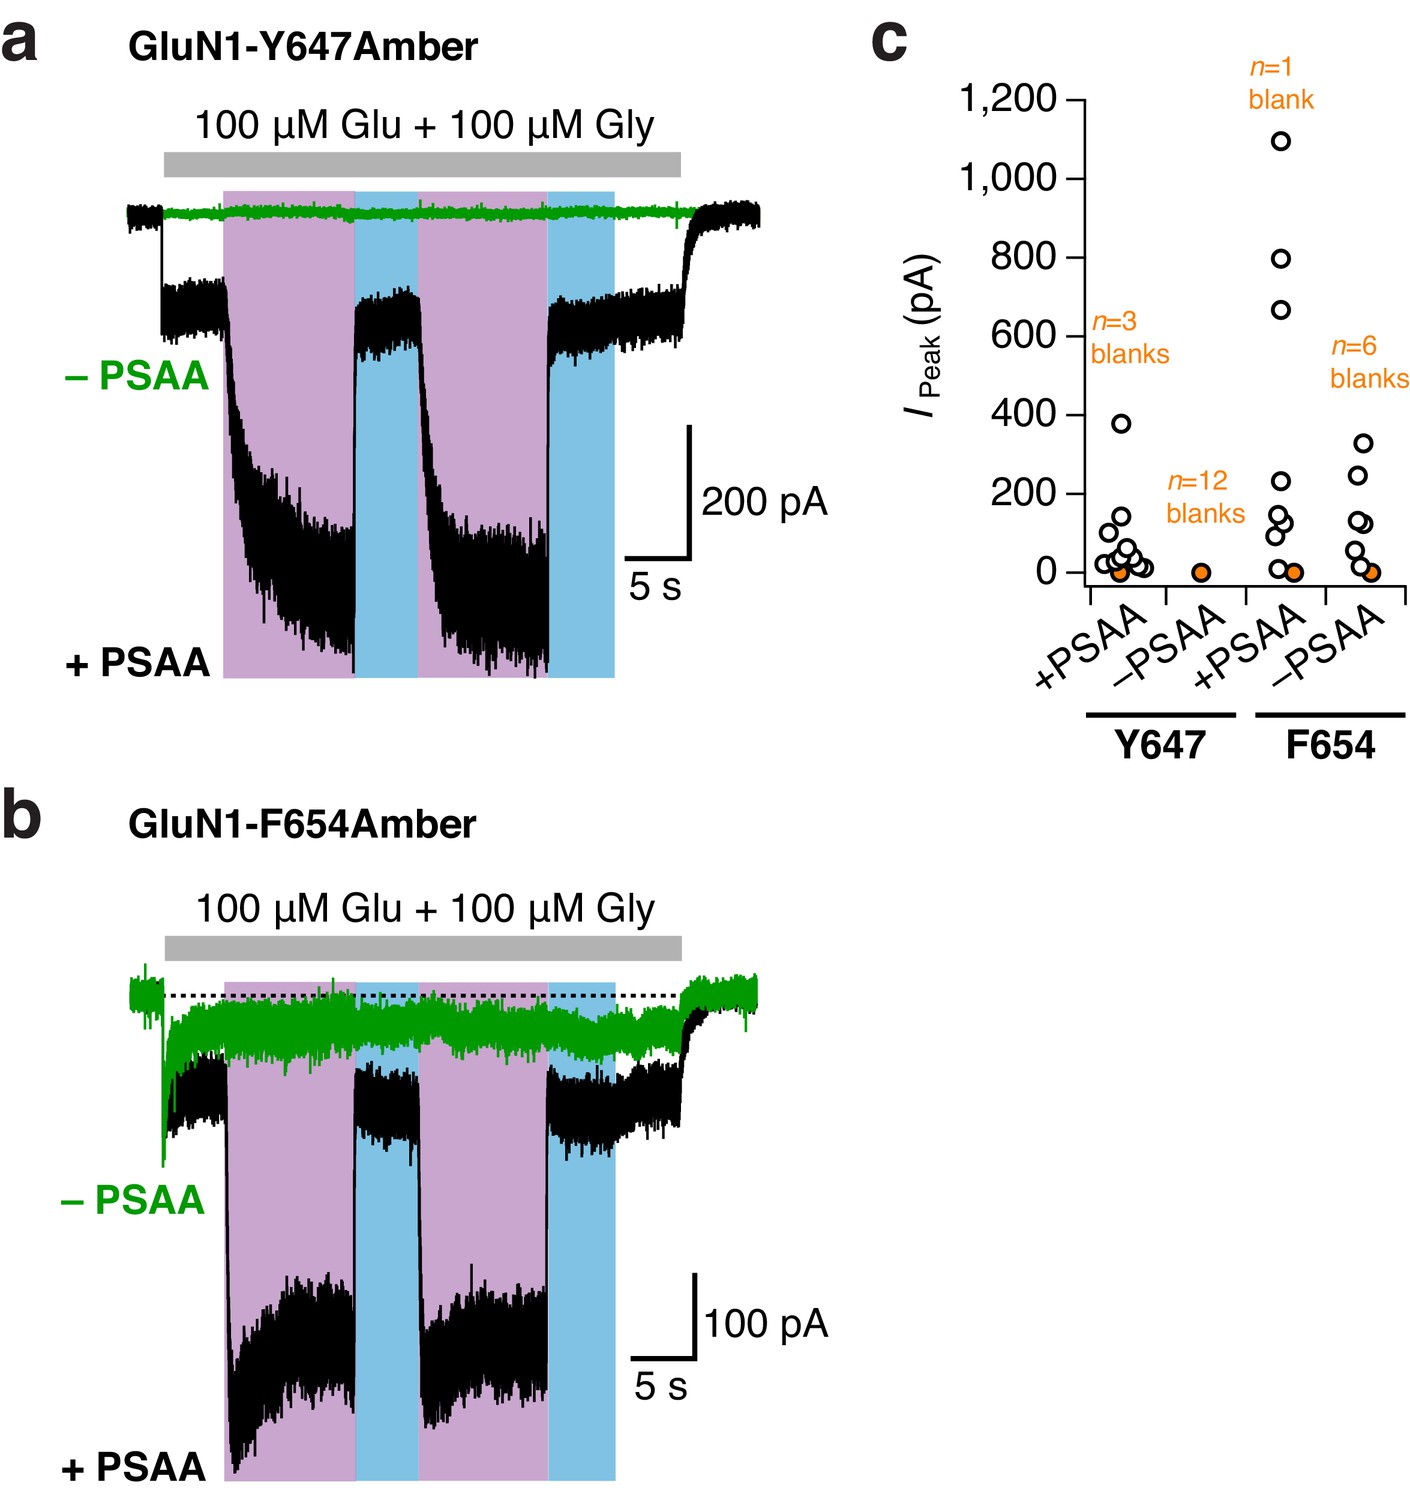
No or minor unspecific Amber codon suppression at TMD sites.
(a) Example traces from GluN1-Y647Amber/GluN2A receptors incubated either with (black trace) or without (green) PSAA in the cell culture medium. No unspecific suppression of the Amber codon by endogenous amino acids was detected for this mutant. UV and blue light were equivalently applied in the –PSAA and +PSAA conditions. In the presence of the PSAA, a typical reversible photopotentiation was observed (in this example, 3.8-fold current potentiation). In the absence of the PSAA, the blank recording did not show any increase of current upon UV light. (b) As in a, for the GluN1-F654Amber mutant. A minor unspecific background in the minus PSAA-condition (–PSAA) was detected. Crucially, this ‘leakage’ current did not show any light-related effects, in contrast to receptors harboring the PSAA at the F654 site (here, 3.7-fold current potentiation). (c) Pooled peak current amplitudes for both mutants (48 hr post transfection) incubated in the presence or absence of PSAA. Supplementing the medium with the PSAA resulted in average current amplitudes of 84 ± 35 pA (n = 10) for GluN1-Y647Amber/GluN2A receptors. Only a few cells gave no agonist-mediated currents (n = 3 blanks). In the absence of the PSAA, no currents were detected in all cells tested (n = 12 blanks). For the GluN1-F654 Amber mutant, the current amplitudes were 196 ± 142 pA (n = 8) when PSAA was supplemented. The amount of blank recordings was minor (n = 1 blank). Cells lacking the PSAA gave mean current amplitudes of 150.5 ± 48 pA (n = 6), six further cells did not express at all (n = 6 blanks). UV or blue light never modulated mutant receptor activity with unspecifically incorporated endogenous amino acids. In contrast, receptors showed a 3.2 ± 0.3 fold potentiation with PSAA at the Y647 position (n = 3), and a 4 ± 0.2 fold potentiation when PSAA was introduced to the F654 site (n = 4).
Figure 7 with 4 supplements
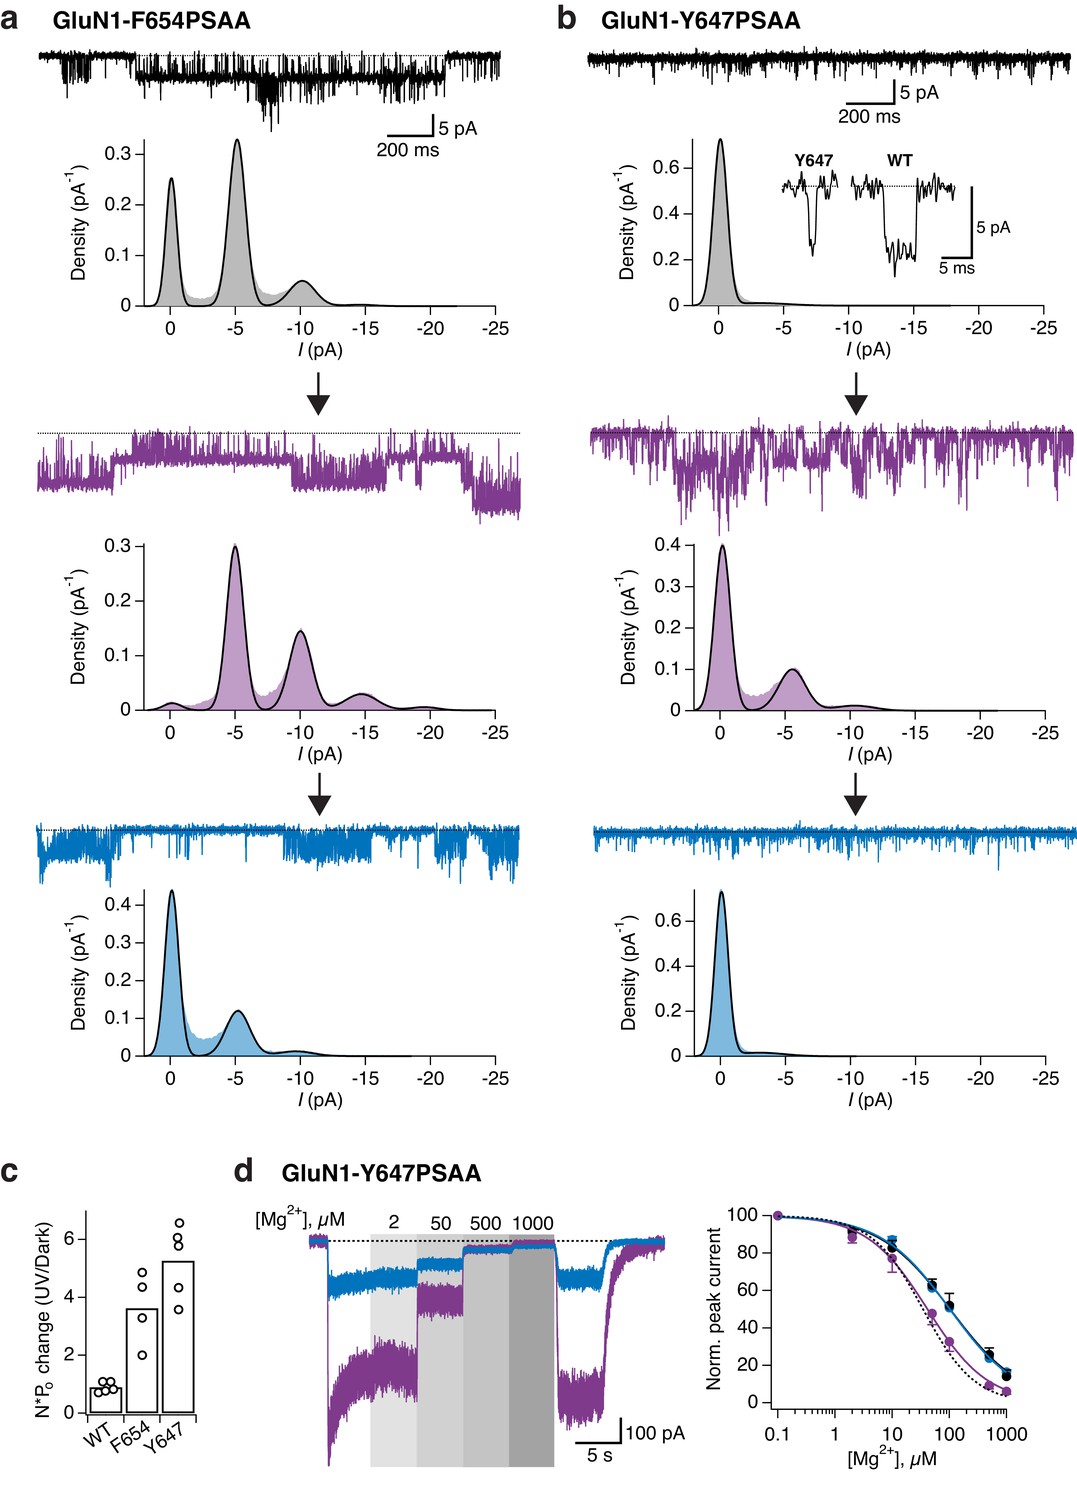
Optical modulation of receptor channel gating and permeation.
(a) Example single-channel recording from an outside-out patch expressing GluN1-F654PSAA/GluN2A mutant receptors in the presence of 100 µM glutamate and glycine and exposed to different light conditions (dark, UV, blue). All-points amplitude histograms were produced from 11 s of total recording time for each light condition and fitted with multiple Gaussian components (black lines), allowing calculation of single-channel elementary conductance (γel) and of receptor activity (N*Po). In this example, the values for γel are (in pS): γel,DARK = 64.3, γel,UV = 66, γel,BLUE = 65. Here, applying UV light resulted in a 2-fold increase in N*Po compared to the dark state. Data filtered at 2 kHz for illustration. (b) As in a, for the GluN1-Y647PSAA/GluN2A mutant. Glutamate concentration was 0.05 µM, glycine 100 µM. Values of γel in UV is 69.4 pS. Here, applying UV light resulted in a 5.8-fold increase in N*Po compared to the dark state. Top panel, inset: example single-channel openings from WT and GluN1-Y647PSAA mutant in the dark. (c) Pooled change in N*Po between UV and dark state for WT and mutant receptors. Values are (from left to right): 0.9 ± 0.08 (n = 5), 3.6 ± 0.63 (n = 4) and 5.3 ± 0.56 (n = 5). (d) Example magnesium dose-response traces from GluN1-Y647PSAA/GluN2A receptors under UV or blue light (left panel). Mg2+-DRCs under the three different light conditions (right panel). IC50 values are (in μM): IC50,DARK = 103 (n = 4–6 for each point); IC50,BLUE = 102 (n = 3–7); IC50,UV = 41.5 (n = 4–10). The dashed line corresponds to the magnesium sensitivity of WT receptors in the dark.
Figure 7—figure supplement 1
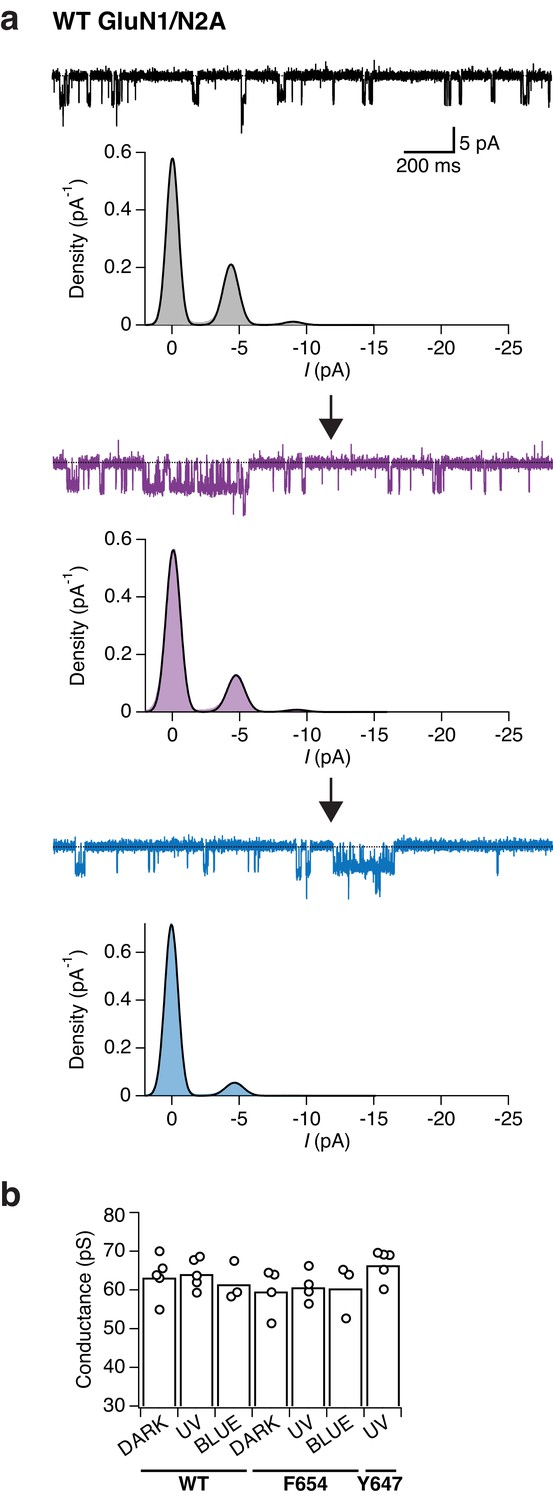
Wild-type GluN1/N2A receptors do not show any light-dependent modulation of single-channel properties.
(a) Example single-channel recording of an outside-out patch expressing WT GluN1/N2A receptors in the presence of 100 µM glycine and 0.05 µM glutamate and exposed to different light conditions (dark, UV, blue). All-points amplitude histograms were produced from 11 s of total recording time for each light condition. Histograms were fitted with multiple Gaussian components (black lines), the amplitude of which enables the calculation of single-channel elementary conductance (γel) and receptor activity (N*Po) in the dark, UV, and blue state. In this example, the values for the conductance are (in pS): γel,DARK = 54.8, γel,UV = 59.1, γel,BLUE = 58.1. There was no major change in regard of the channel activity when switching wavelength illumination. In this patch, a slow and continuous decrease in channel activity was observed throughout the recording (‘run-down'). The data were filtered at 2 kHz for illustration. (b) Pooled elementary conductance levels. For WT, the averaged values are: γel,DARK = 63.3 ± 2.4 (n = 5), γel,UV = 64.1 ± 1.7 (n = 5), γel,BLUE = 61.5 ± 2.2 (n = 3). For the GluN1-F654PSAA mutant: γel,DARK = 59.6 ± 3 (n = 4), γel,UV = 60.7 ± 2 (n = 4), γel,BLUE = 60.4 ± 3.4 (n = 3). For the GluN1-Y647PSAA mutant, only conductance levels under UV illumination could be obtained: γel,UV = 66.4 ± 1.8 (n = 5).
Figure 7—figure supplement 2
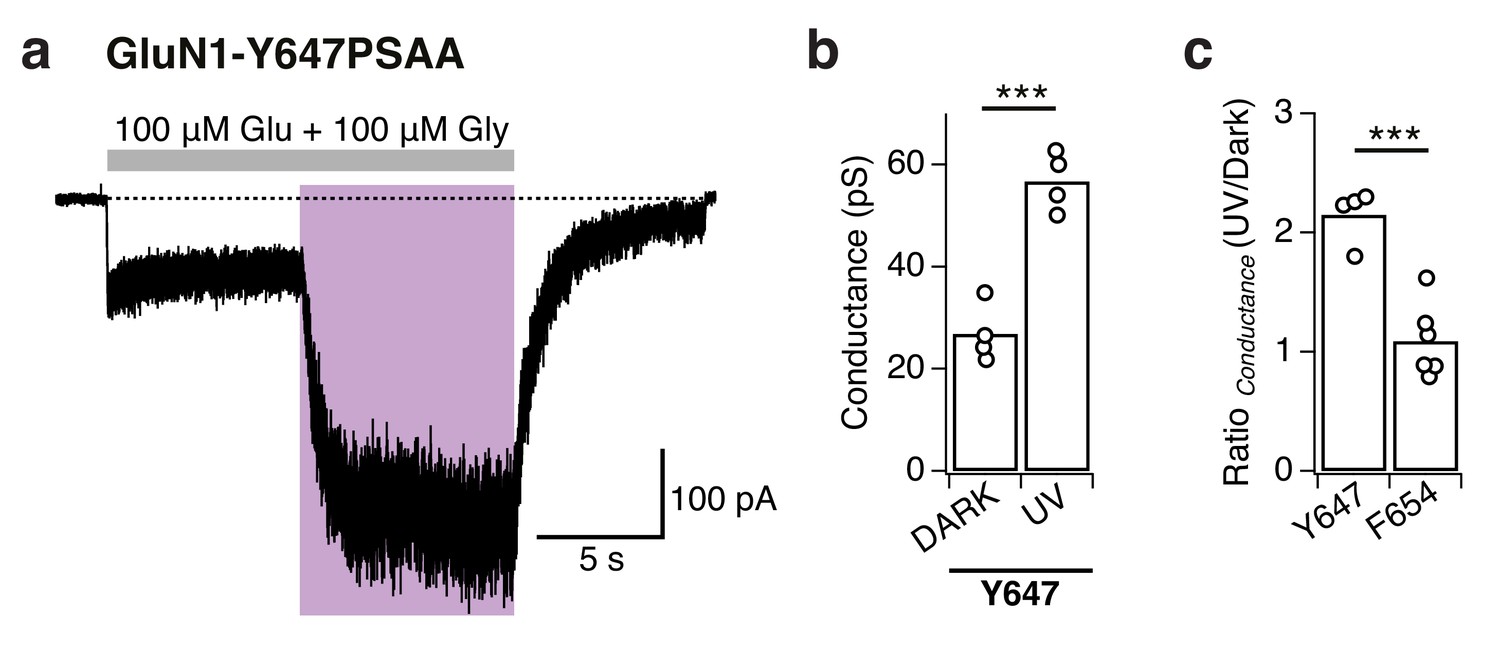
Estimation of the single-channel conductance by whole-cell noise analysis.
(a) Example of a macroscopic current as typically obtained from GluN1-Y647PSAA/GluN2A receptors. This trace was sampled at 20 kHz and low-pass filtered at 2 kHz (for reasons of illustration). The cell was kept in the dark and exposed to UV for 8 s each (in the presence of saturating co-agonists). In this example, the calculated single-channel conductances, as obtained from the whole-cell noise (low-pass filter at 10 kHz), are (in pS): γnoise, DARK = 24.2, γnoise, UV = 54. The ratio between γnoise, UV and γnoise, DARK is Rγ=2.23 for this particular cell. (b) Pooled conductance levels of GluN1-Y647PSAA/GluN2A receptors that were obtained from whole-cell noise recordings sampled at 20 kHz and low-pass filtered at 10 kHz. The averaged values are: γnoise, DARK = 26.9 ± 5.7, γnoise, UV = 56.7 ± 5.7 (n = 4; ***p<0.001). (c) The averaged ratio between γnoise, UV and γnoise, DARK for GluN1-Y647PSAA/GluN2A receptors is Rγ=2.1 ± 0.2 (n = 4), and Rγ=1.1 ± 0.3 (n = 6) for GluN1-F654PSAA/GluN2A receptors (***p<0.001).
Figure 7—figure supplement 3
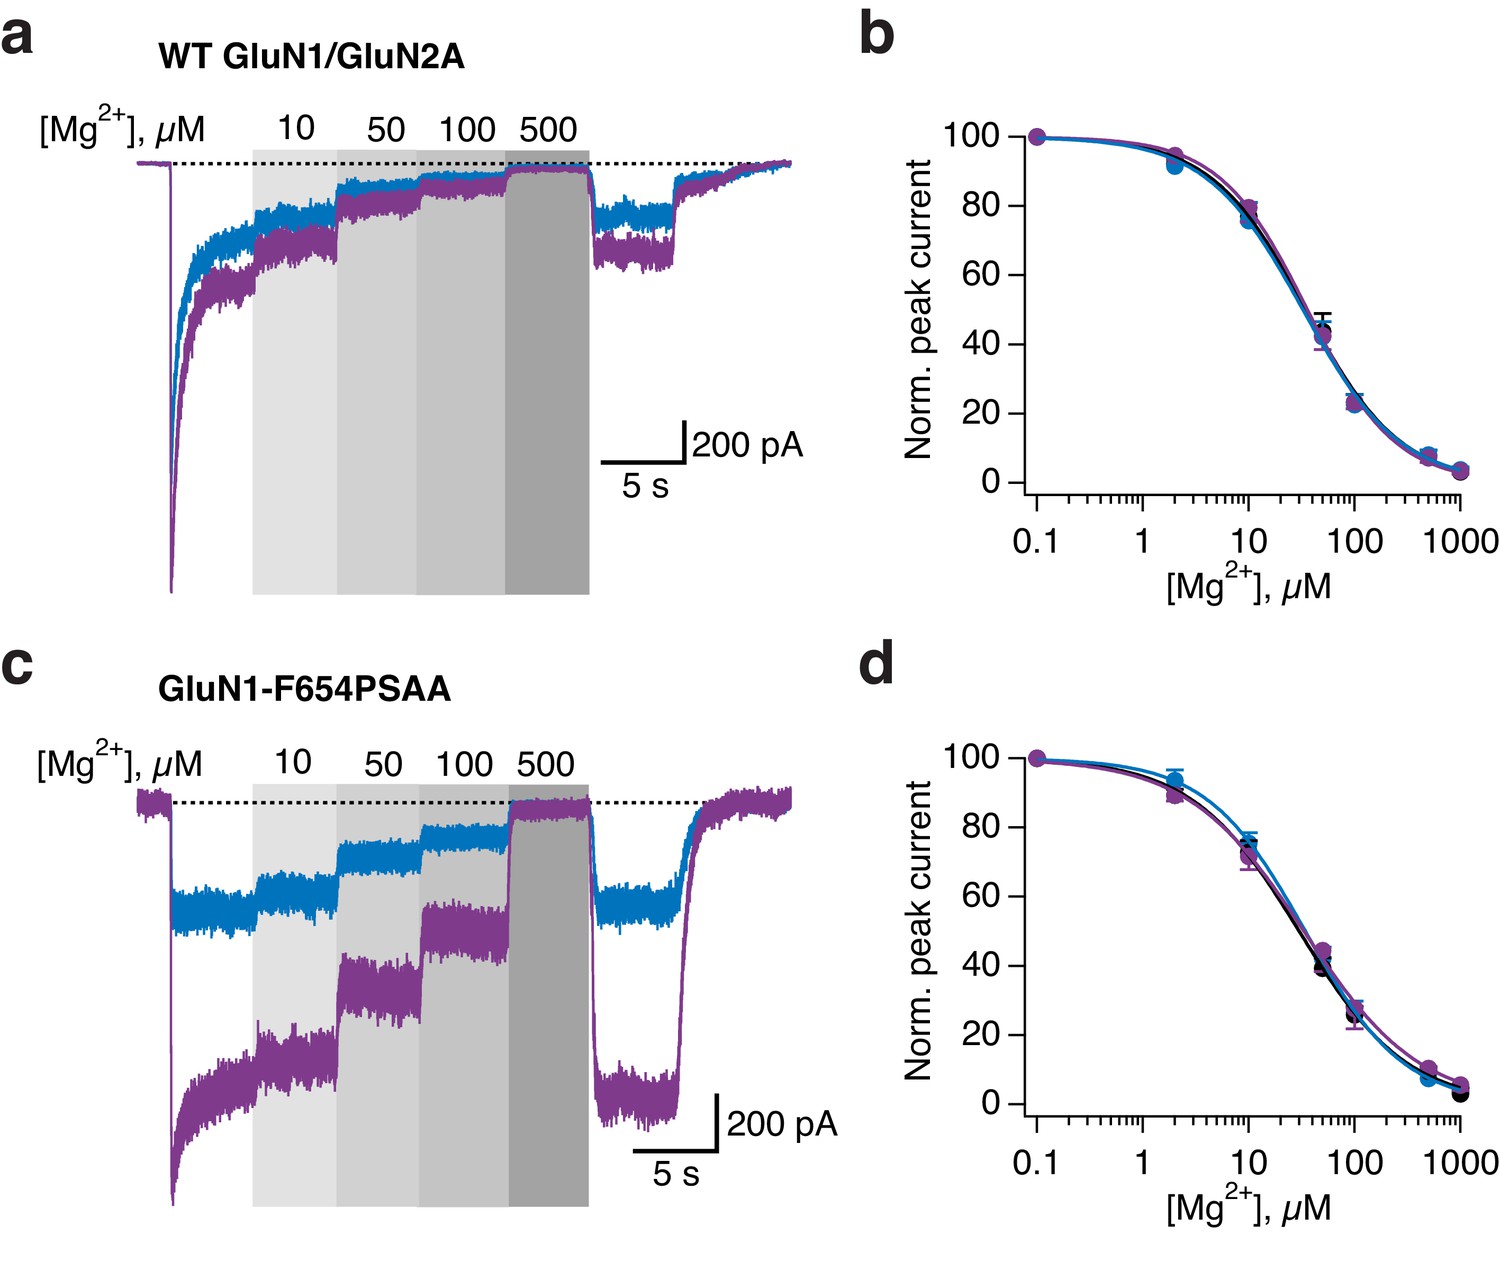
External magnesium block is not affected by light for WT and GluN1-F654PSAA receptors.
(a) Example magnesium dose-response traces under illumination of either UV or blue light for WT GluN1/GluN2A receptors. (b) Magnesium dose-response curves (Mg2+-DRCs) for WT receptors, obtained from traces as in a. IC50 values are (in µM): IC50 DARK = 34.6 (n = 4–7); IC50 BLUE = 32.6 (n = 3–7); IC50 UV = 35.8 (n = 4–7). (c) As in a, for the GluN1-F654PSAA mutant. (d) Mg2+-DRCs for GluN1-Y654PSAA/GluN2A receptors, obtained from traces as in c. IC50 values are (in µM): IC50 DARK = 30 (n = 3–7); IC50 BLUE = 34.3 (n = 3–6); IC50 UV = 33.3 (n = 5–8).
Figure 7—figure supplement 4
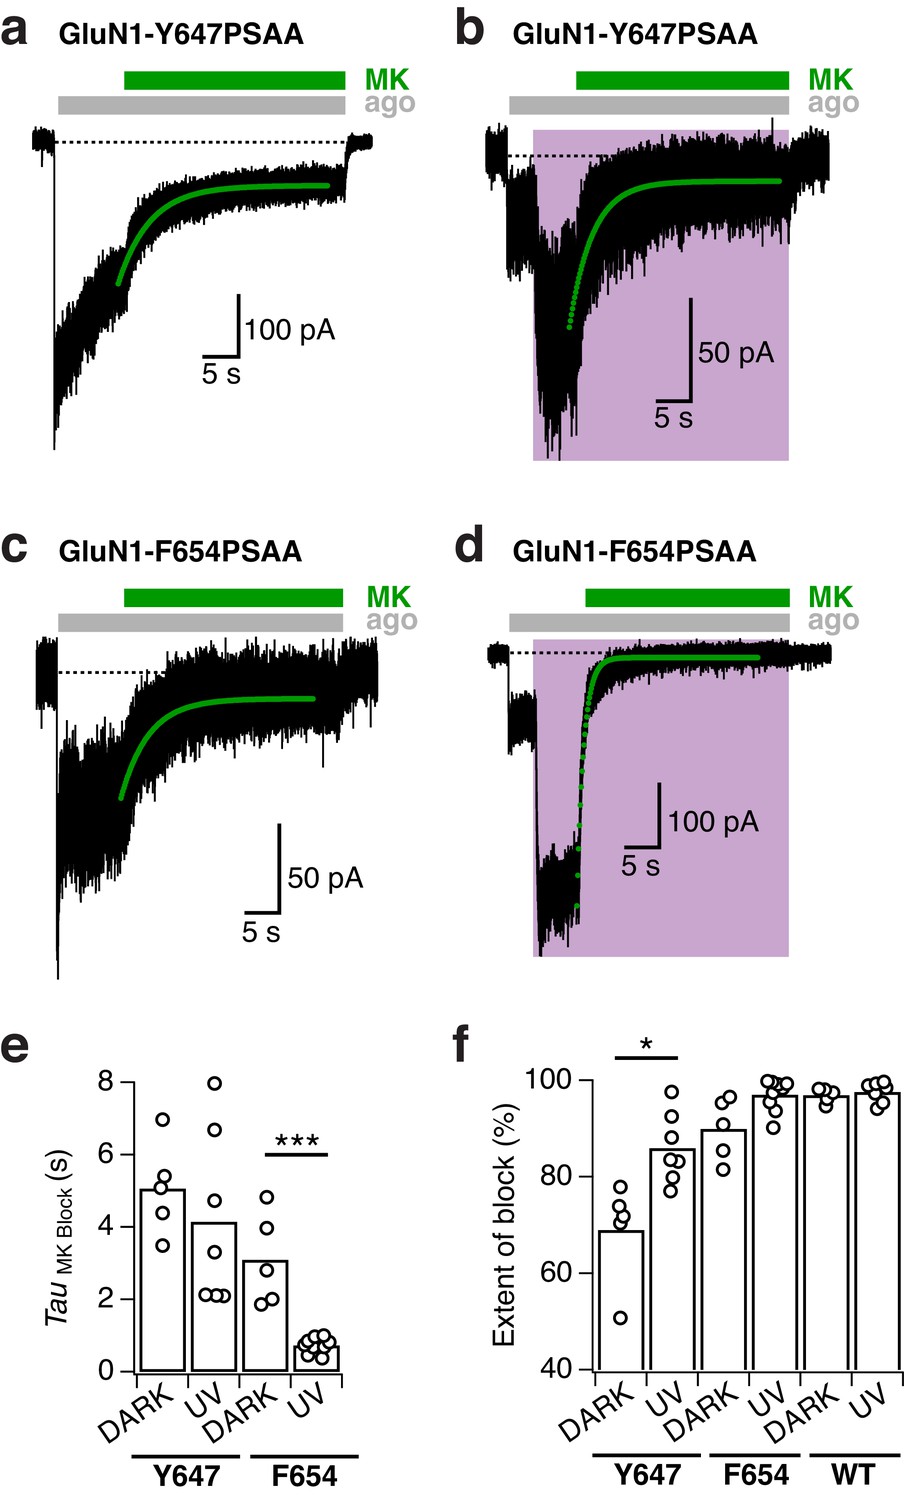
MK-801 inhibition kinetics of TMD mutant receptors.
(a) Representative trace showing the inhibition of GluN1-Y647PSAA/GluN2A receptors by 1 µM MK-801 in the dark state. In this example, the receptor activity was inhibited with an exponential time constant of 4400 ms (green line, mono-exponential fit). (b) As in a, under UV light (τ = 3300 ms). (c) Inhibition by MK-801 of GluN1-F654PSAA mutants in the dark (τ = 3970 ms). (d) As in c, under UV light (τ = 1000 ms). (e) Summary of the single-exponential time constants of MK-801 inhibition at different light conditions. The mean values are (absolute values, in ms): τDARK = 5070 ± 580 (n = 5) and τUV = 4150 ± 910 (n = 7; p=0.41) for the GluN1-Y647PSAA mutant;τDARK = 3070 ± 560 (n = 5) and τUV = 730 ± 70 (n = 9; ***p<0.001) for the GluN1-F654PSAA mutant. (f) The mean extent of block produced by MK-801 in the dark and UV state. Values are (in %): for GluN1-Y647PSAA mutant, BlockDARK = 69 ± 5 (n = 5), BlockUV = 86 ± 3 (n = 7; *p=0.02); for the GluN1-F654PSAA mutant, BlockDARK = 90 ± 3 (n = 5), BlockUV = 97 ± 1 (n = 9; p=0.07). WT GluN1/N2A receptors were nearly entirely blocked by MK-801 with: BlockDARK = 97 ± 1 (n = 5), BlockUV = 98 ± 1 (n = 7; p=0.53).
Figure 8
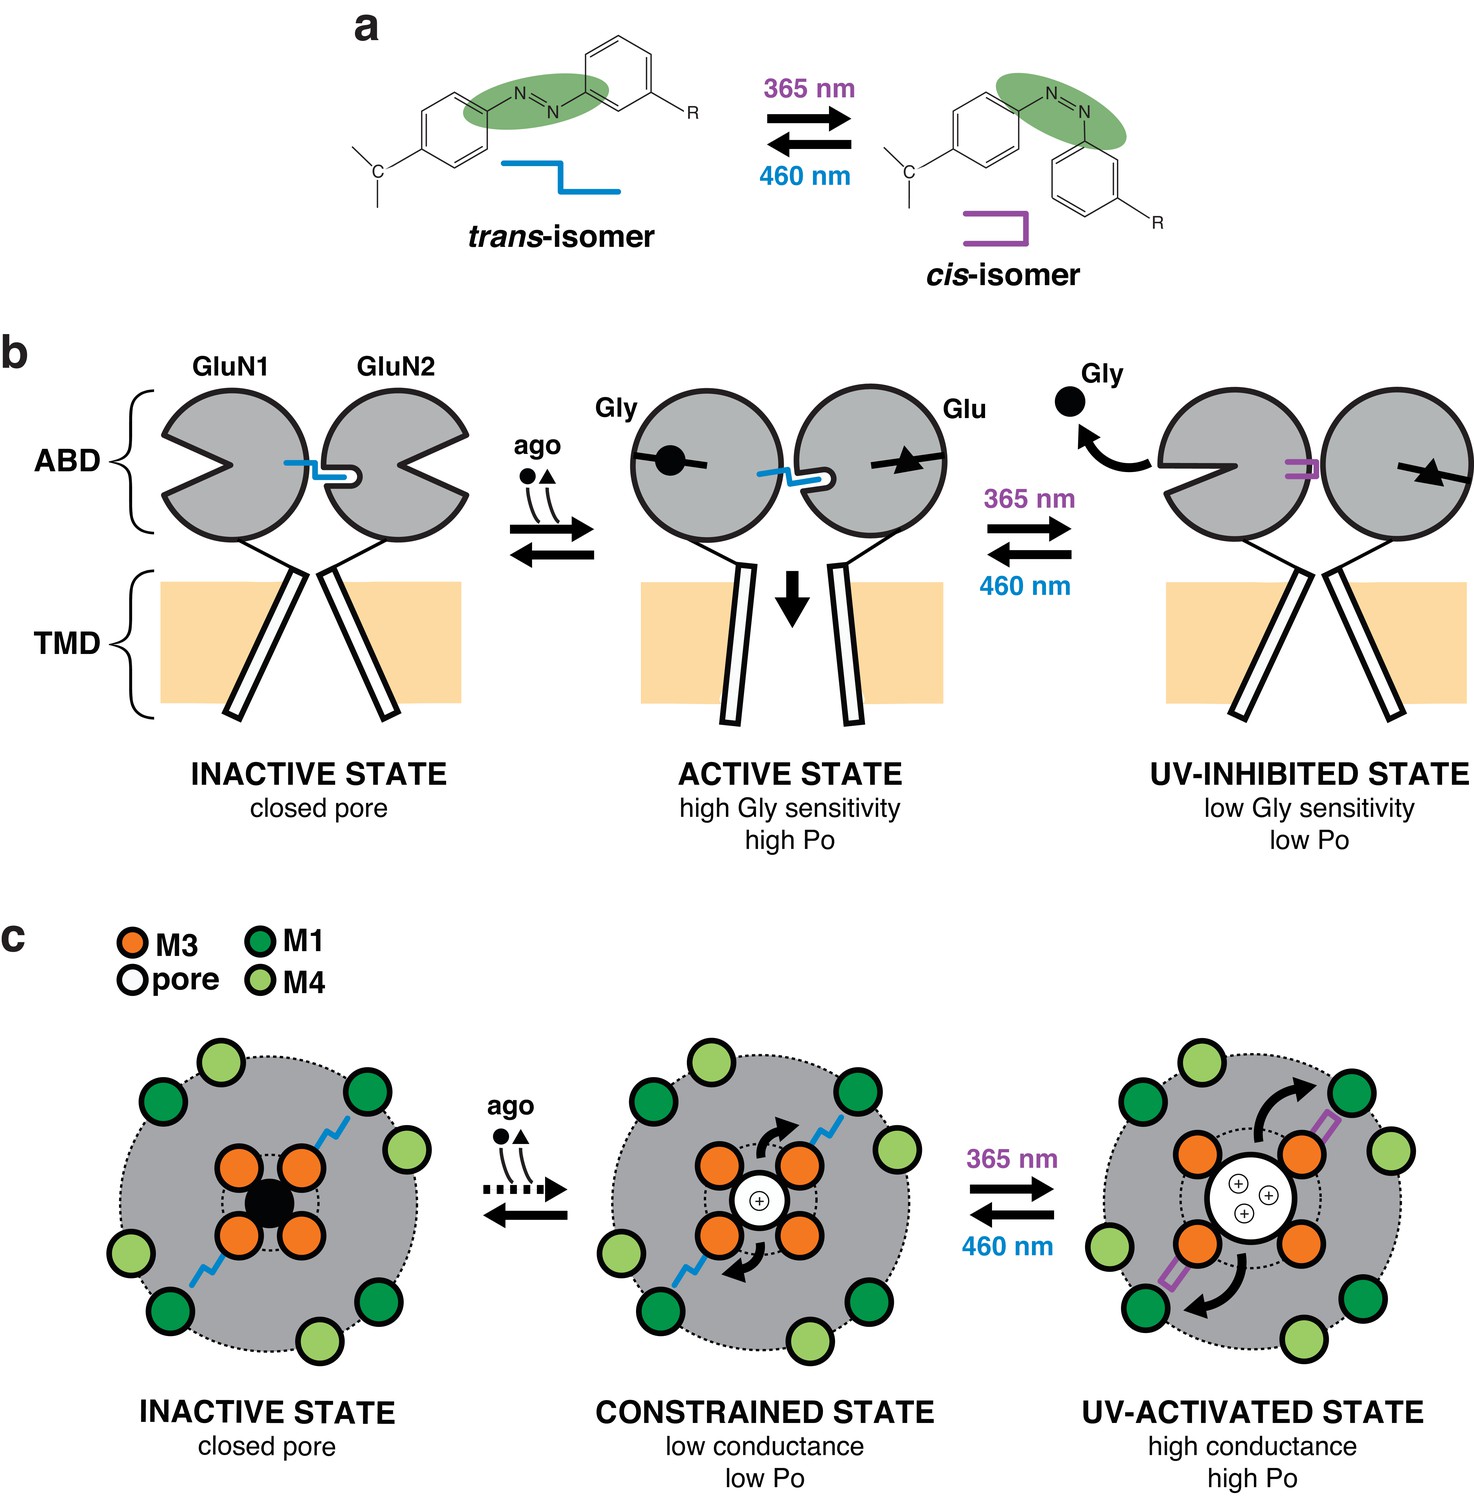
Proposed mechanism for photomodulation of the gating and permeation properties of NMDARs carrying PSAAs.
(a) Toggling of the PSAA azobenzene moiety between the trans- and cis-isomers in dependence of blue or UV light. For simplicity, the two isomers are replaced by symbols as indicated. (b) Schematic representation of the mechanism underlying the photomodulation at the ABD level. For clarity, only one dimer is represented and the NTD region is omitted. PSAA in its trans-configuration (dark and blue condition), when placed at the GluN1 ABD clamshell hinge (P532 position), intrudes into a hydrophobic pocket located at the GluN2A ABD hinge region (Furukawa et al., 2005). This interaction stabilizes the GluN1 ABD in a closed-cleft conformation (i.e. active state) as well as ABD GluN1/GluN2 heterodimer interface, resulting in active (i.e. open) channels (Furukawa et al., 2005; Gielen et al., 2008). Flipping the GluN1-azobenzene moiety to the cis-configuration by UV illumination destabilizes this active conformation, favoring GluN1 clamshell opening, which in turn accelerates glycine dissociation. This effect is accompanied by a weakening of the ABD dimer interface resulting in a 50% drop of channel Po (UV-inhibited state). (c) Schematic representation of the mechanism underlying photomodulation in the pore domain. The TMD pore region is viewed from the top. PSAA is placed at the GluN1-Y647 site, which is part of a highly conserved hydrophobic cluster that sits at the back of the channel lumen and connects the M3 helix bundle (channel gate, inner ring) to the peripheral M1/M4 helix outer ring. PSAA in its extended trans-configuration prohibits adequate channel opening by preventing full expansion of inner M3 ring towards the periphery. The channel is thus locked in a constrained ‘open’ state, highly unstable (low Po) and with low conductance. Upon UV, however, activity can be drastically enhanced, an effect that originates from the relief of the steric hindrance allowing the inner M3 ring to accomplish its full movement towards the outer ring (UV-activated state). This motion generates an increase in ion channel Po and conductance. Thus, channel opening is energetically more favorable in the more compact cis-configuration than the rigid and elongated trans-configuration of the PSAA.
Author response image 1
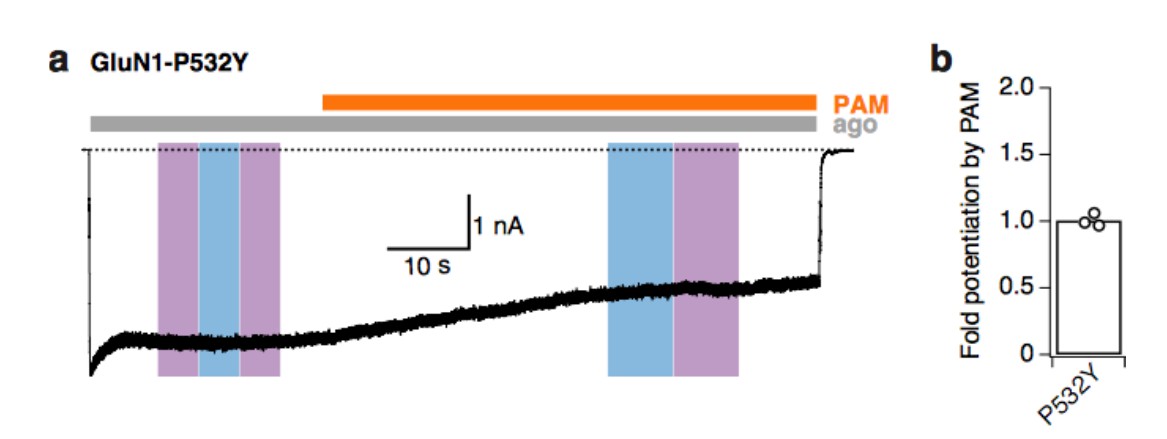
Tyrosine at the GluN1-P532 Amber site disrupts the binding site of PAM.
(a) Example trace demonstrating that PAM does not potentiate mutant receptors with tyrosine at the GluN1-P532 site (co-expressed with GluN2A-WT subunits). Light at 365 or 460 nm does not induce any changes of receptor activity. (b) Mean fold-potentiation by PAM for GluN1-P532Y receptors (1.01 ± 0.03, n=3).
Tables
Table 1
Screening for expression and photosensitivity of NMDAR Amber mutants. Overview of all Amber positions screened for PSAA insertion within the NTD, ABD, and TMD. PSAA was introduced to either the GluN1, GluN2A, or GluN2B subunit. A total of 27 different combinations were tested. Among those, 13 gave co-agonist evoked currents (green boxes), the rest did not result in functional receptors (orange boxes). Eight subunit combinations assembled into functional receptors, whose activity could be reversibly modulated by light (↓ UV-triggered photoinactivation; ↑ UV-triggered photopotentiation).
| GluN1 | GluN2A | GluN2B | Expression | Photomodulation | |
|---|---|---|---|---|---|
| WT | wt | wt | |||
| wt | wt | ||||
| NTD | Y109 | wt | ↓ | ||
| Y109 | wt | ↓ | |||
| wt | Y281 | ||||
| wt | Y282 | ||||
| ABD | P521 | wt | |||
| P532 | wt | ↓ | |||
| P532 | wt | ||||
| Y535 | wt | ↓ | |||
| wt | P527 | ||||
| wt | E530 | ||||
| wt | P528 | ||||
| wt | E531 | ||||
| E698 | wt | ||||
| TMD | F554 | wt | ↑ | ||
| W563 | wt | ↑ | |||
| W578 | wt | ||||
| W608 | wt | ||||
| W611 | wt | ||||
| wt | S632 | ||||
| W636 | wt | ||||
| wt | Y645 | ||||
| wt | Y646 | ||||
| Y647 | wt | ↑ | |||
| Y647 | wt | ||||
| F654 | wt | ↑ | |||
| F654 | wt | ||||
| F817 | wt |
Download links
A two-part list of links to download the article, or parts of the article, in various formats.
Downloads (link to download the article as PDF)
Open citations (links to open the citations from this article in various online reference manager services)
Cite this article (links to download the citations from this article in formats compatible with various reference manager tools)
Optocontrol of glutamate receptor activity by single side-chain photoisomerization
eLife 6:e25808.
https://doi.org/10.7554/eLife.25808


