Reverse translation of adverse event reports paves the way for de-risking preclinical off-targets
- Novartis Institutes for Biomedical Research, United States
- Novartis Institutes for Biomedical Research, Switzerland
- Oracle Health Sciences, United States
- University of California, United States
Figures
Figure 1

General information of the FDA Adverse Event Reporting System (FAERS) content (1997–2015).
(A) The cumulative number of reports in FAERS is shown in the top panel; the bottom panel shows the number of new reports per quarter. (B) Distribution of reporter identities. Data are based on reports submitted between Q2 2002 (identification of reporting individuals started at this time) and Q4 2015. (C) Distribution of reports by the 7 ADR outcomes defined in FAERS.
Figure 2
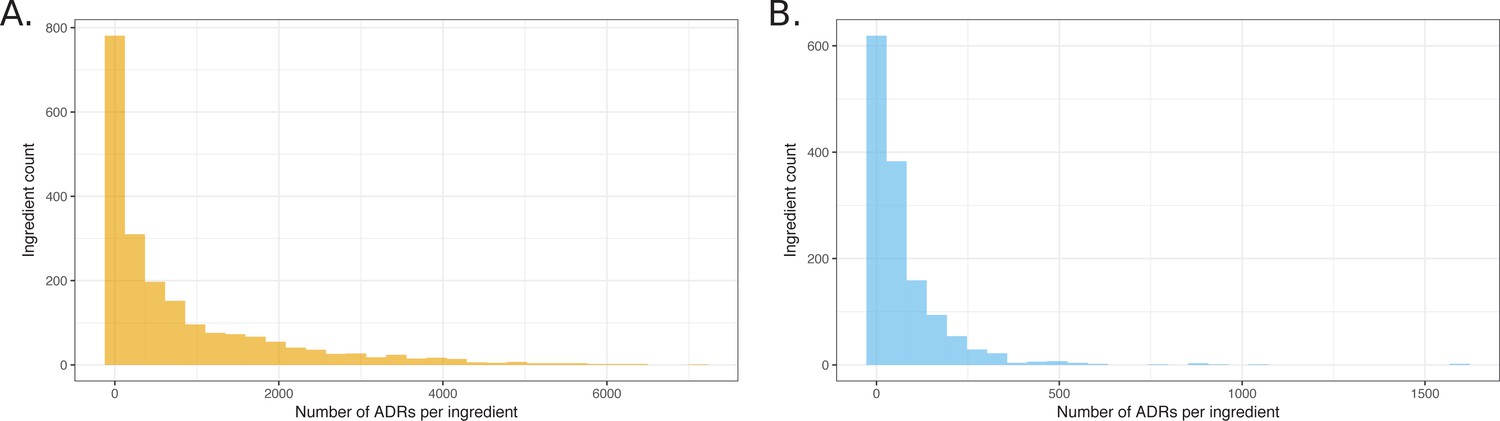
Histograms showing the distribution of the number of ADRs that were attributed to unique ingredients.
(A) All observed ingredient – ADR pairs. (B) Pairs observed below the q-value cutoff of 0.05.
Figure 3
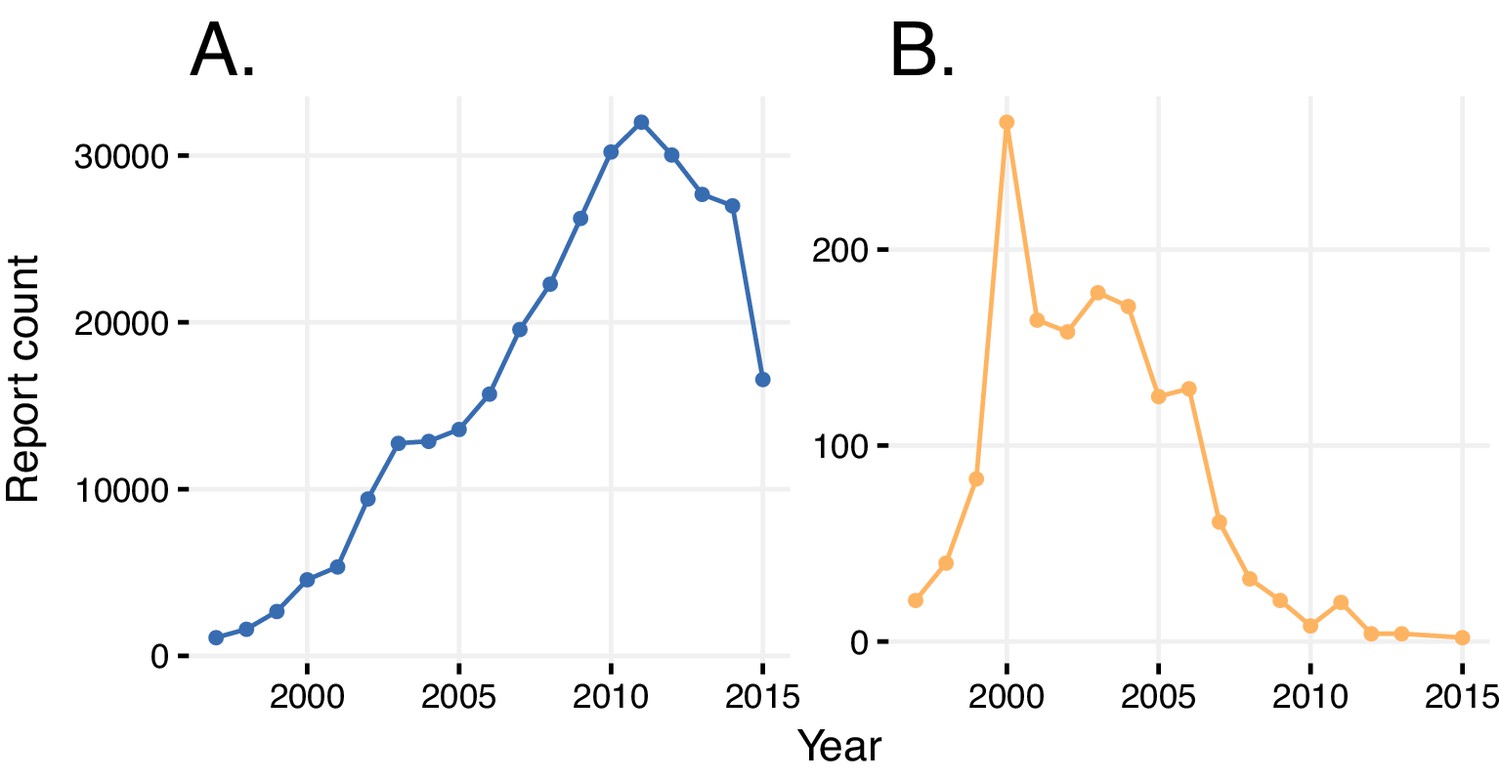
Reports with wrongly identified indications or ADRs.
(A) Total number of reports in a given year where the same indication and ADR were reported. (B) Number of reports in a given year where diabetes was stated as the adverse reaction caused by rosiglitazone.
Figure 4
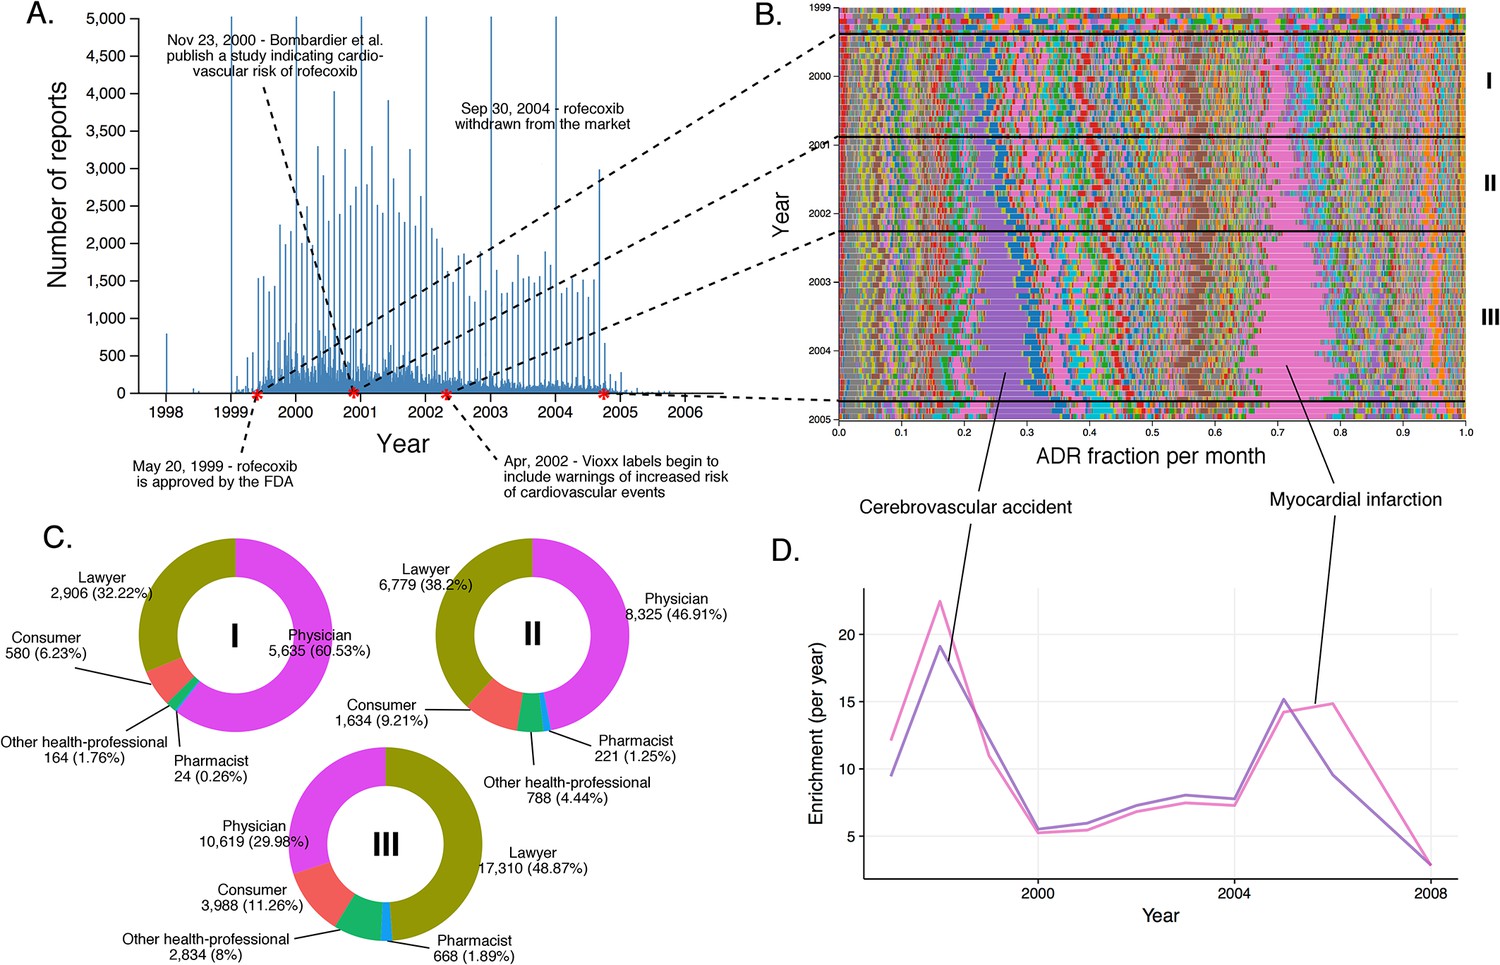
Submission pattern and time evolution of rofecoxib FAERS reports.
(A) Number of reports (per day) where rofecoxib was reported as primary suspect. Red dots represent events with a major impact on the FAERS reporting pattern of rofecoxib. (B) Relative percent participation of all ‘preferred term’ (PT)-level ADRs observed for rofecoxib. Each ADR is represented by a separate color. Characteristic time periods on the timeline of this drug are demarked by lines (associated with definitive events), and numbered. Monthly ADR fractions shown here are also reported in Supplementary file 1. (C) Identities of those reporting rofecoxib ADRs at the various reporting periods, marked to correspond with the Roman numeral annotations in panel B. (D) Enrichment-based clusters of ADRs (cerebrovascular accident and myocardial infarction) observed in rofecoxib reports between 1997 and 2006.
Figure 5
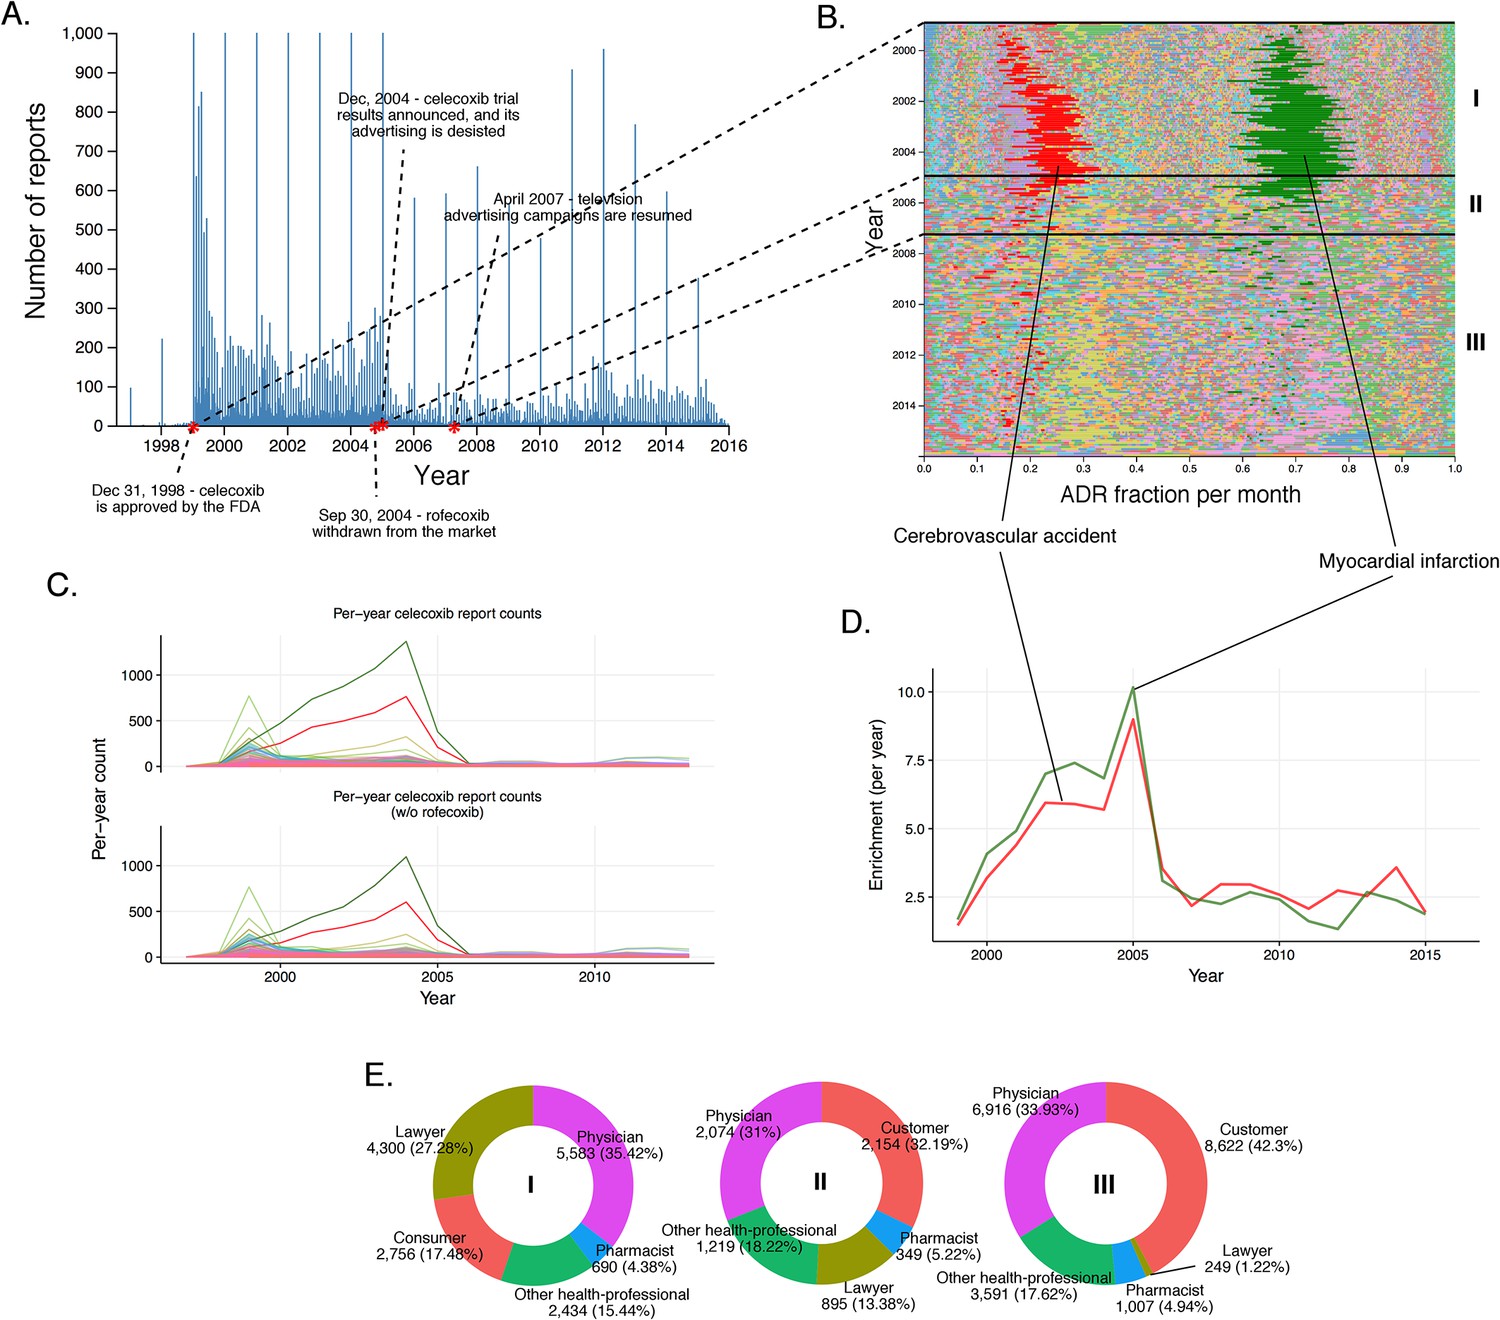
History of FAERS reports on celecoxib.
(A) Number of FAERS reports (per day) where celecoxib was reported as primary suspect. (B) Relative percent participation of all PT-level ADRs observed for celecoxib. Each ADR is represented by a separate color. Characteristic time periods on the timeline of this drug are marked by lines, and numbered. Monthly ADR fractions shown here are also reported in Supplementary file 1. (C) Per-month number of reports where celecoxib was primary suspect; each line corresponds to a separate PT-level ADR. The top plot describes all reports with celecoxib as primary suspect. In the plot on the bottom the reports in which rofecoxib was also present were omitted. Colors are matched with those used in panel B. (D) Enrichment-based clusters of most frequently reported ADRs (cerebrovascular accident and myocardial infarction) observed in ccoxib reports. Colors match those in B and C. Note, that this plot will not exactly correspond to panel B, because enrichments presented here show the ratio of the number of observed events in a given year compared to what one would expect at random, while the traces in B show a proportion of a given ADR compared to other ADRs during a given period of time. (E) Identities of those reporting celecoxib ADRs at various reporting periods, marked to correspond with the Roman numeral annotations in panel B.
Figure 6

Rosiglitazone reports.
(A) Number of FAERS reports (per day) where rosiglitazone was reported as primary suspect. (B) Per-month percent participation of all PT-level ADRs observed for rosiglitazone. Each ADR is represented by a separate color. Characteristic time periods on the timeline of this drug are demarked by lines, and numbered. Monthly ADR fractions shown here are also reported in Supplementary file 1. (C) Identities of those reporting rosiglitazone ADRs at various reporting periods, marked to correspond with the Roman numeral annotations in panel B. (D) Enrichment-based clusters of ADRs observed in rosiglitazone reports.
Figure 7
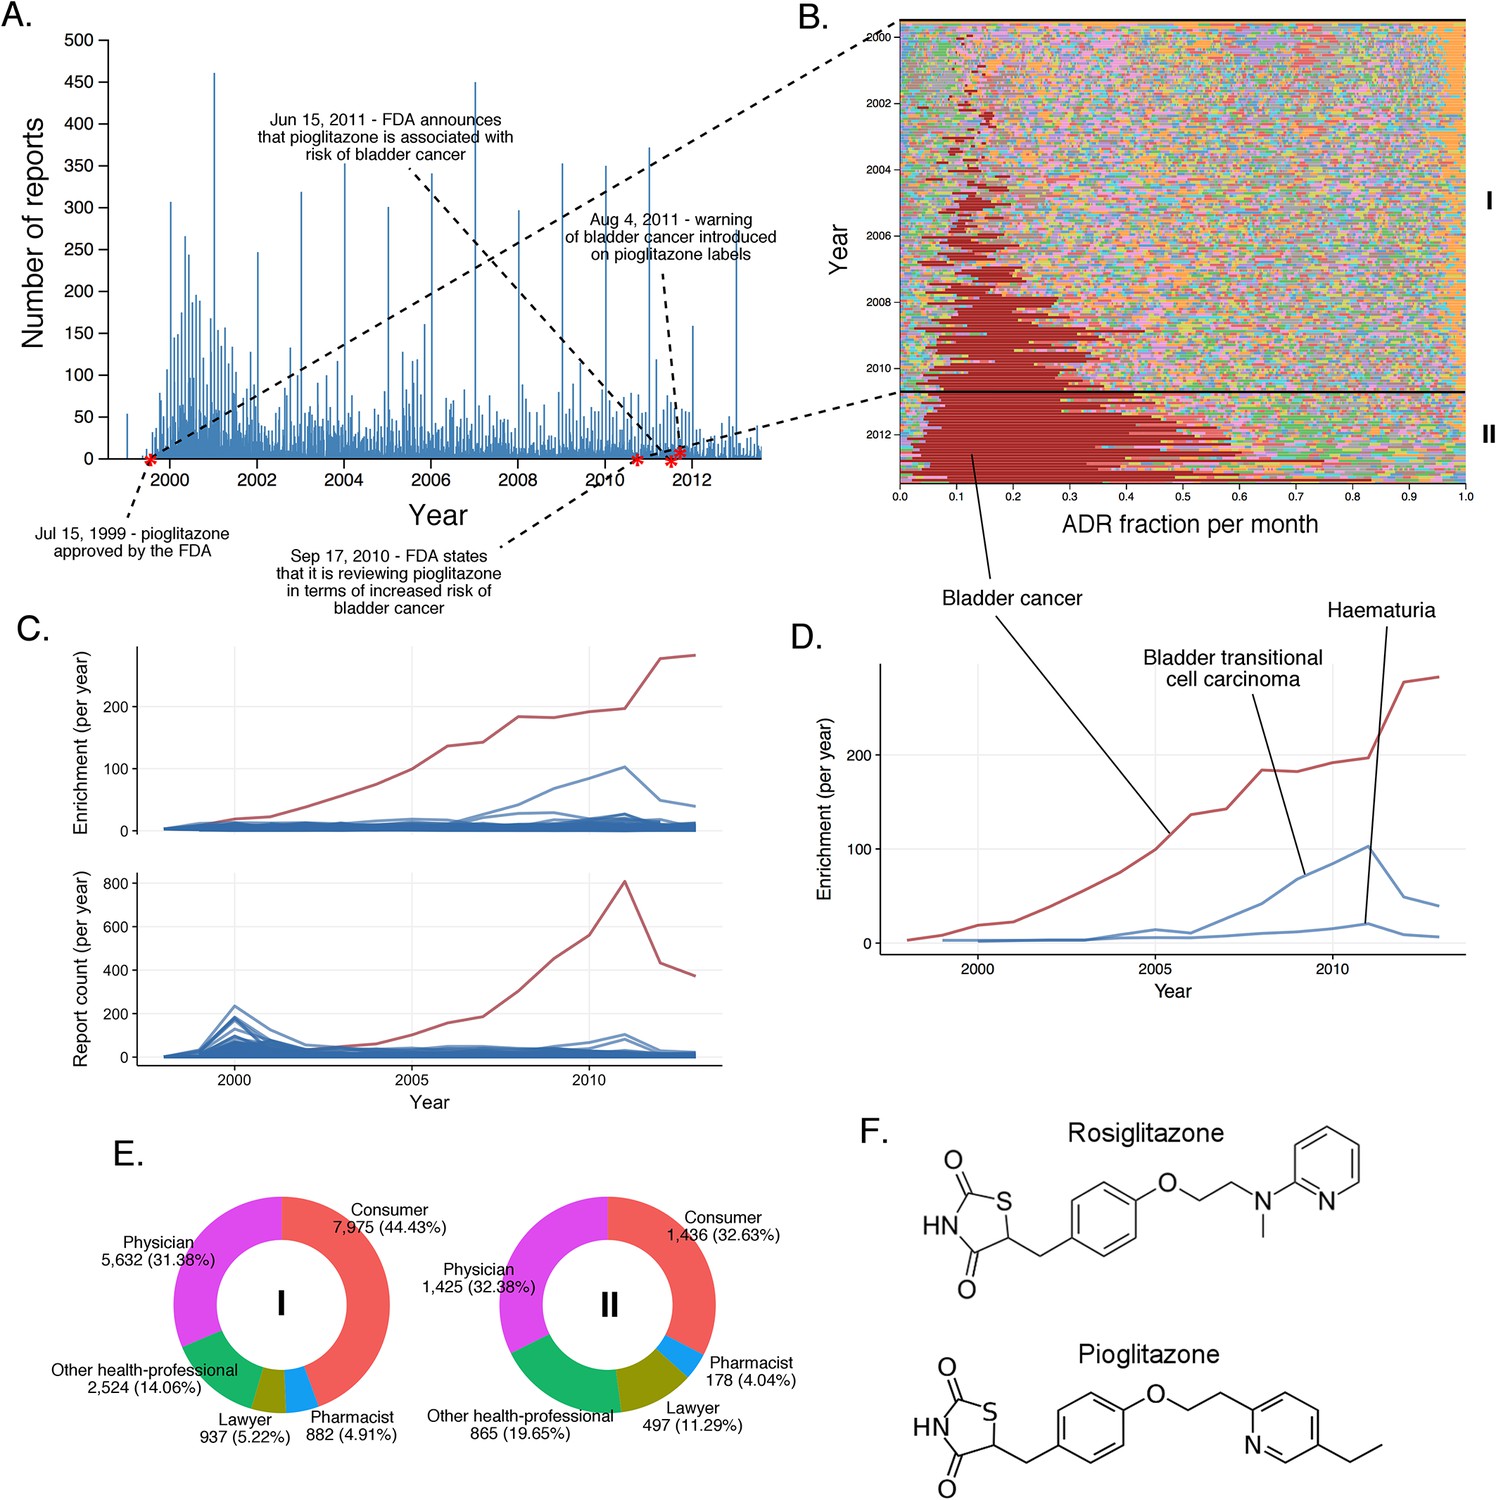
The landscape of pioglitazone reports.
(A) Number of FAERS reports (per day) where pioglitazone was reported as primary suspect. (B) Per-month percent participation of all PT-level ADRs was observed for pioglitazone. Each ADR is represented by a separate color. Characteristic time periods on the timeline of this drug are marked by lines and numbered. The monthly ADR fractions shown here are also reported in Supplementary file 1. (C) Per-month number of reports where pioglitazone was primary suspect; each line corresponds to a separate PT-level ADR. The plot on the top of the panel shows number of times individual ADRs have been reported, and the bottom the corresponding per-month enrichments. The traces for cardiac failure have been distinguished by the blue color. (D) Enrichment-based clusters of cancer-related ADRs observed in pioglitazone reports. (E) Identities of those reporting pioglitazone ADRs at various reporting periods, marked to correspond with the Roman numeral annotations in panel B. (F) Structure of rosiglitazone and pioglitazone.
Figure 8
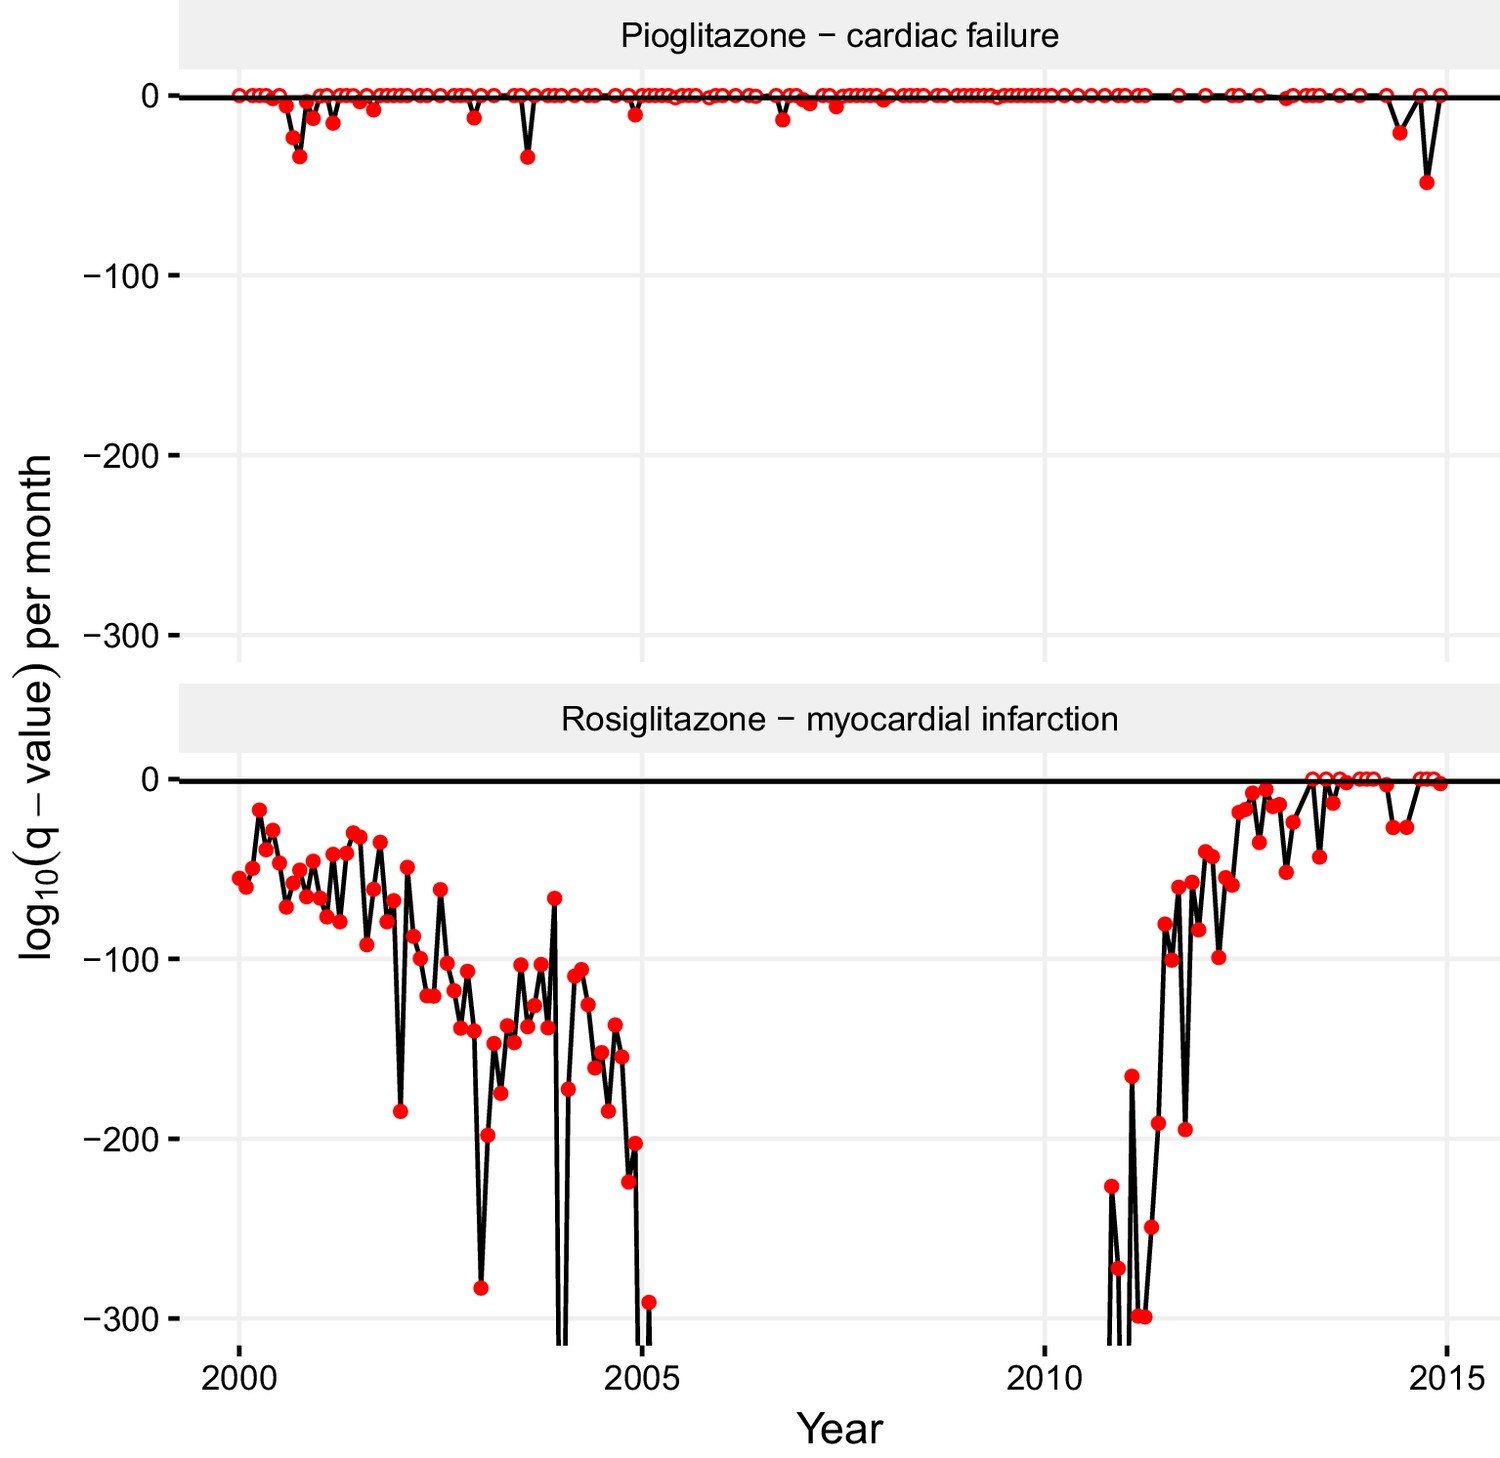
Statistical significance of association between pioglitazone and cardiac failure (top panel), and rosiglitazone and myocardial infarction (lower panel) over time.
The horizontal line demarks the critical q-value cutoff of 0.05, below which the association becomes statistically significant. On dates when the association crosses this threshold, its q-value is indicated by a filled circle; otherwise, it is indicated by an empty circle. The extreme q-values below 1·10−300 are not shown.
Figure 9
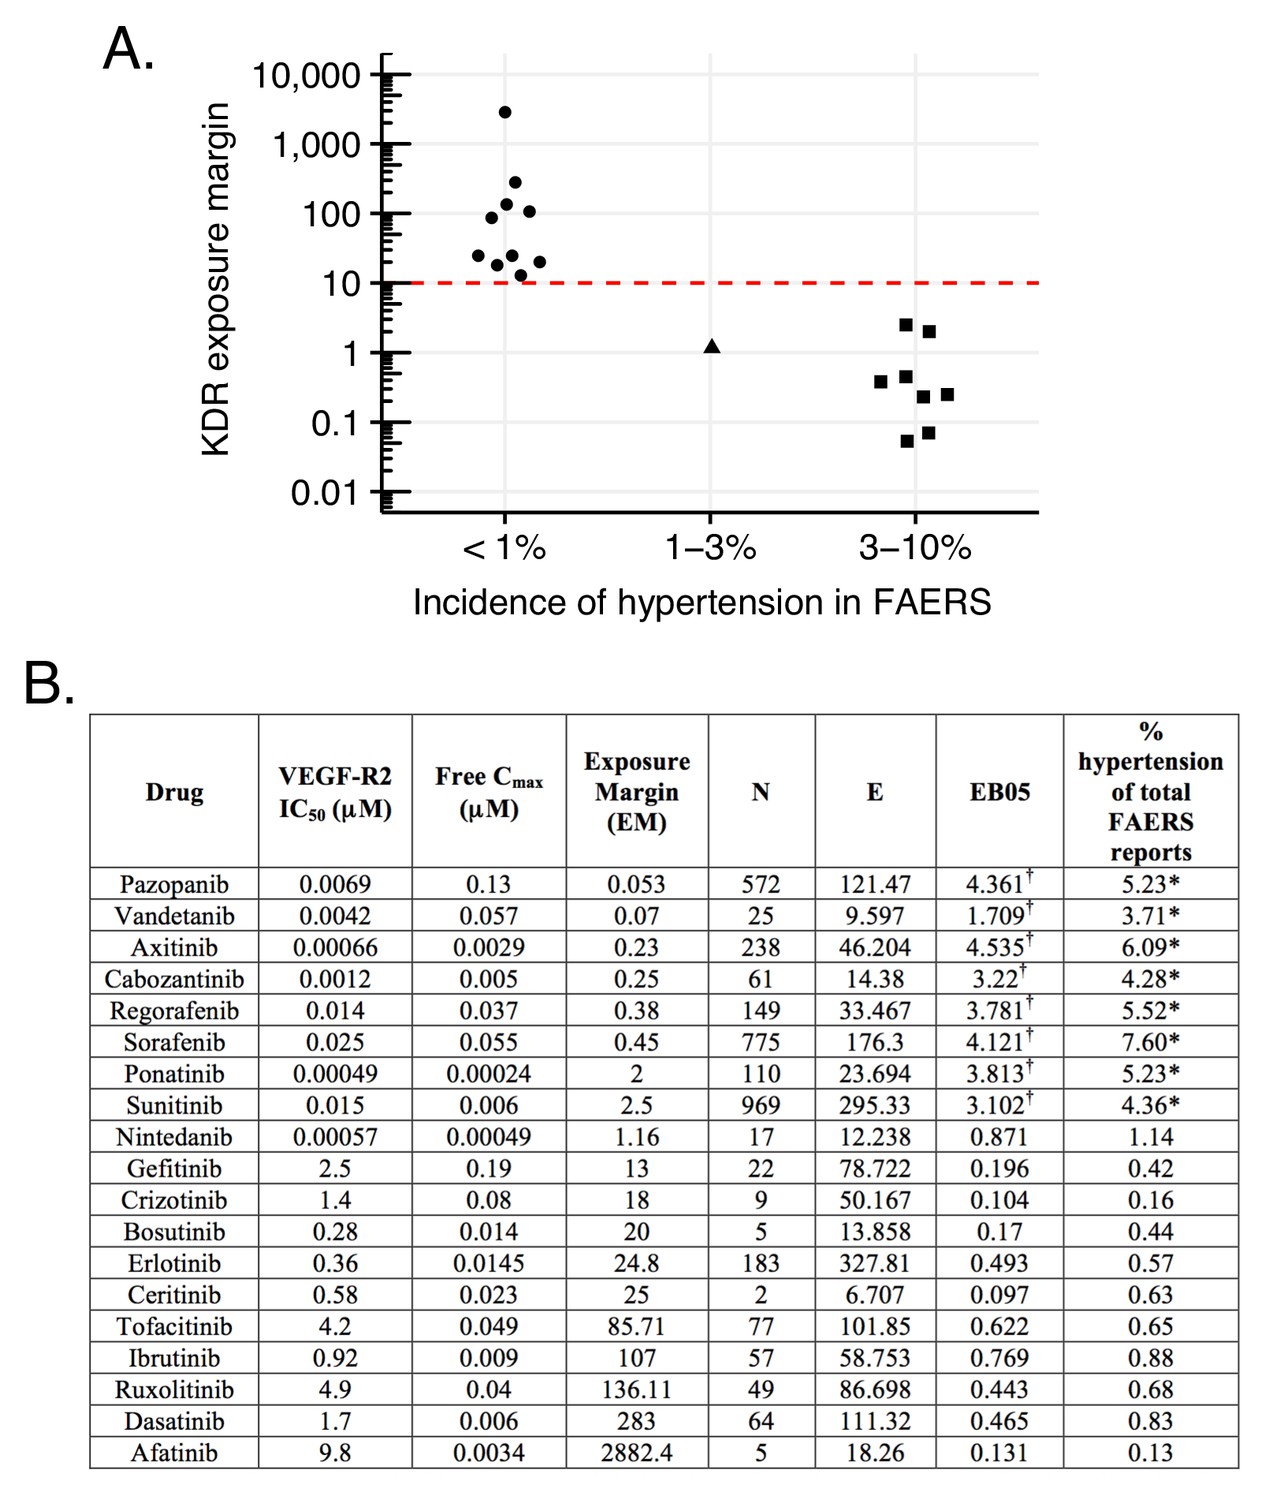
Hypertension associated with VEGF-R2 inhibition depends on the exposure margin of small molecule anti-VEGF-R2 drugs (VEGF-R2 IC50/Cmax).
(A) Suggested exposure margin for marketed VEGF-R inhibitors based on post-marketing incidence of hypertension in correlation with plasma exposure (VEGF-R IC50/free Cmax). The proposed 10 times margin represents clear separation of VEGF-R inhibitors with and without significant increase in hypertension with the only exception of nintedanib. (B) FAERS reports of small molecule kinase inhibitors with VEGF-R2 inhibition show an increased incidence of hypertension reports only in case their exposure margin is less than 13. The label of drugs with high incidence of hypertension in FAERS lists this side effect, while none of those drugs that have low incidence carry the label. *p-value of association between drug and hypertension <0.001. Counts (N), expected counts (E), and an often-used disproportionality measure (EB05) based on the FDA’s FAERS database of spontaneous reports of suspected drug adverse drug reactions are provided. The values of E are the expected number of patients reporting vascular hypertensive disorder after taking each drug if the drug reports and the reports of the event were independent within the database, conditional on the patients age and gender. The ratio N/E is a measure of disproportionality of report counts of each particular drug-event combination. The value EB05 (empirical Bayes 5% lower bound of a 90% credible interval) is a conservative estimate of the true reporting disproportionality that uses estimated overall prevalence of drug-ADR associations throughout the database. The value of EB05 is less than N/E and has the effect of correcting the simple ratio for sampling variance and multiple comparisons bias. See literature (DuMouchel, 1999; DuMouchel and Pregibon, 2001; Szarfman et al., 2002; Almenoff et al., 2007) for details and discussion of the FAERS database and the use of disproportionality analyses within spontaneous report databases. The values of EB05 for the first three drugs indicate 95% confidence that reports of those three drug-event combinations are reported about three or four times as often as would be expected if they were independent, while the values of EB05 <1 in the final three drugs in the table indicate no evidence for higher than expected reporting rates. More detailed results from Bayesian analysis are available in Supplementary file 3. †Significant increase.
Figure 10
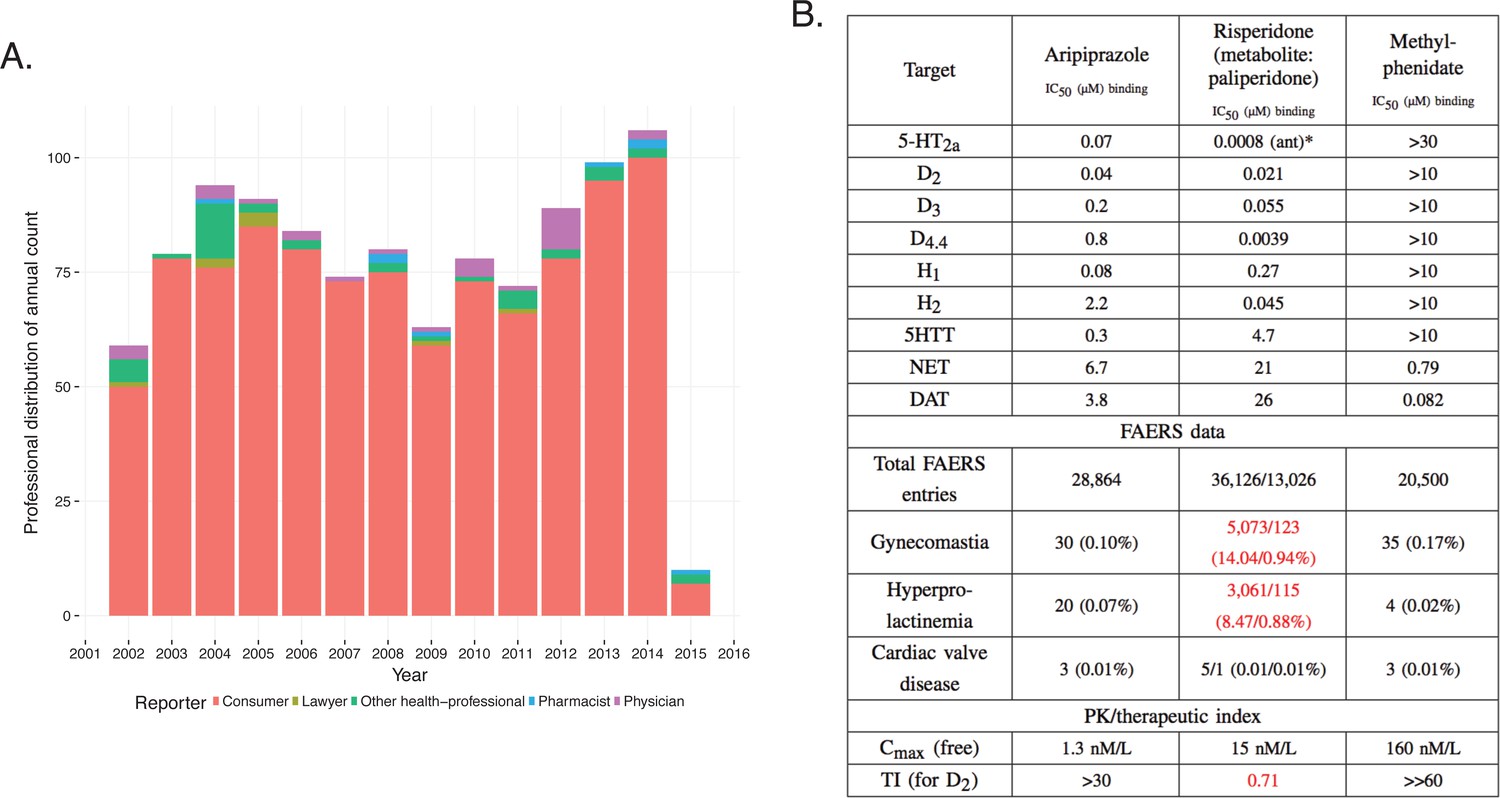
Integration of pharmacodynamic and pharmacokinetic data is necessary to interpret FAERS information.
(A) FAERS analysis of the reporting pattern of gynecomastia in patients treated with risperidone between 2002–2015. (B) Summary table of the in vitro pharmacological profile, FAERS entries (total number of reports, and reports of gynecomastia, hyperprolactinemia and cardiac valve disease where the listed drugs were the primary suspects) and calculation of exposure margin of aripiprazole, risperidone/paliperidone and methylphenidate. The prominent effects of risperidone/paliperidone at the D2 dopamine receptor in conjunction of the narrow TI differentiates these compound(s) from the rest. Assays were performed at the Novartis Institutes for BioMedical Research, Cambridge. *Asterisks denote functional assays. ant: antagonism.
Tables
Table 1
Confusion of ADRs with indications. Report and case numbers identify two FAERS reports where the ADR is confused with the indication.
For the first case, rosiglitazone prescribed for diabetes (Indication) is identified as the primary suspect (PS) for causing diabetes mellitus as an ADR as well. In the second case, ‘cardiac failure congestive’ is given as the indication for rosiglitazone with the reported ADR of ‘cardiac failure congestive’. The third case exemplifies correct reporting, where both the ADR and the indication of rosiglitazone are reported correctly.
| Report | Case | ADR | Drug / Role / Indication |
|---|---|---|---|
| 6545021 | 179039 | Diabetes mellitus | Rosiglitazone/PS/Diabetes mellitus |
| 5521616 | 162007 | Cardiac failure congestive | Rosiglitazone/PS/Cardiac failure congestive |
| 6380841 | 7085373 | Cardiac failure congestive | Rosiglitazone/PS/Diabetes mellitus |
Additional files
-
Supplementary file 1
A document containing multiple sheets with reported data: groups of case_ids of reports that were found to likely correspond to the same event; monthly fractions of reported ADRs in rofecoxib reports; monthly fractions of reported ADRs in celecoxib reports; monthly fractions of reported ADRs in rosiglitazone reports; monthly fractions of reported ADRs in pioglitazone reports; ingredient – ADR associations stemming from analysis of all reports; aggregation of ingredient – ADR associations resolved by month.
- https://doi.org/10.7554/eLife.25818.014
-
Supplementary file 2
Summary of logistic regression models inspecting the dependence of reporting myocardial infarction on the use of celecoxib (Model 1: the following formula was used in R’s glm() function: has_adr~has_celecoxib), occupation of the party reporting celecoxib to cause myocardial infarction (Model 2: has_adr~has_celecoxib*occupation–occupation), time a celecoxib – myocardial infarction report was filed (Model 3: has_adr~has_celecoxib*before_2005–before_2005), and a combination of occupation and time (Model 4:has_adr~has_celecoxib*occupation*before_2005–occupation*before_2005).
‘Physician’ was used as the reference level in Models 2 and 4 for the variables involving the occupation of the reporting party. Significance codes: 0 ‘***’ 0.001 ‘**’ 0.01 ‘*’ 0.05 ‘.’ 0.1 ‘‘1. The ‘:’ symbol separating two variable names denotes a variable representing an interaction between these two variables.
- https://doi.org/10.7554/eLife.25818.015
-
Supplementary file 3
The Bayesian calculations used the program Empirica Signal and the version of FAERS offered commercially by Oracle Health Sciences.
The Oracle algorithms for detection of duplicate reports and determination of generic drug names yield slightly different counts than does the data preparation method described in the present paper, although computed adverse event rates are virtually identical. The columns for N, E, and EB05 shown in the table are as calculated by the Oracle program. Columns represent: Drug (Generic name) PT (MedDRA Preferred Term) N (Number of reports including both Drug and PT, 1997–2015, in the Oracle Health Sciences curation of FAERS) E (Expected value of N if Drug and PT are independent within each stratum, where strata are defined by all combinations of gender, age group and year of report) RR (Relative Reporting Rate = N/E) EBGM (Empirical Bayes Geometric Mean of estimated disproportionality) EB05 (Lower limit of Bayesian 90% confidence interval of true disproportionality) EB95 (Upper limit of Bayesian 90% confidence interval of true disproportionality)
- https://doi.org/10.7554/eLife.25818.016
Download links
A two-part list of links to download the article, or parts of the article, in various formats.
Downloads (link to download the article as PDF)
Open citations (links to open the citations from this article in various online reference manager services)
Cite this article (links to download the citations from this article in formats compatible with various reference manager tools)
Reverse translation of adverse event reports paves the way for de-risking preclinical off-targets
eLife 6:e25818.
https://doi.org/10.7554/eLife.25818


