Mechanism of activation at the selectivity filter of the KcsA K+ channel
- University of Basel, Switzerland
- Weill Cornell Medical College, United States
Figures
Figure 1 with 4 supplements

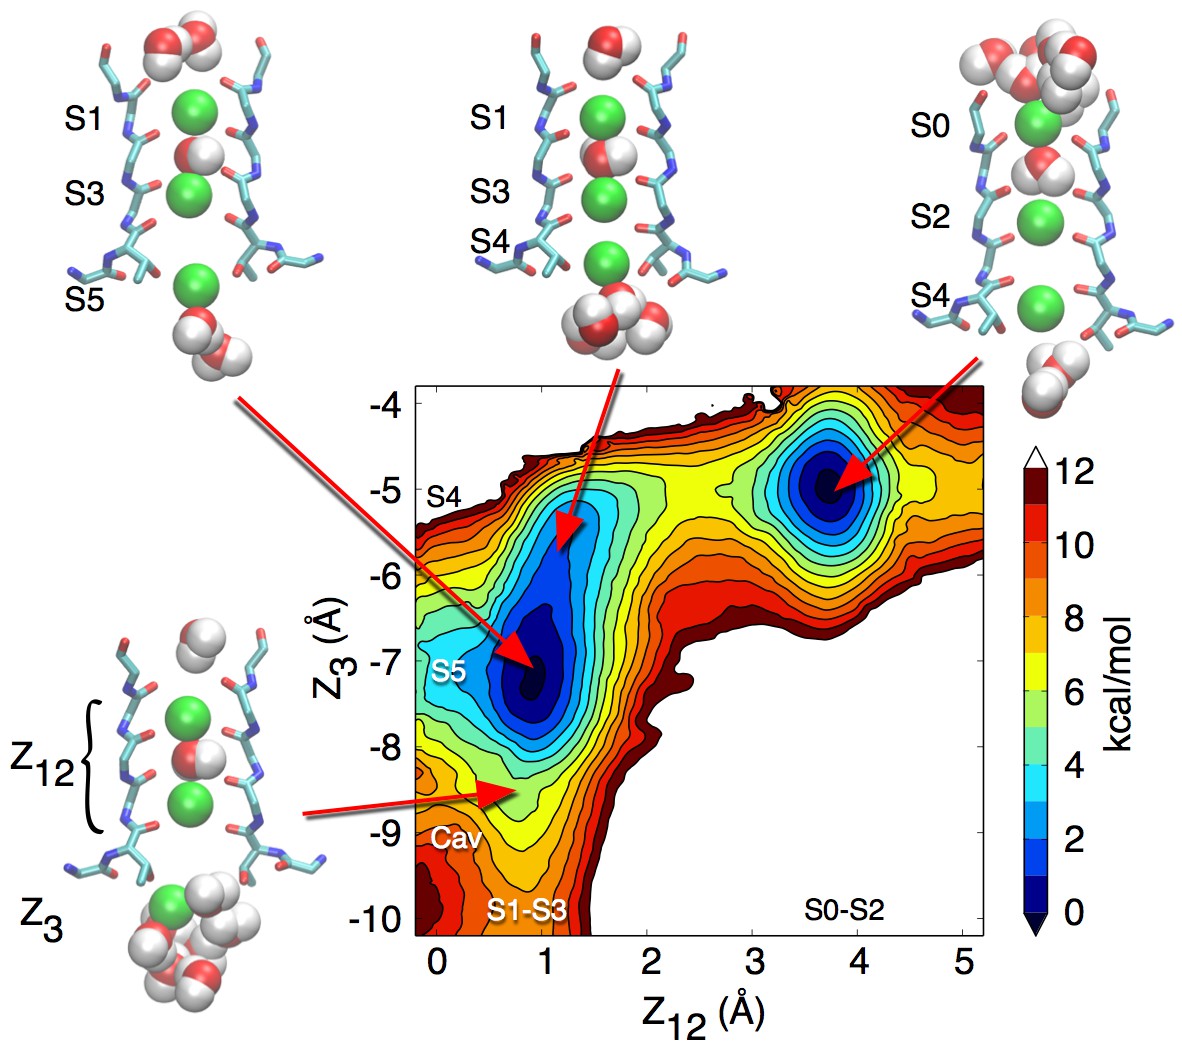
Potential of mean force calculations describing ion permeation through the selectivity filter in the closed and open intracellular gate conformations of the channel.
(A) In the closed conformation (based on structure 1K4C), ions are tightly bound to the selectivity filter in states S1-S3-S5 or S0-S2-S4 with little ion movement due to high free energy barriers > 6 kcal/mol (B) In the open conformation (based on structure 3F5W), ion diffusion is possible due to low free energy barriers of 2–3 kcal/mol. A knock-on transition state (S1–S3–S4) is observed (identified by (∗)). The reaction coordinate Z12 corresponds to the center-of-mass of the two outermost ions, and Z3 to the lower ion. Ion positions are defined relative to the center-of-mass of the backbone atoms of the selectivity filter core residues (Thr75-Val76-Gly77-Tyr78). Molecular structures illustrate two of the four channel subunits and for the key states, K ions and water molecules (green and red/white spheres, respectively) are shown with the selectivity filter backbone of residues Thr74 to Gly79.
Figure 1—figure supplement 1
Potential of mean force describing ion permeation in the selectivity filter of the closed KcsA channel starting from the S1-S3-Cav occupancy state.
When an ion moves from the cavity to the S4 binding site, no water molecule is seen between this ion and the one in S3. The S4 binding site seems to be too small in volume and not flexible enough to hold both an ion and a water molecule, which is observed in the open structure.
Figure 1—figure supplement 2
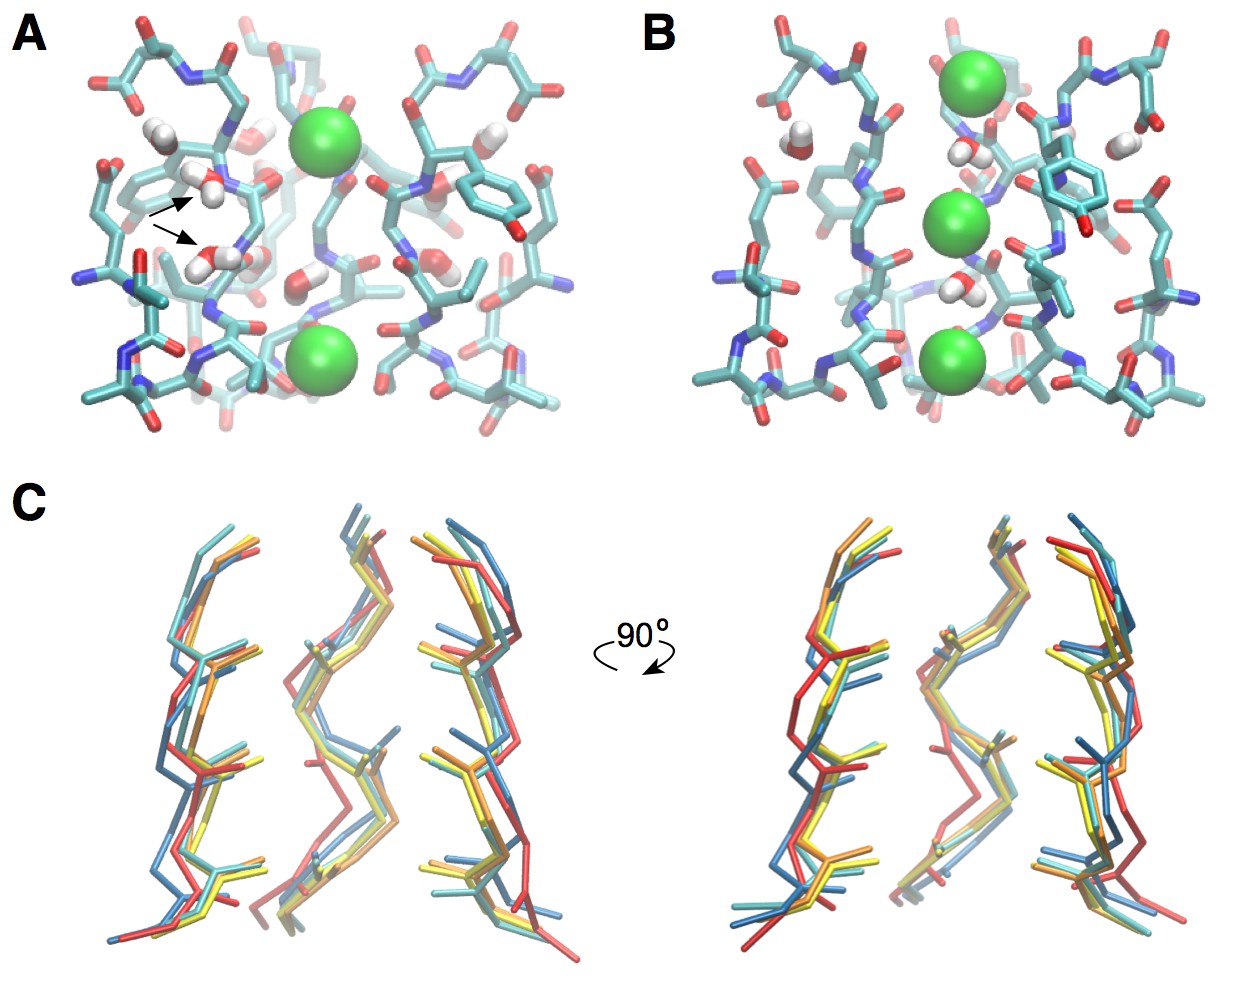
Modeling of the open-activated selectivity filter based on open-inactivated structures.
(A) A network of water molecules found around the permeation pore stabilizes the collapsed, inactivated state of the selectivity filter. Water molecules bridge the subunits at the level of residues Val76 and Gly77. Removing, in all subunits, the water molecules indicated by the black arrows allow for the reorientation of the Val76/Gly77 amide plane. The canonical form of the selectivity filter is then spontaneously retrieved, as shown in (B). This construct was used for the calculation of the PMF presented in Figure 1B. For clarity, only three of the four subunits are shown. (C) A superimposition of the X-ray structure in the closed state (pdb entry 1K4C) and representative conformations taken from simulations shows that the selectivity filter deviated only slightly from the canonical structure. Yellow, closed structure (pdb entry 1K4C); orange, simulation of the closed structure; cyan and dark blue, simulation of the open structure; red, simulation of the closed structure using the CHARMM22 force field. The backbone atoms of residues 75 to 78 are shown.
Figure 1—figure supplement 3
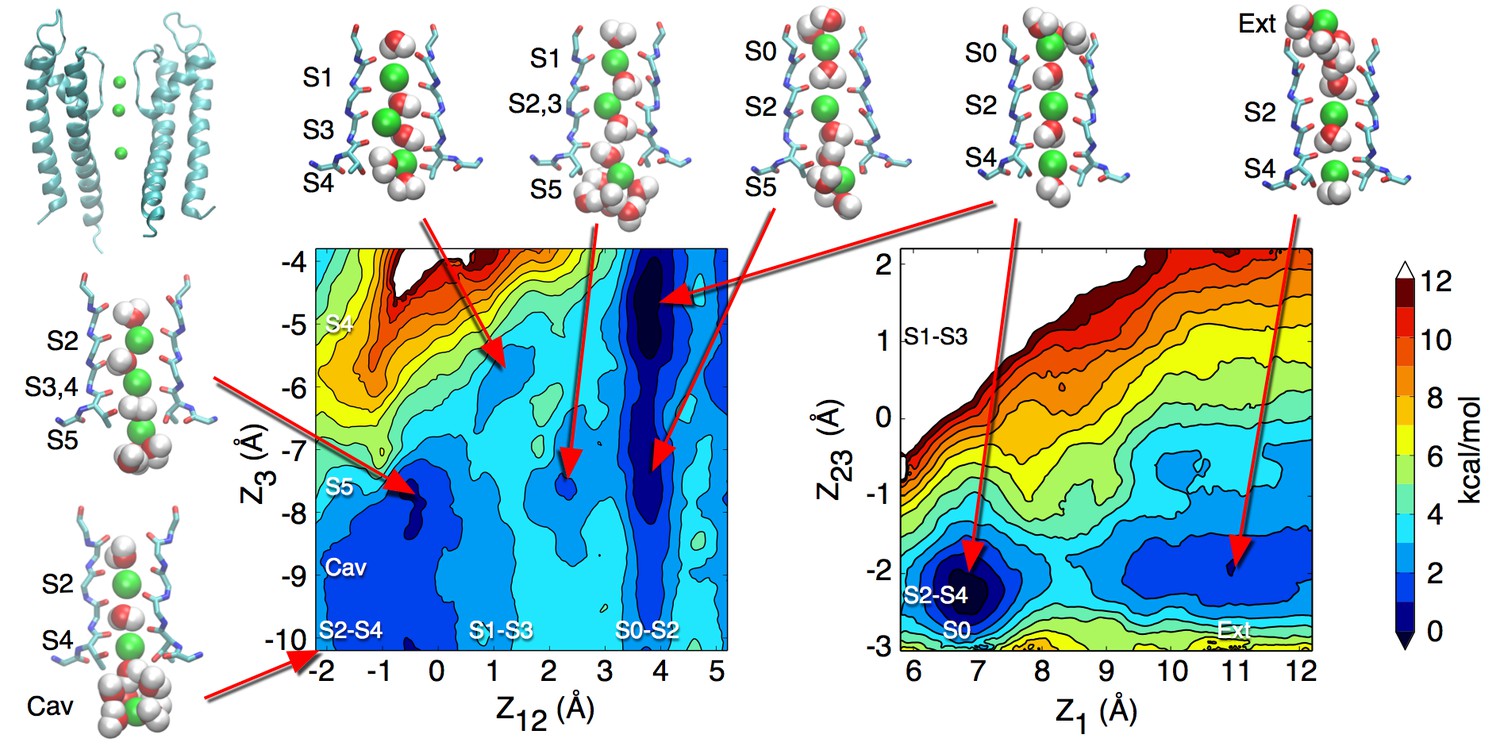
Potential of mean force describing ion permeation in the open channel.
The free energy map on the left is identical to the one presented in Figure 1B and describes the recruitment by the selectivity filter of an ion coming from the cavity. The map on the right describes the release of an ion from the selectivity filter to the external bulk. The reaction coordinates for this second PMF are Z1, the position along the channel axis of the outermost ion, and Z23, the position of the center-of-mass of the lower two ions, both in reference to the center-of-mass of the selectivity filter (residues 75 to 78). Note that when only two ions remain in the selectivity filter, state S2-S4 is favored. The entrance of a third ion in the cavity allows the transition to the S1-S3 state.
Figure 1—figure supplement 4
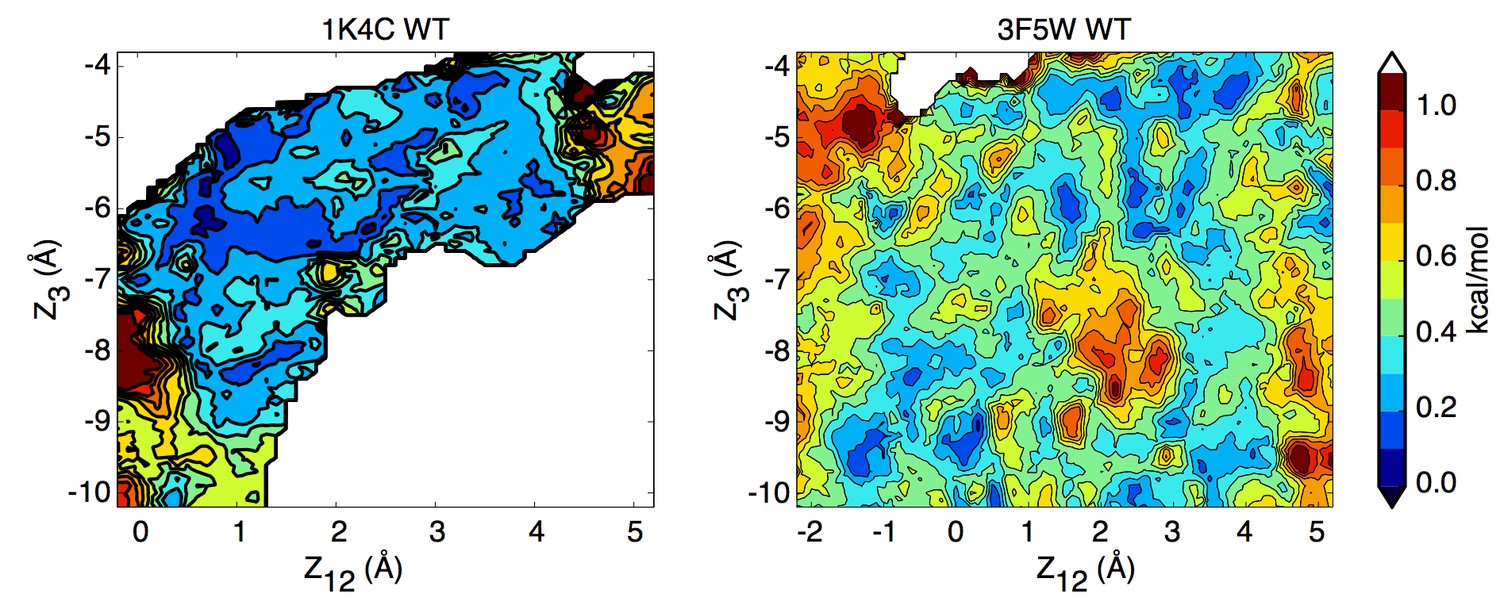
Standard deviation for the PMFs presented in Figure 1.
Each standard deviation map is calculated from an ensemble of five PMFs calculated on intervals of 100 ps.
Figure 2
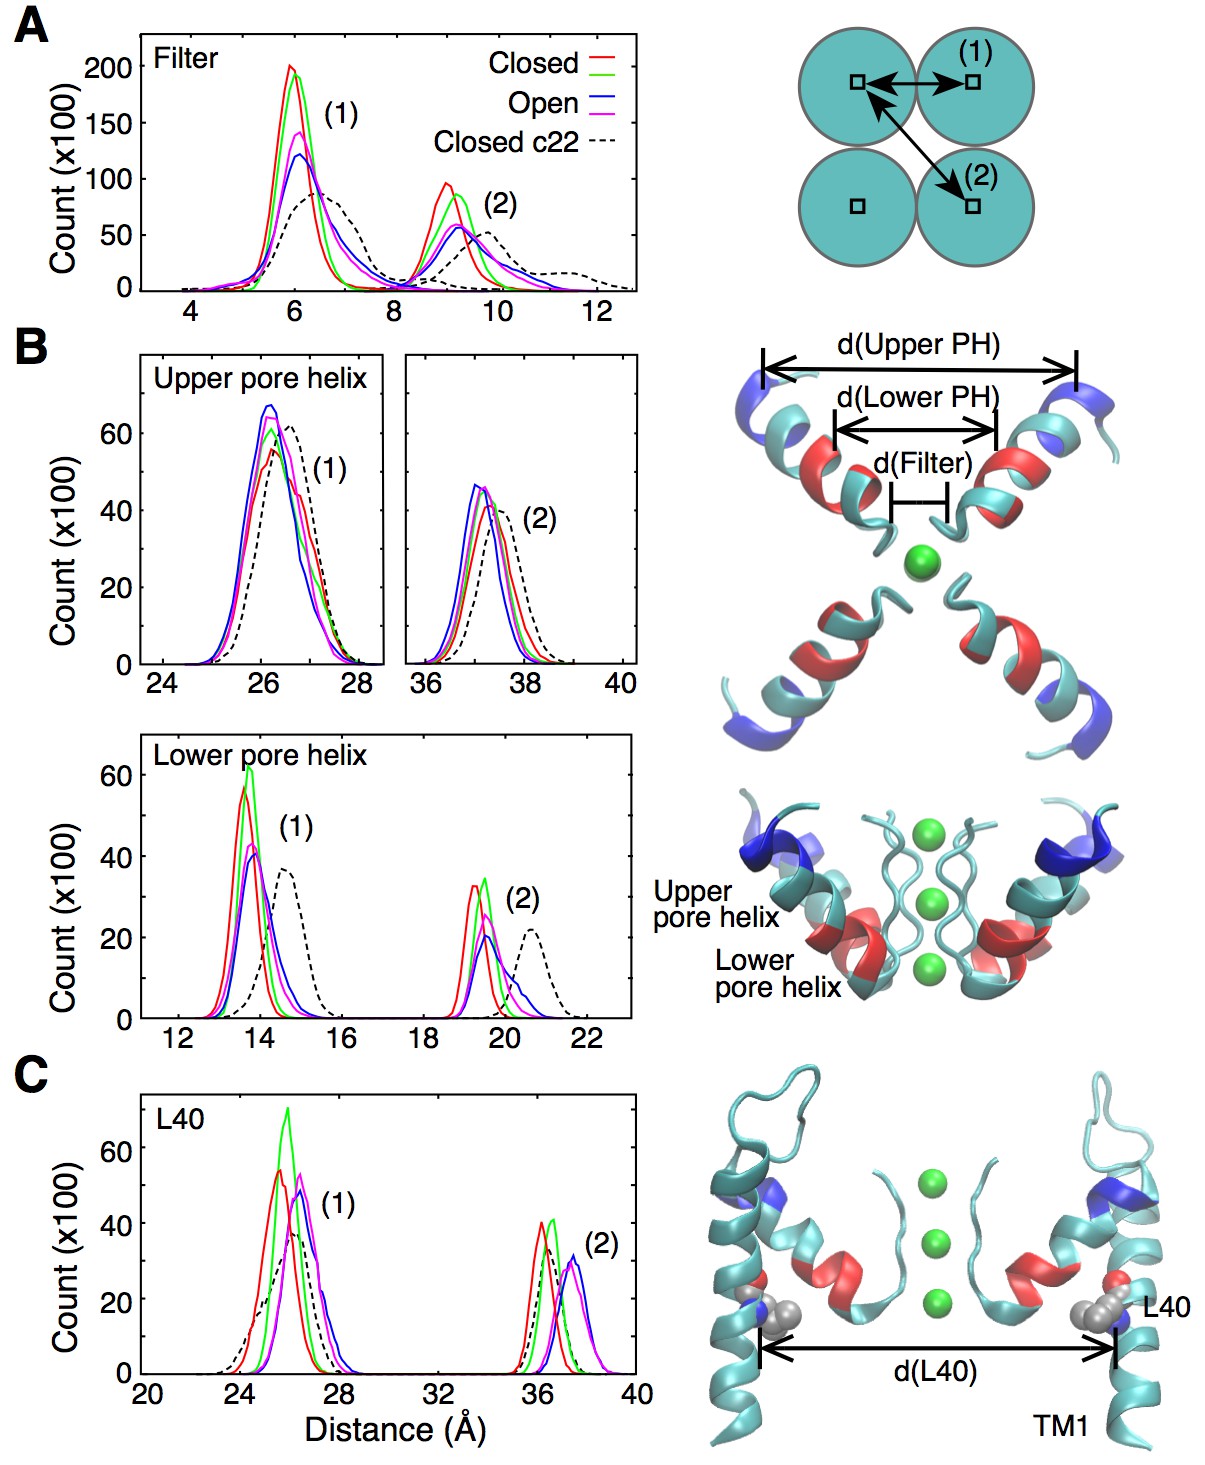
Fluctuations around the selectivity filter.
(A) The histogram shows the inter-subunit, adjacent (1) and opposite (2), distances between the Cα atoms of residues 75 to 78. In the open state of the channel (two independent simulations shown in blue and pink), the selectivity filter can reach conformations that are wider by up to 1 Å in comparison to the closed state (red and green lines). Simulations of the closed channel using the CHARMM22 force field resulted in broader distance distributions (dashed lines) than those obtained with CHARMM36 force field in both the closed and open states. (B) The inter-subunit distances between the center-of-mass of the Cα atoms of the upper pore helix (residues 62 to 65) show little changes between the closed and open states of the channel. By contrast, the distances increase by up to 1 Å at the level of the lower pore helix (residues 70 to 73). The closed channel with the CHARMM22 force field also displays longer distances at the level of the lower pore helix. Bottom and side views of the selectivity filter and the pore helix (PH) are shown with the upper and lower pore helix segments colored in blue and red, respectively. K ions are shown in green. (C) The histogram shows that the inter-subunit distances between the Cα atoms of the L40 residues, increase by about 1 Å upon opening of the intracellular gate. The CHARMM22 force field has no impact on the L40 distances in the closed channel. For both the open and closed states, two independent 20-ns long simulations were analyzed. The CHARMM22 simulation data were taken from Bernèche and Roux (2001).
Figure 3
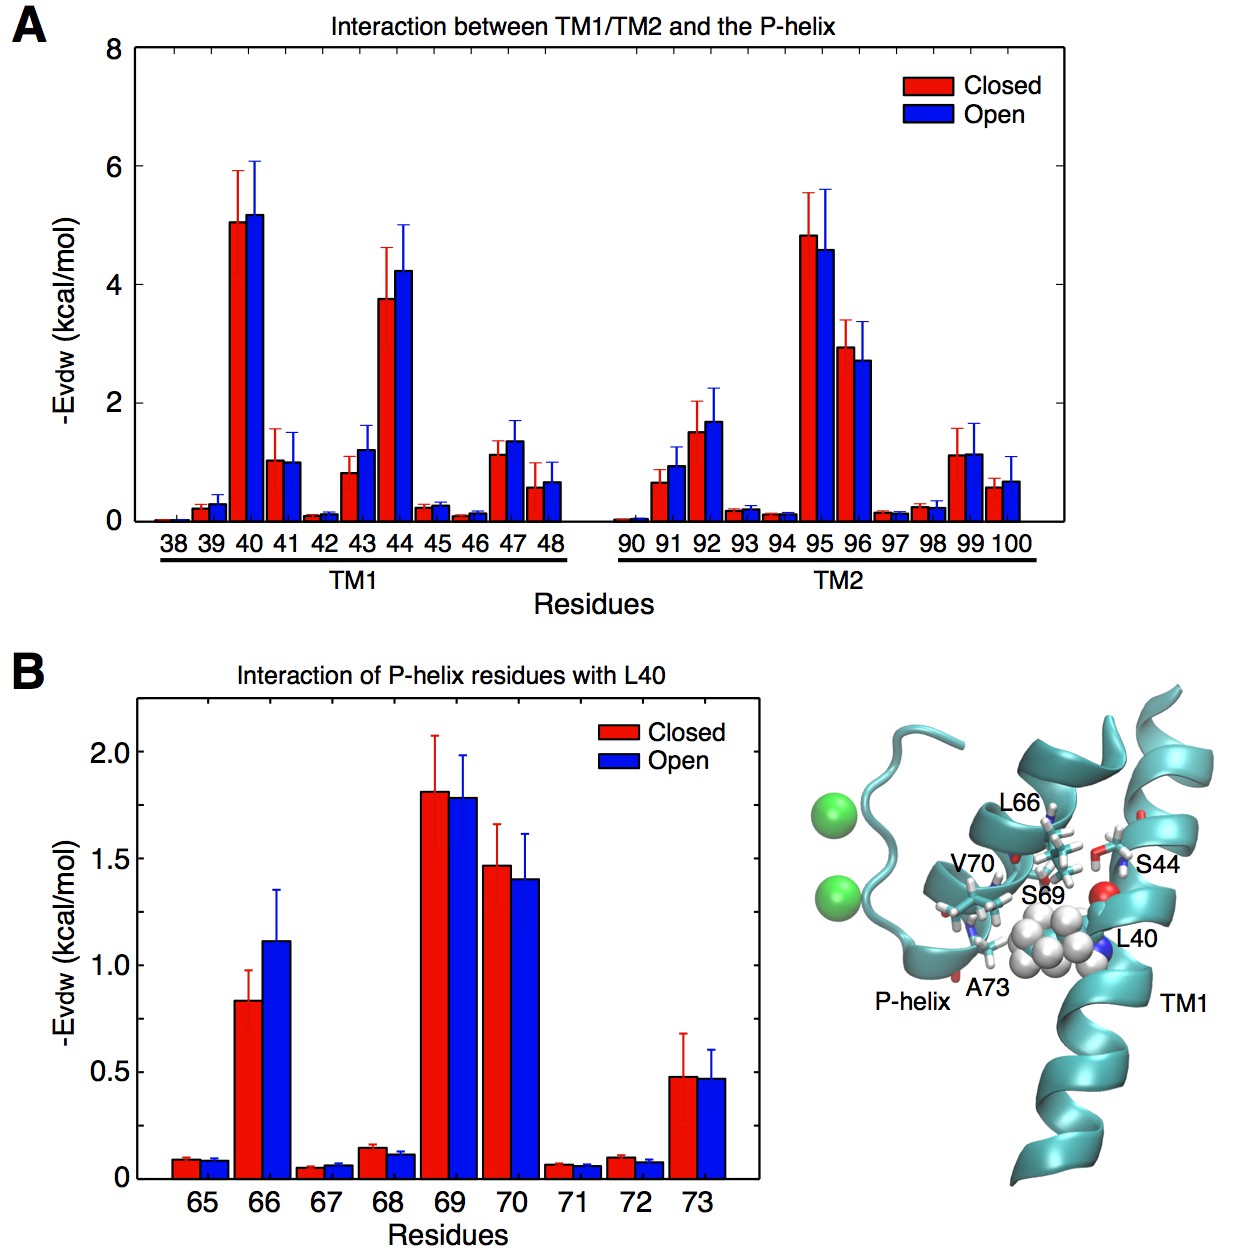
Contacts between the TM helices and the pore helix that can potentially transmit the activation signal.
(A) vdW interactions of the individual residues of the TM1 and TM2 helices with the pore helix. Residue Leu40 from TM1 forms the strongest interactions. Interactions involving Ser44 are also important, but this residue forms an intra-helix H-bond with the backbone of Leu40 and thus was not mutated. The interaction of Leu40 with the pore helix is along an axis directed toward the permeation pore, and can thus potentially impact on the pore size. Residues from TM2 also interact with the pore helix, but these interactions are not directed toward the pore, and thus were not further investigated. (B) Leu40 interacts with the bottom of the pore helix, mainly at the level of residues Ser69, and Val70.
Figure 4
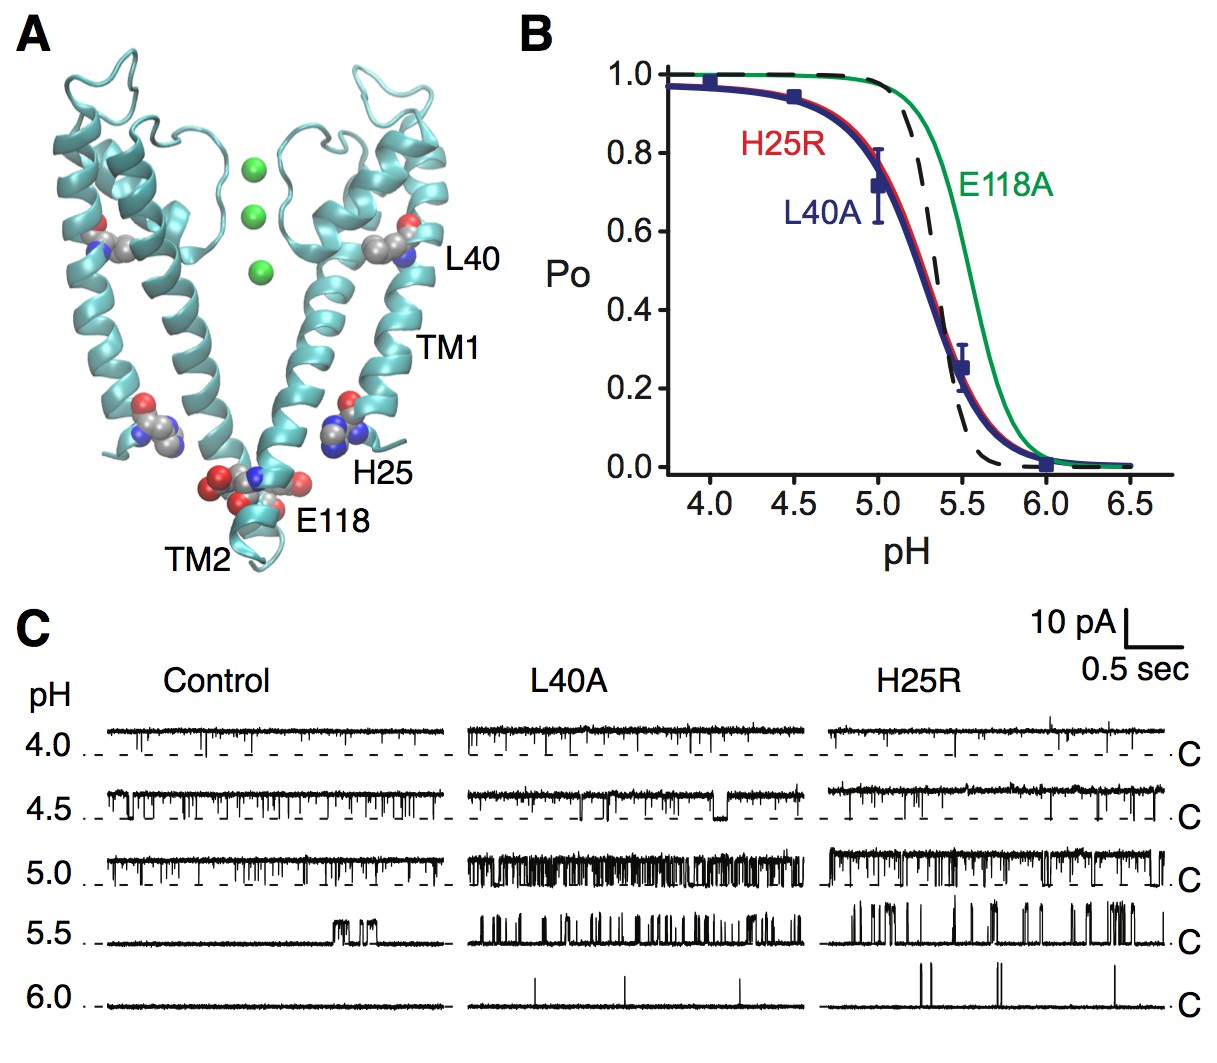
Coupling of the selectivity filter to the intracellular gate via residue L40.
(A) The pH sensor residues, H25 and E118, are found on the intracellular side of the channel. Residues H25 and L40 both lie on the transmembrane helix TM1. (B) KcsA L40A open probability (Po) vs. pH from single channel recording (blue symbols) was fit to a model for pH-dependent gating (Equation 1, blue line). Data are the mean from 4 or 5 bilayers ± sem. Previously reported dose response curves (Thompson et al., 2008) for the E71A control channel (dashed line), pH sensor mutants H25R (red) and E118A (green) are provided for comparison (Table 1). (C) Representative single channel traces at pH values 4 to 6 and 100 mV for the E71A (Control, left), E71A/L40A (center), and E71A/H25R (right) channels, illustrating that the L40A mutant, similar to H25R, opens at lower [H+] (pH 6 and 5.5) compared to E71A control. Traces were filtered offline (100 Hz) for display. The identity of the gates that open and close during the single-channel recordings is unknown.
Figure 5 with 5 supplements
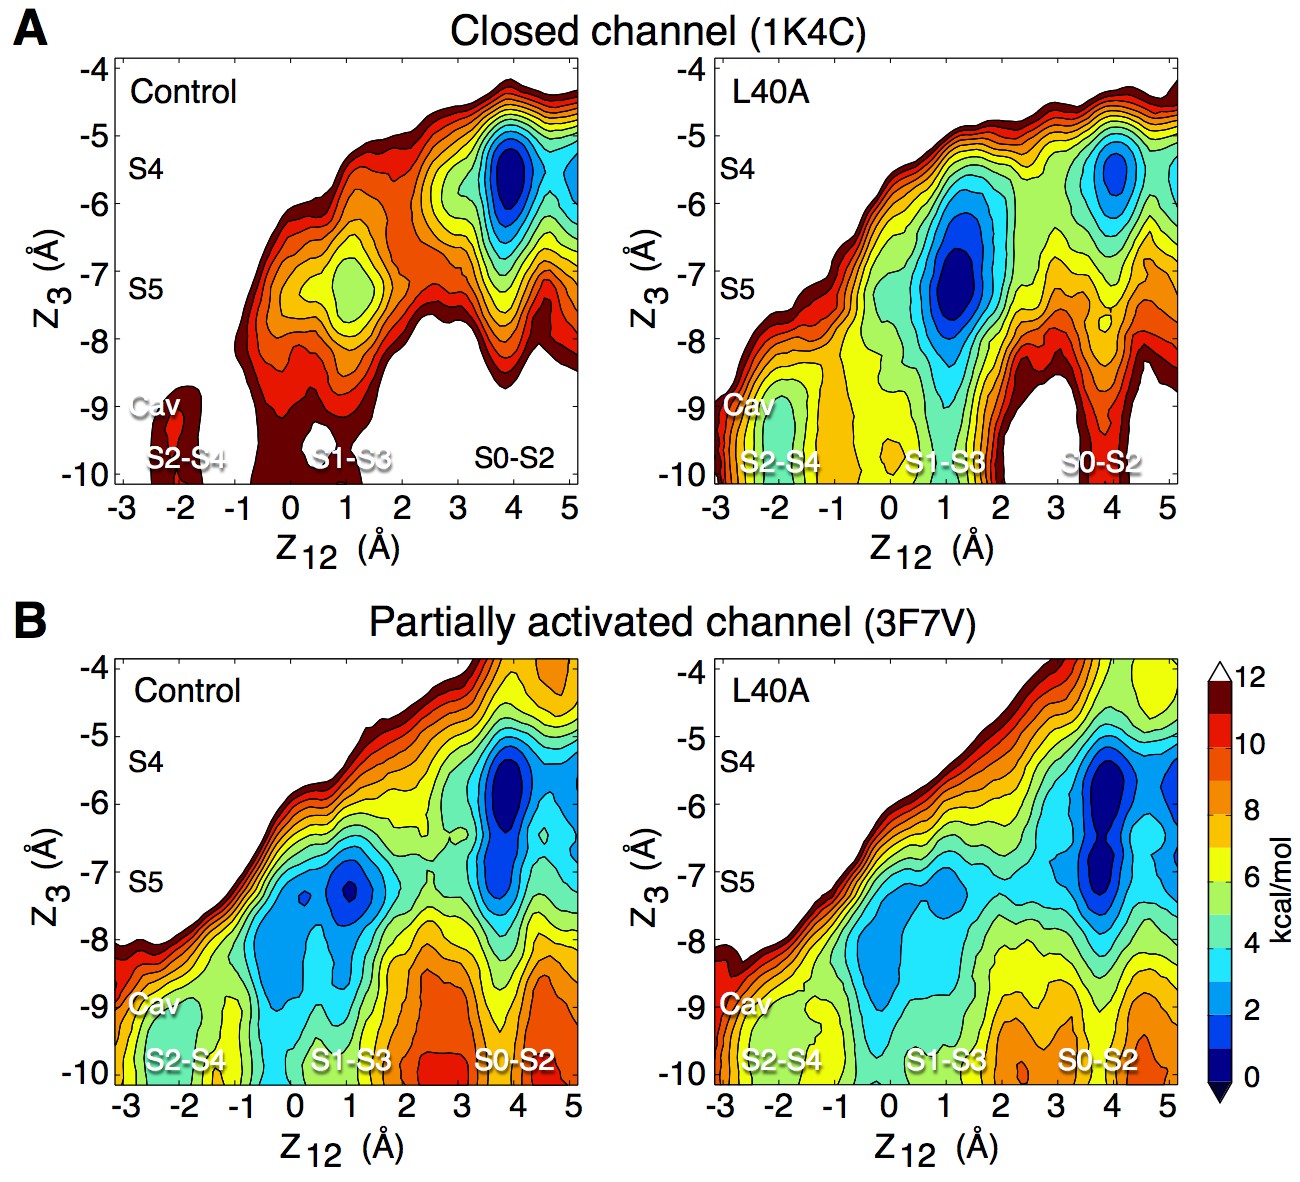
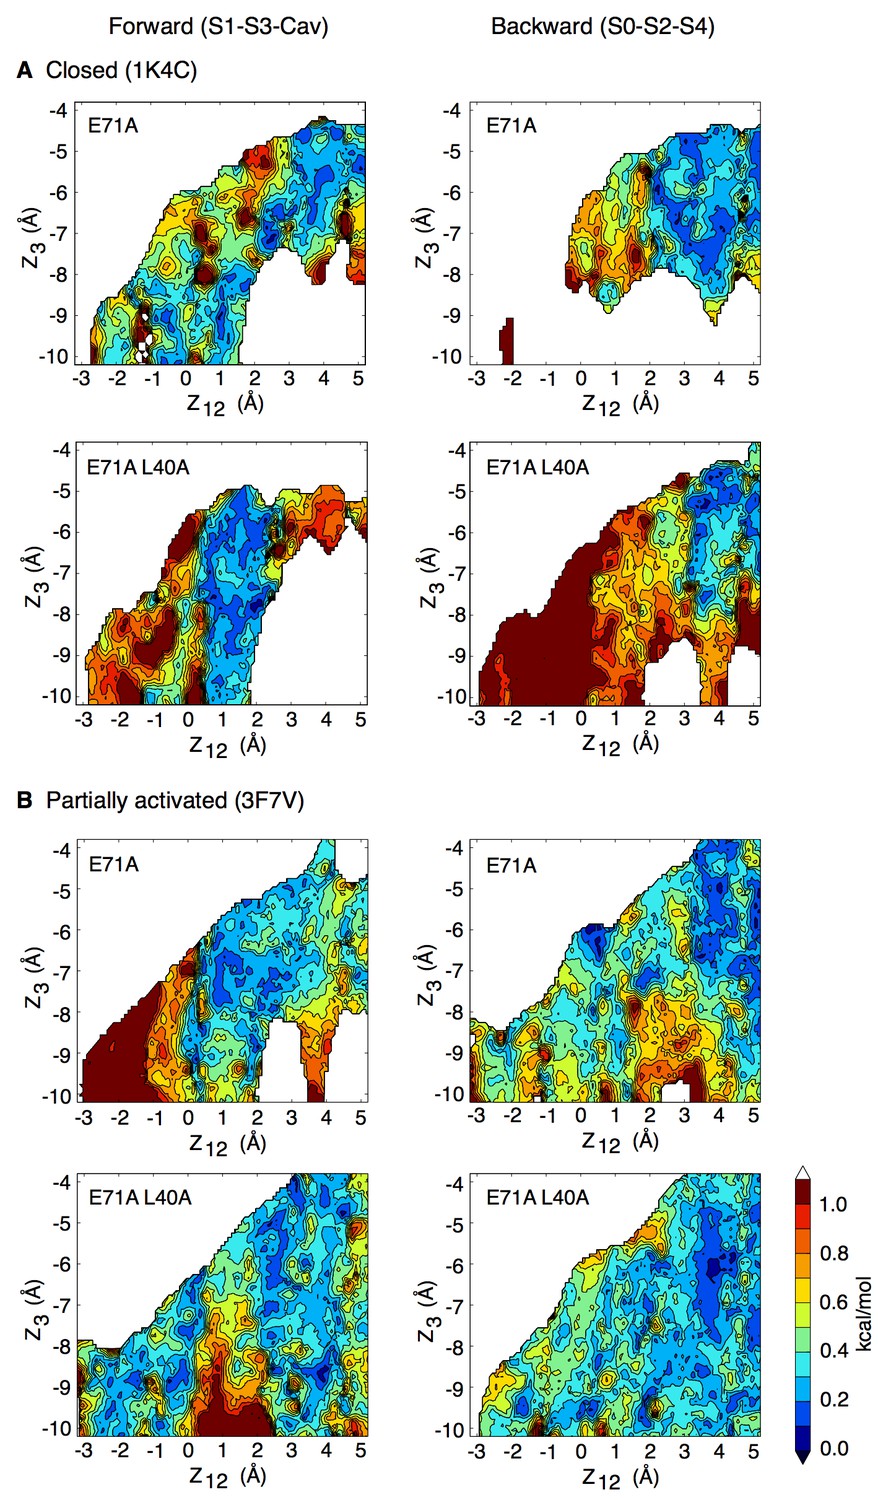
Impact of the L40A mutation on ion permeation in the closed and partially activated channel.
(A) The PMF calculations show that when the intracellular gate is closed (pdb entry 1K4C), ion diffusion is impeded in the control channel (E71A) with a free energy difference between the 3-ion (S0–S2–S4) and the 2-ion (S1-S3-Cav and S2-S4-Cav) states of about 11 kcal/mol, and free energy barriers of up to 9 kcal/mol between these states. The L40A mutation stabilizes the 2-ion states by about 6 kcal/mol and reduces the free energy barriers to 4–5 kcal/mol. (B) In the partially activated structure (pdb entry 3F7V), both constructs show reduced free energy barriers of 4 kcal/mol for the control and 2–3 kcal/mol for the L40A mutant. Each of the 4 PMFs shown here combines together data from two independent automated umbrella-sampling simulations initiated in states S1-S3-Cav and S0-S2-S4, respectively. Since the statistical error on the PMFs combined in this fashion might not be readily definable, we only present the statistical errors associated with the underlying individual PMFs (Figure 5—figure supplement 1, 4 and 5). Despite this limitation, the combined PMFs shown here provide a convenient summary of the underlying calculations presented separately in Figure 5—figure supplement 1.
Figure 5—figure supplement 1
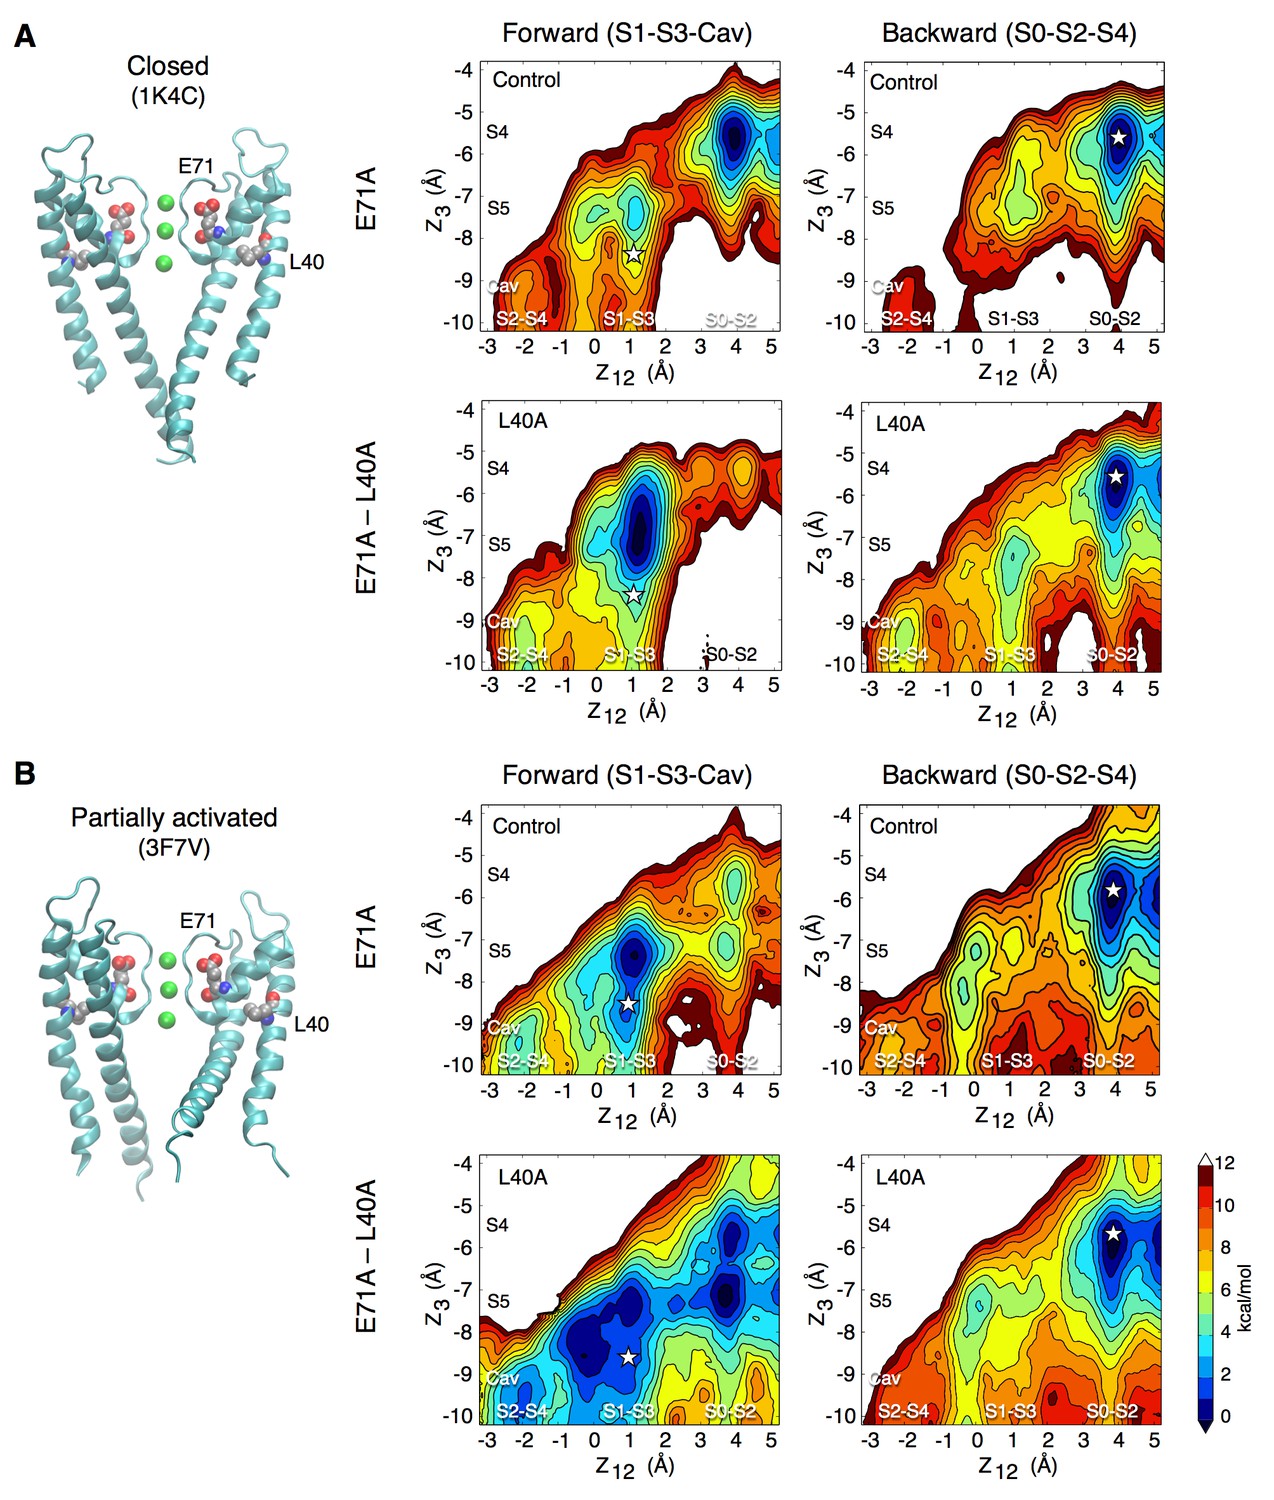
Forward and backward PMFs of the transition between the S1-S3-Cav and S0-S2-S4 ion occupancy states in the control and L40A mutant channels for (A) the closed (1K4C) and (B) the partially activated (3F7V) conformations.
The forward transition, from S1-S3-Cav to S0-S2-S4, is plotted on the left. The starting occupancy state is stated in parentheses (S1-S3-Cav) and identified by a star on the plots. On the right is shown the inverse transition, from S0-S2-S4 to S1-S3-Cav. In the case of the closed channel (A), the main impact of the L40A mutation is to make accessible the states in which only two ions are bound to the selectivity filter (states S1-S3-Cav and S2-S4-Cav). The closed structure has such a high ion-binding affinity that it over-stabilizes the state with three ions bound to the filter (S0–S2–S4). The L40A mutation adds fluctuations that reduce the binding affinity and the relative stability of the 3-ion state. In the partially activated channel (B), the main impact of the mutation is to reduce the free energy barrier along the permeation pathway. The free energy maps are presented as in Figure 1, and statistical errors are shown in Figure 5—figure supplements 4 and 5.
Figure 5—figure supplement 2
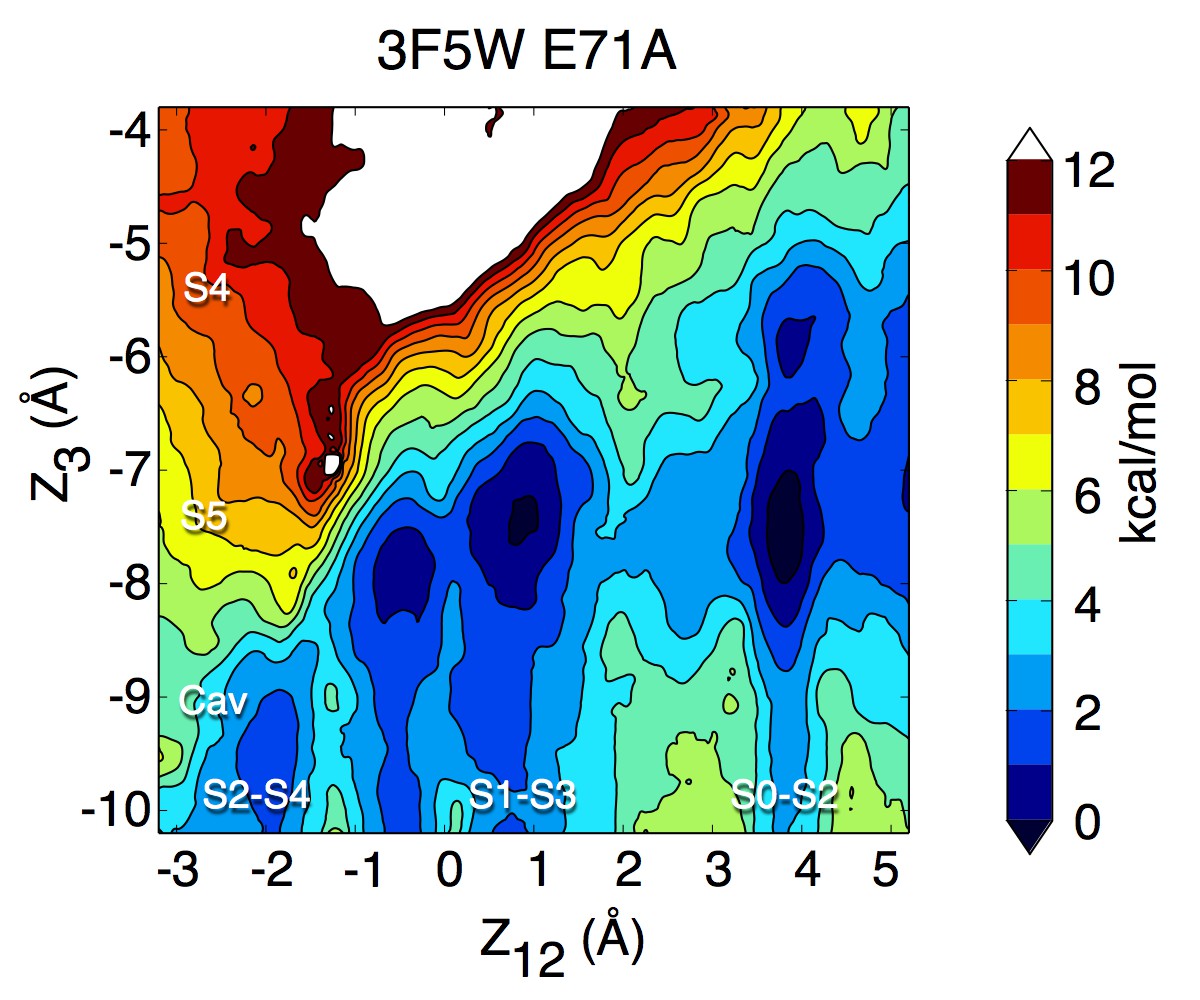
Potential of mean force calculation describing ion permeation in the E71A mutant in the fully open conformation (pdb entry 3F5W).
The PMF is presented as in Figure 1.
Figure 5—figure supplement 3
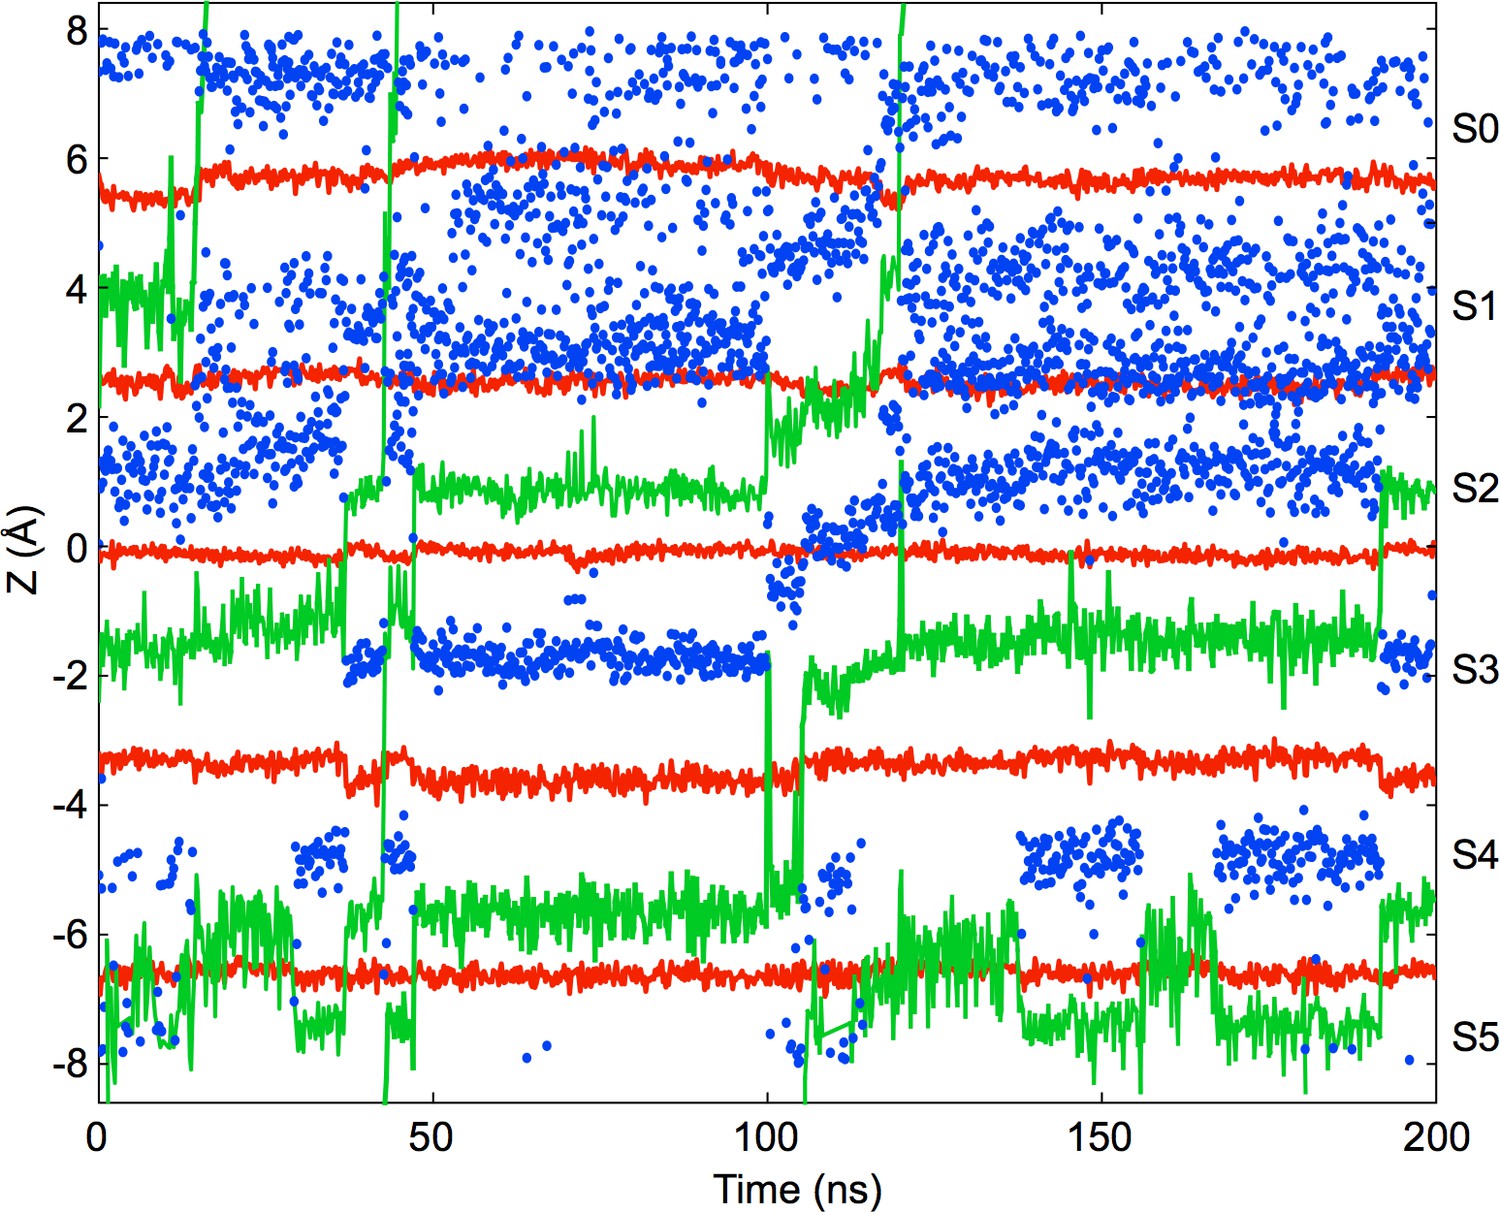
Ion permeation in the partially activated channel with the L40A mutation.
Ion trajectories are shown for a simulation of the E71A/L40A double mutant in the partially activated conformation (pdb entry 3F7V) using a transmembrane voltage of 400 mV and an ion concentration of 800 mM KCl. The observed permeation events involved at most three ions bound to the selectivity filter with intercalated water molecules. K ion positions within the filter (Z coordinate with origin at the selectivity filter center of mass) are indicated in green, water molecules in blue, and the oxygen atoms defining the ion binding sites in red (from bottom to top: Thr75 OH, Thr75 O, Val76 O, Gly77 O, Tyr 78 O). The binding sites are indicated on the right side of the plot.
Figure 5—figure supplement 4
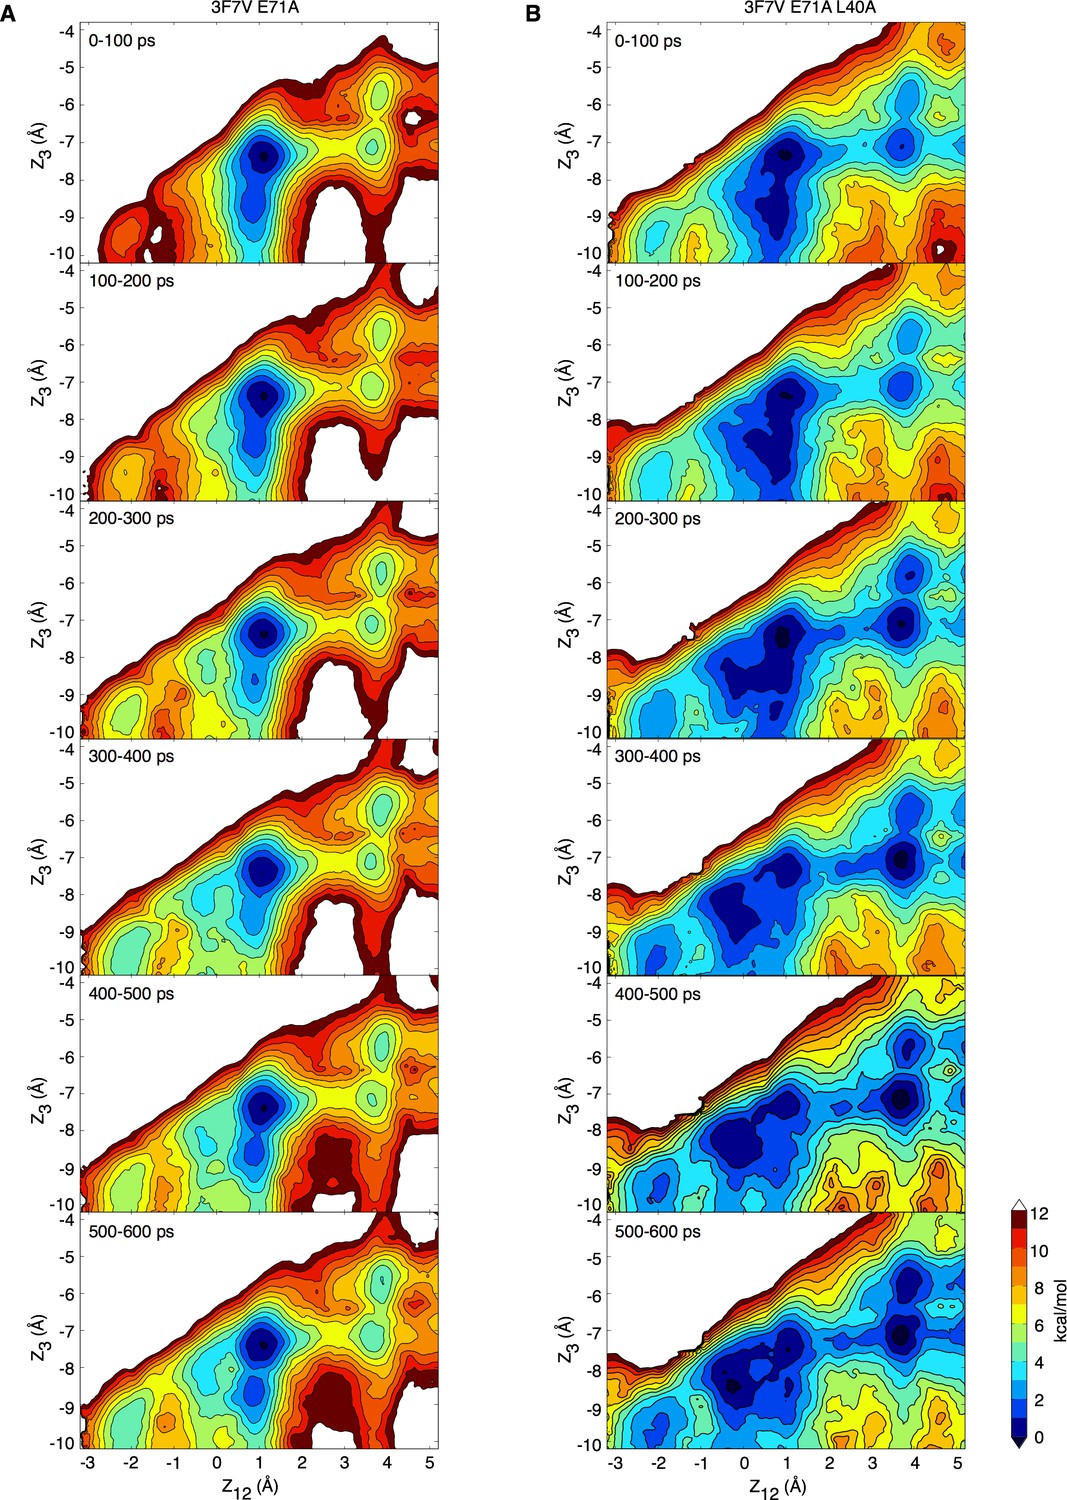
Convergence of the potential of mean force calculations.
(A, B) The sampling for the forward (initial state: S1-S3-cav) PMFs based on the partially activated structure (pdb entry 3F7V) presented in Figure 5—figure supplement 1 has been split in 100 ps intervals. The PMFs calculated for such intervals are shown for the E71A (A) and E71A/L40A (B) constructs.
Figure 5—figure supplement 5
Standard deviation for the PMFs presented in Figure 5—figure supplement 1.
Each standard deviation map is calculated from an ensemble of five PMFs calculated on intervals of 100 ps.
Figure 6
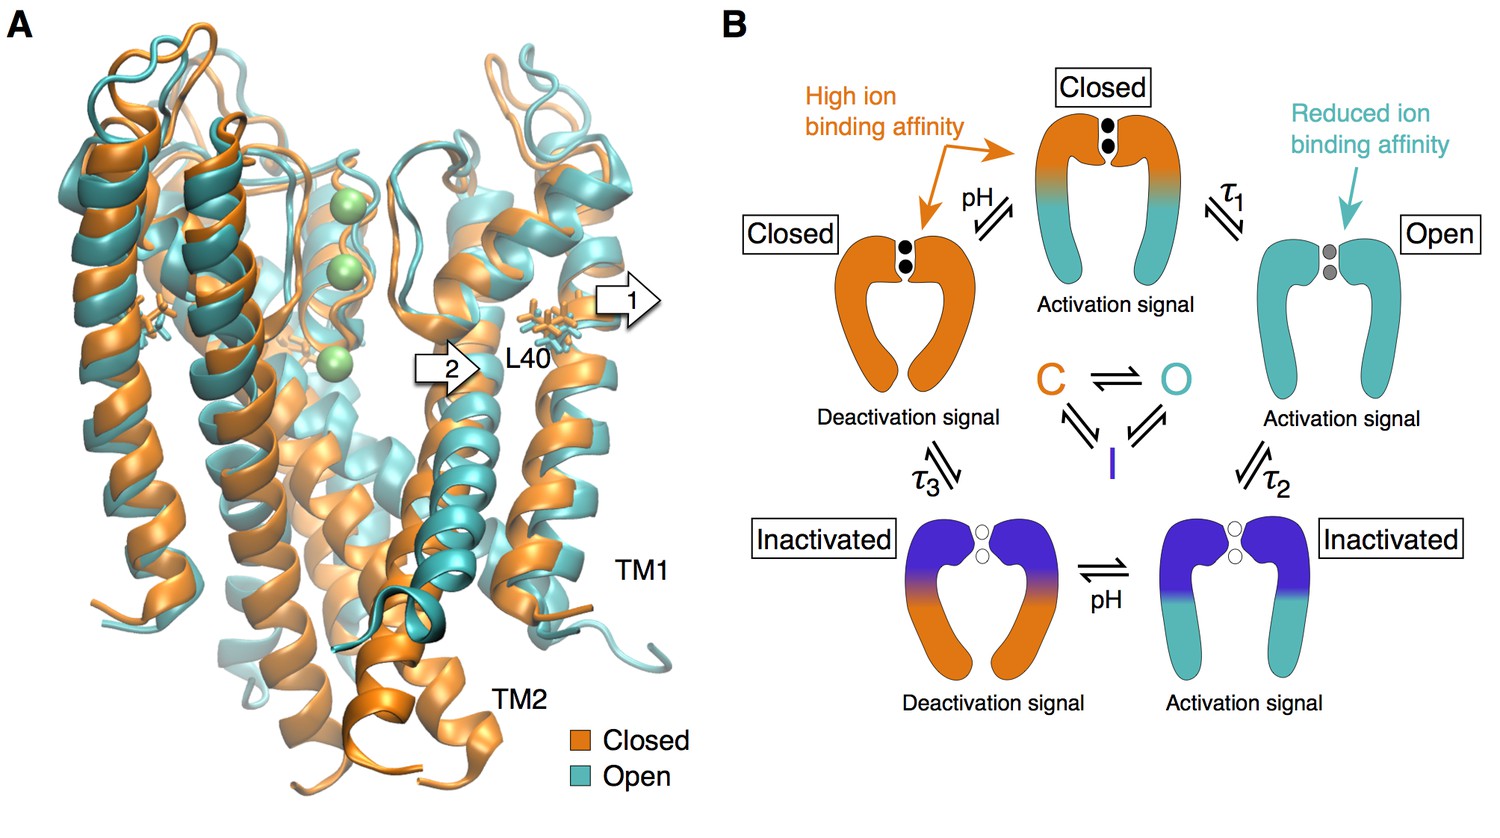
The selectivity filter as the center of the activation mechanism.
(A) The superposition of the open and closed channel illustrates how the movement of the TM1 helices (arrow 1) allows for the displacement of the pore helix and slight expansion of the selectivity filter (arrow 2). (B) The selectivity filter is found in three states (closed (resting), open, inactivated) that determine the functional state of the channel. The TM helices transmit to the selectivity filter the activation signal coming from a ligand- or voltage-dependent domain. The crossing of the TM helices on the intra-cellular side of the pore can form a steric barrier, but is not strictly essential to the function of K channels.
Tables
Table 1
Summary of Hill and pH-gating model fits for the KcsA mutants indicated.
https://doi.org/10.7554/eLife.25844.011| Mutant* | Hill fit | pH sensor 1 (H25) | pH sensor 2 (E118) | Intrinsic gating | |||
|---|---|---|---|---|---|---|---|
| pH1/2 (±) | nH (±) | pKa1closed (±) | pKa1open (±) | pKa2closed (±) | pKa2open (±) | Lo (±) | |
| E71A† control channel | 5.3 (0.01) | 4.4 (0.1) | 4.8 (N/A)‡ | 7.6 | 5.0 | 6.2 | 2.5E-12 (0.3E-12) |
| L40A | 5.2 (0.02) | 1.9 (0.2) | 7.6§ | 7.6 | 5.0 | 6.2 | 6.2E-4 (0.7E-4) |
| H25R† | 5.3 (0.02) | 1.9 (0.2) | - | - | 5.0 (0.1) | 6.2 (0.1) | 7E-4 (4E-4) |
| E118A† | 5.5 (0.03) | 4.5 (2.8) | 4.8 | 7.6 | - | - | 1.1E-8 (0.1E-8) |
-
*All mutants on the background of E71A.
†Data and fits from Refs. (Thompson et al., 2008) and (Posson et al., 2013a).
-
‡Not applicable; no error given when the parameters were constrained (see Materials and methods).
§The data were fit by abolishing the H25 pKa state-dependence, similar to the H25R mutant.
Additional files
-
Transparent reporting form
- https://doi.org/10.7554/eLife.25844.019
Download links
A two-part list of links to download the article, or parts of the article, in various formats.
Downloads (link to download the article as PDF)
Open citations (links to open the citations from this article in various online reference manager services)
Cite this article (links to download the citations from this article in formats compatible with various reference manager tools)
Mechanism of activation at the selectivity filter of the KcsA K+ channel
eLife 6:e25844.
https://doi.org/10.7554/eLife.25844


