Subterranean mammals show convergent regression in ocular genes and enhancers, along with adaptation to tunneling
- University of Pittsburgh, United States
- Children’s Hospital of Pittsburgh, United States
- University of Pittsburgh School of Medicine, United States
- University of California, United States
Figures
Figure 1
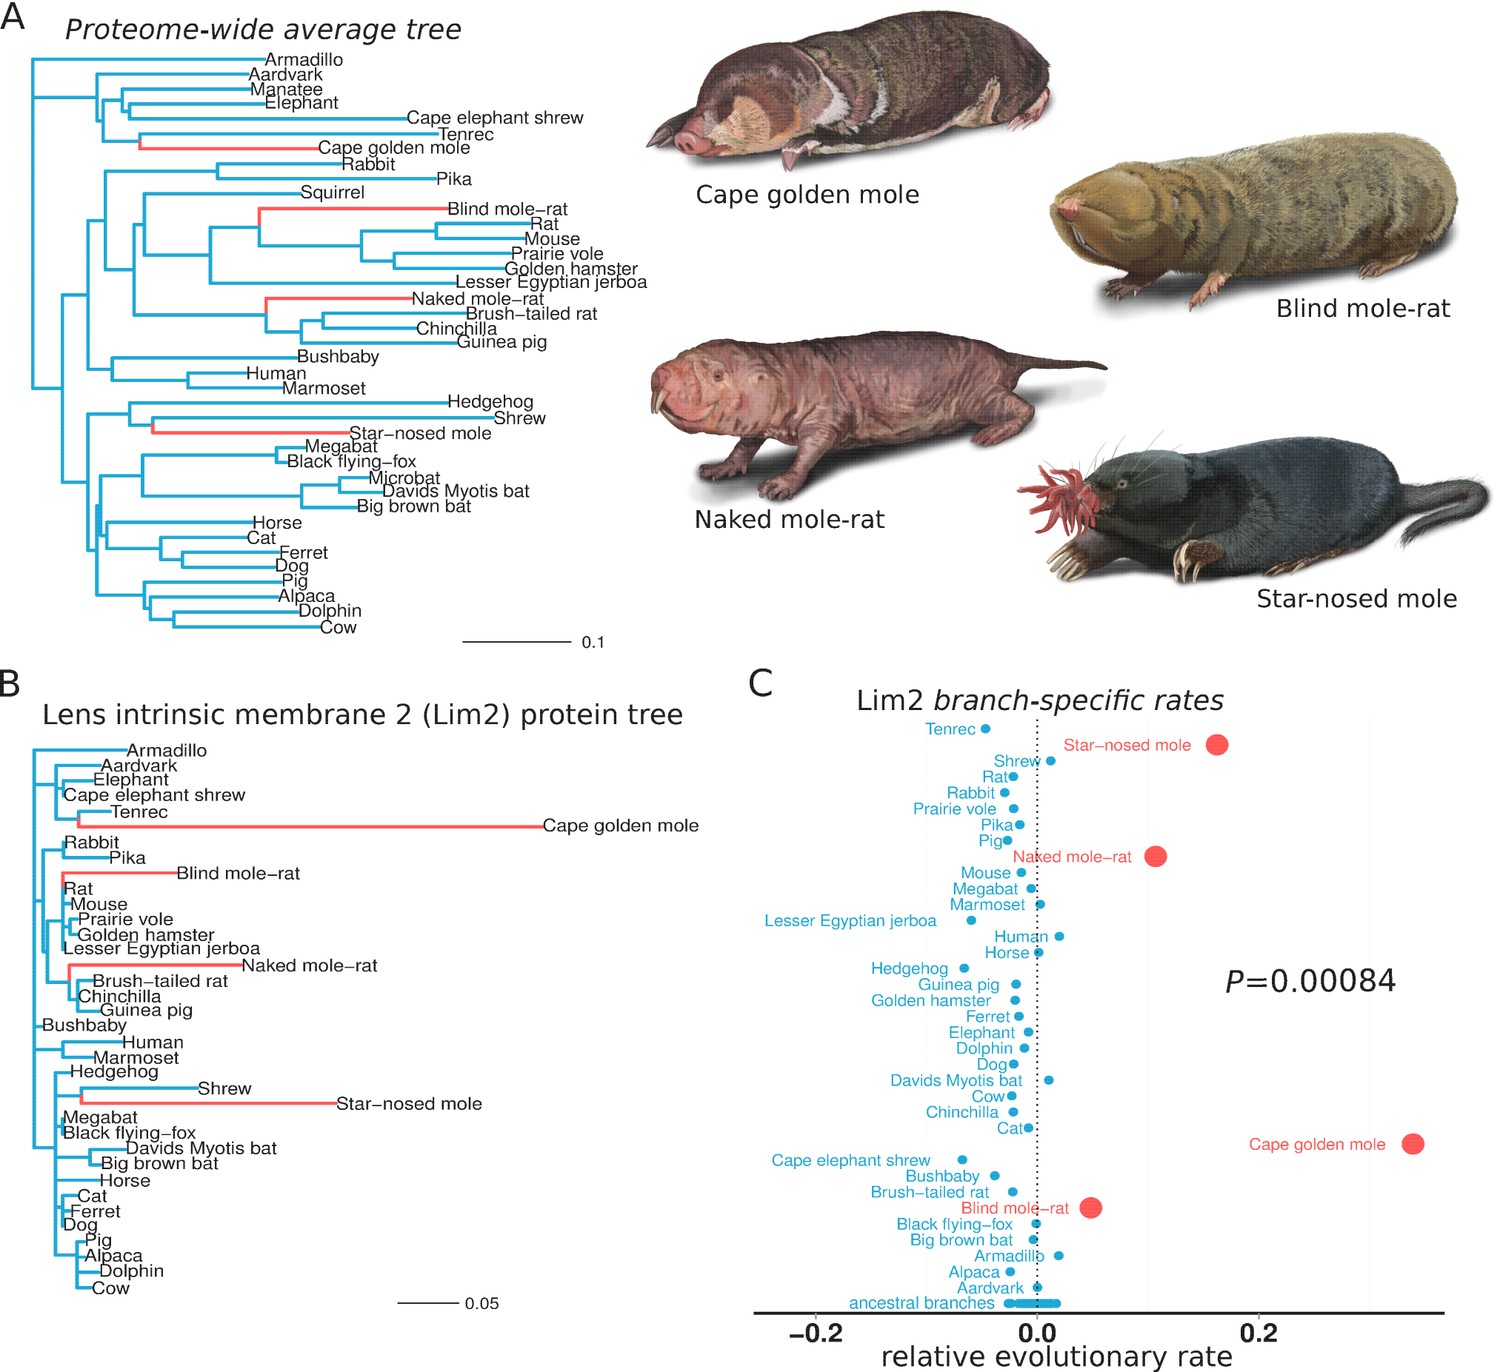
Lens intrinsic membrane protein 2 (LIM2) evolutionary rates across species.
(A) Mammalian transitions to a subterranean environment occurred in four lineages shown in red. The branch lengths on the mammalian tree reflect the average evolutionary rate across 18,980 protein-coding genes. (B) LIM2 protein-coding sequence shows accelerated rates of evolution on subterranean branches compared to those on the proteome-wide average tree. (C) Relative evolutionary rates of LIM2 showed the strongest acceleration on the subterranean branches amongst all of the genes studied. Illustrations by Michelle Leveille (Artifact Graphics).
Figure 2
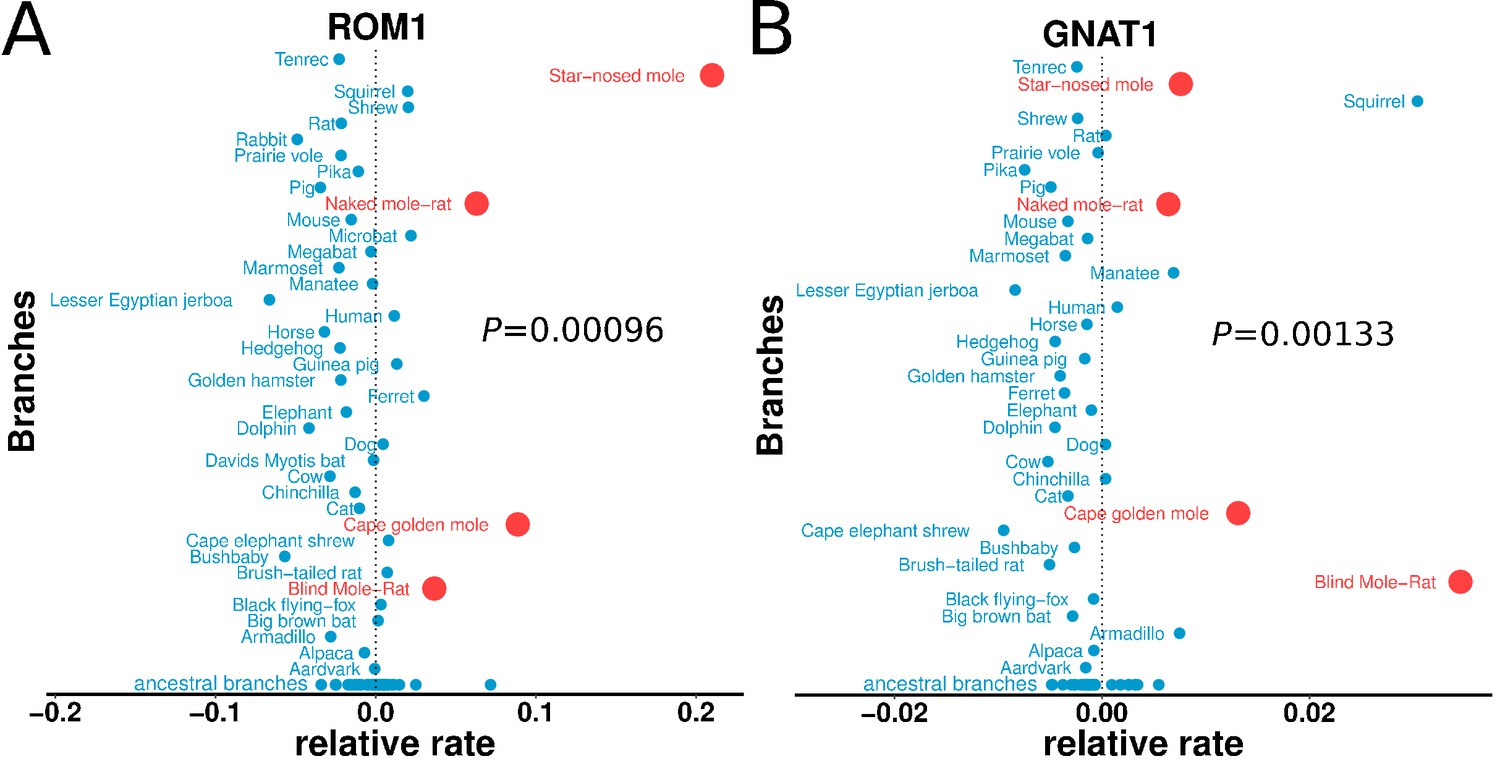
Relative evolutionary rates of two retinal proteins across species.
Relative evolutionary rates of two retinal proteins, (A) Retinal outer segment membrane protein 1 (ROM1) and (B) Rod cell-specific G protein, subunit alpha (GNAT1), show strong acceleration in the subterranean mammals (marked in red).
Figure 3
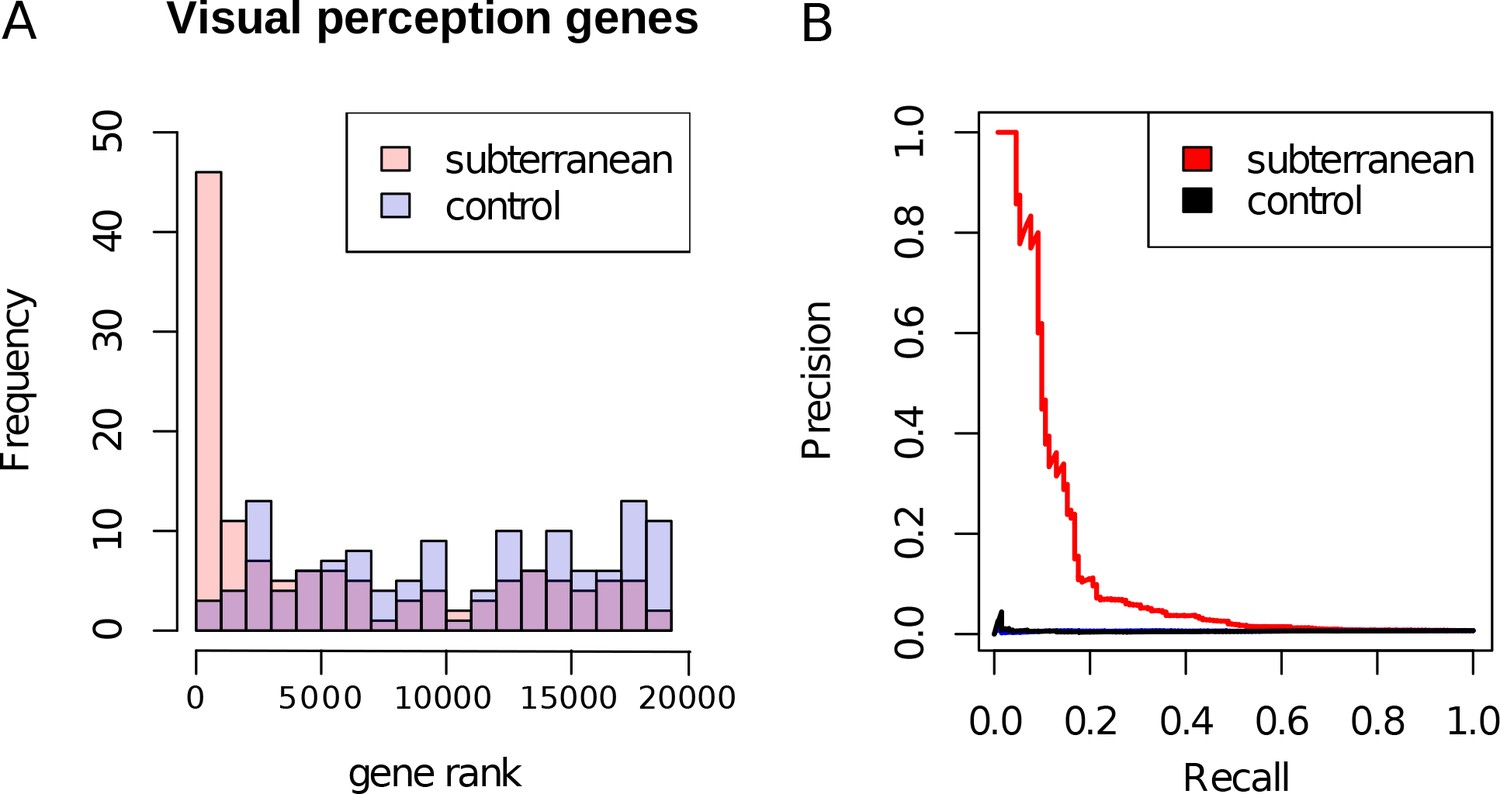
Enrichment of visual perception genes.
(A) Histogram of the rankings of 189 visual perception genes based on their mole-acceleration. We see a clear enrichment of the genes with low rank numbers, reflecting the strong signal of mole-acceleration in visual perception genes. As a control, we use four non-subterranean species, and as expected, genes involved in vision do not show convergent rate acceleration. (B) Mole-acceleration can equivalently serve as a predictor for function in visual perception. The plot shows the Precision-Recall values at varying p-value thresholds reflecting the fraction of visual perception genes significant at a particular threshold (Precision) and the fraction of visual perception genes retrieved at the same threshold (Recall). We see that mole-acceleration specifically identifies visual perception genes with high precision when compared to acceleration in two sets of four non-subterranean control species.
Figure 4
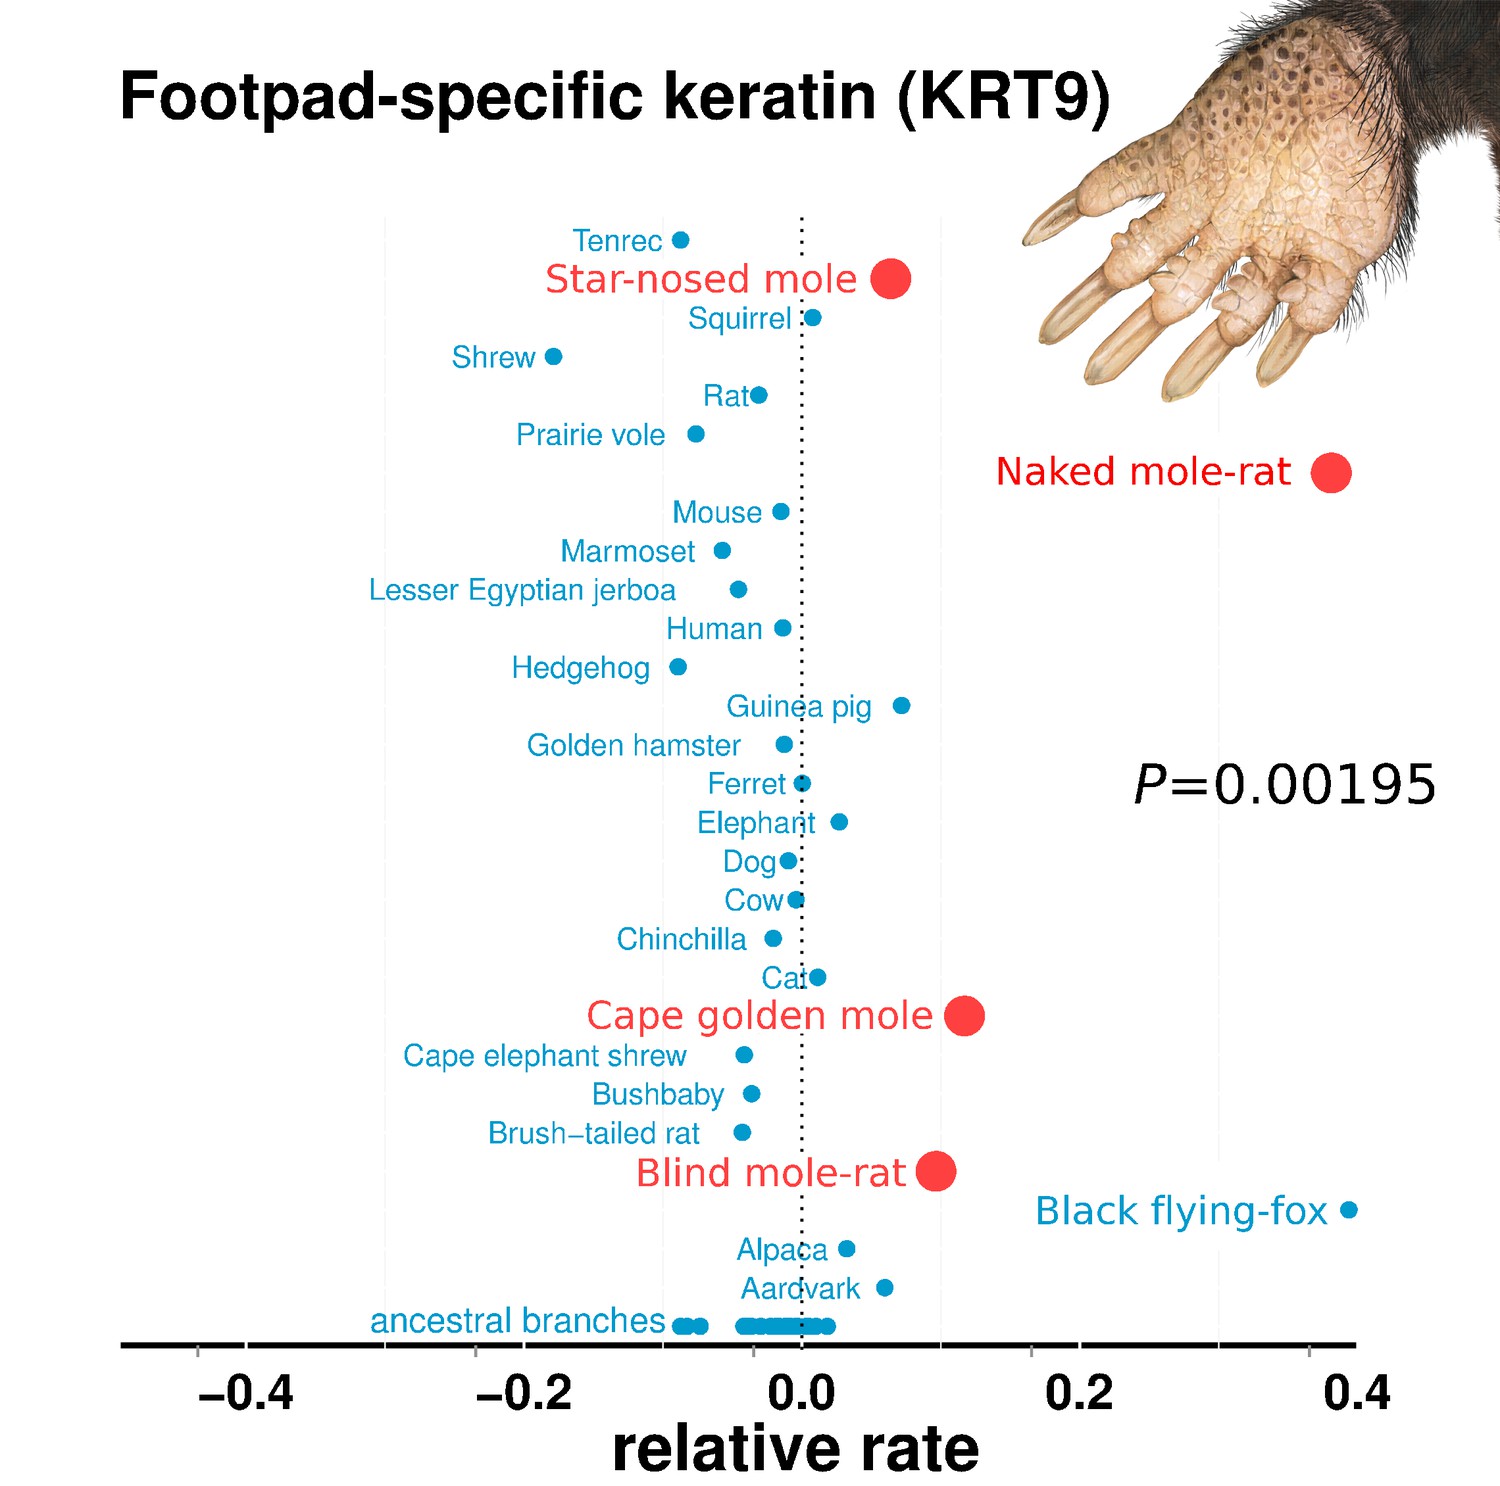
Relative rates of footpad-specific keratin 9 (KRT9).
KRT9 shows strong acceleration on the subterranean branches. The image shown is the footpad of the star-nosed mole, showing characteristic hyperkeratosis. Keratin 9 mutations also lead to hyperkeratosis in mouse models and humans. Illustrations by Michelle Leveille (Artifact Graphics).
Figure 5
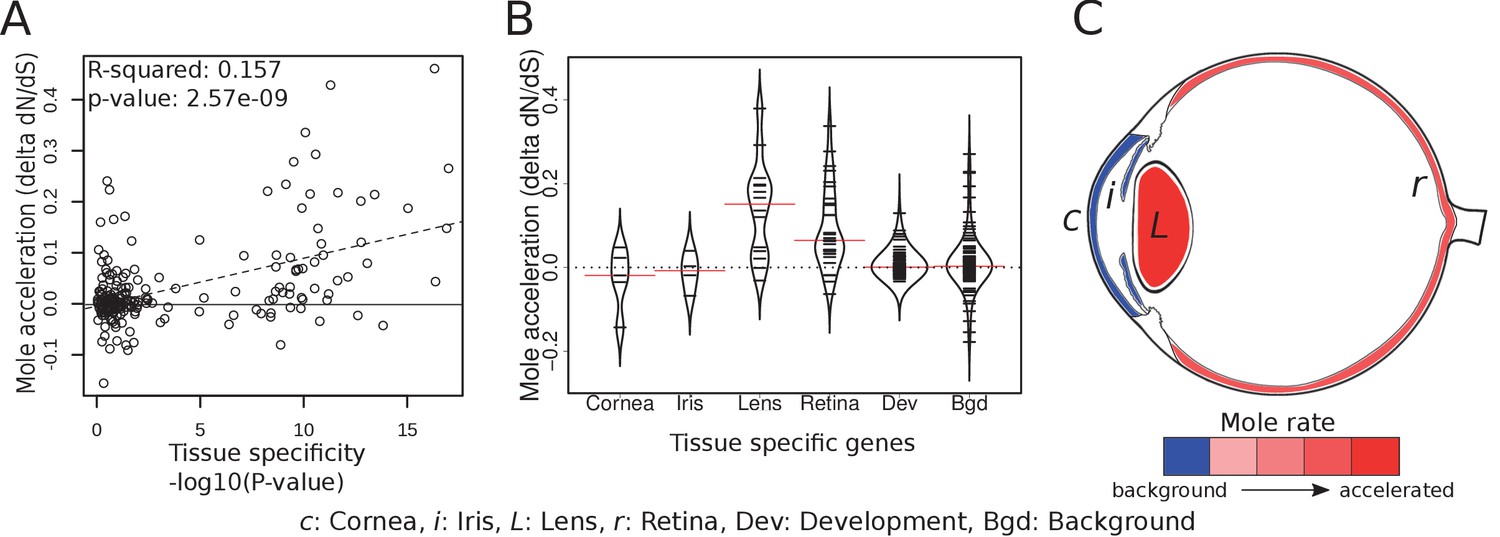
Tissue-specific retinal and lens genes are highly accelerated in subterranean species.
(A) Ocular genes that are more tissue-specific exhibit stronger acceleration in subterranean ‘mole’ species. The y-axis represents the change in the rate of evolution on branches shifting to a subterranean environment. (B) Panels of tissue-specific genes were tested for their relative accelerations in the subterranean mammals. One hundred randomly chosen ‘background’ genes were not faster or slower on average, and provide an estimate of the variance expected for random genes. Retina- and lens-specific genes show many cases of acceleration in the subterranean environment, and their distributions are significantly elevated when compared to background (p=1.4×10⁻⁵ and 3.2 × 10⁻⁴, respectively). (C) Representation of average mole-acceleration for genes specifically expressed in four different tissues of the eye.
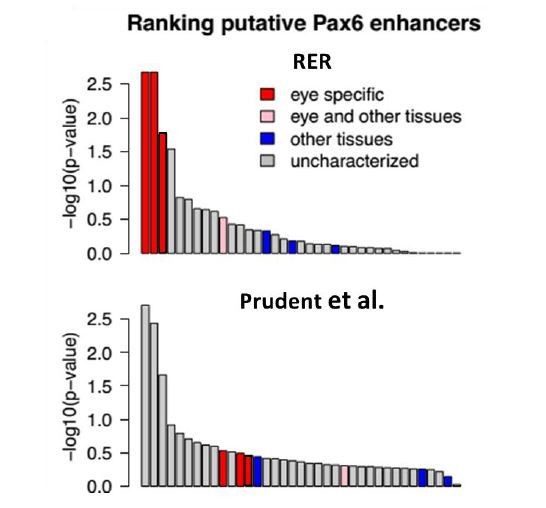
Figure 6
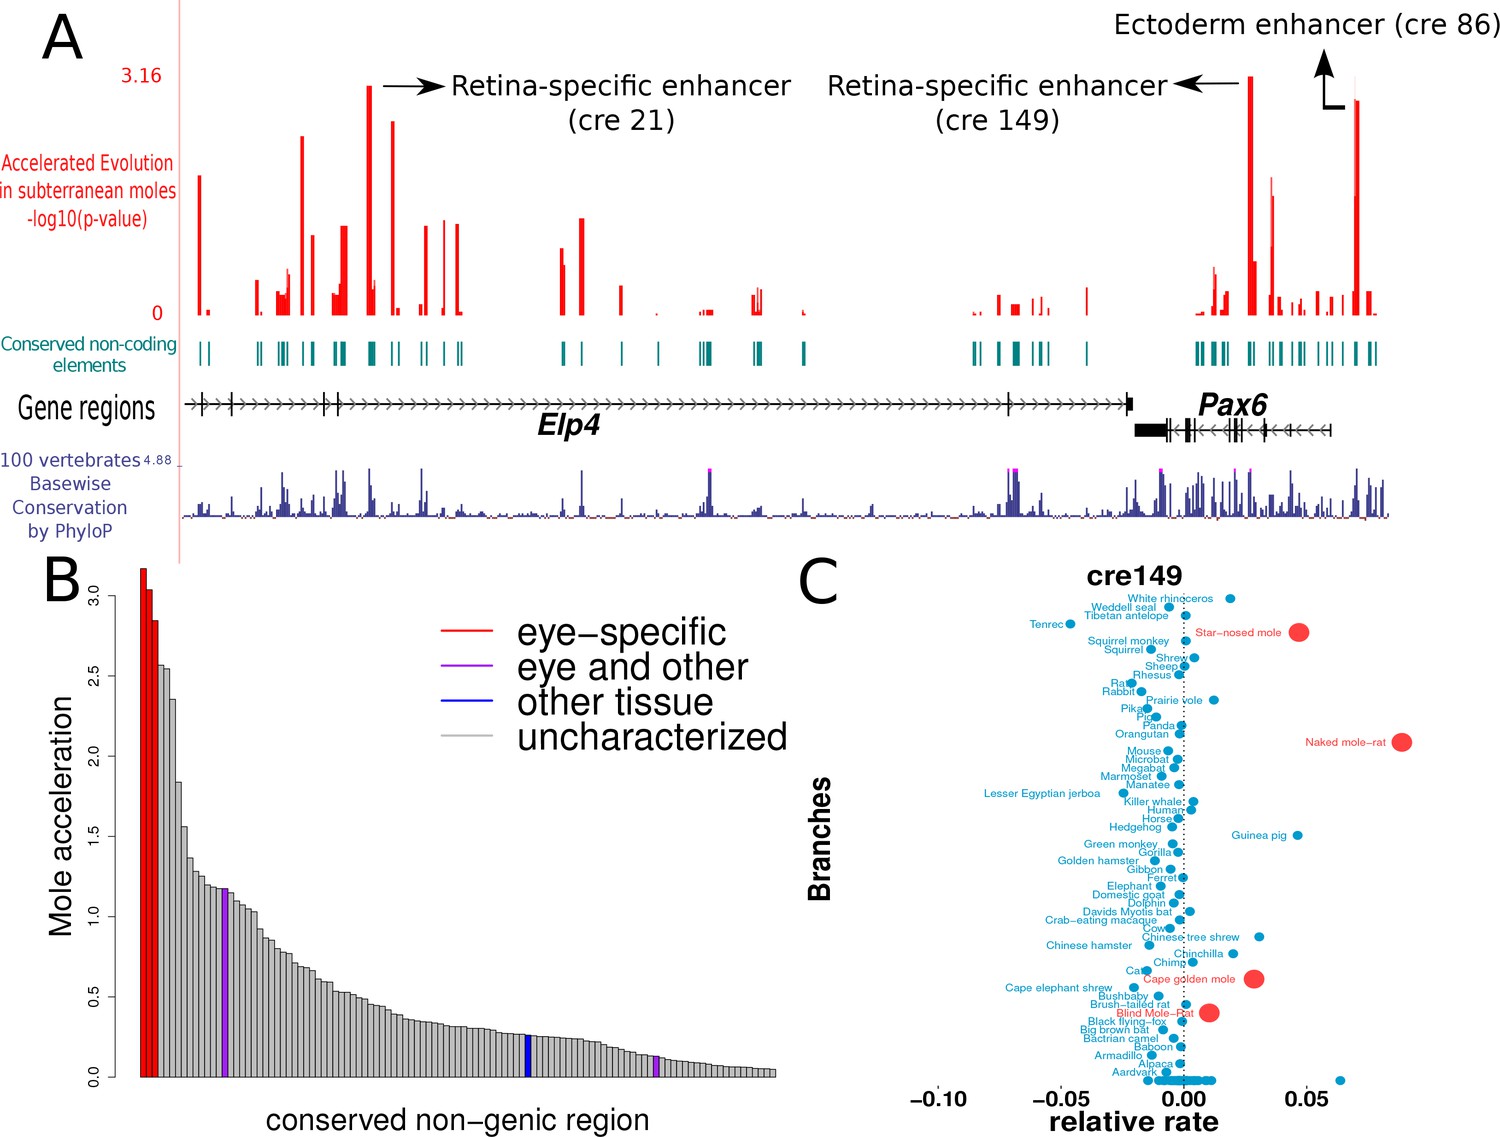
Mole-acceleration of eye-specific enhancers in the Pax6 gene region.
(A) Genomic region spanning Pax6 and its neighbor Elp4. The exons and introns of the two genes are represented by black blocks and lines respectively, whereas the conserved non-coding regions analyzed are represented in light blue. The conservation signal as given by the 100 vertebrates Basewise Conservation is shown in dark blue. The mole-acceleration scores for these regions are represented in red. The three most accelerated non-coding regions identified in this analysis are consistent with the eye-specific enhancers regulating Pax6 expression in the eye. (B) The mole-acceleration scores for the three eye-specific enhancers of Pax6 are the highest among 150 regions analyzed, including enhancers of other tissues and uncharacterized non-coding regions. (C) The relative rates in each species for the most accelerated region ‘cre149’.
Figure 7
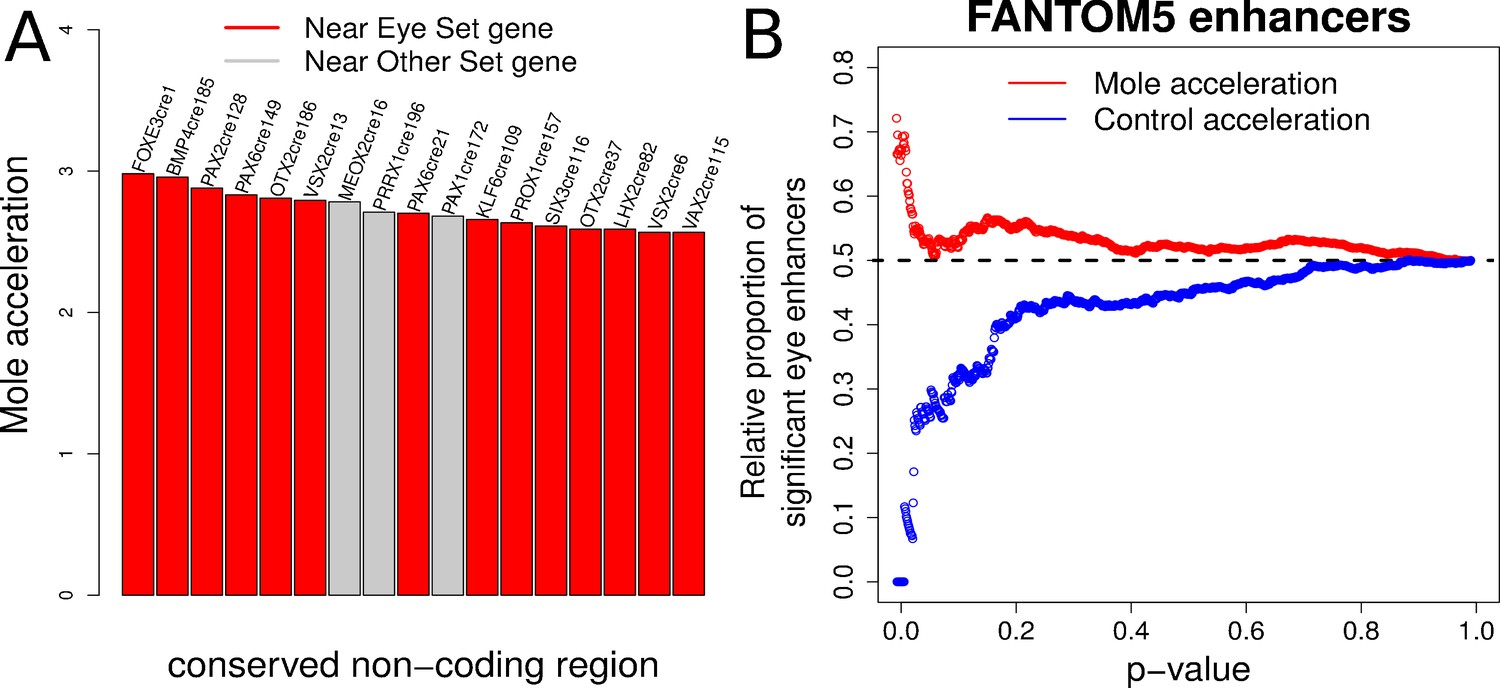
Evidence of mole-acceleration in candidate eye-specific enhancers.
(A) Enrichment of mole-accelerated elements near eye developmental transcription factor genes. The bar plot shows the 17 mole-accelerated conserved non-coding elements identified. Fourteen of the 17 elements are present near transcription factor genes in the Eye set, denoted in red. (B) FANTOM5 Eye enhancers show strong mole-acceleration. The plot shows the relative proportion of FANTOM5 eye enhancers identified among all enhancers significant at the corresponding p-value threshold. We see a strong enrichment of eye enhancers identified at low mole-acceleration p-values (red points) whereas no such enrichment is observed using control-species-acceleration p-values (blue points).
Figure 8
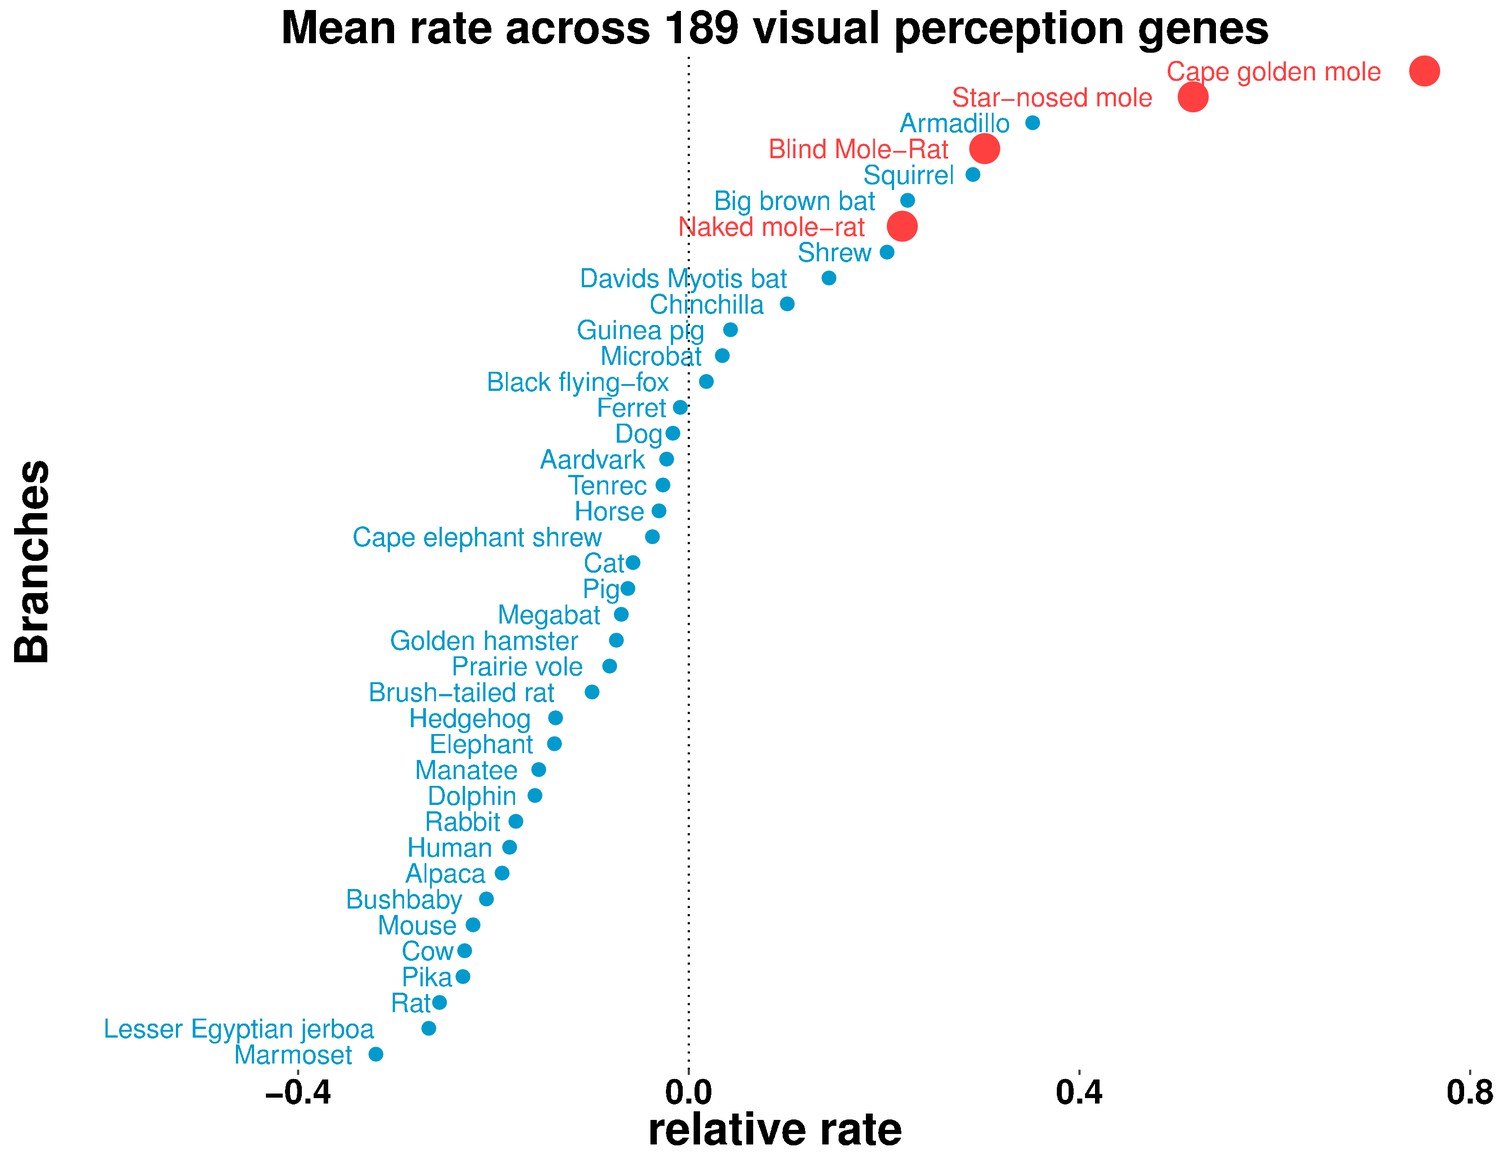
Some aboveground species show accelerated rates of evolutionary change in visual perception genes.
On the basis of the relative evolutionary rates across all species for 189 genes with the GO term annotation ‘visual perception’, we calculated the species-wise mean relative rate across of the genes. Our previous observations of mole-acceleration in visual perception genes are recapitulated here – the four subterranean mammals are among the species that show an accelerated rate across these genes. Interestingly, we find other non-subterranean species showing acceleration comparable to the subterranean mammals, indicating adaptations in visual systems.
Author response image 1
Author response image 2

Tables
Table 1
Top 30 of 55 subterranean-accelerated genes.
https://doi.org/10.7554/eLife.25884.006| Gene | P-value | Tissues | Description |
|---|---|---|---|
| LIM2* | 0.00084 | Lens | Lens intrinsic membrane protein 2 |
| CRYBB3* | 0.00087 | Lens | Lens-specific crystallin, beta B3 |
| R0M1* | 0.00096 | Retina | Retinal outer segment membrane protein 1 |
| CRYBA1* | 0.00098 | Lens | Lens-specific crystallin, beta Al |
| CRYGC* | 0.00119 | Lens | Lens-specific crystallin, gamma C |
| CRYBB2* | 0.00128 | Lens | Lens-specific crystallin, beta B2 |
| GPR89B | 0.00130 | Ubiquitous | G-protein-coupled receptor 89B, pH mediator in Golgi |
| GNAT1* | 0.00133 | Retina | Rod cell-specific G-protein, subunit alpha |
| GPRS9A | 0.00134 | Ubiquitous | G-protein-coupled receptor 89A, pH mediator in Golgi |
| NRL* | 0.00138 | Retina | Neural retina leucine zipper responsible for expression of rhodopsin |
| CRYGS* | 0.00146 | Lens | Lens-specific crystallin, gamma S |
| GRM6* | 0.00150 | Retina | Metabotropic glutamate receptor 6, required for normal vision |
| GBX2 | 0.00165 | Embryo | Gastrulation brain homeobox 2, developmental transcription factor |
| LGSN* | 0.00171 | Lens | Lengsin, lens protein with glutamine synthetase domain |
| CRYBB1* | 0.00183 | Lens | Lens-specific crystallin, beta Bl |
| KLHDC3 | 0.00186 | Ubiquitous | Kelch-domain-containing 3, high expression in brain |
| KRT81# | 0.00186 | Hair and nails | Keratin 81, primarily in hair cortex |
| WDFY1 | 0.00192 | Ubiquitous | WD repeat and FYVE-domain-containing 1, endosomal protein |
| KRT9# | 0.00195 | Skin | Keratin 9, specific to palms of hands and soles of feet |
| POMP# | 0.00199 | Ubiquitous | Proteasome maturation protein, associated with rare skin disorder |
| RRH* | 0.00201 | Retina | Retinal pigment epithelium-derived rhodopsin homolog |
| DPCD* | 0.00201 | Ciliated cells | Deleted in primary ciliary dyskinesia; maintenance of ciliated cells |
| RAD54L | 0.00217 | Ubiquitous | RAD54-like: DNA double-strand break repair |
| TATDN1 | 0.00235 | Ubiquitous | TatD DNase-domain-containing 1 |
| ITLN2 | 0.00244 | Small intestine | Intelectin 2, may play a role in defense against pathogens |
| STX3* | 0.00245 | Ubiquitous | Syntaxin 3, associated with congenital cataracts and intellectual disability |
| SKJV2L* | 0.00254 | Ubiquitous | DEAD box protein, yeast SKI2 homolog, implicated in macular degeneration |
| DPY19L1 | 0.00254 | Ubiquitous | dpy-19-like 1 (Caenorhabditis elegans), probable C-mannosyltransferase |
| TFPT | 0.00266 | Ubiquitous | TCF3 (E2A) fusion partner (in childhood leukemia) |
| RSI* | 0.00275 | Retina | Retinoschisin 1, extracellular protein involved in organization of retina |
-
*related to vision.
#related to skin and hair.
-
Refer to Supplementary file 1 for a full list of the subterranean-accelerated genes.
Table 2
Representative enriched functions in mole-accelerated genes.
https://doi.org/10.7554/eLife.25884.007| Functional annotation | Fold enrichment | p-value | FDR q-value |
|---|---|---|---|
| Visual perception | 23.16 | 6.84E-16 | 1.02E-11 |
| Sensory perception of light stimulus | 22.69 | 9.12E-L6 | 6.82E-12 |
| Sensory perception | 8.47 | 5.83E-10 | 2.91E-06 |
| Neurological system process | 5.39 | 1.75E-07 | 6.53E-O4 |
| Detection of light stimulus | 29.57 | 7.04E-07 | 2.10E-03 |
| Detection of light stimulus involved in sensory perception | 56.35 | 1.92E-05 | 4.77E 02 |
| Detection of light stimulus involved in visual perception | 56.35 | 1.92E-05 | 4.09E-02 |
| Detection of external stimulus | 14.38 | 2 49E-05 | 4.66E-02 |
Additional files
-
Supplementary file 1
Subterranean-accelerated genes
The genome-wide ranking of genes whose rates are positively associated with the subterranean branches was identified on the basis of the Mann-Whitney U test p-values (column 2) that were significant at a FDR of 15% under a permutation-based FDR correction procedure (column 3). Other columns list brief gene descriptions (4), known biological function (5), tissue specificity if any (6), known disease links (7), the predominant evolutionary mode on subterranean branches as decided with codon models (8, see Materials and methods), and the subterranean species containing genetic lesions in the corresponding protein-coding sequences (9).
- https://doi.org/10.7554/eLife.25884.013
-
Supplementary file 2
Functional enrichment in subterranean-accelerated genes
The subterranean-accelerated genes were strongly associated with specific Gene Ontology terms representing functional categories. This table presents the GO term identifier (column 1), description (column 2), the p-value representing the significance of the degree of enrichment of genes in that category among mole-accelerated genes relative to the entire set (3), the multiple test-corrected p-value (4), the degree of enrichment in the accelerated set relative to the entire set (5), the number of genes in that category in the entire analyzed gene set (6), the number of genes in the accelerated set (7), the number of genes in that category in the accelerated gene set (8), and the corresponding gene names (9).
- https://doi.org/10.7554/eLife.25884.014
-
Supplementary file 3
Subterranean-decelerated genes
The genome-wide ranking of genes whose rates are negatively associated with the subterranean branches was identified based on the Mann-Whitney U test p-values (column 2) that are significant at a FDR of 15% under a permutation-based FDR correction procedure (column 3). Column 4 lists brief gene descriptions.
- https://doi.org/10.7554/eLife.25884.015
-
Supplementary file 4
Functional enrichment in subterranean-decelerated genes
The specific Gene Ontology terms representing functional categories with which subterranean-decelerated genes were strongly associated. This table presents the GO term identifier (column 1), description (column 2), the p-value representing the significance of the degree of enrichment of genes in that category among mole-accelerated genes relative to the entire set (3), the multiple test-corrected p-value (4), the degree of enrichment in the accelerated set relative to the entire set (5), the number of genes in that category in the entire analyzed gene set (6), the number of genes in the accelerated set (7), the number of genes in that category in the accelerated gene set (8), and the corresponding gene names (9).
- https://doi.org/10.7554/eLife.25884.016
-
Supplementary file 5
Results of codeml tests for positive selection in subterranean-accelerated genes
This table presents the results for the mole-accelerated genes from five codon models and the likelihood ratio tests between them. Columns B – T present the branch-site models and tests with their log likelihood values, the likelihood ratio tests between them (see Materials and methods), and some of the estimated parameters for background (conserved) and foreground (subterranean) branches (Zhang et al., 2005). Columns V – AC present the results of the pan-mammalian tests for positive selection using the sites models (M8A and M8) (Swanson et al., 2003; Yang, 2007).
- https://doi.org/10.7554/eLife.25884.017
-
Supplementary file 6
Pseudogene study
This table lists the pseudogene status of mole-accelerated genes' orthologs in the set of species utilized for the study.
- https://doi.org/10.7554/eLife.25884.018
-
Supplementary file 7
Eye developmental gene evolutionary rates.
This table presents the evolutionary rates of the 71 eye developmental genes. For each gene (column 1), we performed a branch-site selection model analysis to estimate two different values of dN/dS – one for the four subterranean branches on the tree (3), and one for the rest of the branches (2, see Materials and methods). The mole-acceleration is calculated as the difference between these two values (4). Column 5 indicates whether the gene was identified as a subterranean-accelerated gene using the RER methods, and column 6 lists the refSeq summary.
- https://doi.org/10.7554/eLife.25884.019
-
Supplementary file 8
Relative rate acceleration in subterranean mammals for 150 conserved non-genic regions near Pax6
This table presents the 150 non-coding regions scanned near Pax6 and their relative rate acceleration in subterranean mammals. The first three columns represent the hg19 coordinates of the region. Column 4 represents the mole-acceleration calculated as the negative logarithm to the base 10 of the Mann-Whitney U test p-value. Column 5 provides additional information about the overlap of the region with known tissue-specific enhancers of Pax6.
- https://doi.org/10.7554/eLife.25884.020
-
Supplementary file 9
Transcription factor genes utilized for genome-wide scan for convergently accelerated non-coding elements
This table presents the two sets of transcription factor genes used to scan for convergently accelerated non-coding elements. TF genes in the Eye set, were compiled based on a literature survey of their eye developmental role (column 2). Column 3 lists the refSeq summary. Similarly, the tissue-specificity of TF genes belonging to the ‘Other’ set is provided in column 2 of the second table.
- https://doi.org/10.7554/eLife.25884.021
-
Supplementary file 10
Relative rate acceleration in subterranean mammals for conserved non-coding regions near developmental transcription factor genes
This table presents the 17 subterranean-accelerated non-coding regions scanned near the 40 TF genes listed in Supplementary file 9, significant at a FDR of 10%. Columns 1–3 list their hg19 coordinates. Column 4 presents the mole-acceleration calculated as the Mann-Whitney U test p-value. Column 5 lists the permutation-based FDR q-value.
- https://doi.org/10.7554/eLife.25884.022
-
Supplementary file 11
Relative rate acceleration in subterranean mammals for putative FANTOM5 enhancer regions
This table presents the 62 subterranean-accelerated putative FANTOM5 enhancers significant at a FDR of 15%. Fantom5 element names containing the word 'eye' correspond to FANTOM5 enhancers identified as eye enhancers in this analysis. Columns 2 and 3 list each region's mm9 and hg19 coordinates respectively. Column 4 represents the mole-acceleration calculated as the Mann-Whitney U test p-value. Column 4 lists the permutation-based FDR q-value.
- https://doi.org/10.7554/eLife.25884.023
-
Transparent reporting form
- https://doi.org/10.7554/eLife.25884.024
Download links
A two-part list of links to download the article, or parts of the article, in various formats.
Downloads (link to download the article as PDF)
Open citations (links to open the citations from this article in various online reference manager services)
Cite this article (links to download the citations from this article in formats compatible with various reference manager tools)
Subterranean mammals show convergent regression in ocular genes and enhancers, along with adaptation to tunneling
eLife 6:e25884.
https://doi.org/10.7554/eLife.25884


