Niemann-Pick type C proteins promote microautophagy by expanding raft-like membrane domains in the yeast vacuole
- Nagoya University Graduate School of Medicine, Japan
Figures
Figure 1 with 3 supplements
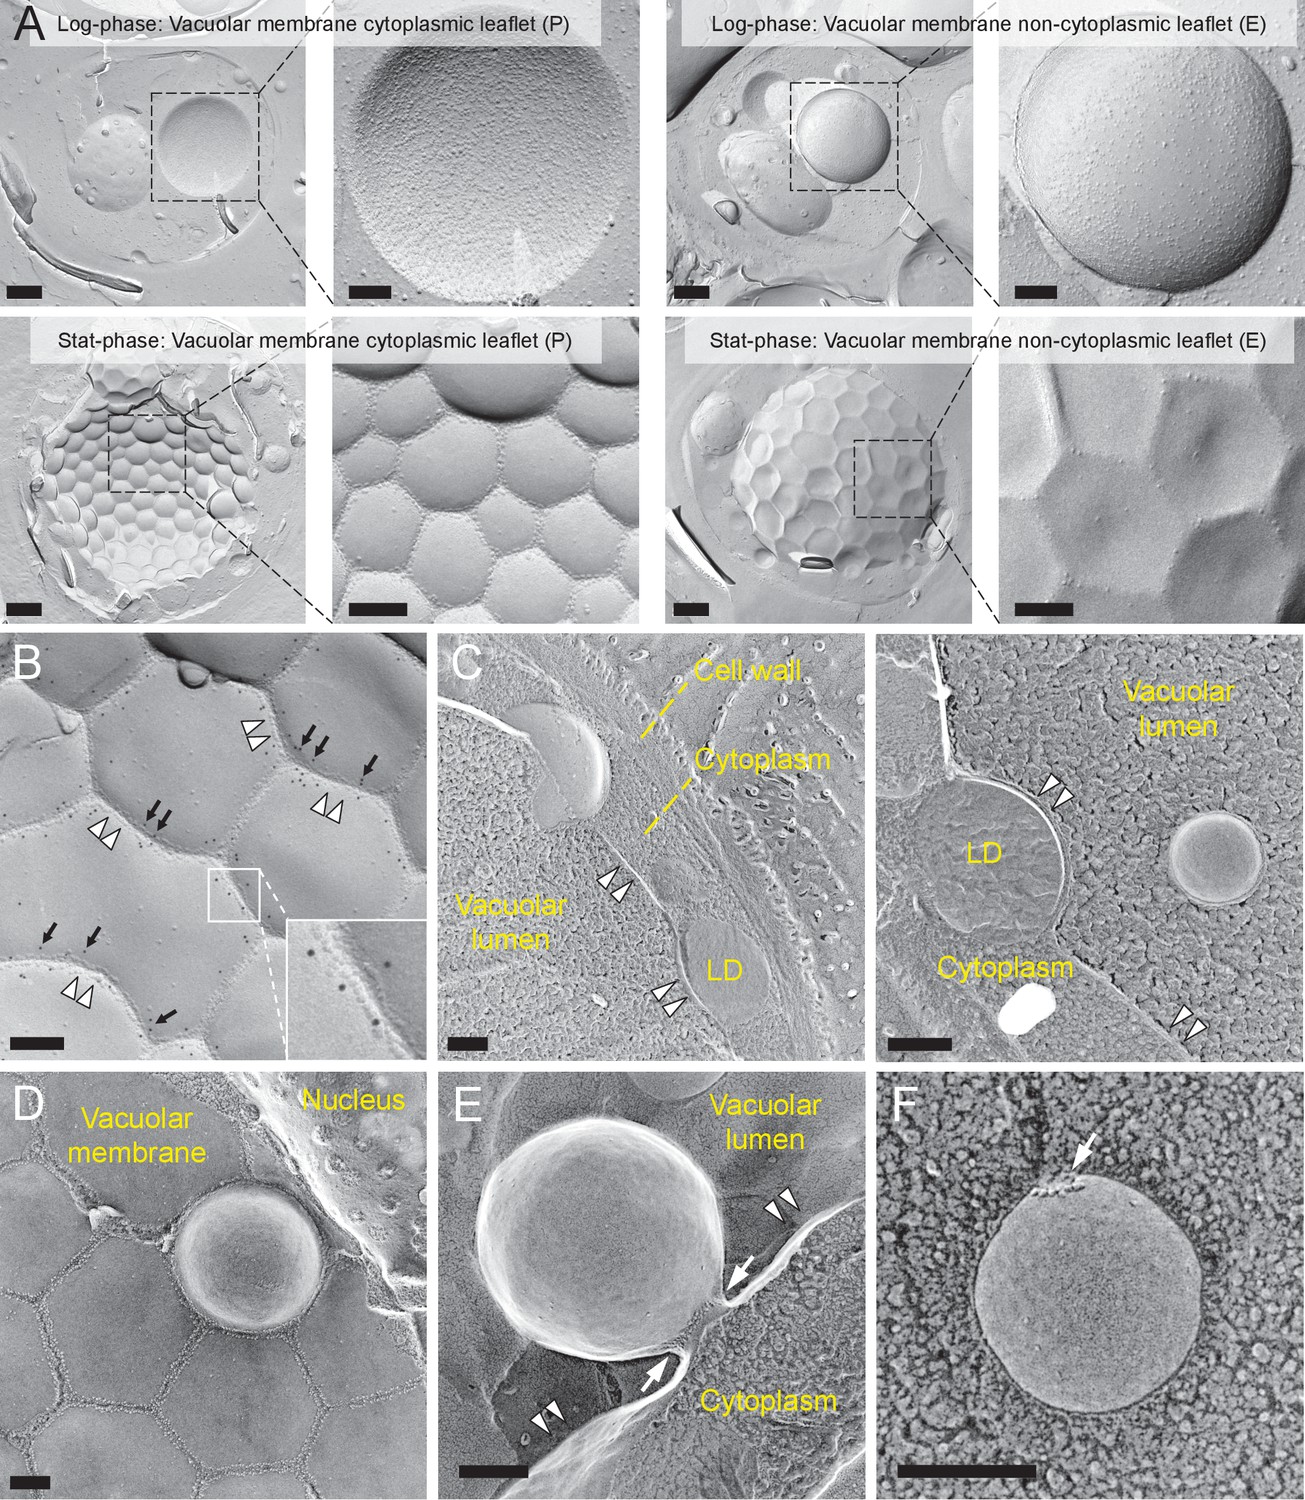
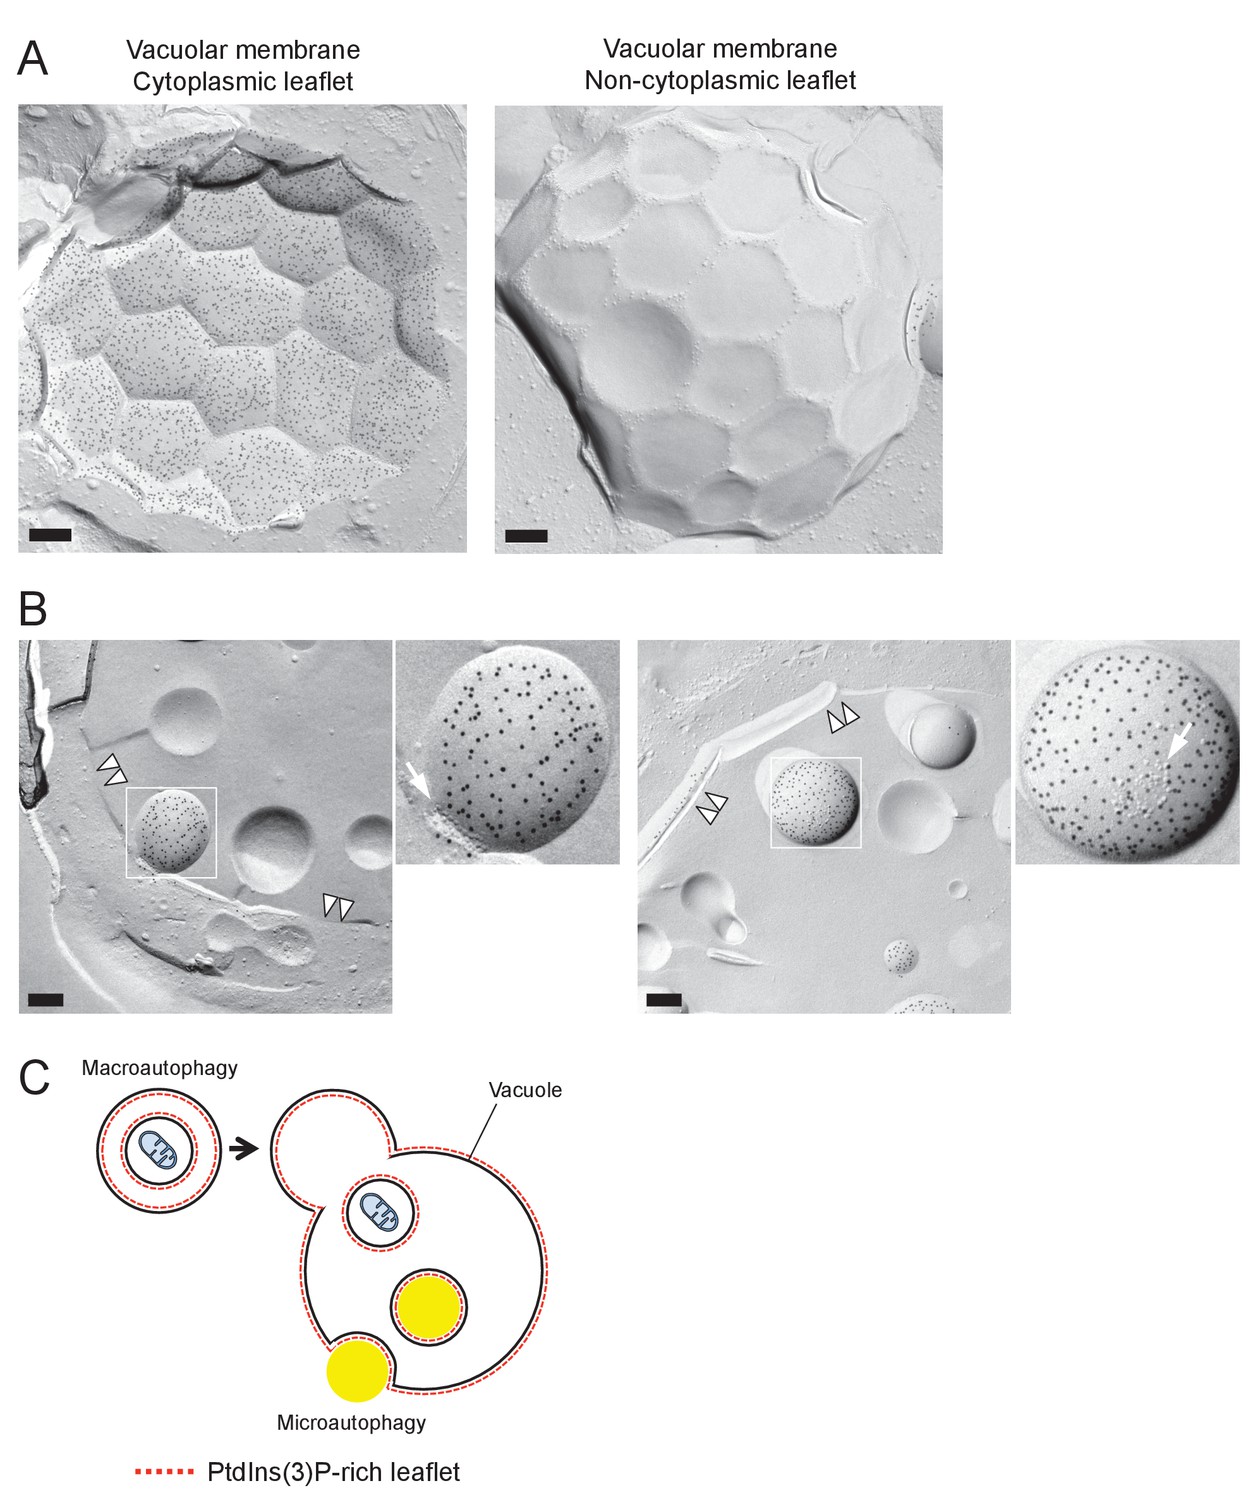
Lipophagy in stationary phase occurs through the expansion of raft-like vacuolar membrane domains.
(A) Freeze-fracture EM of the vacuole. The vacuolar membrane in stationary phase yeast shows geometrical patterns in both the protoplasmic face (P face; cytoplasmic leaflet) and the exoplasmic face (E face: non-cytoplasmic leaflet). Intramembrane particles (IMPs), which represent transmembrane proteins, are largely confined to the edges of polygonal areas. Bars: 0.5 µm (low magnification); 0.2 µm (high magnification). (B) Freeze-fracture labeling of Vph1p–mRFP in the stationary phase vacuole. Labels for Vph1p–mRFP (arrows) were excluded from the polygonal IMP-deficient area, but were present in the IMP-rich region, indicating that the IMP-deficient area corresponds to the raft-like domain. The IMP-rich area, or the nonraft-like domain, is marked by double arrowheads. Bar: 0.2 µm. (C–F) Freeze-fracture/etching EM of stationary phase vacuole. Bars: 0.2 µm. The black-and-white contrast is reversed to enhance the three-dimensional features. (C) LDs adhered tightly to IMP-deficient raft-like domain, which bulges toward the lumen. The vacuolar membrane is marked by double arrowheads. See Figure 1—figure supplement 2 for a picture of the whole cell and Video 1 for a three-dimensional view of the LD-vacuole apposition. (D) Only a limited number of raft-like domains showed bulging. Irrespective of the variable degree of bulging in raft-like domains, nonraft-like domains were confined to the edge. See Figure 1—figure supplement 3 for additional photos. (E) The raft-like domain formed a balloon-like structure that protrudes into the vacuolar lumen. IMPs were observed as a ring-like structure in the constricted portion (arrows). The vacuolar membrane is marked by double arrowheads. (F) Vesicles in the vacuolar lumen harbored IMP clusters (arrow).
Figure 1—figure supplement 1
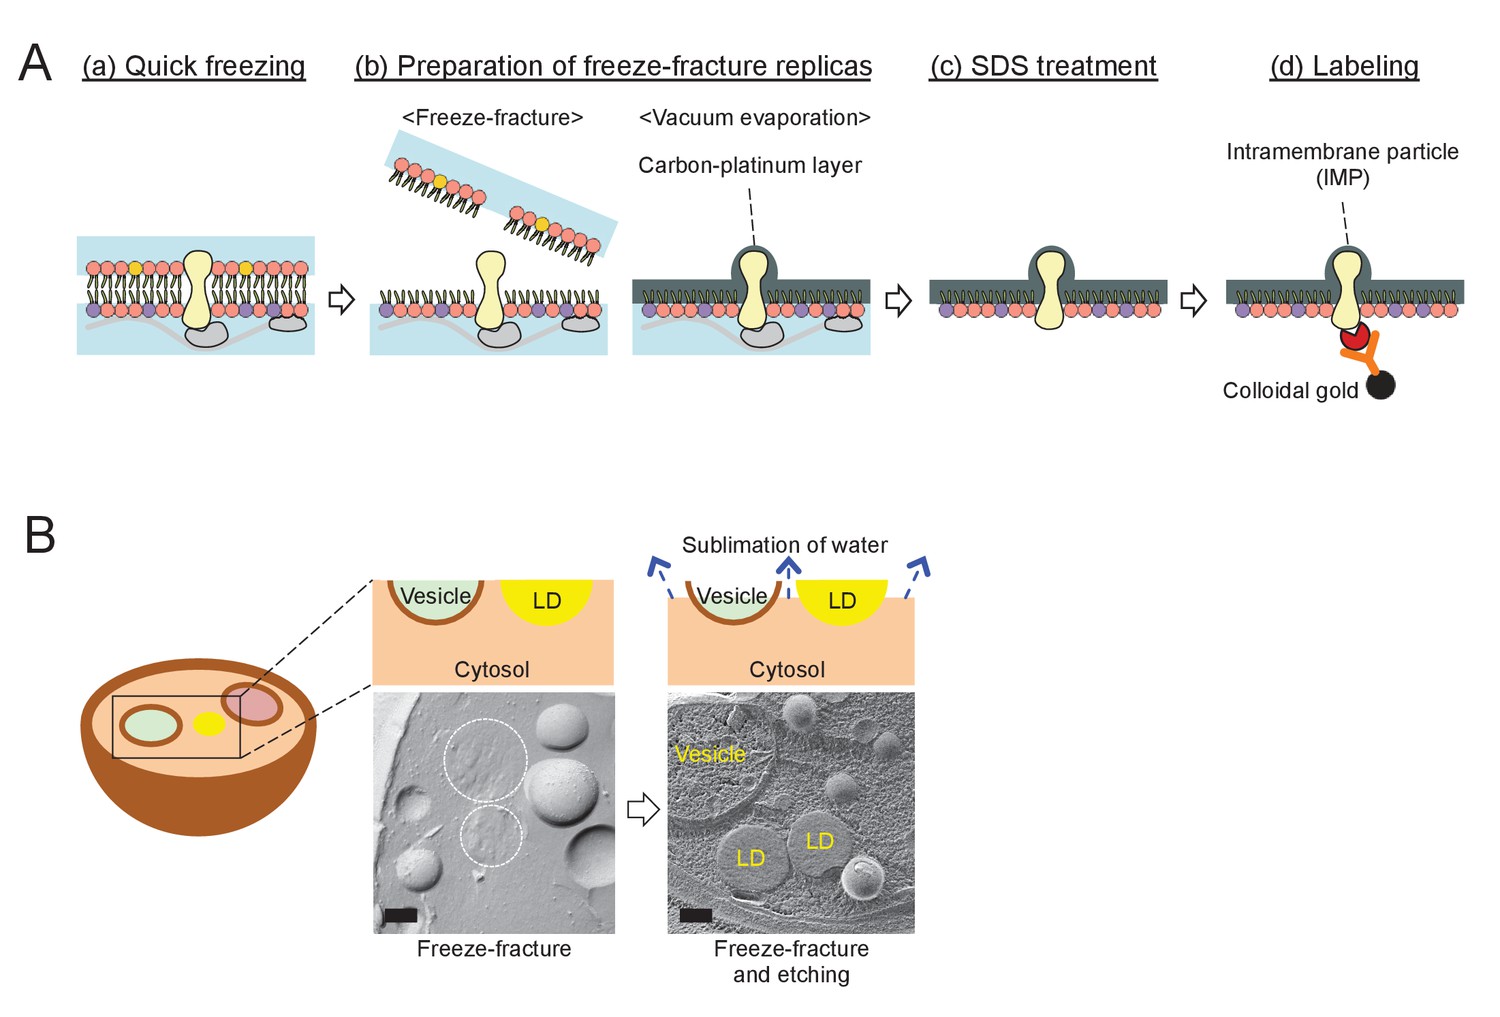
The procedure for quick-freezing and freeze-fracture EM.
(A) Quick-freezing and freeze-fracture replica-labeling EM. (a) Quick freezing of live cells without chemical fixation; (b) preparation of freeze-fracture replicas – physical fixation of a phospholipid monolayer with vacuum evaporation of carbon and platinum; (c) SDS treatment to remove extra-membrane materials; and (d) labeling of freeze-fracture replicas with specific probes. PtdIns(3)P and Vph1p–mRFP were labeled by this method in the present study. (B) Freeze-fracture and etching EM. After freeze-fracture, quick-frozen samples are kept at –102°C for 2 min before vacuum evaporation. During this ‘etching’ procedure, water in the cytosol and the organellar lumen sublimes, while the lipid esters in the LD core do not, thus making LDs stand out among etched structures. The photographs show the difference in appearance of LDs in simple freeze-fracture and freeze-fracture/etching EM. Bars: 0.2 μm.
Figure 1—figure supplement 2
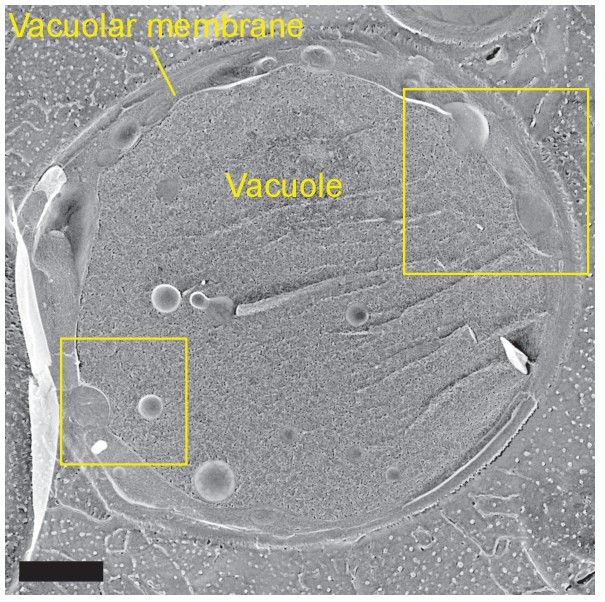
Freeze-fracture/etching EM of an entire yeast cell in stationary phase.
The two rectangular areas are magnified in Figure 1C. Bar, 1 μm.
Figure 1—figure supplement 3

Additional examples of raft-like domain bulging in the vacuole.
Adjacent raft-like domains show variable degrees of bulging. Bars: 0.2 μm.
Figure 2 with 1 supplement
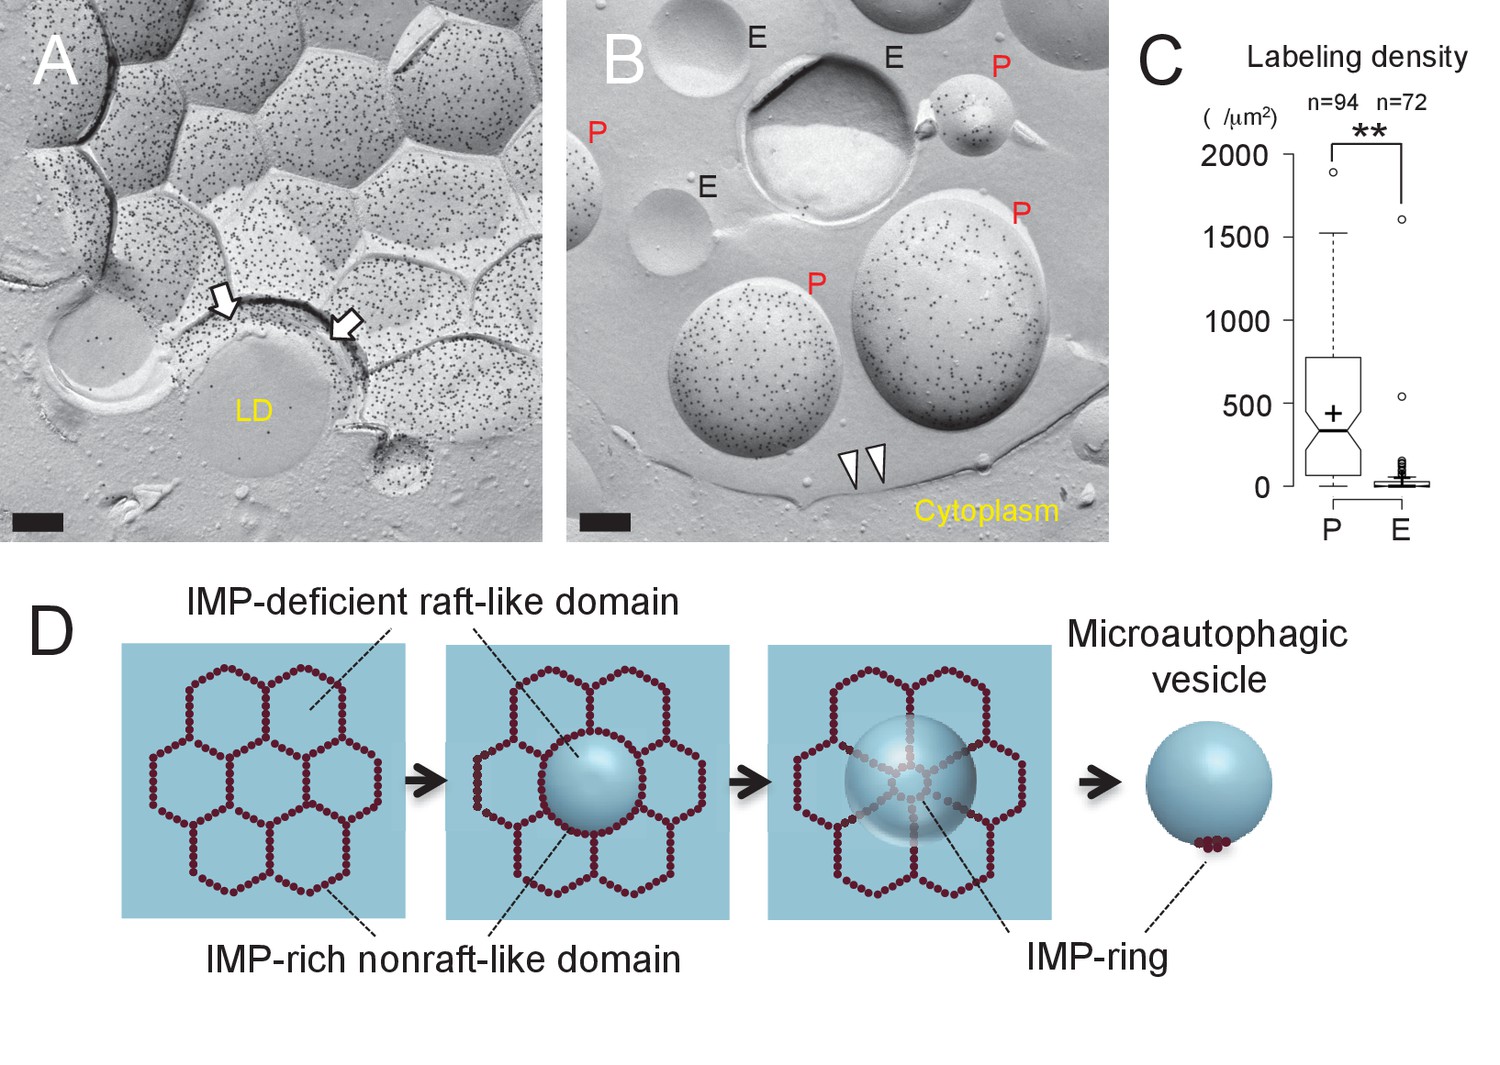
Microautophagic vesicles show the same PtdIns(3)P asymmetry as the vacuolar membrane.
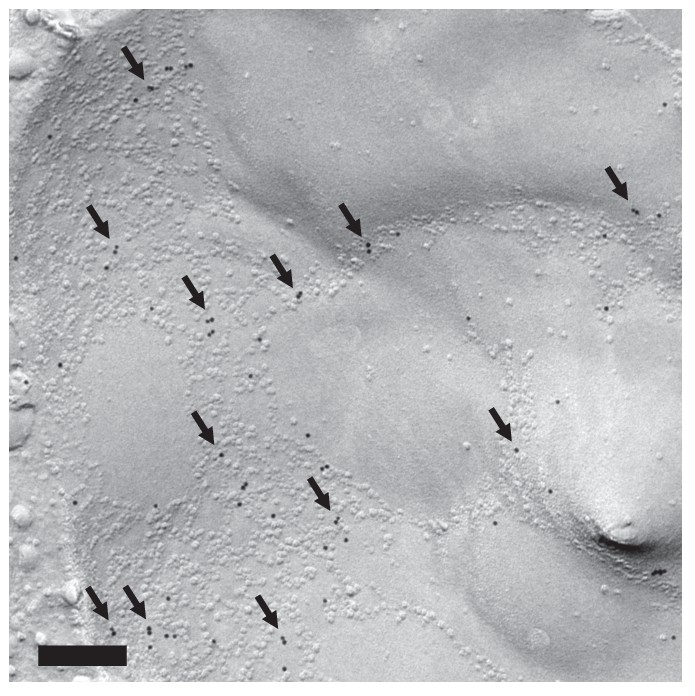
(A, B) Freeze-fracture replica labeling of PtdIns(3)P in stationary phase vacuoles. Colloidal gold particles indicate PtdIns(3)P labeled by recombinant GST-p40phox PX domain. Bars: 0.2 µm. See also Figure 2—figure supplements 1A and B for additional photos. (A) The vacuolar membrane was labeled for PtdIns(3)P in the cytoplasmic leaflet. Note that the domain engulfing an LD is also labeled (arrows). (B) PtdIns(3)P was labeled densely in the convex protoplasmic face (P; the cytoplasmic leaflet), but scarcely in the concave exoplasmic face (E; the luminal leaflet), of microautophagic vesicles. The vacuolar membrane is marked by double arrowheads. (C) PtdIns(3)P labeling density in the intravacuolar vesicles. The density was significantly higher in the P face than in the E face. The result of one representative experiment out of three independent experiments. **p<0.01. (D) Diagram showing how the vacuolar membrane forms the microautophagic vesicle in stationary phase.
Figure 2—figure supplement 1
PtdIns(3)P in a stationary phase vacuole.
(A) Freeze-fracture replica labeling EM of PtdIns(3)P in a stationary phase vacuole. The labeling in the vacuolar membrane was dense in the cytoplasmic leaflet, whereas it was scarce in the non-cytoplasmic leaflet. Bar: 0.2 μm. (B) PtdIns(3)P labeling in the intravacuolar vesicles. The dense labeling was observed only in the convex P face, representing the cytoplasmic leaflet. Note the presence of IMP clusters (arrows). The vacuolar membrane is marked by double arrowheads. Bars: 0.2 μm. (C) Schematic diagram showing the origin of contrasting PtdIns(3)P asymmetry in microautophagic vesicles and macroautophagic bodies. PtdIns(3)P in autophagosomes and autophagic bodies is much more abundant in the non-cytoplasmic leaflet than in the cytoplasmic leaflet (Cheng et al., 2014), whereas PtdIns(3)P in microautophagic vesicles, which are derived from the vacuolar membrane, is confined to the cytoplasmic leaflet.
Figure 3 with 3 supplements
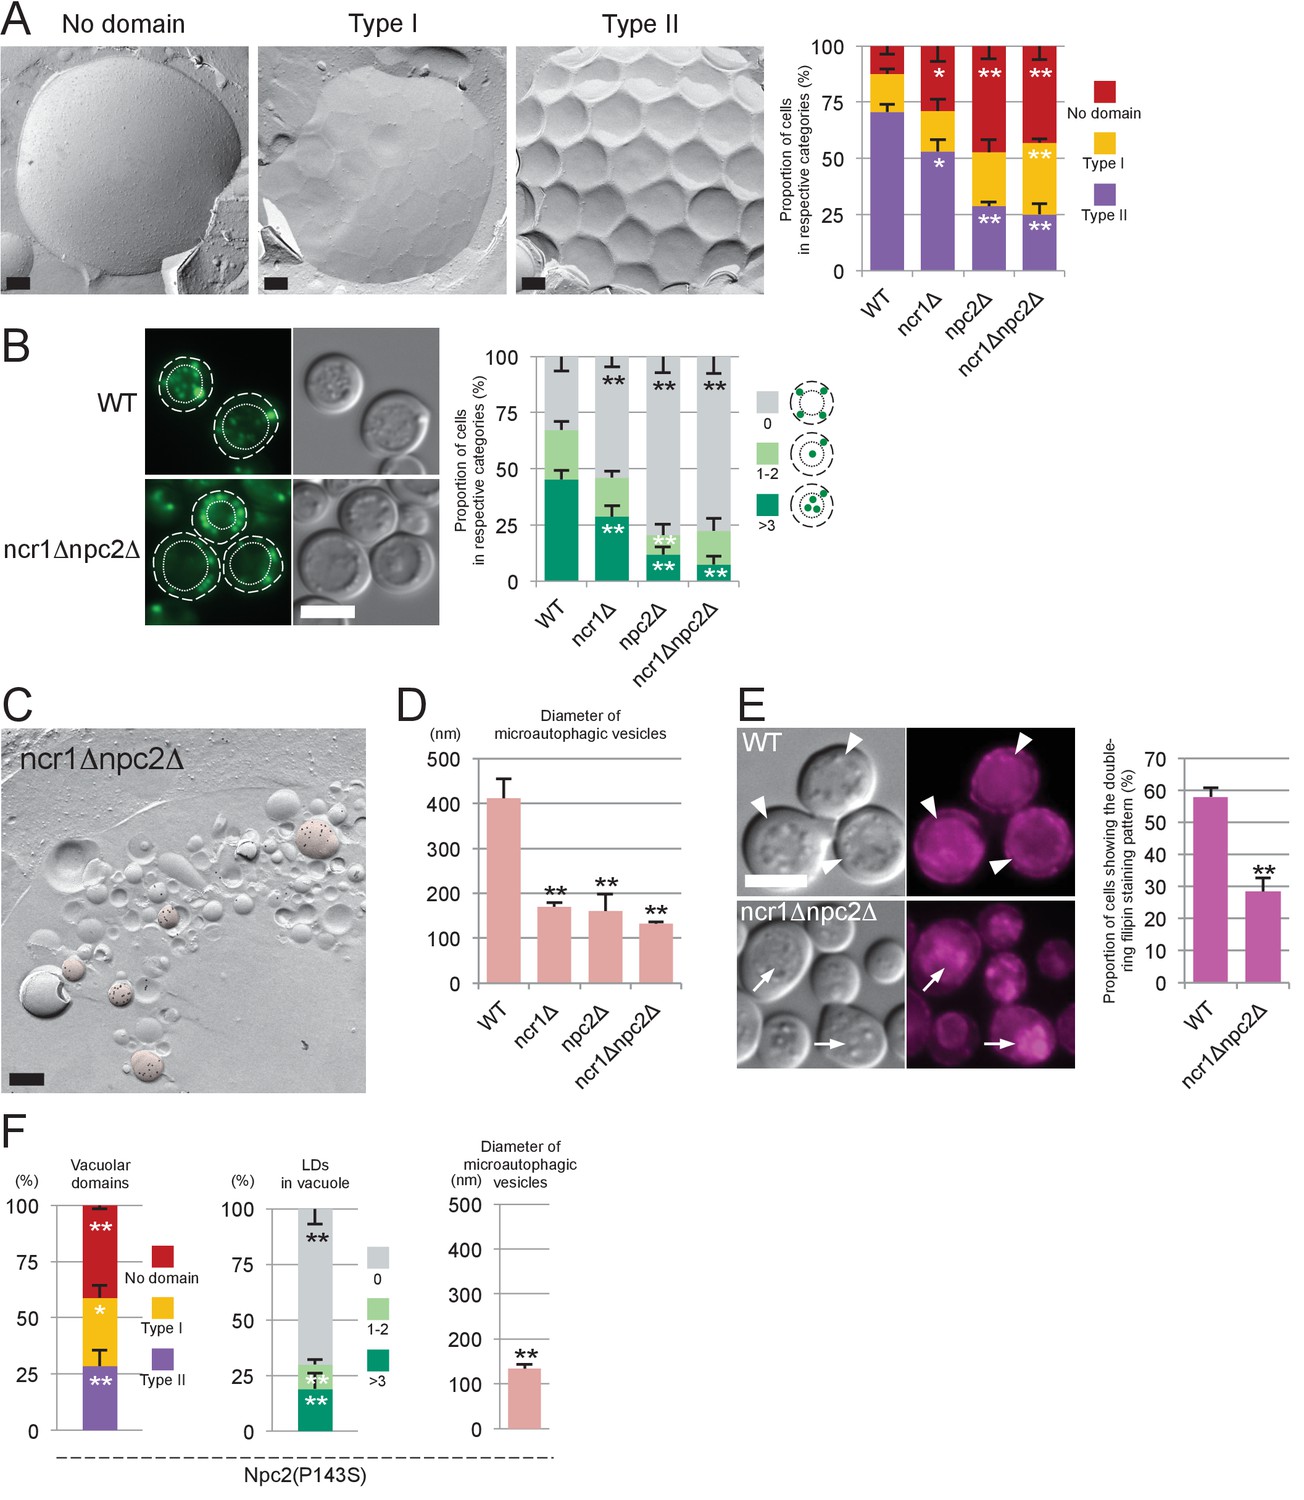
Sterol transport by NPC proteins is essential for stationary phase lipophagy.
(A) Vacuolar domains were classified in three categories: no domain, domains without inward curvature (type I), and domains with inward curvature (type II). Bars: 0.2 µm. In comparison to WT, the type II vacuoles were significantly decreased in NPC-deficient cells. Mean ± SD of three independent experiments (>50 vacuoles were counted for each group in each experiment). *p<0.05; **p<0.01 (B) Lipophagy in stationary phase. LDs were stained with BODIPY493/503. Bar: 5 µm. The vacuoles were classified by the number of LDs in the lumen: that is, no LD, 1–2 LDs, and more than 3 LDs. There were significantly fewer vacuoles containing LDs in NPC-deficient cells than in WT. Mean ± SD of a single representative experiment (n > 150 for each group) out of three repeated experiments. **p<0.01. (C) Intravacuolar vesicles. Microautophagic vesicles (defined by PtdIns[3]P labeling of more than 100 vesicles/µm2 in the cytoplasmic leaflet; colored in red) were small in ncr1△ npc2△ (see Figure 2B for comparison with WT). Many small vesicles with low levels of PtdIns(3)P labeling were also observed. See Figure 3—figure supplement 2 for ncr1△ and npc2△. Bar: 0.2 µm. (D) Sizes of microautophagic vesicles. Mean ± SD of three independent experiments. See Figure 3—figure supplement 2B for a box plot. **p<0.01. (E) Filipin staining. The proportion of cells showing the double-ring filipin-staining pattern was significantly lower in NPC-deficient cells than in WT [mean ± SD of three independent samples (>150 vacuoles each were counted for each group)]. The vacuole of NPC-deficient cells showed prominent sterol deposition in the vacuolar lumen (arrows). Bar: 5 µm. **p<0.01. (F) Yeast expressing Npc2p(P143S) showed all the defects observed in npc2△. The domain formation, lipophagy, and the size of the microautophagic vesicles in Npc2p(P143S) were compared with those in WT as shown in Figure 3A,B and D, respectively. *p<0.05; **p<0.01
Figure 3—figure supplement 1

Filipin staining.
(A) Wild-type yeast in log phase was labeled only in the cell surface, but in stationary phase, it showed intense labeling in the vacuolar membrane as well as in the cell surface (arrows), giving rise to a double-ring staining pattern. Bar: 5 μm. (B) The vacuolar raft-like domain in the stationary phase WT yeast showed membrane deformation caused by filipin–sterol complexes (arrows). Bar: 0.2 μm.
Figure 3—figure supplement 2

The number and sizes of LDs in stationary phase.
The number and sizes of LDs were measured by fluorescence microscopy after BODIPY493/503 staining and freeze-fracture EM, respectively. Neither of these measurements differed drastically between WT and NPC-deficient cells. Mean ± SD. Five independent samples and more than 30 cells were counted to assess numbers, whereas three independent samples and more than 30 LDs were counted to assess size.*p<0.05; **p<0.01.
Figure 3—figure supplement 3

Microautophagic vesicles in the lumen of a stationary phase vacuole.
(A) Microautophagic vesicles were identified by intense PtdIns(3)P labeling (more than 100 gold labels/μm2) in the cytoplasmic leaflet (colored in red). These were significantly smaller in ncr1Δ and npc2Δ than in WT. The vacuolar membrane is marked by double arrowheads. Bars: 0.2 μm. (B) Box plot of the diameter of microautophagic vesicles. Microautophagic vesicles were significantly smaller in NPC-deficient and Npc2(P143S) cells than in WT. The result of one representative experiment out of three independent experiments. **p<0.01.
Figure 4 with 6 supplements
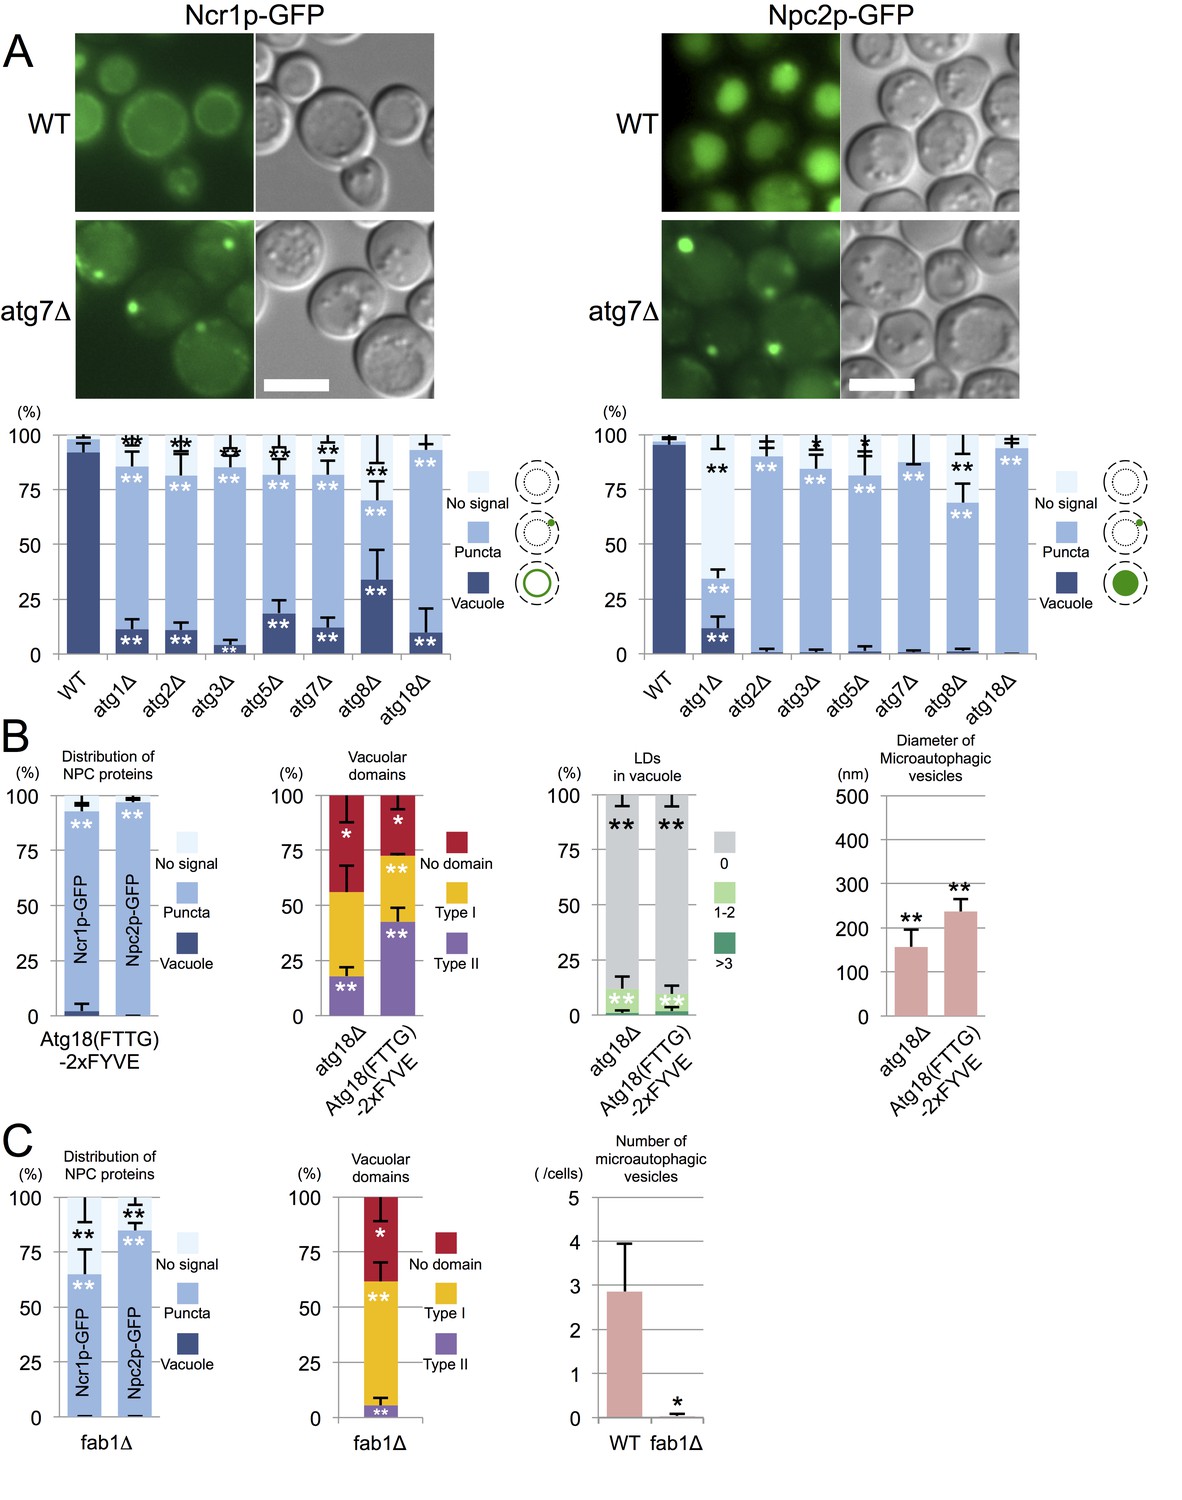
Trafficking defect of NPC proteins impairs stationary phase lipophagy.
(A) Ncr1p–GFP and Npc2p–GFP in stationary phase were targeted to the vacuole in WT, but showed punctate distribution in a majority of Atg-deficient cells. Bar: 5 µm. The quantification data show the mean ± SD of a single representative experiment (n > 150 for each group) out of two to three replicates. (B) Expression of Atg18(FTTG)−2xFYVE did not correct the defects in atg18△ in stationary phase. Aberrant NPC distribution, decreased vacuolar domain formation, decreased lipophagy, and smaller microautophagic vesicles were observed in atg18△ expressing Atg18(FTTG)−2xFYVE. Respective data were obtained as in Figures 4A, 3A, B and D. (C) fab1△ showed aberrant NPC distribution, decreased vacuolar domain formation, and virtually no microautophagic vesicles. The data on NPC proteins and domain formation were obtained as in Figures 4A and 3A. The number of microautophagic vesicles was counted in three independent experiments. Mean ± SD (n = 3; >15 vacuoles were counted in each experiment). *p<0.05; **p<0.01.
Figure 4—figure supplement 1

Time course of Ncr1p–GFP distributional change in WT and mutants.
Ncr1p–GFP in WT distributed to the vacuolar membrane in log phase (day 0) through post-diauxic phase (day 1 and day 2) and stationary phase (day 3). In atg7Δ, Ncr1p–GFP was in the vacuolar membrane in log phase, but it started to appear in puncta in day 2, and the punctate distribution became prevalent in day 3. In pep4Δ, Ncr1p–GFP showed a vacuolar distribution like that in WT even in stationary phase, whereas in fab1Δ, the punctate distribution of Ncr1p–GFP was already predominant in day 1. Bar: 5 μm.
Figure 4—figure supplement 2

Distribution of Vph1p–mRFP.
Vph1p–mRFP in stationary phase showed similar distribution in the vacuole in WT and atg18Δ. Bar: 5 μm.
Figure 4—figure supplement 3
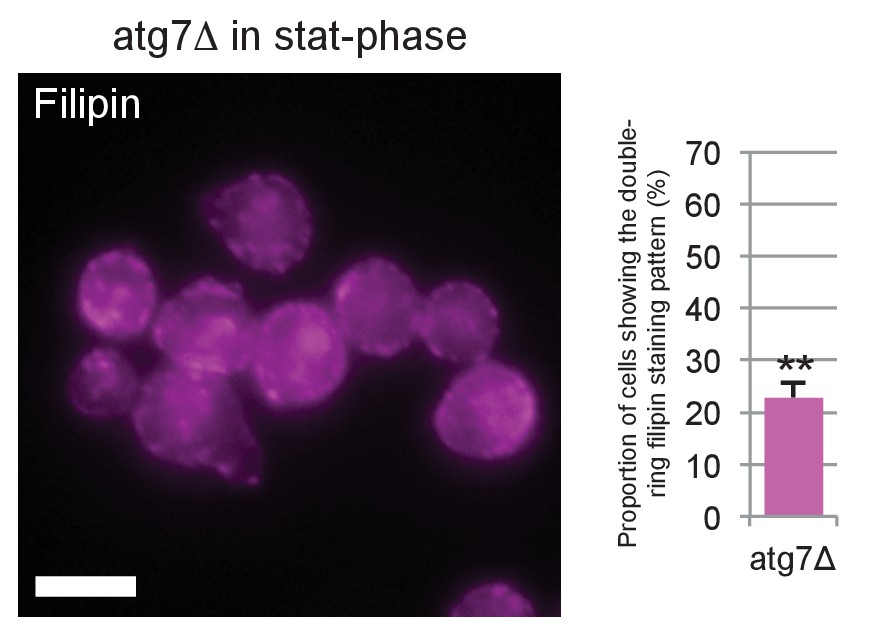
Filipin staining of atg7Δ in stationary phase.
Filipin staining was performed by the method described for Figure 3E, and the proportion of cells showing the double-ring filipin-staining pattern was measured. The ratio was significantly lower in atg7Δ than in WT, indicating that the sterol concentration in the vacuolar membrane of atg7Δ was less than that of WT. Bar: 5 μm. **p<0.01.
Figure 4—figure supplement 4
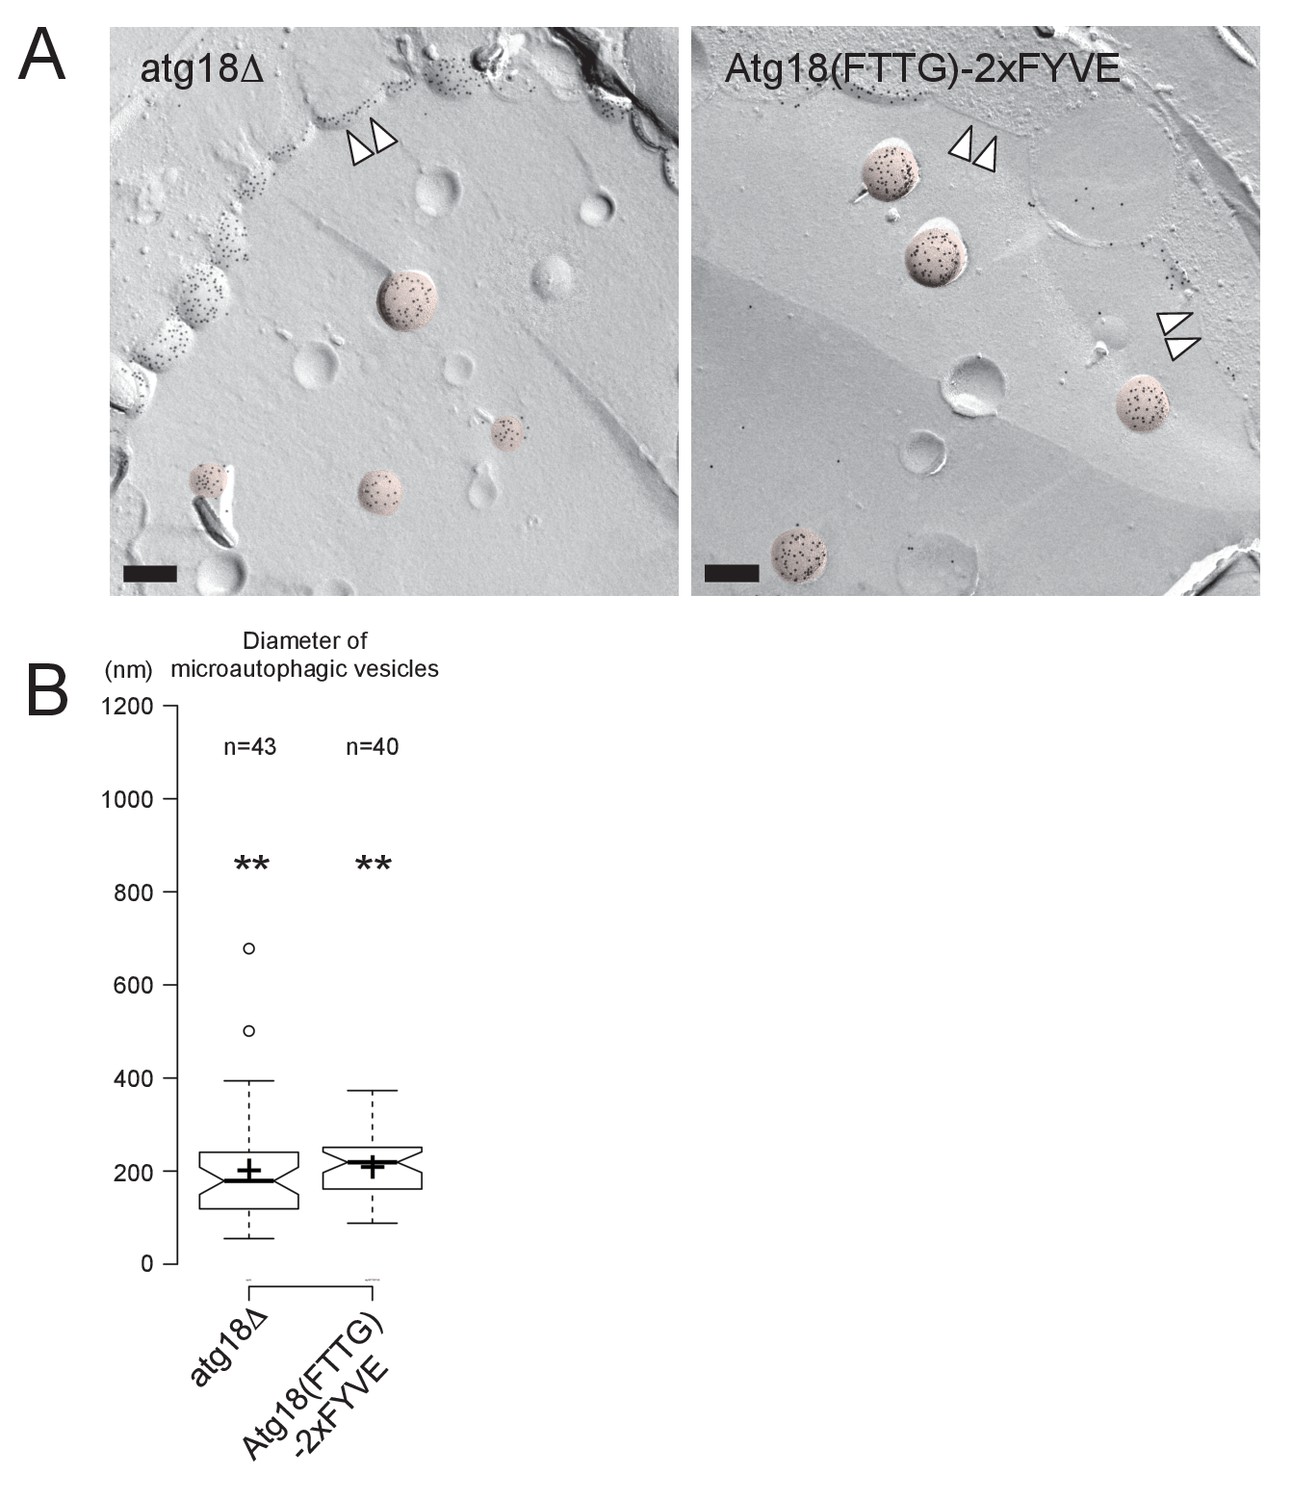
Microautophagic vesicles in atg18Δ with or without expressing Atg18(FTTG)−2xFYVE in stationary phase.
(A) The microautophagic vesicles (colored in red) defined by the PtdIns(3)P labeling in the cytoplasmic leaflet appeared to be of similar sizes in atg18Δ with or without expressing Atg18(FTTG)−2xFYVE. Bars: 0.2 μm. (B) The diameter of microautophagic vesicles was significantly smaller in atg18Δ than in WT irrespective of the expression of Atg18(FTTG)−2xFYVE. The result of one representative experiment out of three independent experiments is presented. **p<0.01.
Figure 4—figure supplement 5
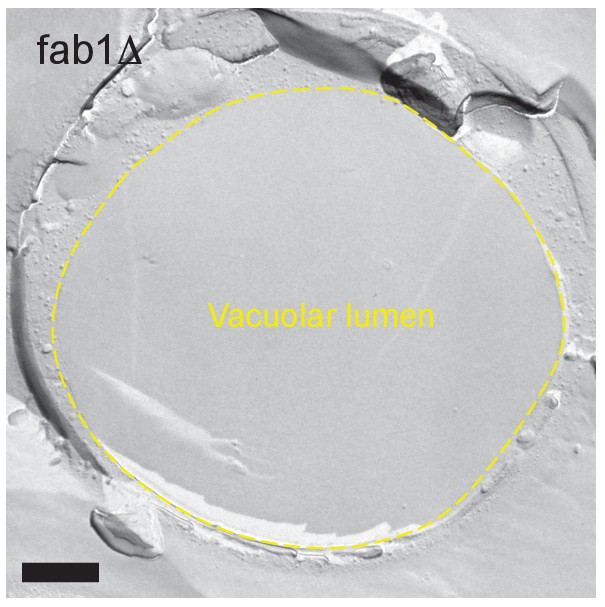
Freeze-fracture replica EM of fab1Δ in stationary phase.
The vacuolar lumen was vacant. Bar: 0.5 μm.
Figure 4—figure supplement 6

Distribution of Ncr1p–GFP and Npc2p–GFP in stationary phase.
The proportion of cells showing vacuolar distribution of Ncr1p–GFP and Npc2p–GFP was significantly smaller in vps4Δ and nem1Δ than in WT. Mean ± SD of one representative experiment (n > 150 for each group) out of two repeats. Statistical difference was examined in comparison to the WT shown in Figure 4A. **p<0.01.
Figure 5 with 3 supplements
Microautophagy in acute nitrogen starvation also occurs at NPC-dependent raft-like domains.
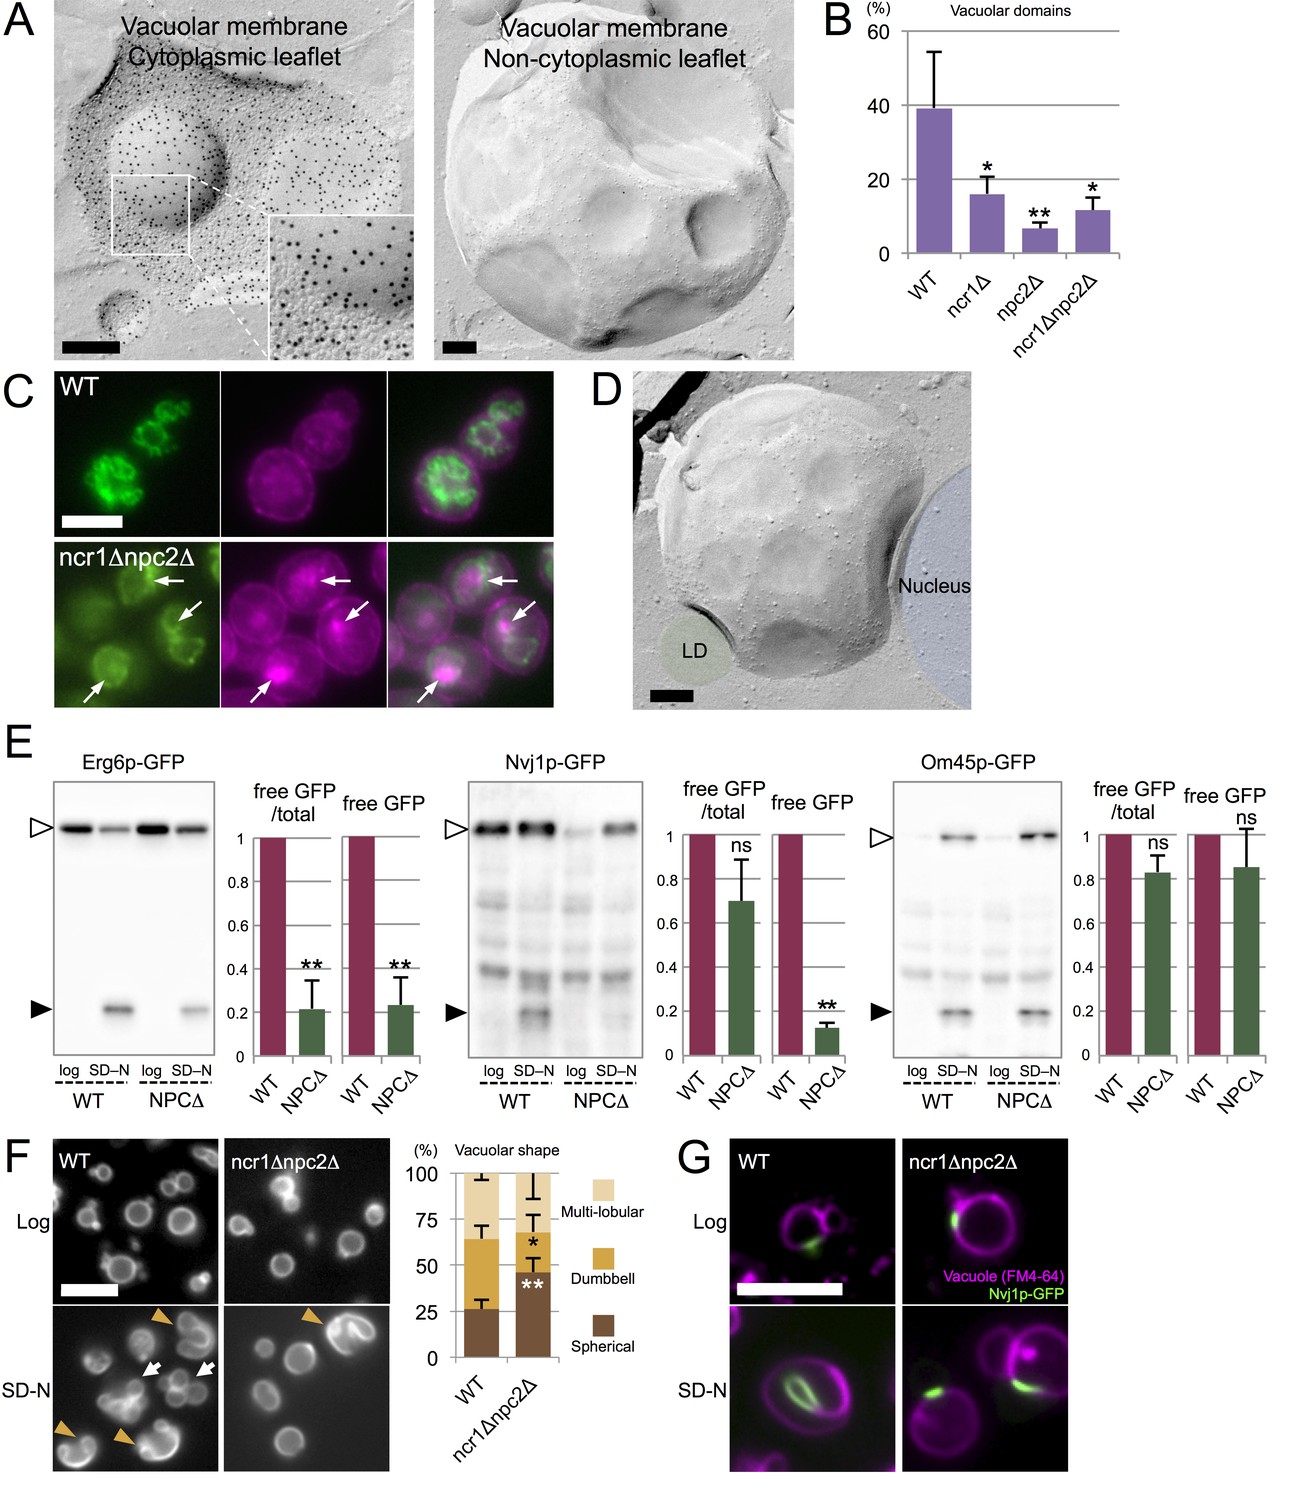
(A) The IMP-deficient raft-like domains in the vacuolar membrane of WT after nitrogen starvation for 5 hr. These domains were observed both in the cytoplasmic leaflet (P face) and the non-cytoplasmic leaflet (E face). The P face is densely labeled for PtdIns(3)P both in the IMP-rich and IMP-deficient domains. Bars: 0.2 µm. (B) IMP-deficient raft-like domains were significantly less frequent in NPC-deficient cells than in WT. Cells showing more than one raft-like domain were counted. Mean ± SD (n > 3; >50 vacuoles were counted for each group in each experiment). *p<0.05; **p<0.01. (C) Filipin staining in nitrogen-starved cells. Sterol (magenta) was stained in the area overlapping with the vacuolar membrane visualized by Vph1p–GFP (green) in WT, whereas in ncr1△npc2△, sterol-rich deposits (arrows) were observed in the vacuolar lumen encircled by Vph1p–GFP. Bar: 5 µm. (D) The IMP-deficient domain showed close apposition to an LD (green) and the nucleus (blue). Bar: 0.2 µm. See also Figure 5—figure supplement 2. (E) Degradation of organelle markers by nitrogen starvation for 5 hr: Erg6p–GFP (LD), Nvj1p–GFP (nucleus), and Om45p–GFP (mitochondria). The intensity of free GFP bands (black arrowheads) and the relative ratio of free GFP to the full-length protein (white arrowheads) were measured. Degradation of Erg6p–GFP and Nvj1p–GFP was significantly reduced in ncr1△npc2△ (NPC△) compared to WT, whereas degradation of Om45p–GFP was not. Mean ± SEM (n = 3). **p<0.01. (F) Vacuoles (Vph1p–mRFP) showed dumbbell-like (arrowheads) and multi-lobular shapes (arrows) after nitrogen starvation in WT, but shape change was much less frequent in ncr1△npc2△. Bar: 5 µm. Mean ± SD of a single representative experiment (n > 150 for each group) out of three repeats. *p<0.05; **p<0.01. (G) Nvj1p–GFP (green) in WT showed marked elongation along the deformed vacuole after nitrogen starvation (magenta; FM4-64), but this change was minimal in ncr1△npc2△. Bar, 5 µm.
Figure 5—figure supplement 1
Distribution of Vph1p–mRFP in the vacuolar membrane after nitrogen starvation.
Vph1p-mRFP was labeled only in the IMP-rich area (arrows) and not in the IMP-deficient domain. The result verified that the IMP-deficient domain induced by acute nitrogen starvation has raft-like properties similar to those seen in stationary phase. Bar: 0.2 μm.
Figure 5—figure supplement 2
Close association of the raft-like domain and organelles.
(A) Freeze-fracture EM. LDs and the nucleus were associated with the IMP-deficient domain of the vacuole in nitrogen starvation. LDs were often enclosed within the vacuolar membrane invagination. Bar: 0.2 μm. (B) Freeze-fracture/etching EM showed LDs engulfed by the vacuolar invagination. A close association between the nucleus and the vacuole was also observed. Bar: 0.2 μm.
Figure 5—figure supplement 3

Effects of NPC deficiency in nitrogen starvation.
(A) The number and sizes of LDs. Quantification after nitrogen starvation for 5 hr was done by the method described for Figure 3—figure supplement 2. Neither number nor sizes of LDs were drastically different between WT and NPC-deficient cells. Mean ± SD are shown. Five independent samples and more than 30 cells were counted to assess numbers, whereas three independent samples and more than 30 LDs were counted to assess sizes. **p<0.01. (B) Pho8Δ60 assay. Cells in log phase and after nitrogen starvation for 5 hr were compared. The Pho8Δ60 activity was normalized to the activity of WT after starvation. Deletion of NPC proteins did not affect bulk autophagic activity. Mean ± SD of triplicate samples are shown. (C) Distribution of LDs. After nitrogen starvation, LDs (green) were aligned along the indented surfaces of dumbbell-like vacuoles (magenta; Vph1p–mRFP) in WT. Bar: 5 μm.
Figure 6 with 2 supplements
The MVB pathway supplies sterol for induction of microautophagy.
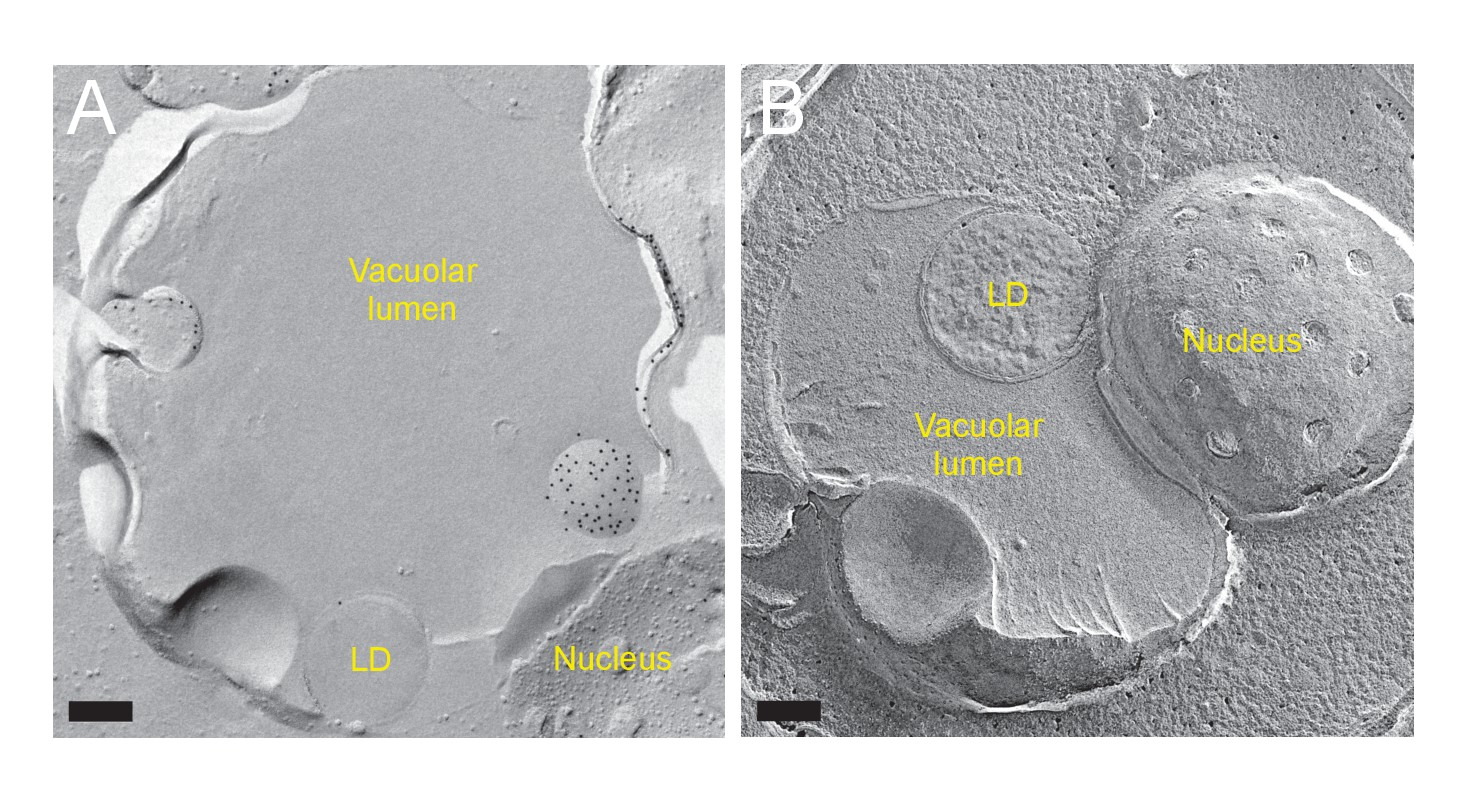
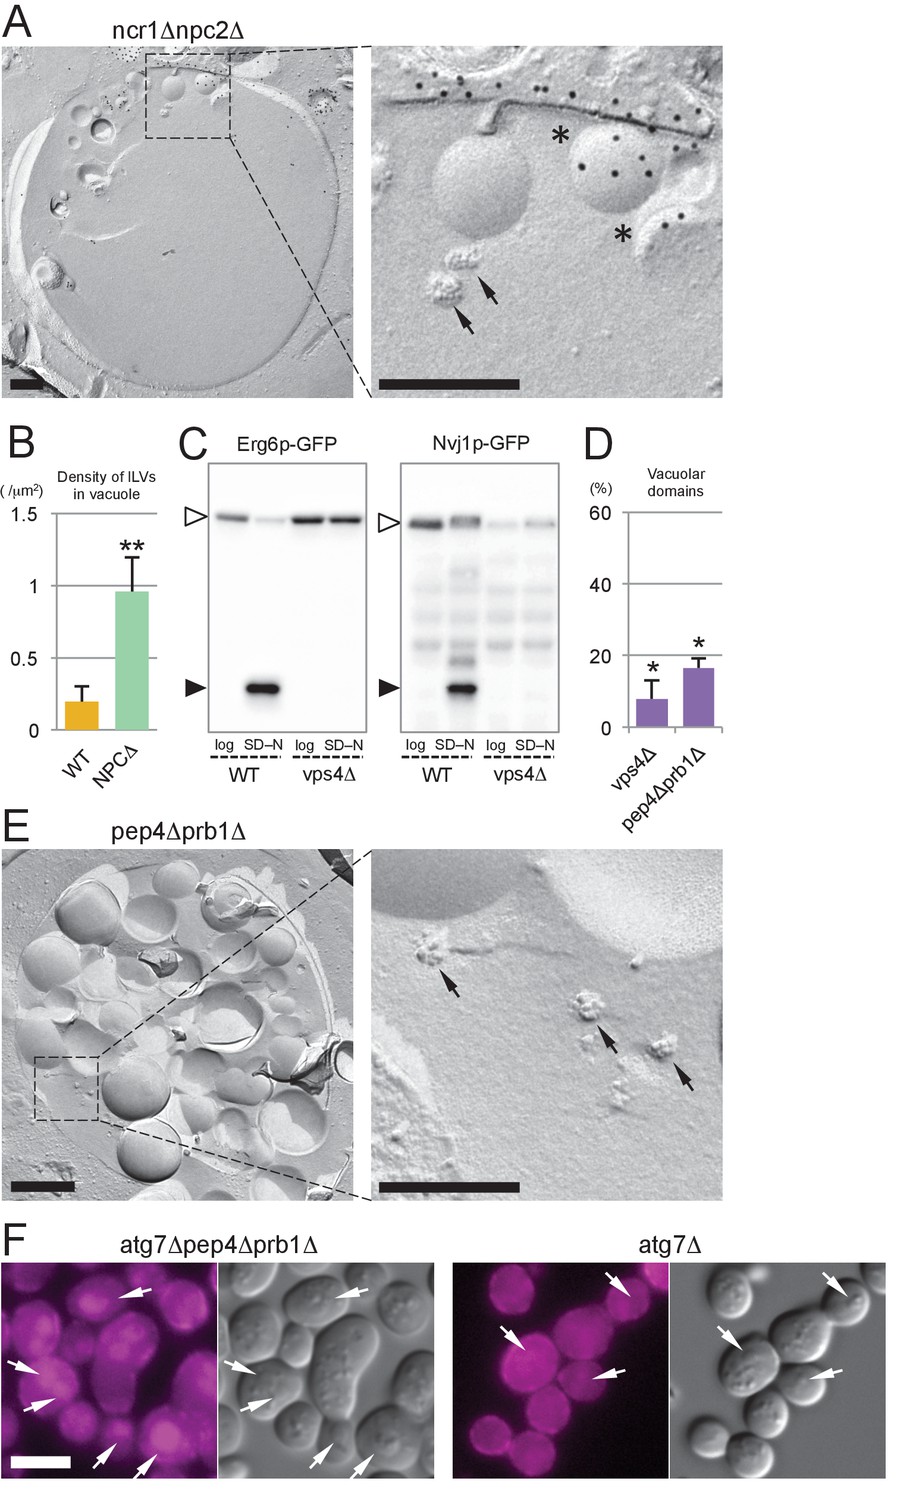
(A) The vacuolar content of ncr1△npc2△ after nitrogen starvation for 5 hr. ILVs, seen as small rugged structures (arrows), and microautophagic vesicles labeled for PtdIns(3)P in the cytoplasmic leaflet (*) were observed. Bars: 0.2 µm. (B) The density of ILVs in the vacuolar lumen after nitrogen starvation was significantly higher in ncr1△npc2△ than in WT. Mean ± SD are represented (n = 3; >30 vacuoles were counted in each experiment). **p<0.01. (C) Degradation of Erg6p–GFP and Nvj1p–GFP in nitrogen starvation was suppressed in vps4△. The bands of the full-length proteins (white arrowheads) and free GFP (black arrowheads) are marked. (D) Raft-like domains in the vacuolar membrane were significantly less frequent in vps4△ and pep4△prb1△ than in WT (see Figure 5B for WT). *p<0.05. (E) The vacuolar content of pep4△prb1△ after nitrogen starvation. The vacuolar lumen was filled with autophagic bodies (left figure; bar, 0.5 µm) and ILVs (arrows in the right panel; bar, 0.2 µm). (F) Filipin staining showed that the vacuolar lumen of atg7△pep4△prb1△ after nitrogen starvation contains abundant sterol-rich structures, whereas that of atg7△ does not (arrows). Combined with the result of freeze-fracture EM (see Figure 6—figure supplement 1D), the filipin fluorescence in the vacuolar lumen of atg7△pep4△prb1△ is thought to be derived from ILVs. Bar: 5 µm.
Figure 6—figure supplement 1
Analysis of MVB and vps4Δ.
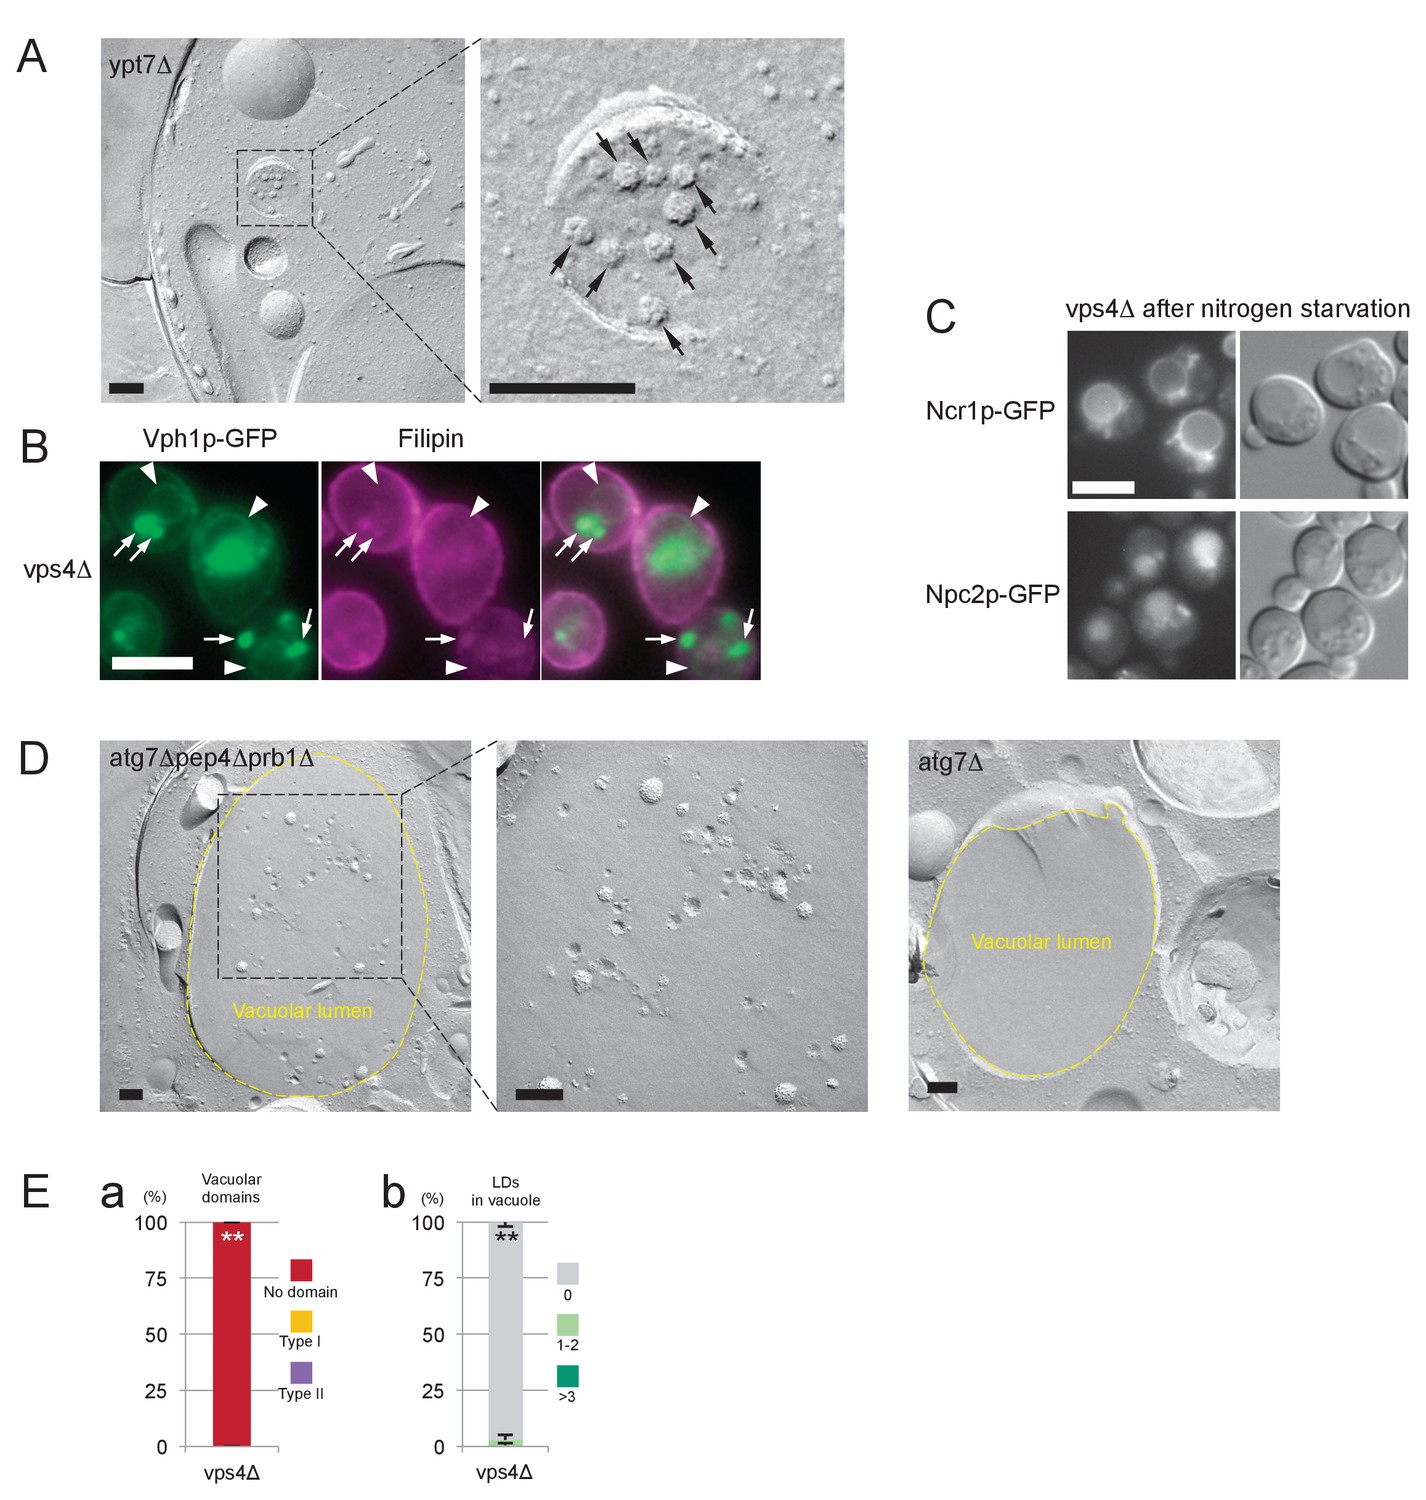
(A) Freeze-fracture EM of MVB in ypt7Δ. ILVs in the lumen are observed as rugged structures (arrows). Bar: 0.2 μm. (B) Filipin staining in vps4Δ after nitrogen starvation. Vph1p–GFP (green) was observed in the vacuolar membrane (arrowheads) and in the class E compartment (arrows). Filipin staining was intense in the class E compartment, but it was negligible in the vacuolar membrane area. Bar: 5 μm. (C) Distribution of NPC proteins in vps4Δ after nitrogen starvation. Ncr1p–GFP and Npc2p–GFP were observed in the vacuolar membrane and in the vacuolar lumen, respectively. Bar: 5 μm. (D) The vacuolar content of atg7Δpep4Δprb1Δ and atg7Δ after nitrogen starvation. The vacuolar lumen of atg7Δpep4Δprb1Δ after nitrogen starvation contained a large number of ILVs, whereas that of atg7Δ was virtually vacant. Bar: 0.2 μm. (E) vps4Δ in stationary phase. (a) Domain formation was completely absent in vps4Δ. See Figure 3A for comparison. Mean ± SD of three independent experiments (>50 vacuoles were counted for each group in each experiment) are represented. (b) Lipophagy was also absent in vps4Δ. See Figure 3B for comparison. Mean ± SD of one representative experiment (n > 150 for each group) out of two repeats are shown. **p<0.01.
Figure 6—figure supplement 2
are1Δare2Δ in stationary phase.
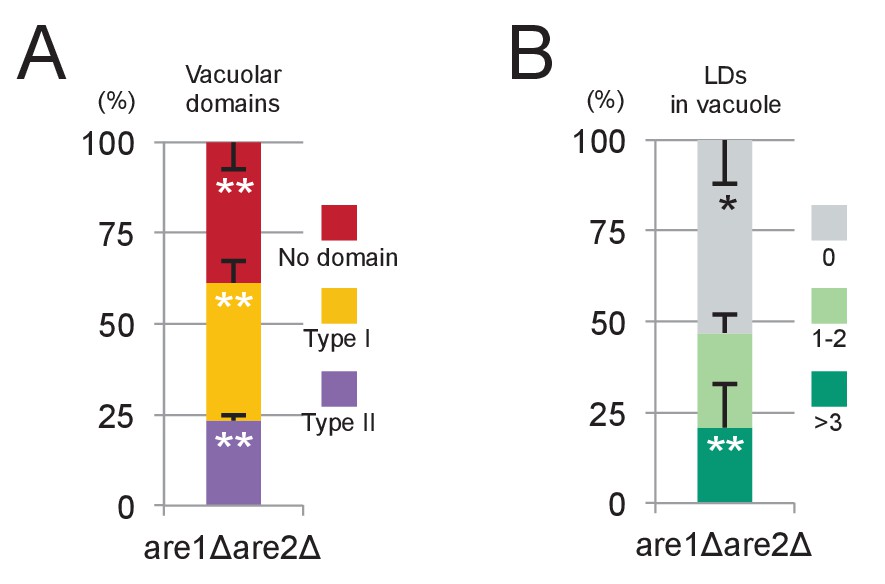
(A) Vacuolar domain formation was observed in are1Δare2Δ, although its frequency was lower than that in WT. See Figure 3A for comparison. Mean ± SD of three independent experiments (>50 vacuoles were counted for each group in each experiment) are represented. (B) Lipophagy in are1Δare2Δ was observed at a level comparable to that in WT. See Figure 3B for comparison. Mean ± SD of one representative experiment (n > 150 for each group) out of two repeats are illustrated. *p<0.05; **p<0.01.
Figure 7 with 1 supplement
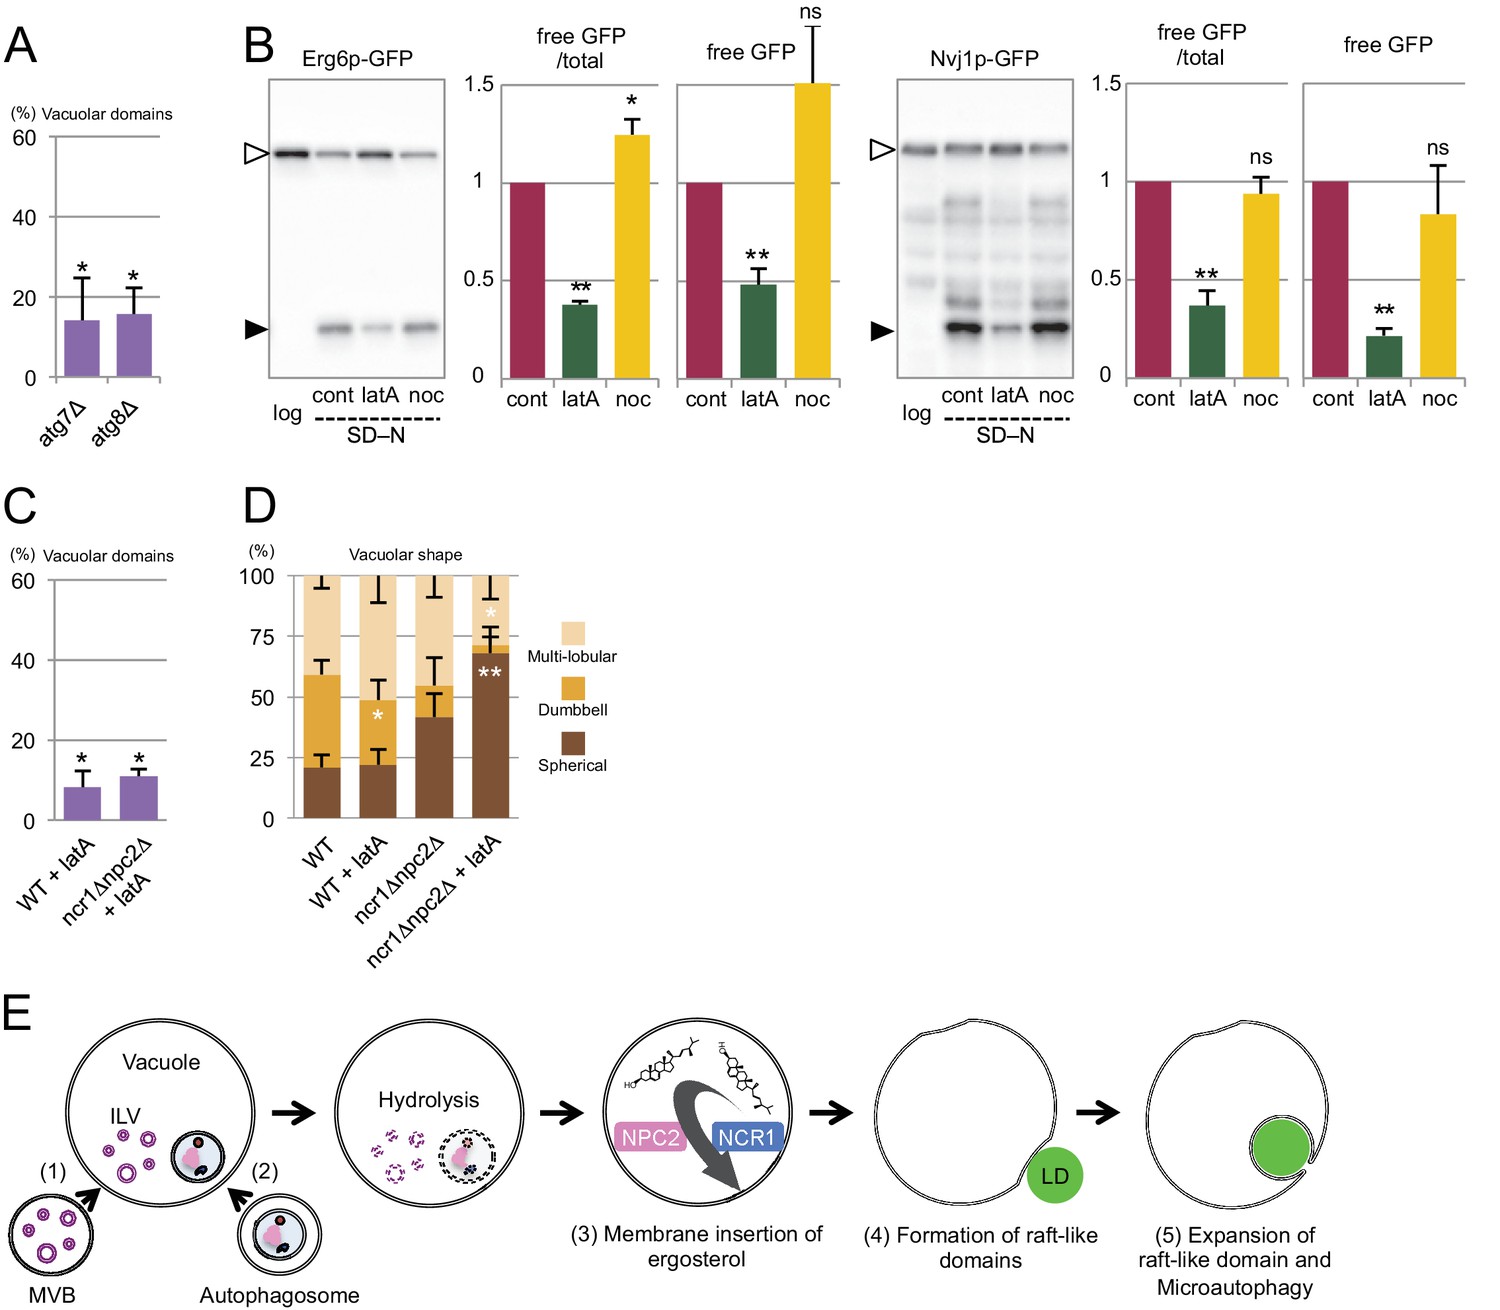
Involvement of Atg proteins and actin filaments in microautophagy during acute nitrogen starvation.
(A) Raft-like domain formation after nitrogen starvation was significantly less frequent in atg7△ and atg8△ than in WT (see Figure 5B for WT). (B) Degradation of Erg6p–GFP and Nvj1p–GFP in nitrogen starvation was suppressed by latrunculin A (0.2 mM; latA), but not by nocodazole (10 µg/ml; noc). Mean ± SEM (n = 3) are shown. The intensity of free GFP bands (black arrowheads) and the relative density ratio of free GFP to the full-length protein (white arrowheads) were quantified. *p<0.05; **p<0.01. (C) Raft-like domain formation after nitrogen starvation in WT was reduced by latrunculin A (latA). Raft-like domain in ncr1△npc2△, which was already low, was not further decreased by latrunculin A. The result was compared to that of WT and ncr1△npc2△ shown in Figure 5B. (D) The rate of vacuolar shape change in nitrogen starvation was reduced by latrunculin A (latA). Vacuoles were classified as in Figure 5F. Latrunculin A further decreased the rate of shape change in ncr1△npc2△. The results (mean ± SD) of one representative experiment (n > 150 for each group) out of three repeats are shown. *p<0.05; **p<0.01. (E) The putative mechanism of microautophagy in nitrogen starvation. (1) The activated MVB pathway delivers sterol-rich ILVs to the vacuole; (2) autophagosomes fuse with the vacuolar membrane to supply sphingolipids; (3) NPC proteins transport sterol from decomposing ILVs to the vacuolar membrane; (4) the generated raft-like domain adheres to cargo organelles via raft-philic receptors; and (5) the raft-like domain expands to engulf cargos leading to microautophagy.
Figure 7—figure supplement 1
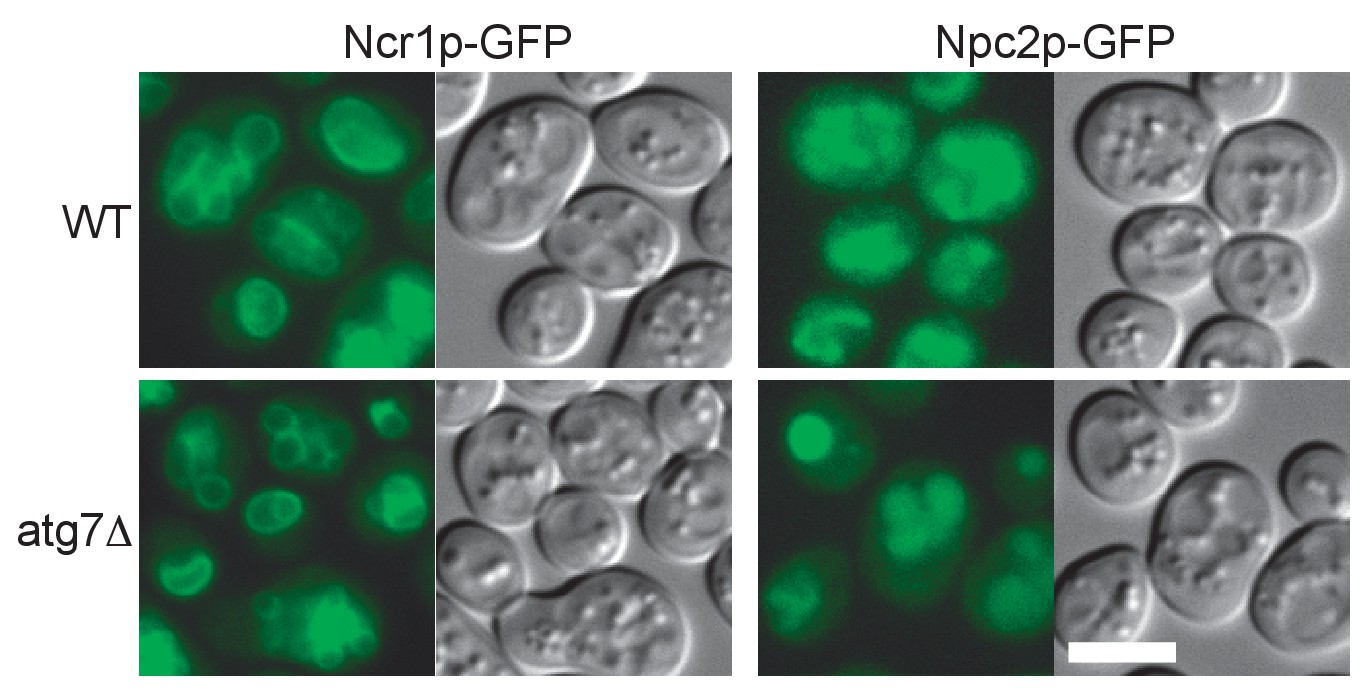
Distribution of Ncr1p–GFP and Npc2p–GFP after nitrogen starvation.
In both WT and atg7Δ, Ncr1p–GFP and Npc2p–GFP were observed in the membrane and in the lumen of the vacuole, respectively. Bar: 5 μm.
Videos
Video 1
Tilted images of a freeze-fracture/etching replica of stationary phase yeast.
An LD revealing the non-etchable content is adhered to the IMP-deficient domain of the vacuolar membrane.
Tables
Table 1
Yeast strains used in this study.
| Name | Genotype | Reference/origin |
|---|---|---|
| SEY6210 | MATα leu2-3,112 ura3-52 his3-∆200 trp1-∆901 lys2-801 suc2-∆9 | Robinson et al. (1988) |
| KVY4 | SEY6210; ypt7Δ::LEU2 | Kihara et al. (2001) |
| KVY5 | SEY6210; atg8Δ::HIS3 | Kirisako et al. (1999) |
| KVY135 | SEY6210; atg7Δ::HIS3 | Obara et al. (2008) |
| TKY1001 | SEY6210; atg18Δ::KanMX | Cheng et al. (2014) |
| YT350 | SEY6210; pep4Δ::hphNT1, prb1Δ::natNT2 | This study |
| YT956 | SEY6210; fab1Δ::cgTRP1 | This study |
| YT1167 | SEY6210; NVJ1–yeGFP::klTRP1 | This study |
| YT1242 | SEY6210; npc2Δ::cgHIS3 | This study |
| YT1276 | SEY6210; ncr1Δ::cgTRP1, npc2Δ::cgHIS3 | This study |
| YT1278 | SEY6210; ncr1Δ::cgTRP1, pho8Δ60::natNT2 | This study |
| YT1287 | SEY6210; VPH1–mRFP::natNT2, ncr1Δ::cgTRP1, npc2Δ::cgHIS3 | This study |
| YT1288 | SEY6210; ncr1Δ::natNT2 | This study |
| YT1296 | SEY6210; VPH1–yeGFP::hphNT1 | This study |
| YT1325 | SEY6210; NCR1–yeGFP::klTRP1 | This study |
| YT1330 | SEY6210; npc2Δ::cgHIS3, pho8Δ60::natNT2 | This study |
| YT1331 | SEY6210; ncr1Δ::cgTRP1, npc2Δ::cgHIS3, pho8Δ60::natNT2 | This study |
| YT1349 | SEY6210; npc2(P143S)::cgTRP1 | This study |
| YT1371 | SEY6210; NPC2–yeGFP::cgTRP1 | This study |
| YT1373 | SEY6210; fab1Δ::cgTRP1, NPC2–yeGFP::hphNT1 | This study |
| YT1385 | SEY6210; atg18Δ::KanMX, NCR1–yeGFP::klTRP1 | This study |
| YT1386 | SEY6210; atg18Δ::KanMX, NPC2–yeGFP::klTRP1 | This study |
| YT1388 | SEY6210; fab1Δ::cgTRP1, NCR1–yeGFP::hphNT1 | This study |
| YT1467 | SEY6210; VPH1–mRFP::natNT2 | This study |
| YT1474 | SEY6210; nem1Δ::cgHIS3, NCR1–yeGFP::klTRP1 | This study |
| YT1476 | SEY6210; nem1Δ::cgHIS3, NPC2–yeGFP::klTRP1 | This study |
| YT1479 | SEY6210; VPH1–yeGFP::hphNT1, ncr1Δ::TRP1, npc2Δ::HIS3 | This study |
| YT1481 | SEY6210; vps4Δ::cgHIS3, NCR1–yeGFP::klTRP1 | This study |
| YT1482 | SEY6210; vps4Δ::cgHIS3, NPC2–yeGFP::klTRP1 | This study |
| YT1503 | SEY6210; atg18Δ::KanMX, ATG18p-atg18(FTTG)−3HA-2FYVE, NCR1–yeGFP::klTRP1 | This study |
| YT1509 | SEY6210; ncr1Δ::cgTRP1, npc2Δ::cgHIS3, ERG6–yeGFP::klTRP1 | This study |
| YT1517 | SEY6210; atg18Δ::KanMX, ATG18p-atg18(FTTG)−3HA-2FYVE, NPC2–yeGFP::klTRP1 | This study |
| YT1523 | SEY6210; ncr1Δ::cgTRP1, npc2Δ::cgHIS3,NVJ1–yeGFP::hphNT1 | This study |
| YT1536 | SEY6210; ncr1Δ::cgTRP1, npc2Δ::cgHIS3, Om45–yeGFP::hphNT1 | This study |
| YT1542 | SEY6210; ERG6–yeGFP::natNT2 | This study |
| YT1549 | SEY6210; vps4Δ::natNT2, NVJ1–yeGFP::hphNT1 | This study |
| YT1552 | SEY6210; atg7Δ::HIS3, NCR1–yeGFP::klTRP1 | This study |
| YT1553 | SEY6210; atg3Δ::KanMX, NCR1–yeGFP::klTRP1 | This study |
| YT1554 | SEY6210; atg5Δ::LEU2, NCR1–yeGFP::klTRP1 | This study |
| YT1556 | SEY6210; atg2Δ::LEU2, NCR1–yeGFP::klTRP1 | This study |
| YT1557 | SEY6210; atg1Δ::KanMX, NCR1–yeGFP::klTRP1 | This study |
| YT1558 | SEY6210; atg7Δ::HIS3, NPC2–yeGFP::klTRP1 | This study |
| YT1559 | SEY6210; atg3Δ::KanMX, NPC2–yeGFP::klTRP1 | This study |
| YT1560 | SEY6210; atg5Δ::LEU2, NPC2–yeGFP::klTRP1 | This study |
| YT1561 | SEY6210; atg8Δ::HIS3, NPC2–yeGFP::klTRP1 | This study |
| YT1562 | SEY6210; atg2Δ::LEU2, NPC2–yeGFP::klTRP1 | This study |
| YT1569 | SEY6210; atg1Δ::KanMX, NPC2–yeGFP::klTRP1 | This study |
| YT1579 | SEY6210; atg8Δ::HIS3, NCR1–yeGFP::klTRP1 | This study |
| YT1583 | SEY6210; vps4Δ::cgHIS3, ERG6–yeGFP::klTRP1 | This study |
| YT1584 | SEY6210; atg8Δ::HIS3, NVJ1–yeGFP::klTRP1 | This study |
| YT1586 | SEY6210; atg7Δ::HIS3, ERG6–yeGFP::klTRP1 | This study |
| YT1591 | SEY6210; atg14Δ::LEU2, ERG6–yeGFP::natNT2 | This study |
| YT1592 | SEY6210; atg14Δ::LEU2, NVJ1–yeGFP::natNT2 | This study |
| YT1597 | SEY6210; atg8Δ::HIS3, ERG6–yeGFP::klTRP1 | This study |
| YT1598 | SEY6210; atg7Δ::HIS3, NVJ1–yeGFP::klTRP1 | This study |
| YT1726 | SEY6210; pep4Δ::hphNT1, prb1Δ::natNT2, atg7Δ::HIS3 | This study |
Download links
A two-part list of links to download the article, or parts of the article, in various formats.
Downloads (link to download the article as PDF)
Open citations (links to open the citations from this article in various online reference manager services)
Cite this article (links to download the citations from this article in formats compatible with various reference manager tools)
Niemann-Pick type C proteins promote microautophagy by expanding raft-like membrane domains in the yeast vacuole
eLife 6:e25960.
https://doi.org/10.7554/eLife.25960


