Ciliomotor circuitry underlying whole-body coordination of ciliary activity in the Platynereis larva
- Max Planck Institute for Developmental Biology, Germany
Figures
Figure 1
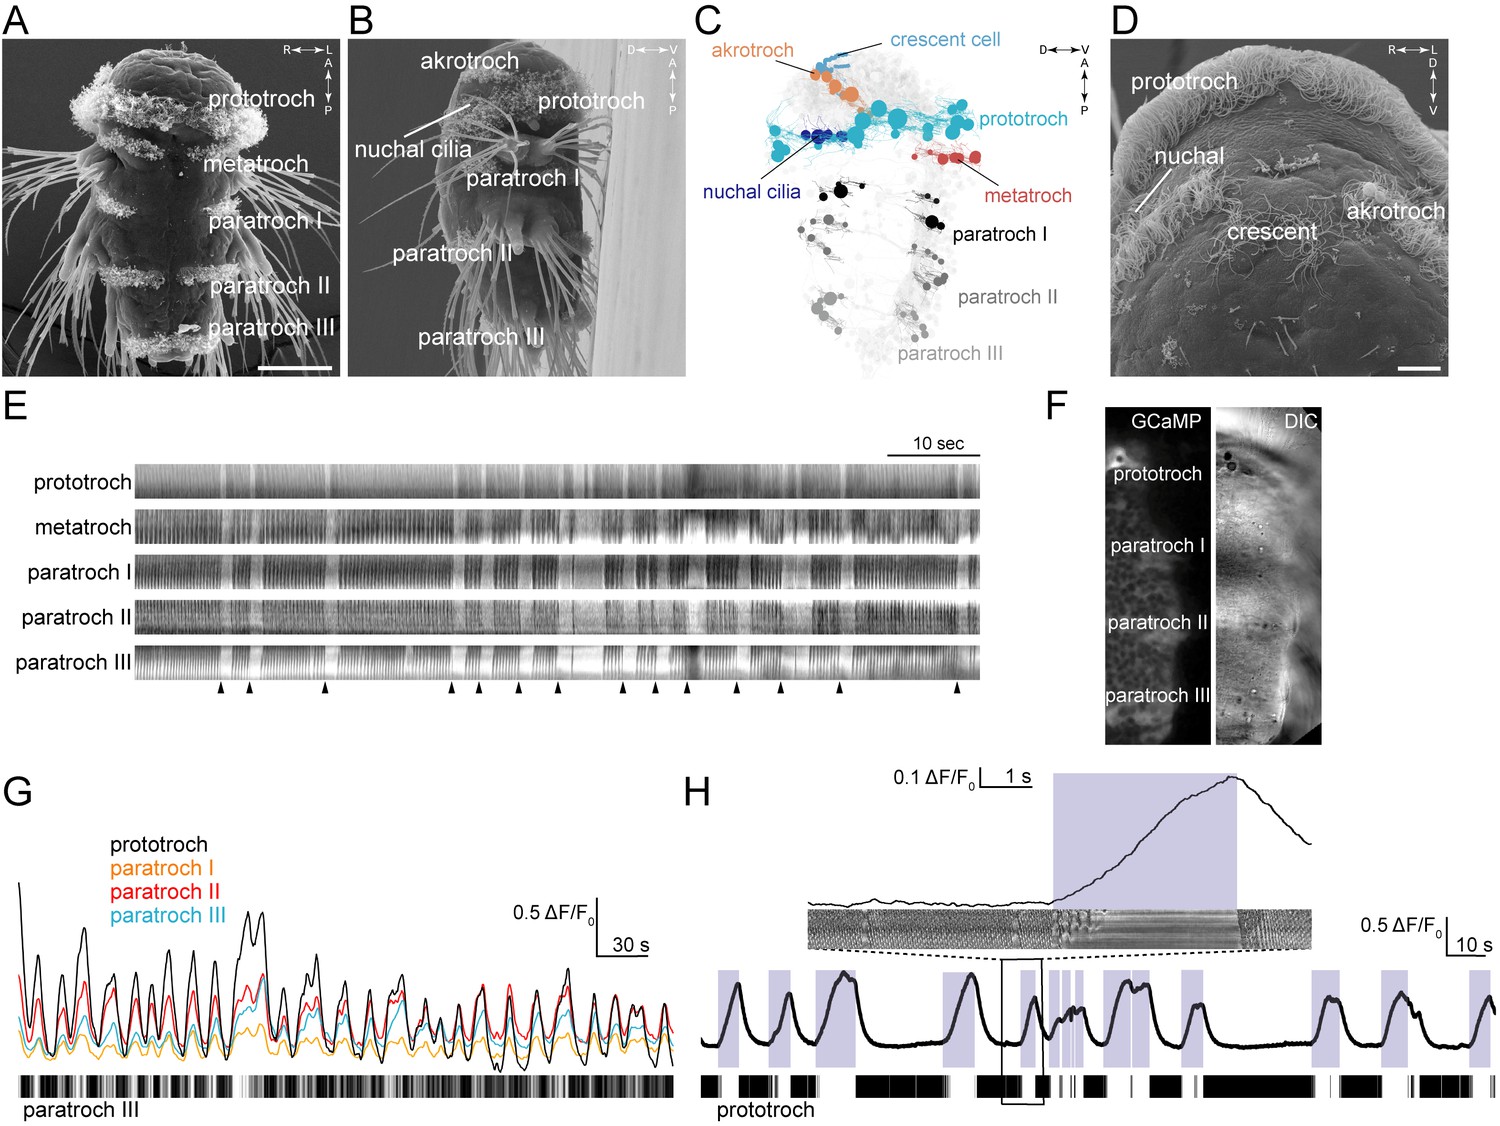
Coordinated ciliary beating and arrests in Platynereis larvae.
(A–B,D) Scanning electron micrographs of 72 hr-post-fertilization larvae, (A) ventral view, (B) lateral view, (D) anterior view, close up. The structures dorsal to the crescent cell are non-motile sensory cilia. (C) Serial TEM reconstruction of ciliary band cells, lateral view. Nuclei of ciliary band cells are shown as spheres. The nervous system (brain and ventral nerve cord) is shown in light grey. (E) Kymographs of spontaneous ciliary activity from an immobilized 72 hr-post-fertilization larva. Arrowheads indicate the beginning of ciliary arrests. (F) Ventral view of the left half of a 72 hr-post-fertilization larva in a calcium-imaging experiment (left panel) with the corresponding differential interference contrast (DIC) image (right panel). (G) GCaMP6s signal from the prototroch and paratroch ciliary bands. A kymograph of ciliary activity in paratroch III is shown below. (H) GCaMP6s signal recorded from the prototroch of a 48 hr-post-fertilization larva at 45 frames per second. White areas in the kymograph correspond to periods of arrest. The boxed area is shown enlarged in the inset. Scale bars, 50 μm (A), 10 μm (D).
Figure 2 with 2 supplements
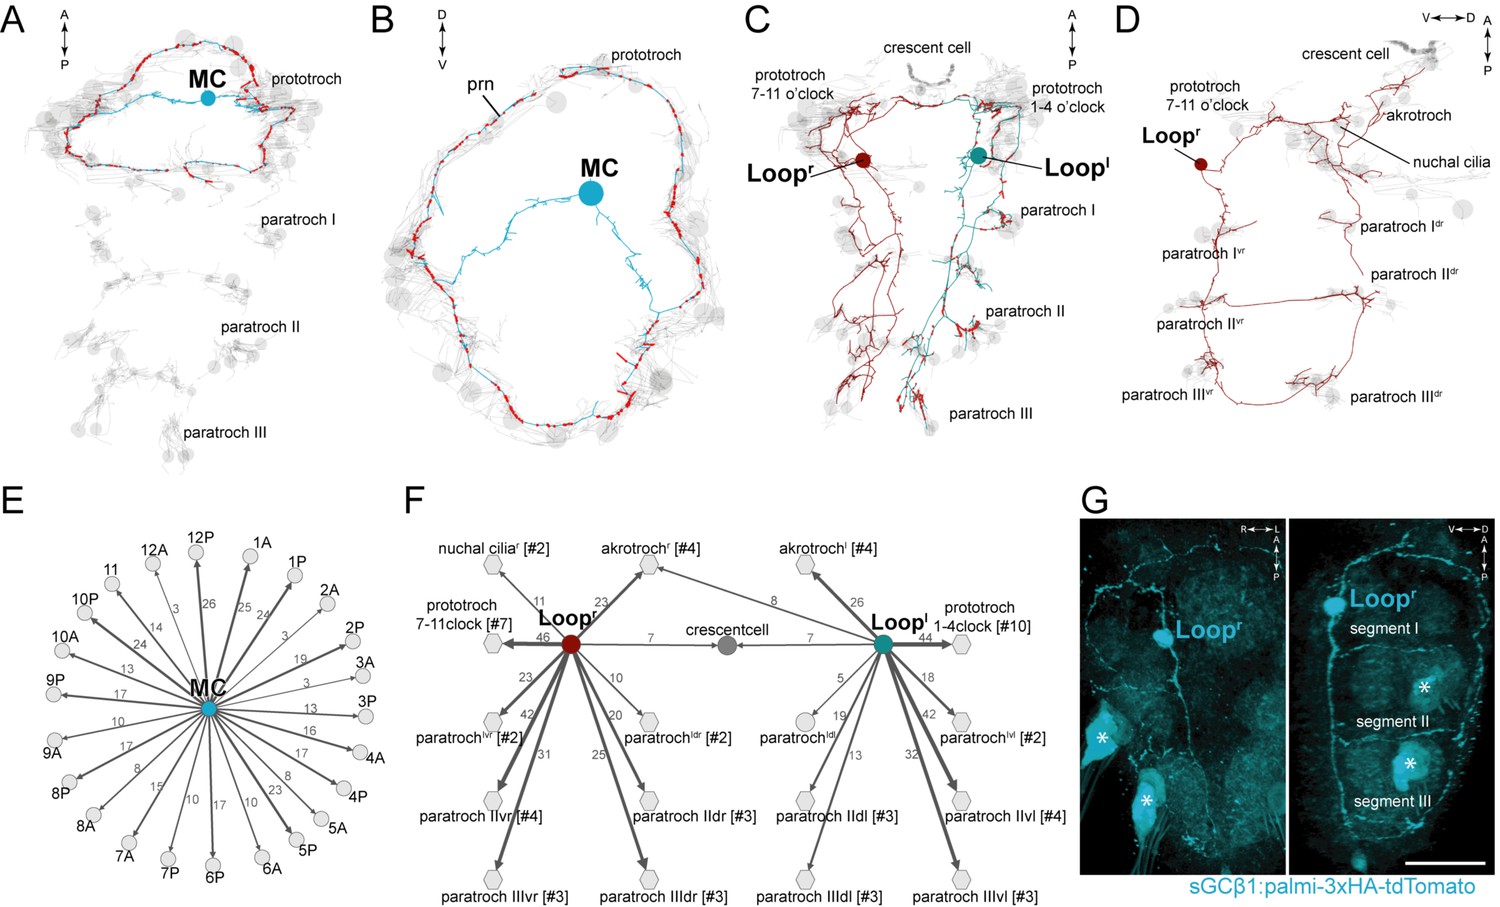
Anatomy and connectivity of biaxonal cholinergic ciliomotor neurons.
(A) ssTEM reconstruction of the MC neuron (blue), ventral view. Ciliated cells are shown in grey. Circles represent position of cell body, lines represent axonal track. Presynaptic sites along the axon are marked in red. (B) The MC neuron in anterior view. (C) ssTEM reconstruction of the Loop neurons, ventral view. (D) The right Loop neuron in lateral view. (E) Synaptic connectivity of the MC neuron and the prototroch cells. (F) Synaptic connectivity of the Loop neurons and ciliary band cells. (G) Transgenic labelling of the right Loop neuron with an sGCβ1:palmi-3xHA-tdTomato construct. Expression was detected with anti-HA antibody staining. Right panel: ventral view, left panel: lateral view. Asterisks indicate background signal in the spinning glands. In the network graphs, nodes represent individual or grouped cells, as indicated by the numbers in square brackets. The edges show the direction of signalling from presynaptic to postsynaptic cells. Edges are weighted by the number of synapses. The number of synapses is indicated on the edges. Scale bar, 40 μm (G). Abbreviation: prn, prototroch ring nerve.
Figure 2—figure supplement 1
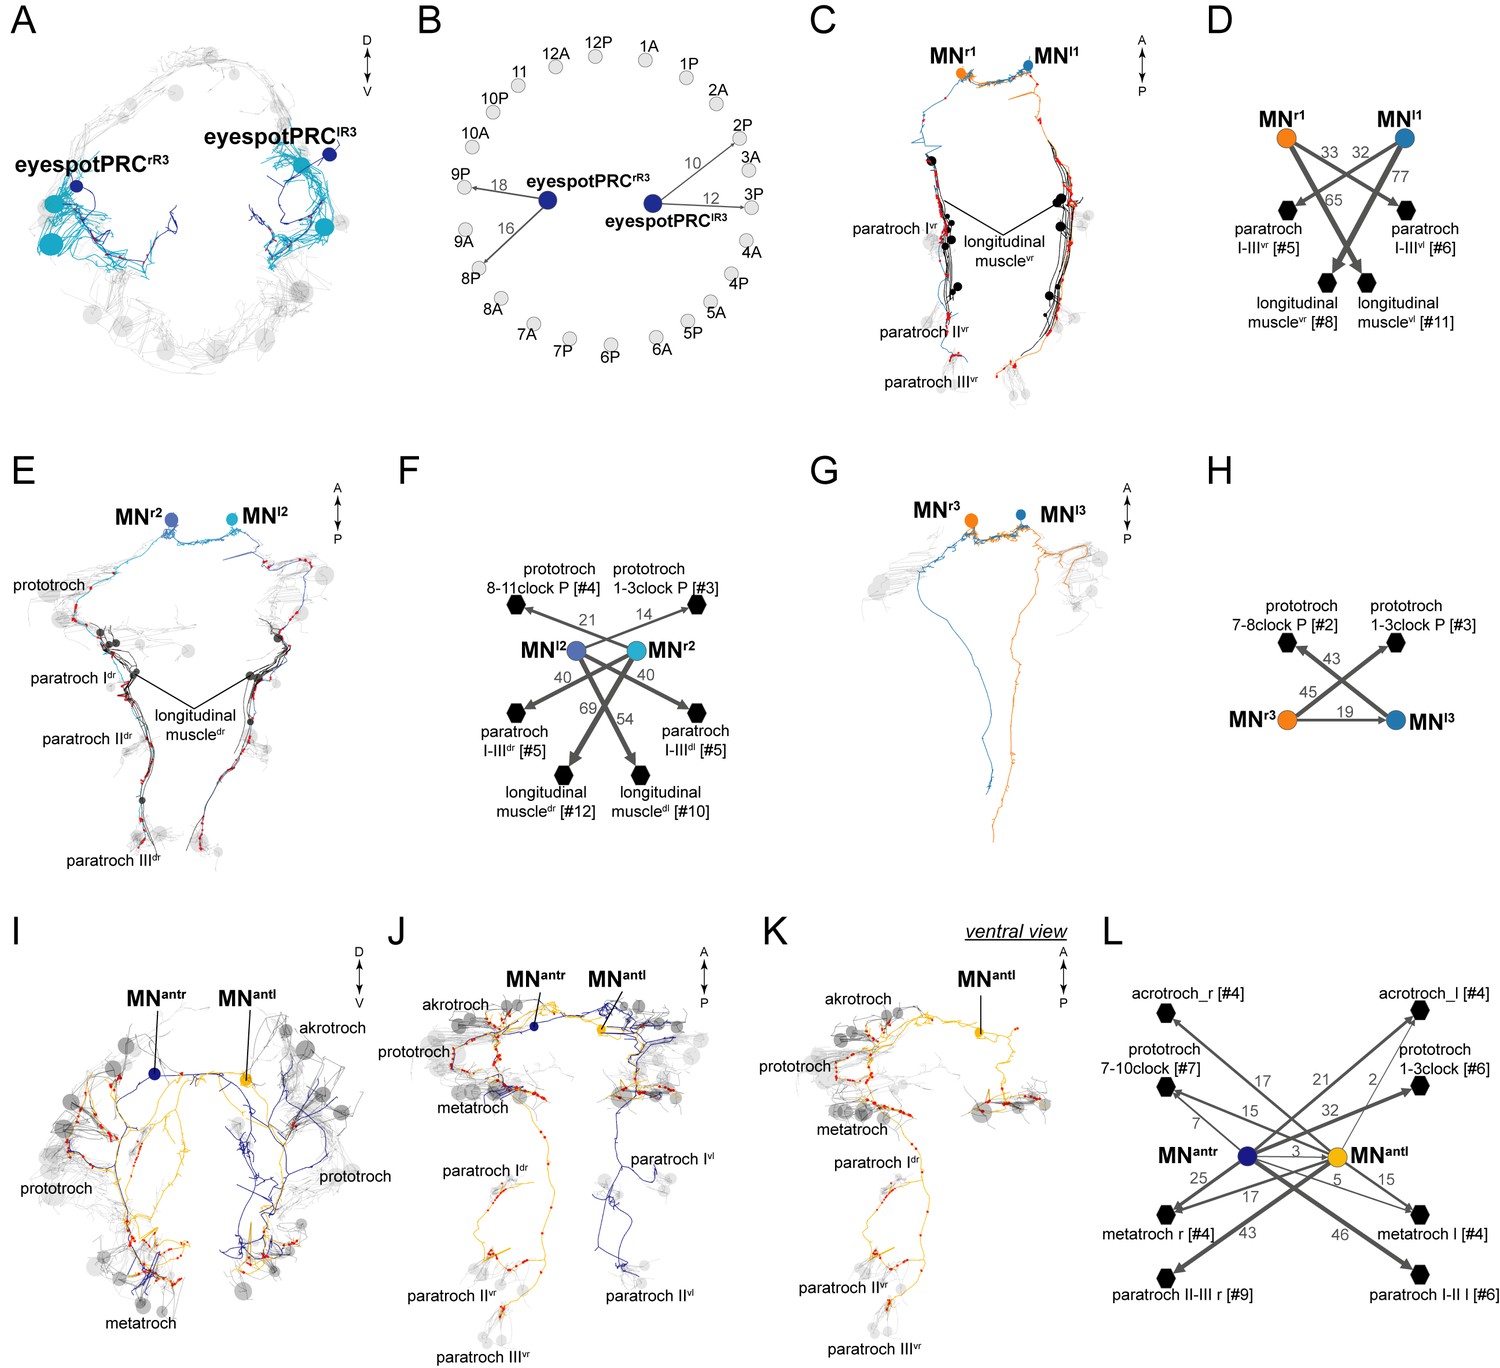
Anatomy and connectivity of eyespotPRCR3, ventral MN, and MNant ciliomotor neurons.
(A) ssTEM reconstruction of the eyespotPRCR3 neurons, anterior view. Ciliated cells are shown in grey or in teal if they receive synapses from eyespotPRCR3. (B) Synaptic connectivity of the eyespotPRCR3 neurons and prototroch. (C) ssTEM reconstruction of the MNr1 neurons, ventral view. (D) Synaptic connectivity of the MNr1 neurons, ciliary band cells, and muscles. (E) ssTEM reconstruction of the MNr2 neurons, ventral view. (F) Synaptic connectivity of the MNr2 neurons, ciliary band cells, and muscles. (G) ssTEM reconstruction of the MNr3 neurons, ventral view. (H) Synaptic connectivity of the MNr3 neurons and ciliary band cells. (I–L) ssTEM reconstruction of the MNant neurons, (I) anterior view, (J,K) ventral view. (L) Synaptic connectivity of the MNant neurons and ciliary band cells. In the network graphs, nodes represent individual or grouped cells, as indicated by the numbers in square brackets. The edges show the direction of signalling from presynaptic to postsynaptic cells. Edges are weighted by the number of synapses. The number of synapses is indicated on the edges.
Figure 2—figure supplement 2
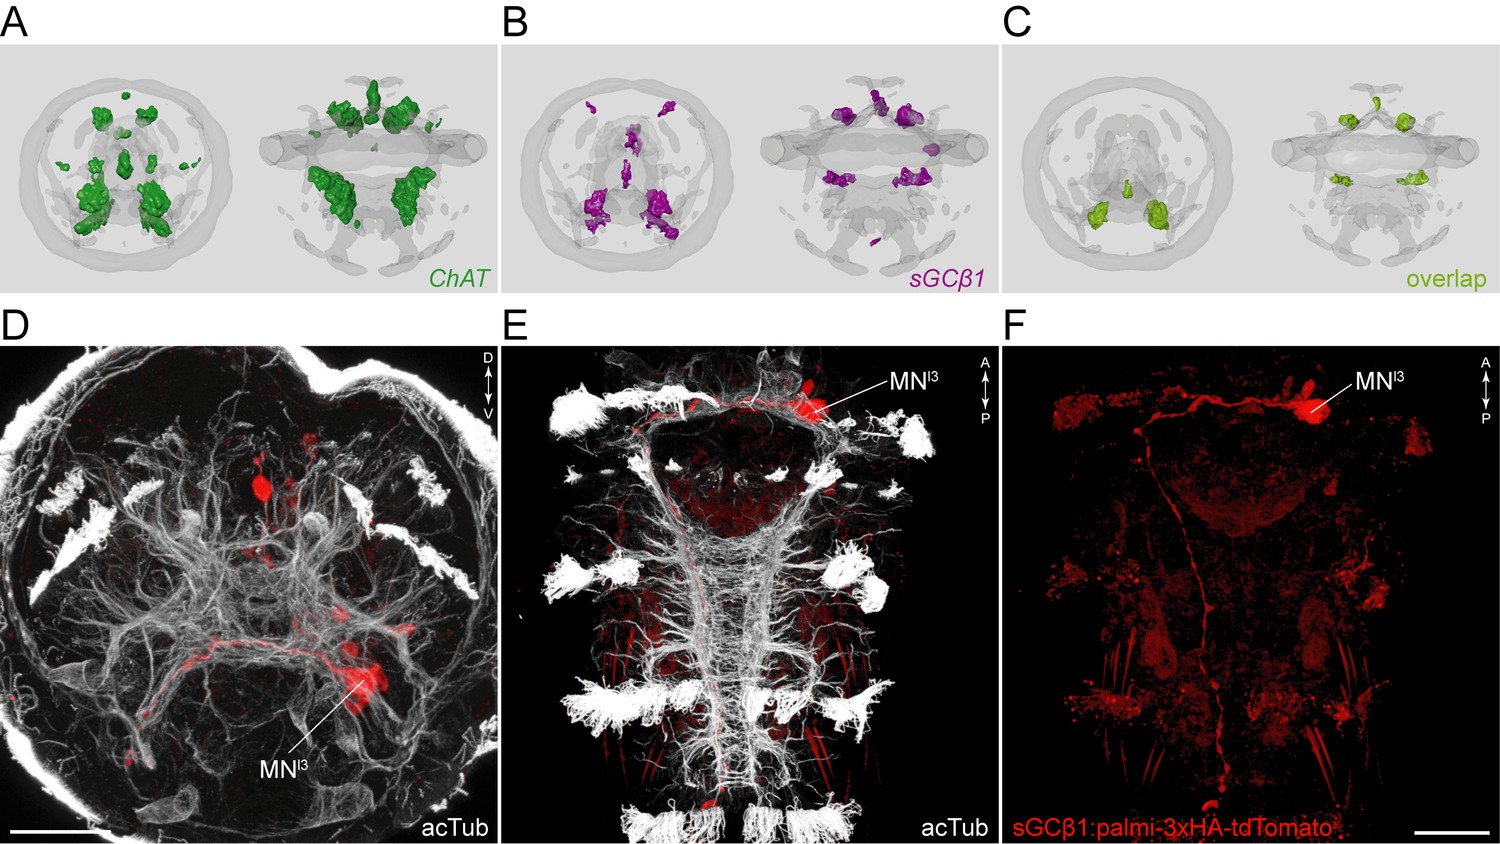
sGCbeta1 is a cholinergic marker.
Average registered gene expression pattern of (A) ChAT and (B) sGCbeta1. (C) Overlap of the ChAT and sGCbeta1 gene expression domains. (D–F) Transgenic labeling of MNl3 neuron with the sGCbeta1:palmi-3xHA-tdTomato construct. Larvae in (D,E) were counterstained for acetylated tubulin (white). Expression was detected with anti-HA antibody staining. Scale bar in (D,F) 30 µm.
Figure 3 with 2 supplements
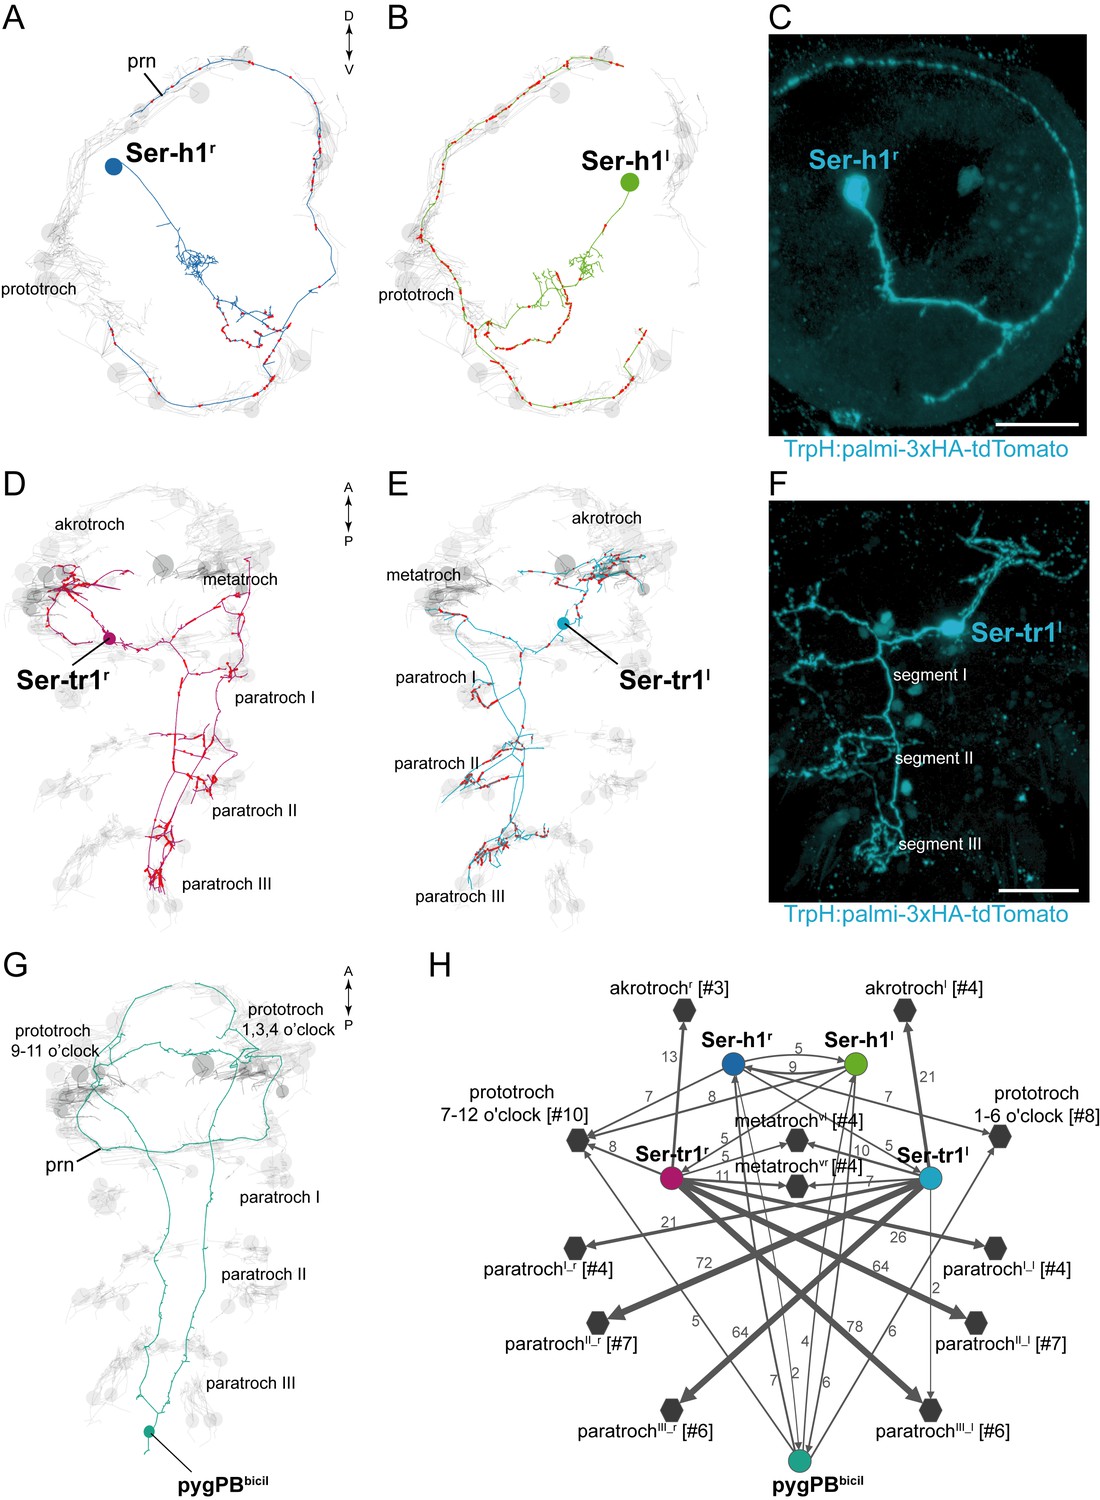
Anatomy and connectivity of serotonergic ciliomotor neurons.
(A–B) ssTEM reconstruction of the right (A) and left (B) head serotonergic ciliomotor (Ser-h1) neuron, anterior view. (C) Transgenic labelling of the right Ser-h1 neuron with the TrpH:palmi-3xHA-tdTomato construct, anterior view. Expression was detected with anti-HA antibody staining. (D–E) ssTEM reconstruction of the right (D) and left (E) trunk serotonergic ciliomotor (Ser-tr1) cell, anterior view. (F) Transgenic labelling of the left Ser-tr1 neuron with the TrpH:palmi-3xHA-tdTomato construct, ventral view. (G) ssTEM reconstruction of the pygPBbicil serotonergic sensory-ciliomotor neuron. Ciliated cells are shown in grey. Circles represent position of cell body, lines represent axonal track. Presynaptic sites along the axon are marked in red. (H) Synaptic connectivity of the serotonergic ciliomotor neurons and the ciliary band cells. Nodes represent individual or grouped cells, as indicated by the numbers in square brackets. Edges show the direction of signalling from presynaptic to postsynaptic cells. Edges are weighted by the number of synapses. Synapse number is indicated. Edges with one synapse are not shown. Scale bars, 30 μm (C, F). Abbreviation: prn, prototroch ring nerve.
Figure 3—figure supplement 1

Serotonergic neurons in Platynereis larvae.
(A–C) Immunostaining for serotonin and acetylated tubulin in (A) 48 hr-post-fertilization, (B) 72 hr-post-fertilization, and (C) 50 hr-post-fertilization larvae. Anterior (A,B) and ventral views (C). Scale bars, 30 μm (A,C), 20 μm (B). Abbreviations: cPRC, ciliary photoreceptor cell.
Figure 3—figure supplement 2
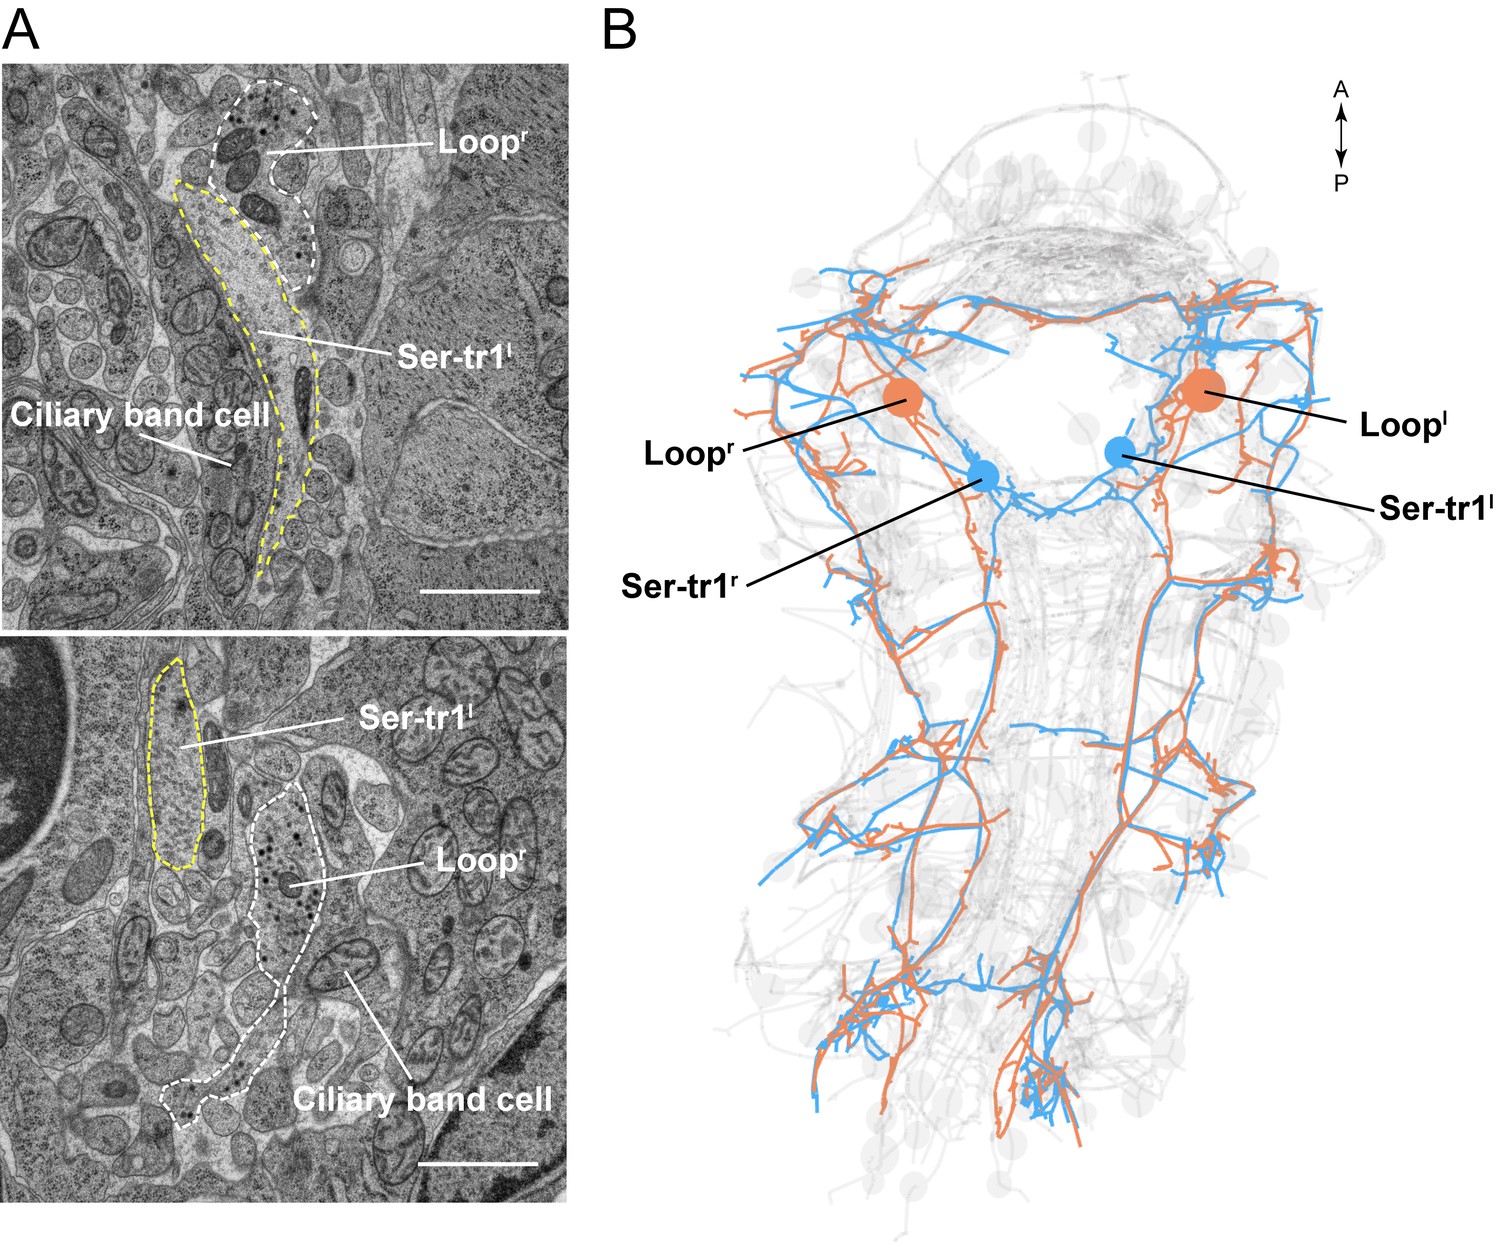
Parallel axons of the Loop and Ser-tr1 neurons.
(A) Electron micrographs of Loop and Ser-tr1 neuron axon cross-sections. Axon outlines are shown. The Loop neurons contain several dense core vesicles. The Ser-tr1 neurons have a clearer cytoplasm and no dense core vesicles. (B) ssTEM reconstruction of the Loop and Ser-tr1 neurons, ventral view. Loop and Ser-tr1 axons run in parallel throughout the body. Scale bar in (A) 1 μm.
Figure 4 with 1 supplement

Anatomy and connectivity of catecholaminergic/peptidergic ciliomotor neurons.
(A–C) ssTEM reconstruction of the cMNd (green) (A), cMNATO (orange) (B), and cMNvl (blue) (C) ciliomotor neurons, anterior view. Ciliated cells are shown in grey. Circles represent position of cell bodies, lines represent axonal tracks. Presynaptic sites along the axon are marked in red. (D) Synaptic connectivity of the cMN neurons with the prototroch and the MC cell. Nodes represent individual or grouped cells, as indicated by the numbers in square brackets. Edges show the direction of signalling from presynaptic to postsynaptic cells. Edges are weighted by the number of synapses and indicate the direction of signalling. Synapse number is indicated. Abbreviation: prn, prototroch ring nerve.
Figure 4—figure supplement 1
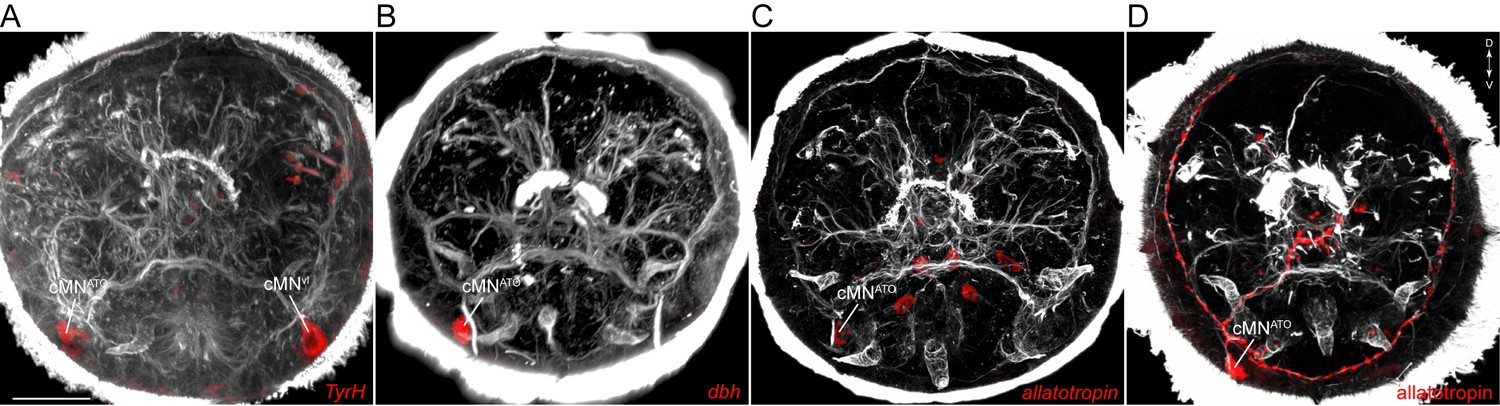
Catecholaminergic and neuropeptide marker expression in cMN neurons.
(A–C) In situ hybridisation for TyrH (A), dbh (B), and allatotropin proneuropeptide (C). (D) Immunostaining with an anti-allatotropin antibody. The samples were counterstained for acetylated tubulin (white). Scale bar in (A) 30 µm.
Figure 5
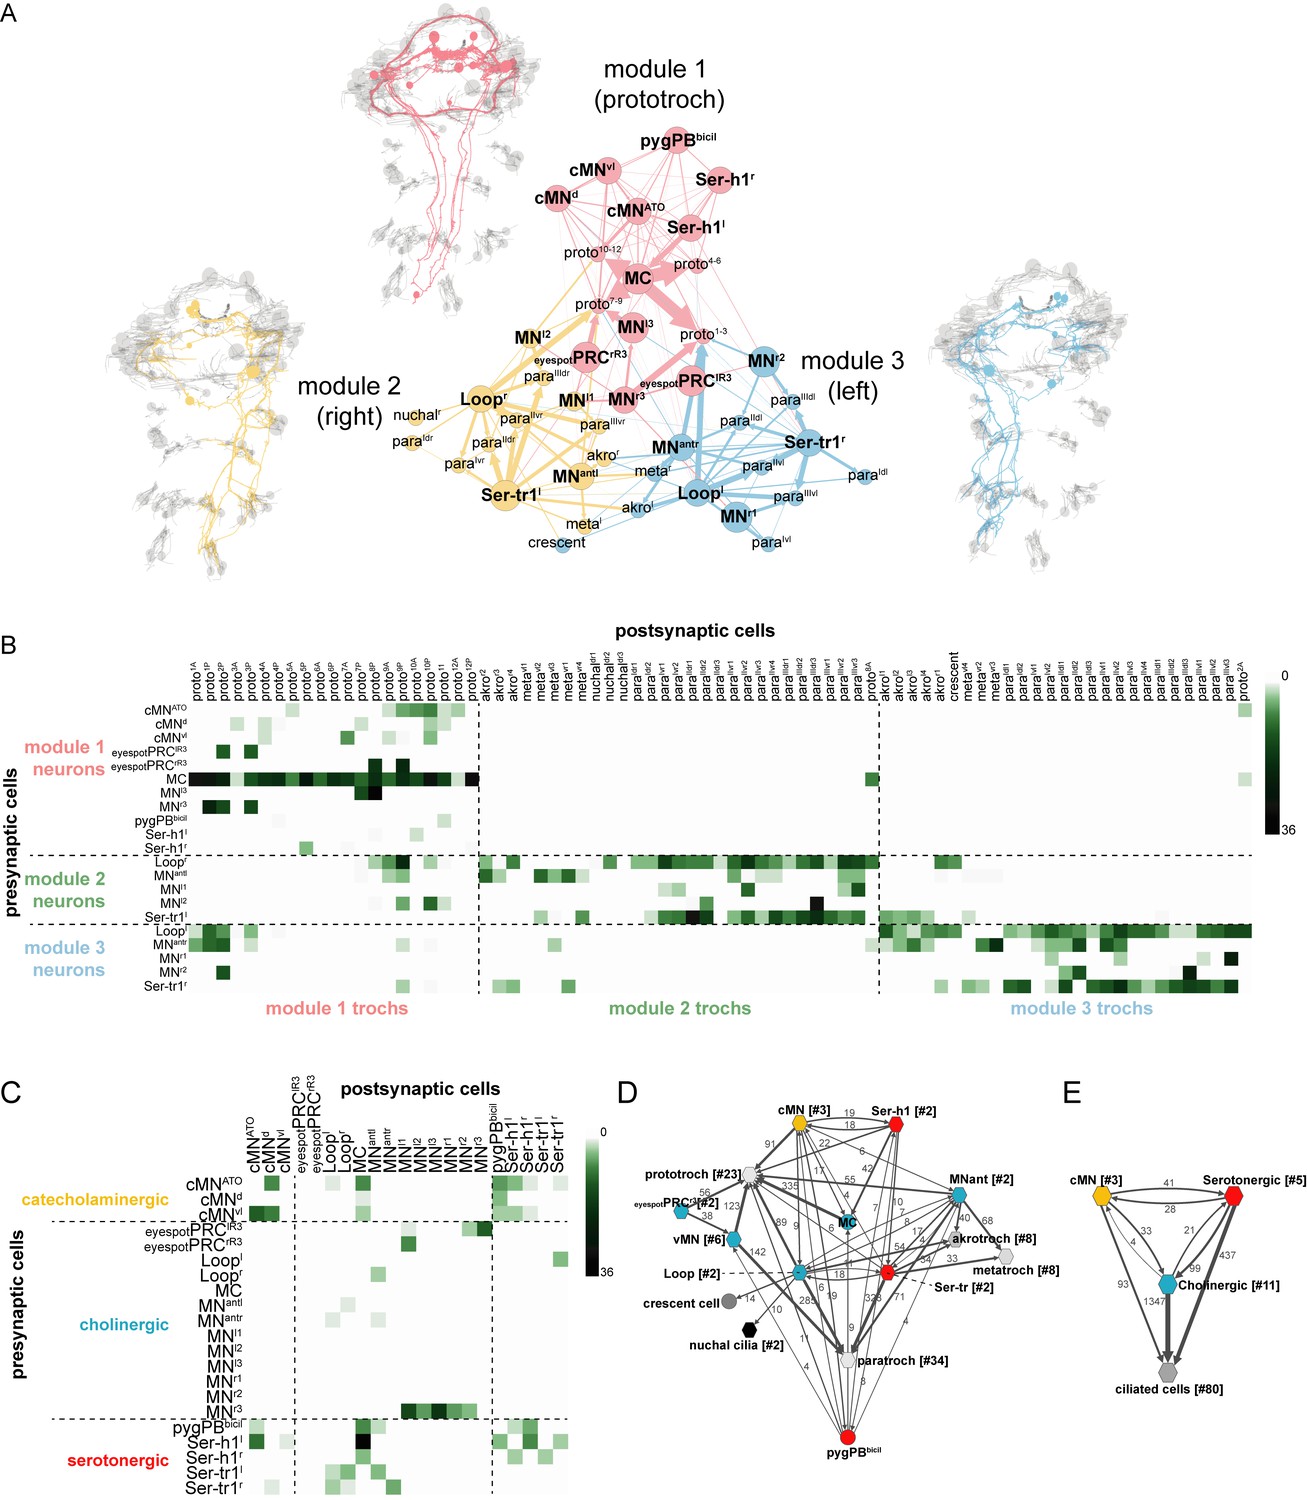
Overall connectivity of ciliomotor neurons and ciliary bands.
(A) Synaptic connectivity graph of all ciliomotor neurons and ciliary band cells. The network is partitioned into three modules. The neurons belonging to each module are shown in the anatomical reconstructions. The ciliary band cells are grouped into anatomical units. (B) Matrix representation of the connectivity of ciliomotor neurons to all ciliated cells. Colour intensity is proportional to the number of synapses. (C) Matrix representation of the connectivity of ciliomotor neurons amongst themselves. Colour intensity is proportional to the number of synapses. (D–E) Graph representations of the ciliomotor circuit. Nodes with <4 synapses are not shown. In (D) nodes are grouped by cell type (teal, cholinergic; red, serotonergic; orange, cMN; grey, ciliated cells). In (E) all cMN, serotonergic, cholinergic neurons, and ciliary band cells are represented as one node each. In (D, E) edges with <4 synapses are not shown. Abbreviations: proto, prototroch; meta, metatroch; para, paratroch; akro, akrotroch.
Figure 6

Activity of cMN neurons.
(A) ssTEM reconstruction (left) and correlation (Pearson's r) map of neuronal activity (right) of cMNvl, anterior view. Correlation values were calculated relative to the prototroch (outlined). (B) Calcium-imaging trace of cMNvl and the prototroch (C) ssTEM reconstruction (left) and correlation (Pearson’s r) map of neuronal activity (right) of cMNATO. Correlation values were calculated relative to the prototroch (outlined). (D) Calcium imaging trace of cMNATO and the prototroch. (E) ssTEM reconstruction (left) and correlation (Pearson’s r) map of neuronal activity (right) of cMNd. Correlation values were calculated relative to the prototroch (outlined). (F) Calcium-imaging trace of cMNd and the prototroch. (G) Correlation of GCaMP signals of cMN neurons with GCaMP signals measured from the prototroch ciliary band (CB). Data points represent measurements from different larvae, n > 12 larvae. Mean and standard deviation are shown. All sample medians are different from 0 with p-values≤0.0002 as determined by Wilcoxon Signed Rank Test.
-
Figure 6—source data 1
Source data for Figure 6G with correlation values of neuronal activity.
- https://doi.org/10.7554/eLife.26000.022
Figure 7 with 2 supplements
Activity of cholinergic neurons.
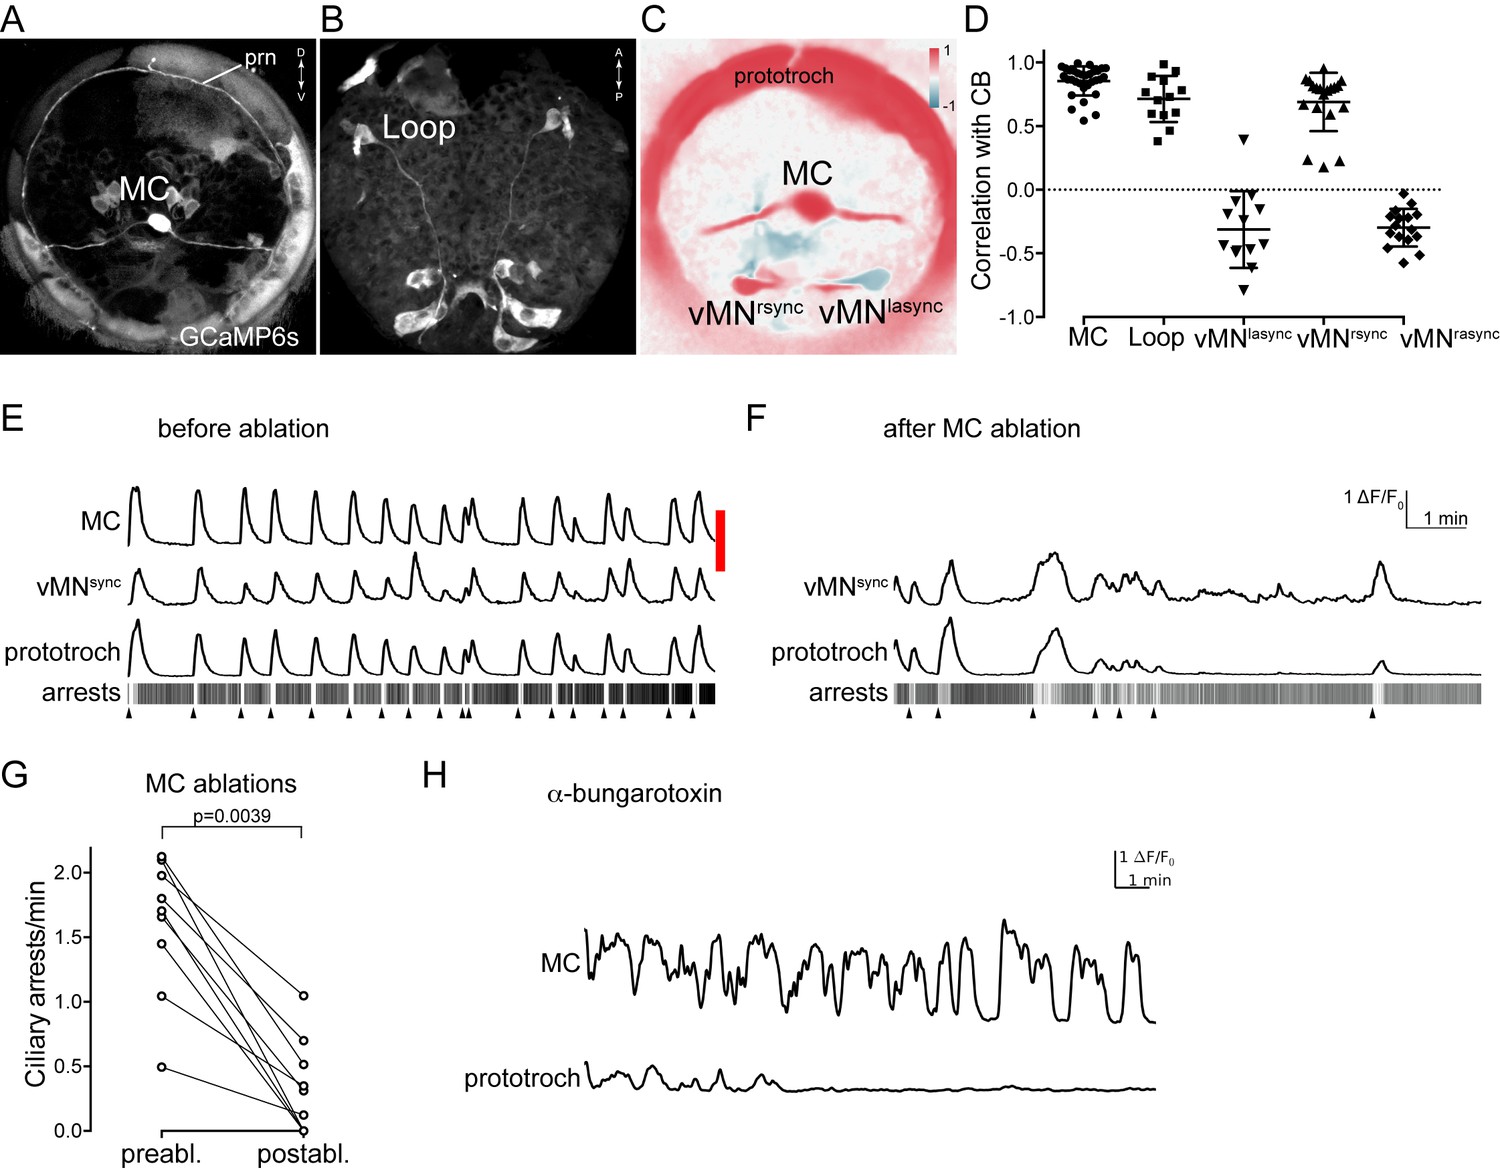
(A–B) GCaMP6s signal revealing cell morphologies of the active MC (anterior view) (A) and Loop (ventral/posterior view) (B) neurons in 2 days-post-fertilisation larvae. (C) Correlation (Pearson’s r) map of neuronal activity of the MC, vMNsync and vMNasync neurons. Correlation values were calculated relative to the prototroch. (D) Correlation of GCaMP signals of cholinergic neurons with GCaMP signals measured from the prototroch ciliary band (CB). Data points represent measurements from different larvae, n > 12 larvae. Mean and standard deviation are shown. All sample medians are different from 0 with p-values≤0.0034 as determined by Wilcoxon Signed Rank Test. (E–F) Effect of MC neuron ablation on prototroch activity and ciliary closures. Red bar represents the time of the ablation. GCaMP signals in the MC neuron, in a vMNsync neuron, and in the prototroch before (E) and after (F) MC neuron ablation. (G) Number of ciliary arrests in the prototroch before and after MC neuron ablation. (H) Calcium signals measured from the MC neuron and the prototroch following the addition of 50 µM alpha-bungarotoxin. Abbreviation: prn, prototroch ring nerve.
-
Figure 7—source data 1
Source data for Figure 7D with correlation values of neuronal activity.
- https://doi.org/10.7554/eLife.26000.024
-
Figure 7—source data 2
Source data for Figure 7G with ciliary closures before and after MC neuron ablation.
- https://doi.org/10.7554/eLife.26000.025
Figure 7—figure supplement 1
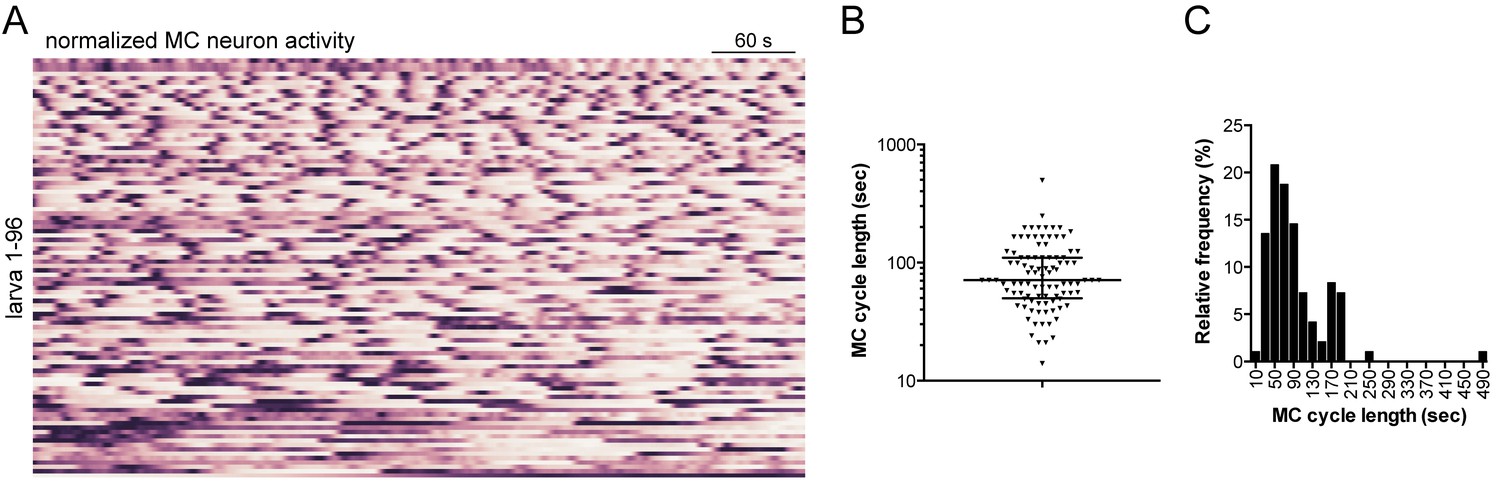
Characterisation of MC neuron activity.
(A) Normalised calcium signals in the MC neuron (n = 96 larvae). (B) Cycle length of MC neurons as determined by Fourier analysis of the traces shown in (A). (C) Frequency distribution of cycle length of MC neurons, same data as in panel (B).
-
Figure 7–figure supplement source data 1
Source data for Figure 7—figure supplement 1A with calcium imaging data of the MC neuron from 96 individual larvae.
The data are organized in rows. The first row is the time stamp (sec). These data are shown in 0–1 normalized form in Figure 7—figure supplement 1A.
- https://doi.org/10.7554/eLife.26000.027
Figure 7—figure supplement 2
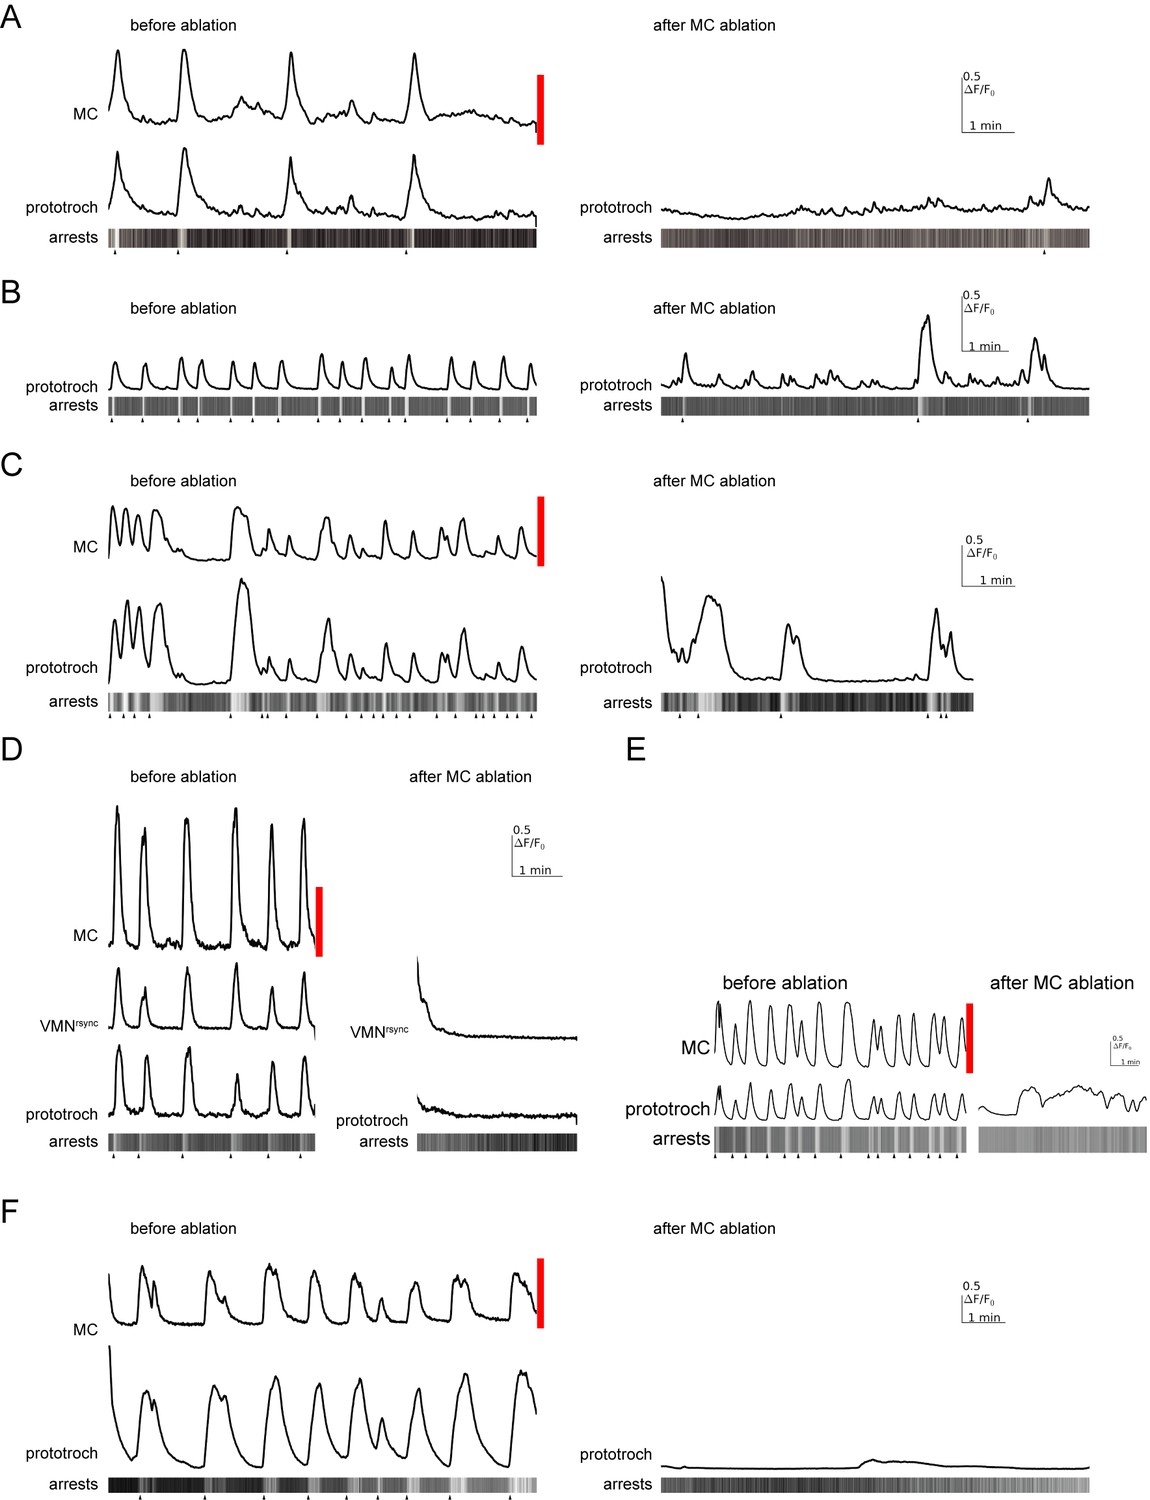
Effect of MC neuron ablation on prototroch activity and ciliary closures.
(A–F) Calcium signals in the MC neuron, a vMNrsync neuron, and in the prototroch, before and after MC neuron ablation. Kymographs showing arrests of prototroch cilia are also shown. Arrowheads indicate the beginning of arrests. (A–F) show examples of MC neuron ablations in different larvae.
Figure 8 with 1 supplement
Activity of serotonergic neurons.
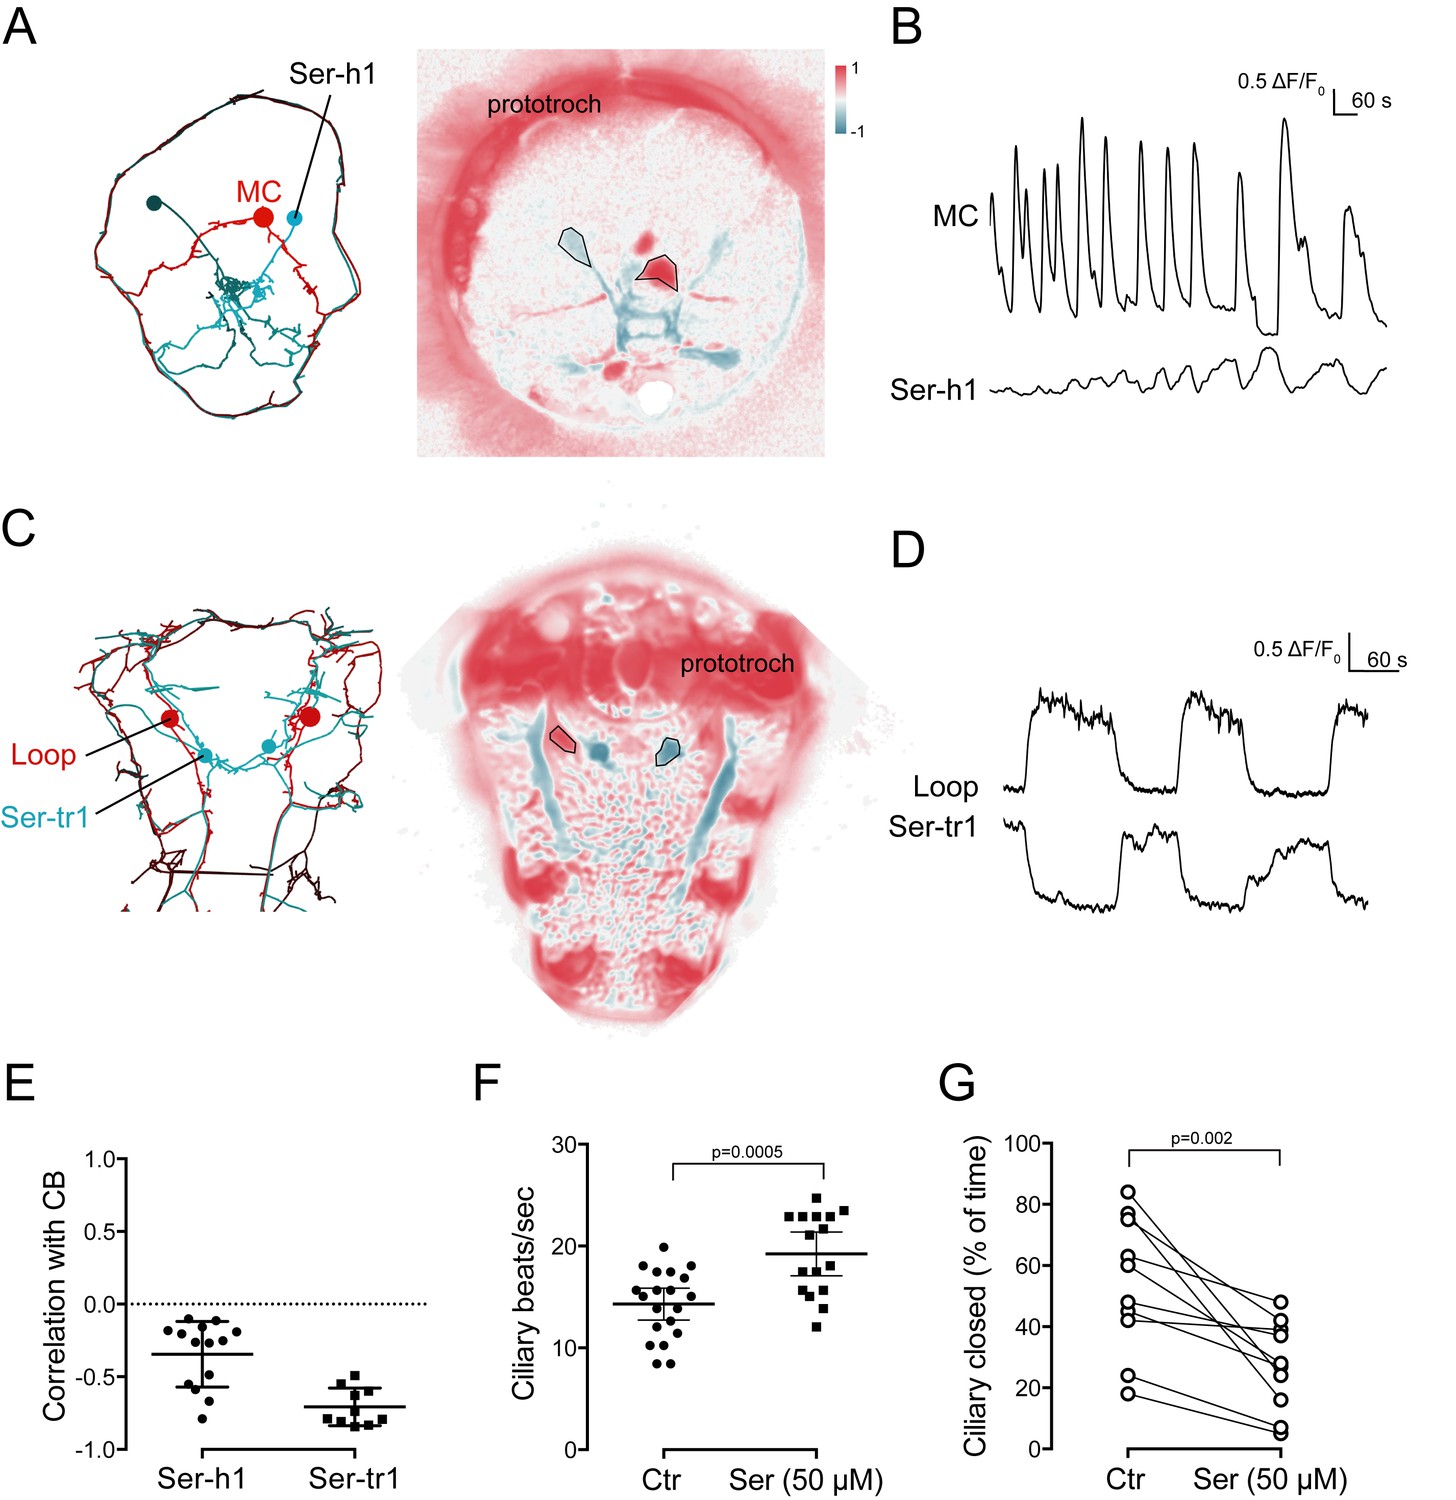
(A) ssTEM reconstruction (left) and correlation (Pearson’s r) map of neuronal activity (right) of the Ser-h1 neurons, anterior view. Correlation values were calculated relative to the prototroch. (B) Calcium signals measured from a Ser-h1 neuron and the MC cell. (C) ssTEM reconstruction (left) and neuronal activity correlation (right) of the Ser-tr1 neurons, ventral view. Correlation values were calculated relative to the prototroch. (D) Calcium signals measured from a Ser-tr1 neuron and a Loop neuron. (E) Correlation of GCaMP signals of serotonergic neurons with GCaMP signals measured from the prototroch ciliary band (CB). Data points represent measurements from different larvae, n > 9. Mean and standard deviation are shown. All sample medians are different from 0 with p-values≤0.002 as determined by Wilcoxon Signed Rank Test. (F) Ciliary beat frequency of prototroch cilia in the absence and presence of serotonin. (G) Ciliary closures of prototroch cilia in the absence and presence of serotonin. P-values of an unpaired (F) and paired (G) t-test are shown. In (F,G) n > 9 larvae. Samples in (F,G) passed the D'Agostino and Pearson omnibus normality test (alpha = 0.05).
-
Figure 8—source data 1
Source data for Figure 8E with correlation values of neuronal activity.
- https://doi.org/10.7554/eLife.26000.031
-
Figure 8—source data 2
Source data for Figure 8F.
- https://doi.org/10.7554/eLife.26000.032
-
Figure 8—source data 3
Source data for Figure 8G.
- https://doi.org/10.7554/eLife.26000.033
Figure 8—figure supplement 1
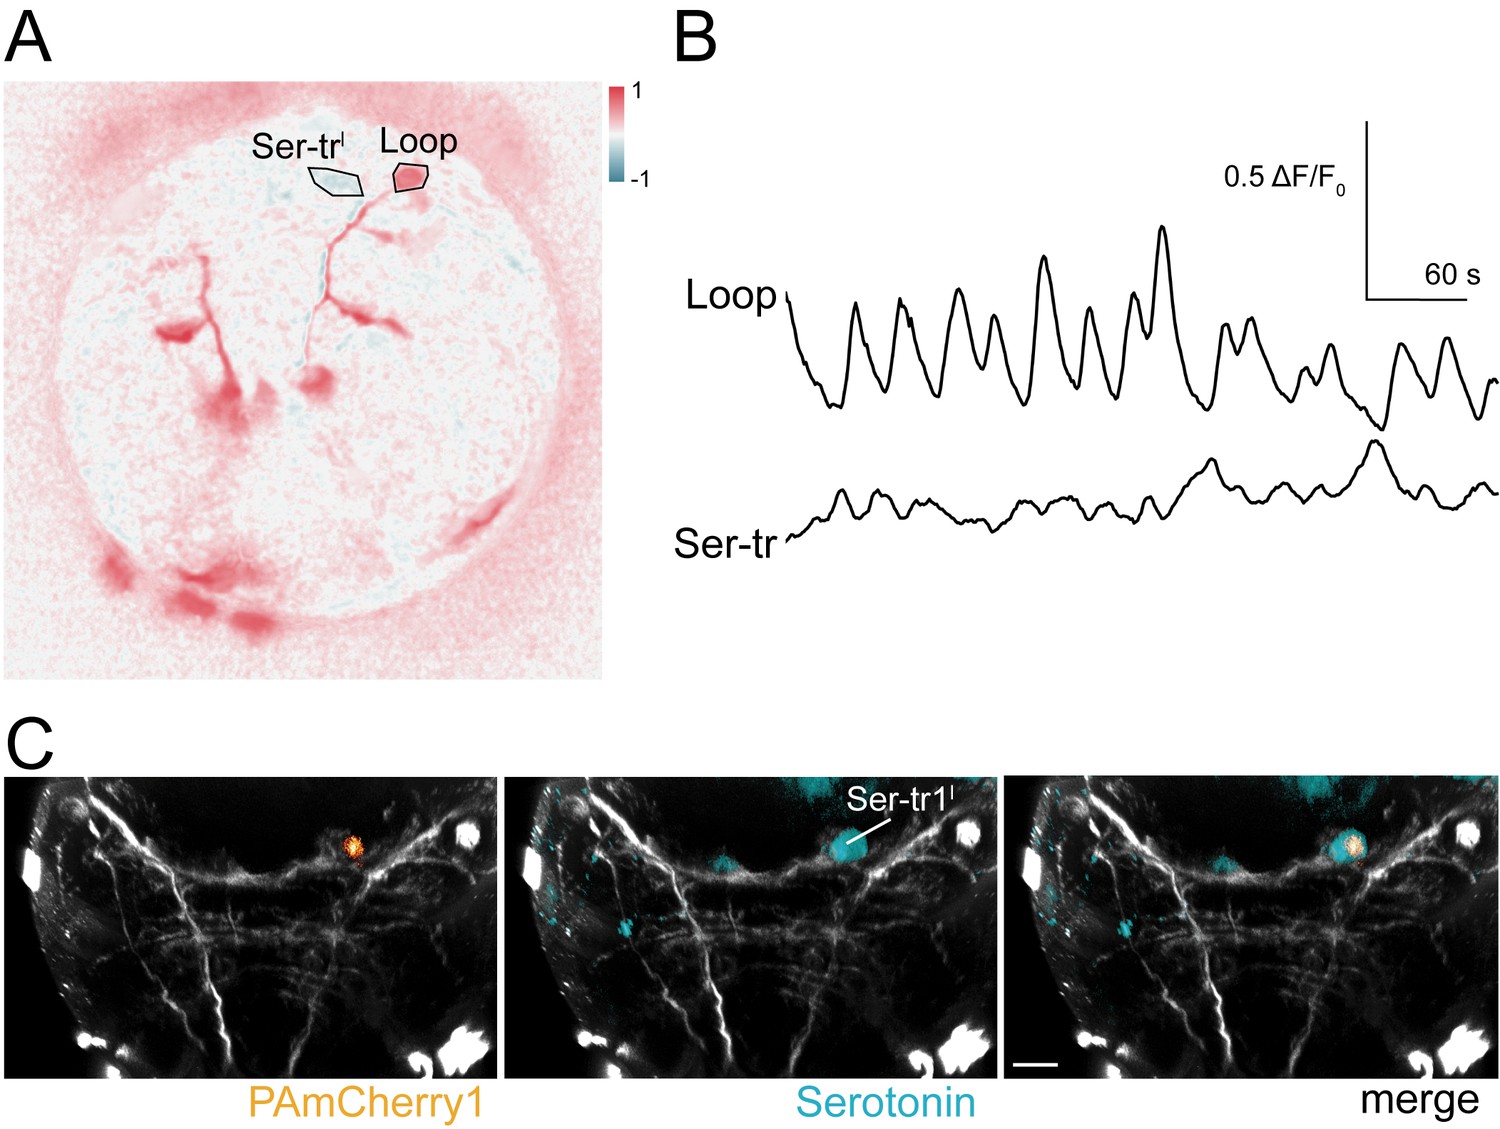
In vivo labelling of a Ser-tr1 cell by photoactivation during calcium imaging.
(A) Correlation map of neuronal activity of a Ser-tr1 and a Loop neuron, ventral view. (B) Calcium signals measured from the Ser-tr1 and Loop neurons shown in (A). (C) Serotonin antibody staining (cyan) and mCherry1 fluorescence (orange) in the Ser-tr1 cell following local photoactivation of PAmCherry1 during calcium imaging (in the larva shown in A and B).
Figure 9
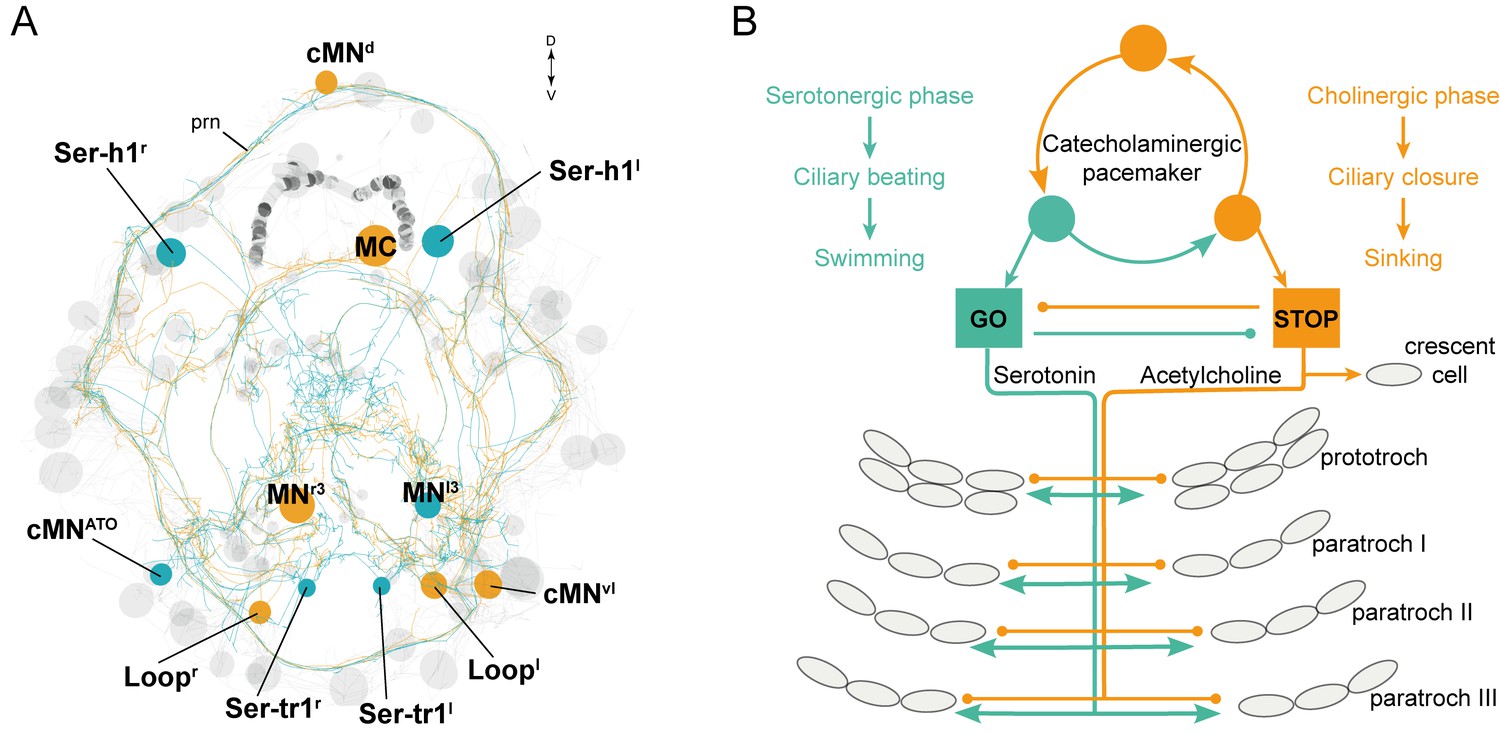
The stop-and-go ciliomotor system of the Platynereis larva.
(A) ssTEM reconstruction of ciliomotor neurons that are activated synchronously (orange) and asynchronously (teal) with the ciliary bands. (B) Schematic of the circuitry, consisting of a pacemaker system, as well as cholinergic and serotonergic ciliomotor neurons that span the entire body and innervate all multiciliated cells. Abbreviation: prn, prototroch ring nerve.
Videos
Video 1
Coordinated arrests of cilia on all ciliary band cells in a 72 hr-post-fertilization Platynereis larva.
Differential interference contrast (DIC) imaging, recorded and played at 60 frames per second (fps).
Video 2
Coordinated arrests of akrotroch and paratroch but not crescent cilia.
DIC imaging of cilia in the Platynereis larval head. Recorded and played at 30 fps.
Video 3
Calcium and DIC imaging of ciliary bands in a 72 hr-post-fertilization Platynereis larva.
The GCaMP6s signal (left panel) and DIC signal (right panel) are shown for the left side of the larva (ventral view). Regions of interest used to record calcium signals are indicated. Recorded at 3 fps, played at 25 fps.
Video 4
Calcium and DIC imaging of the ciliary band in a 48 hr-post-fertilization Platynereis larva.
The video was recorded at 45 fps, here only every 10th frame is shown at 45 fps.
Video 5
The Loop ciliomotor neurons. ssTEM reconstruction of the Loopl and Loopr neurons.
Ciliary bands and the ventral nerve cord are shown in grey. Synapses are marked in red.
Video 6
The Ser-tr1 ciliomotor neurons.
ssTEM reconstruction of the Ser-tr1l and Ser-tr1r neurons. Ciliary bands are shown in grey. The metatroch is shown in darker grey, synapses are marked in red.
Video 7
The Ser-tr1l neuron labelled by transient transgenesis.
The TrpH:palmy-3xHA-tdTomato was used to label the Ser-tr1l neuron. The reporter was visualised by anti-HA antibody staining.
Video 8
The entire ciliomotor circuit of the Platynereis larva.
Neuron reconstructions of all ciliomotor neurons.
Video 9
Calcium imaging of the MC neuron in a 30 hr-post-fertilisation larva.
Ubiquitously expressed GCaMP6s was used to image neuronal activity. The MC neuron, a vMNsync, a vMNasync neuron, and prototroch cilia are labelled. The video was recorded at 1.5 fps and is shown at 45 fps.
Additional files
-
Supplementary file 1
Synaptic connectivity matrix of ciliomotor neurons and multiciliated cells.
- https://doi.org/10.7554/eLife.26000.036
Download links
A two-part list of links to download the article, or parts of the article, in various formats.
Downloads (link to download the article as PDF)
Open citations (links to open the citations from this article in various online reference manager services)
Cite this article (links to download the citations from this article in formats compatible with various reference manager tools)
Ciliomotor circuitry underlying whole-body coordination of ciliary activity in the Platynereis larva
eLife 6:e26000.
https://doi.org/10.7554/eLife.26000


