Replication Study: The common feature of leukemia-associated IDH1 and IDH2 mutations is a neomorphic enzyme activity converting alpha-ketoglutarate to 2-hydroxyglutarate
- University of California, United States
Figures
Figure 1
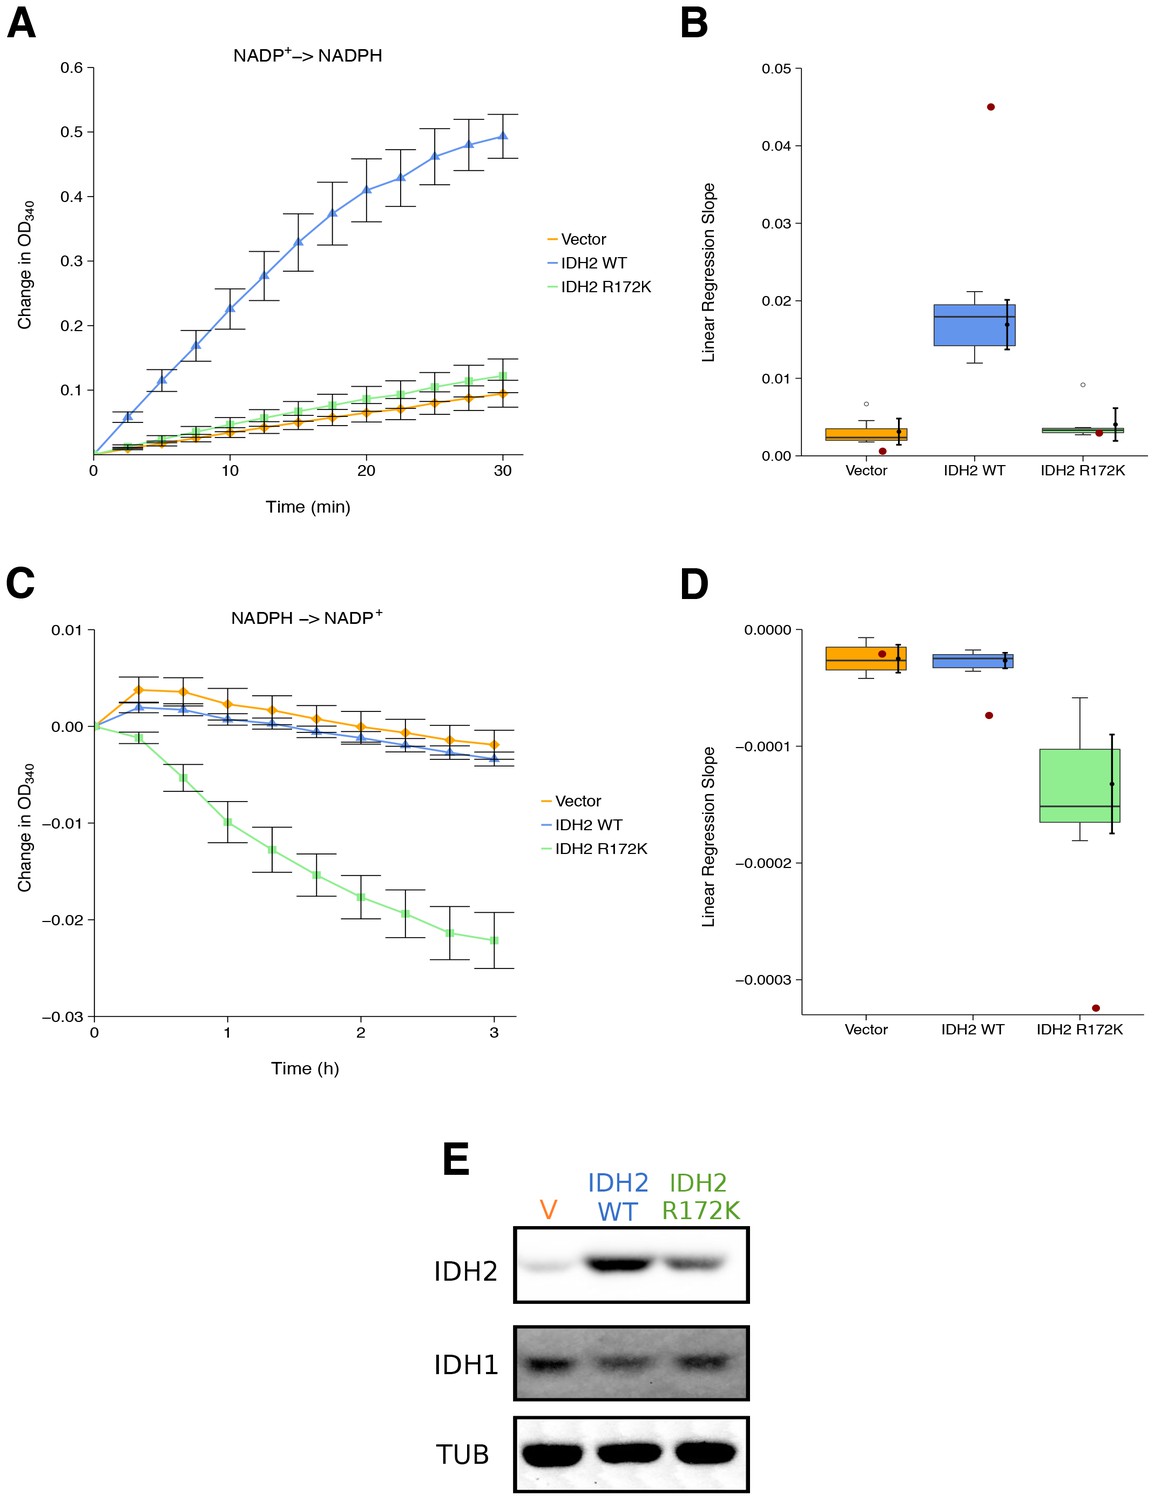
Isocitrate-dependent NADPH production and alpha-ketoglutarate-dependent NADPH consumption of wild-type or R172 mutant IDH2.
IDH oxidative and reductive activity assays were performed on lysates of HEK293T cells transfected with wild-type or R172K mutant IDH2, or empty vector. (A) Lysates were assessed for generation of NADPH from NADP+ in the presence of 0.4 mM isocitrate over the indicated time course. Mean change in OD340 from the beginning of each assay (time = 0) is reported for each biological repeat performed [n = 7] and error bars represent s.e.m. (B) Linear regression slopes were determined for each biological repeat of the isocitrate-dependent NADPH production assay. Box and whisker plot with median represented as the line through the box and whiskers representing values within 1.5 IQR of the first and third quartile. Means as black dot and bold error bars represent 95% CI. Linear regression slope determined from the data estimated from the representative experiment reported in Figure 2A of Ward et al. (2010) is displayed as a single point (red circle) for comparison. Statistical analysis was performed on data generated during this replication attempt. Wild-type IDH2 compared to vector control: Wilcoxon-Mann-Whitney test; Z = 3.13, uncorrected p=0.00058, Bonferroni corrected p=0.0023. R172K mutant IDH2 compared to vector control: Wilcoxon-Mann-Whitney test; Z = 1.60, uncorrected p=0.13, Bonferroni corrected p=0.51. (C) Lysates were assessed for consumption of NADPH in the presence of 1 mM alpha-ketoglutarate over the indicated time course. Mean change in OD340 from the beginning of each assay (time = 0) is reported for each biological repeat performed [n = 7] and error bars represent s.e.m. (D) Linear regression slopes were determined for each biological repeat of the alpha-ketoglutarate-dependent NADPH consumption assay. Box and whisker plot with median represented as the line through the box and whiskers representing values within 1.5 IQR of the first and third quartile. Means as black dot and bold error bars represent 95% CI. Linear regression slope determined from the data estimated from the representative experiment reported in Figure 2B of Ward et al. (2010) is displayed as a single point (red circle) for comparison. Statistical analysis was performed on data generated during this replication attempt. Wild-type IDH2 compared to vector control: Welch’s t-test; t(9.42) = 0.29, uncorrected p=0.78, Bonferroni corrected p>0.99. R172K mutant IDH2 compared to vector control: Welch’s t-test; t(6.95) = 5.97, uncorrected p=0.00058, Bonferroni corrected p=0.0023. (E) Representative Western blots probed with an anti-IDH1 antibody, an anti-IDH2 antibody, and an anti-alpha-Tubulin antibody. Additional details for this experiment can be found at https://osf.io/6ve4d/.
Figure 2 with 1 supplement
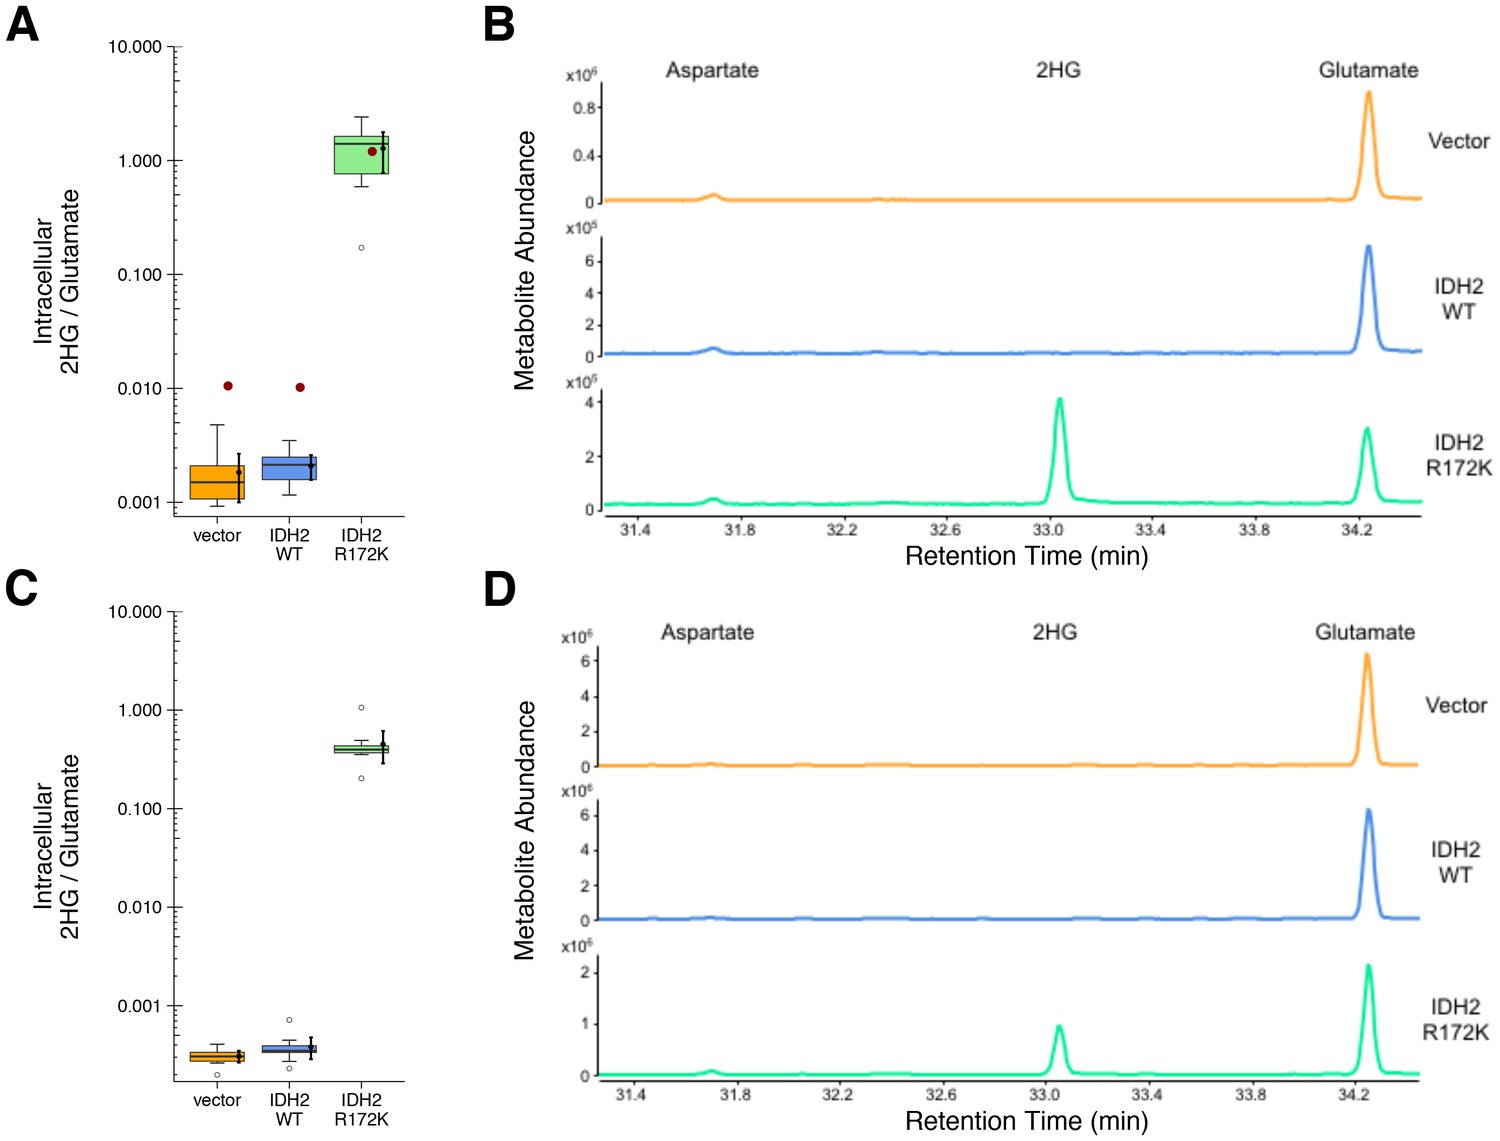
2HG levels within cells expressing wild-type or R172K mutant IDH2.
HEK293T cells transfected with wild-type or R172K mutant IDH2, or empty vector, were analyzed for intracellular metabolites. (A) Cells harvested 48 hr after transfection had organic acids extracted, purified, and derivatized with MTBSTFA before analysis by GC-MS. Quantitation of 2HG signal intensity relative to glutamate was determined using the TIC for each biological repeat [n = 10]. Box and whisker plot with median represented as the line through the box and whiskers representing values within 1.5 IQR of the first and third quartile. Means as black dot and bold error bars represent 95% CI. Data estimated from the representative experiment reported in Figure 3D of Ward et al. (2010) is displayed as a single point (red circle) for comparison. Statistical analysis was performed on log10 transformed data generated during this replication attempt. R172K mutant IDH2 values were compared to the largest value observed in cells expressing vector control or wild-type IDH2 (0.005). One-sample t-test; t(9) = 21.9, uncorrected p=4.14×10⁻⁹, Bonferroni corrected p=8.28×10⁻⁹. (B) Representative TIC from samples harvested at 48 hr after transfection for vector control (top panel), wild-type IDH2 (middle panel), and R172K mutant IDH2 (bottom panel). The derivatized organic acids eluting between 31.4 and 34.4 min are shown, including aspartate (31.7 min), 2HG (33.1 min), and glutamate (34.3 min) based on spectra of derivatized commercial standards. (C) Cells harvested 24 hr after transfection were processed and analyzed similar to the 48 hr samples with [n = 10] biological repeats. Box and whisker plot with median represented as the line through the box and whiskers representing values within 1.5 IQR of the first and third quartile. Means as black dot and bold error bars represent 95% CI. R172K mutant IDH2 values were compared to the largest value observed in cells expressing vector control or wild-type IDH2 (0.001). One-sample Wilcoxon signed-rank test on log10 transformed data; V = 55, uncorrected p=0.0020, Bonferroni corrected p=0.0039. (D) Representative TIC from samples harvested at 24 hr after transfection for vector control (top panel), wild-type IDH2 (middle panel), and R172K mutant IDH2 (bottom panel). Additional details for this experiment can be found at https://osf.io/9ge2a/.
Figure 2—figure supplement 1
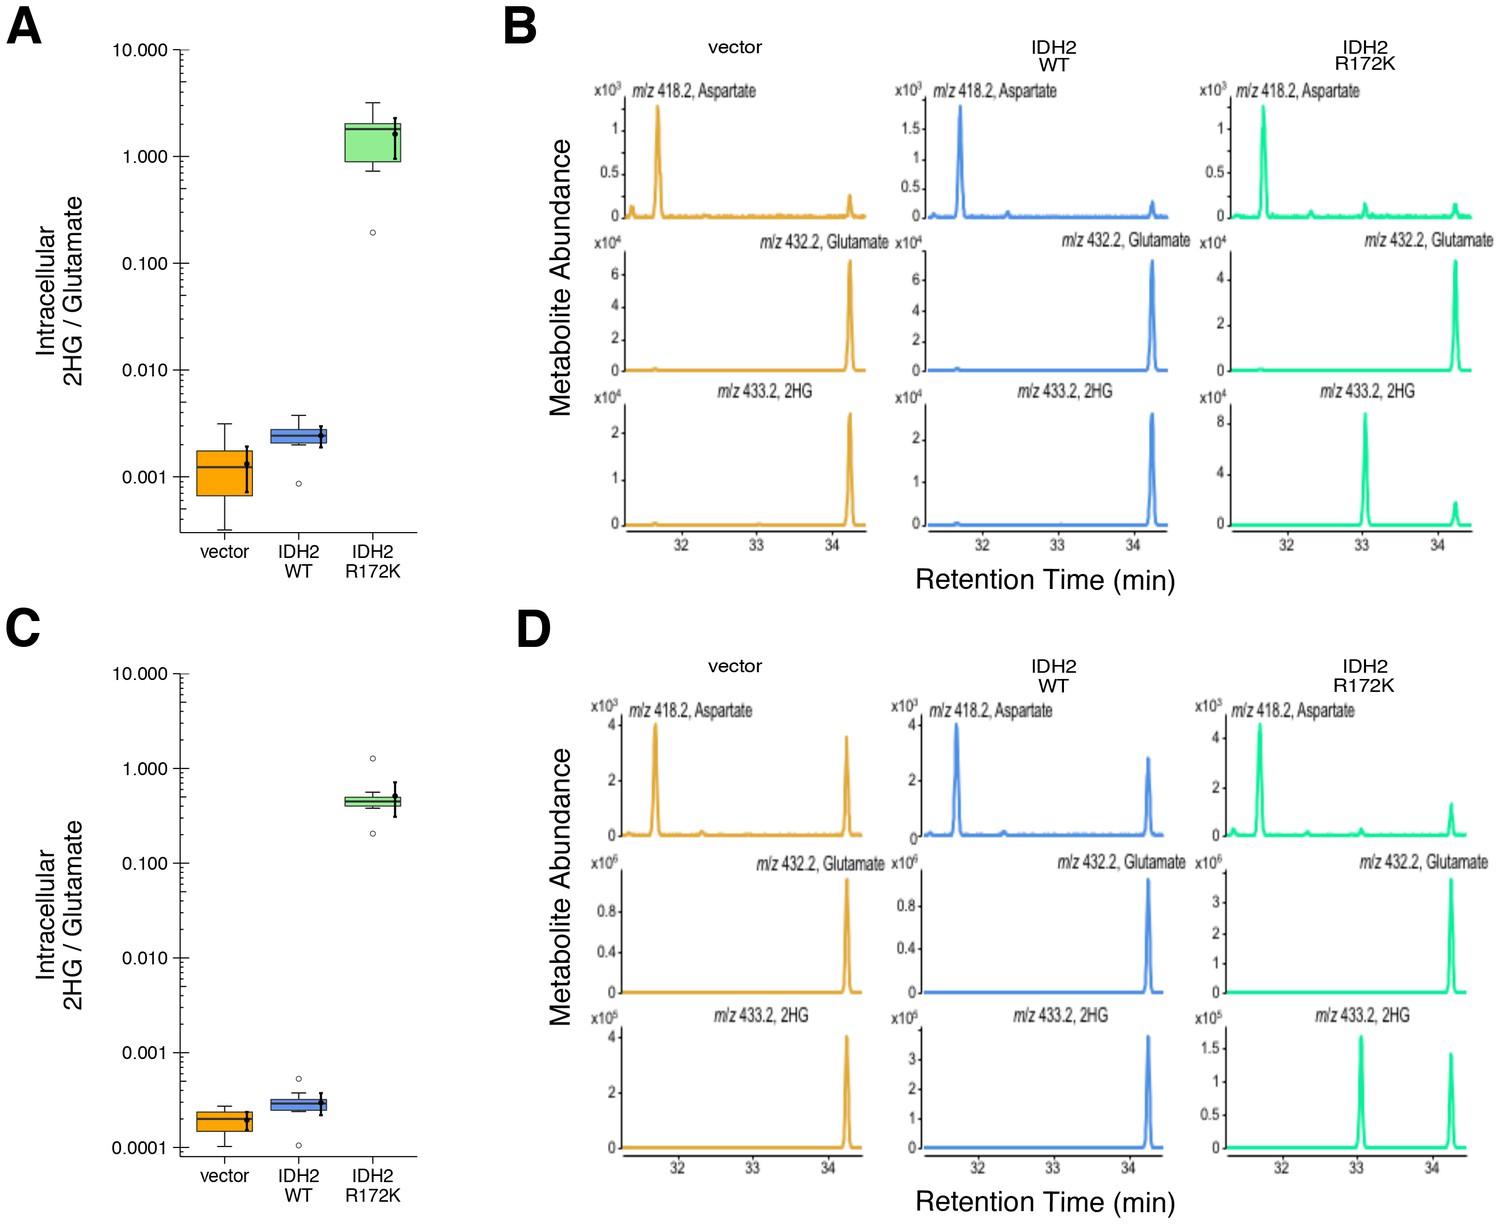
2HG levels within cells based on EIC analysis.
This is the same experiment as in Figure 2, but with quantitation of 2HG signal intensity relative to glutamate determined using the EIC for each biological repeat. (A) Box and whisker plot with mean and 95% CI reported for each sample harvested 48 hr after transfection. R172K mutant IDH2 values were compared to the largest value observed in cells expressing vector control or wild-type IDH2 (0.004). One-sample t-test; t(9) = 22.4, uncorrected p=3.38×10⁻⁹, Bonferroni corrected p=6.77×10⁻⁹. (B) Representative EIC from samples harvested at 48 hr after transfection for vector control (left panels), wild-type IDH2 (middle panels), and R172K mutant IDH2 (right panels) with aspartate, glutamate, and 2HG shown. (C) Box and whisker plot with mean and 95% CI reported for each sample harvested 24 hr after transfection. R172K mutant IDH2 values were compared to the largest value observed in cells expressing vector control or wild-type IDH2 (0.001). One-sample Wilcoxon signed-rank test on log10 transformed data; V = 55, uncorrected p=0.0020, Bonferroni corrected p=0.0039. (D) Representative EIC from samples harvested at 24 hr after transfection for vector control (left panels), wild-type IDH2 (middle panels), and R172K mutant IDH2 (right panels) with aspartate, glutamate, and 2HG shown. Additional details for this experiment can be found at https://osf.io/9ge2a/.
Figure 3 with 1 supplement
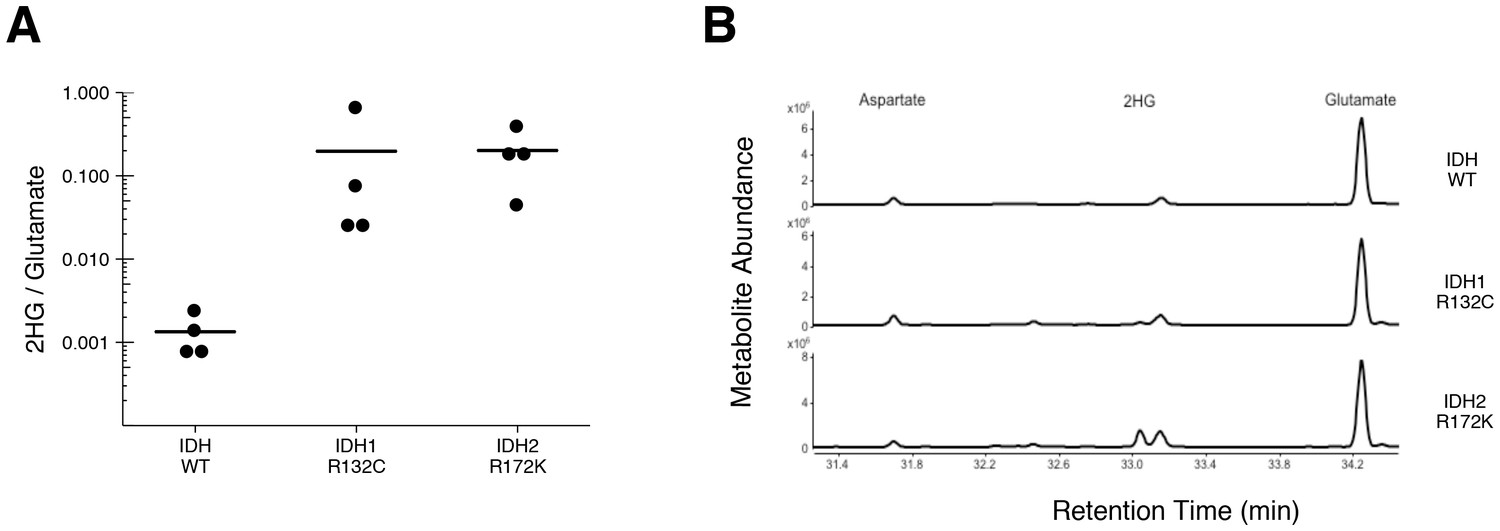
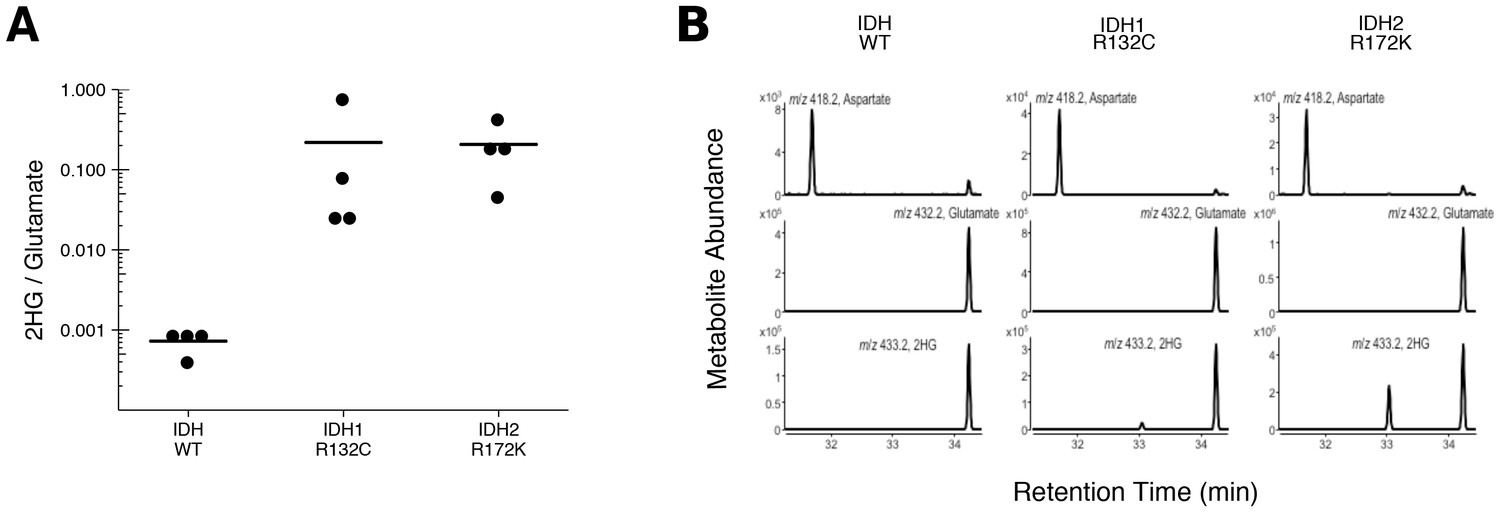
2HG levels in AML patient samples.
AML patient peripheral blood or bone marrow samples were analyzed for intracellular metabolites. Cells had organic acids extracted, purified, and derivatized with MTBSTFA before analysis by GC-MS. Patient samples were prescreened for IDH genotypic status prior to metabolite analysis. (A) Quantitation of 2HG signal intensity relative to glutamate was determined using the TIC for each sample. Dot plot with means reported as crossbars. One-sample t-tests on log10 transformed data comparing 2HG/glutamate level of samples to a constant of 0.0024 (2HG/glutamate threshold between IDH mutant and wild-type IDH samples). Samples with an IDH1 mutation compared to the threshold constant: t(3) = 4.47, uncorrected p=0.021, Bonferroni corrected p=0.063. Samples with an IDH2 mutation compared to the threshold constant: t(3) = 9.19, uncorrected p=0.0027, Bonferroni corrected p=0.0082. Samples with an IDH1 or IDH2 mutation compared to the threshold constant: t(7) = 8.73, uncorrected p=5.20×10⁻⁵, Bonferroni corrected p=1.56×10⁻⁴. (B) Representative TIC from samples without an IDH mutation (top panel), samples with an IDH1 mutation (middle panel), and samples with an IDH2 mutation (bottom panel). The derivatized organic acids eluting between 31.4 and 34.4 min are shown, including aspartate (31.7 min), 2HG (33.1 min), and glutamate (34.3 min) based on spectra of derivatized commercial standards. Additional details for this experiment can be found at https://osf.io/smdfr/.
Figure 3—figure supplement 1
2HG levels in AML patient samples based on EIC analysis.
This is the same experiment as in Figure 3, but with quantitation of 2HG signal intensity relative to glutamate determined using the EIC for each AML patient sample. (A) Dot plot with means reported as crossbars. One-sample t-tests on log10 transformed data comparing 2HG/glutamate level of samples to a constant of 0.001 (2HG/glutamate threshold between IDH mutant and wild-type IDH samples). Samples with an IDH1 mutation compared to the threshold constant: t(3) = 5.40, uncorrected p=0.012, Bonferroni corrected p=0.037. Samples with an IDH2 mutation compared to the threshold constant: t(3) = 10.93, uncorrected p=0.0016, Bonferroni corrected p=0.0049. Samples with an IDH1 or IDH2 mutation compared to the threshold constant: t(7) = 10.44, uncorrected p=1.61×10⁻⁵, Bonferroni corrected p=4.84×10⁻⁵. (B) Representative EIC from samples without an IDH mutation (top panel), samples with an IDH1 mutation (middle panel), and samples with an IDH2 mutation (bottom panel) with aspartate, glutamate, and 2HG shown. Additional details for this experiment can be found at https://osf.io/smdfr/.
Figure 4
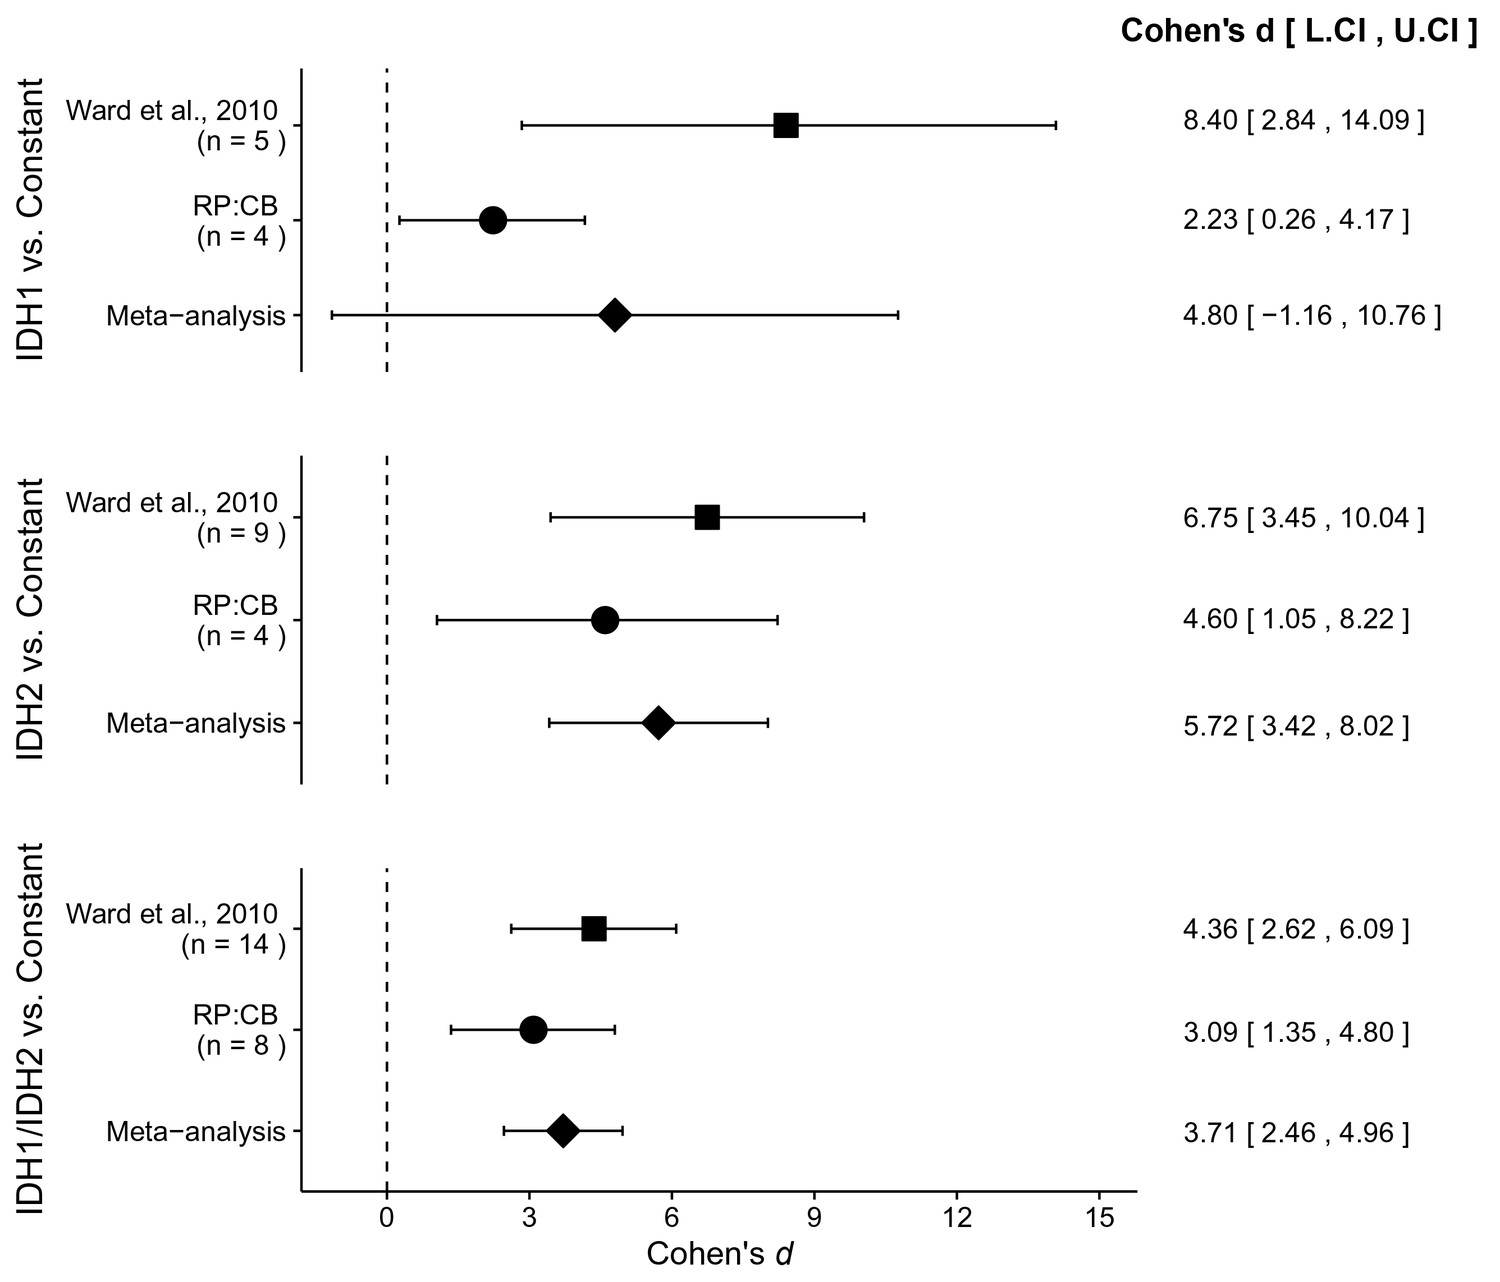
Meta-analyses of each effect.
Effect size and 95% confidence interval are presented for Ward et al. (2010), this replication study (RP:CB), and a random effects meta-analysis of those two effects. Sample sizes used in Ward et al. (2010) and this replication attempt are reported under the study name. Random effects meta-analysis of AML patient samples with an IDH1 mutation compared to a constant representing the 2HG/glutamate threshold between IDH mutant and wild-type IDH samples detected in the study (original: 0.01; replication: 0.0024) (meta-analysis p=0.114), AML patient samples with an IDH2 mutation compared to the threshold constant (meta-analysis p=1.12×10⁻⁶), and AML patient samples with an IDH1 or IDH2 mutation compared to the threshold constant (meta-analysis p=5.73×10⁻⁹). Additional details for these meta-analyses can be found at https://osf.io/4m3n8/.
Download links
A two-part list of links to download the article, or parts of the article, in various formats.
Downloads (link to download the article as PDF)
Open citations (links to open the citations from this article in various online reference manager services)
Cite this article (links to download the citations from this article in formats compatible with various reference manager tools)
Replication Study: The common feature of leukemia-associated IDH1 and IDH2 mutations is a neomorphic enzyme activity converting alpha-ketoglutarate to 2-hydroxyglutarate
eLife 6:e26030.
https://doi.org/10.7554/eLife.26030


