A hierarchical, retinotopic proto-organization of the primate visual system at birth
- Harvard Medical School, United States
Figures
Figure 1 with 2 supplements
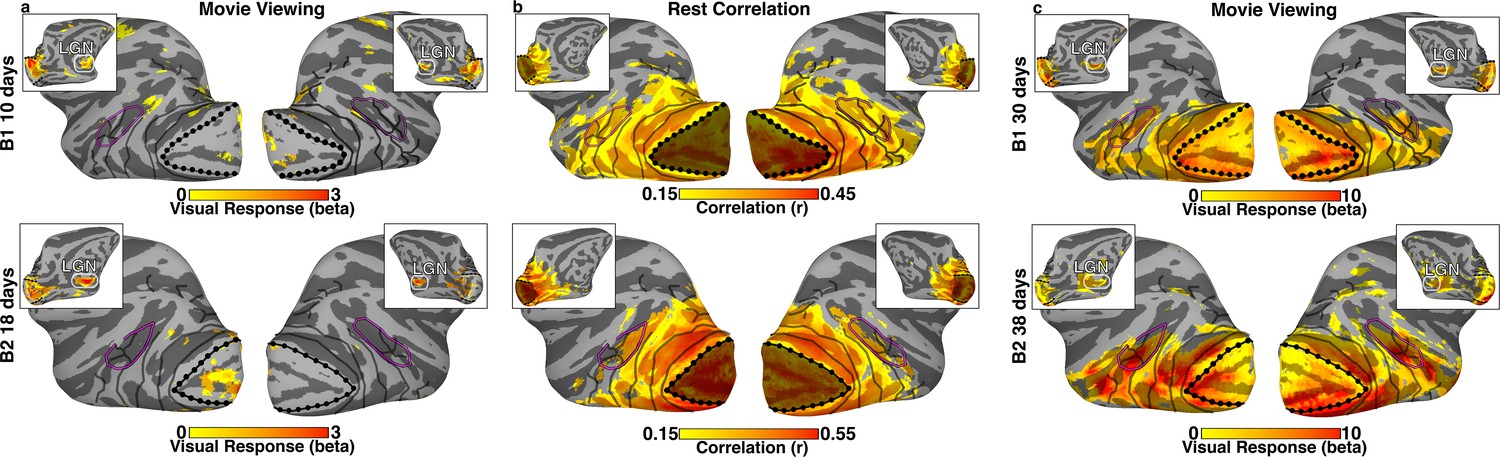
Visually–evoked activity and correlated signal in neonatal monkeys B1 and B2.
(a) Visually evoked-activity from 30 s movie clips of faces, scenes, and scrambled images in monkeys B1 and B2 at 10 and 18 days postnatal, respectively, was largely absent on the lateral surface of visual cortex (t(782) > 1.96; p<0.05, uncorrected). As seen in the inset images of the medial surface, peripheral V1 and LGN were the only visual structures showing significant visually-evoked activity. (b) Within-hemisphere correlation maps on the lateral surface of the brain (inset medial surface), from a seed of the mean signal in V1 during a rest period (r > 0.15; t(1628) > 6.12 and t(1394) > 5.66 for B1 and B2, respectively; p<0.0001, FDR-corrected). Significant correlations were apparent across much of the visual system, including occipital, temporal, and parietal cortices. Dotted black lines indicate the border between V1 and V2. Shading indicates the seed area for the mean V1 signal used for calculating within-hemisphere correlations. Solid black lines mark what we could later (>1.5 years) identify as borders between retinotopic areas (Figure 1—figure supplement 1). Purple line corresponds to what we could later identify as the peripheral eccentricity ridge of the MT cluster (comprising areas MT, MST, FST, V4t). (c) Visually evoked-activity in response to 30 s movie clips of faces, scenes, and scrambled images in monkeys B1 and B2, at 30 and 38 days postnatal respectively, was present throughout the thalamus, V1, and extrastriate visual cortex (t(782) > 3.33; p<0.05, FDR corrected).
Figure 1—figure supplement 1
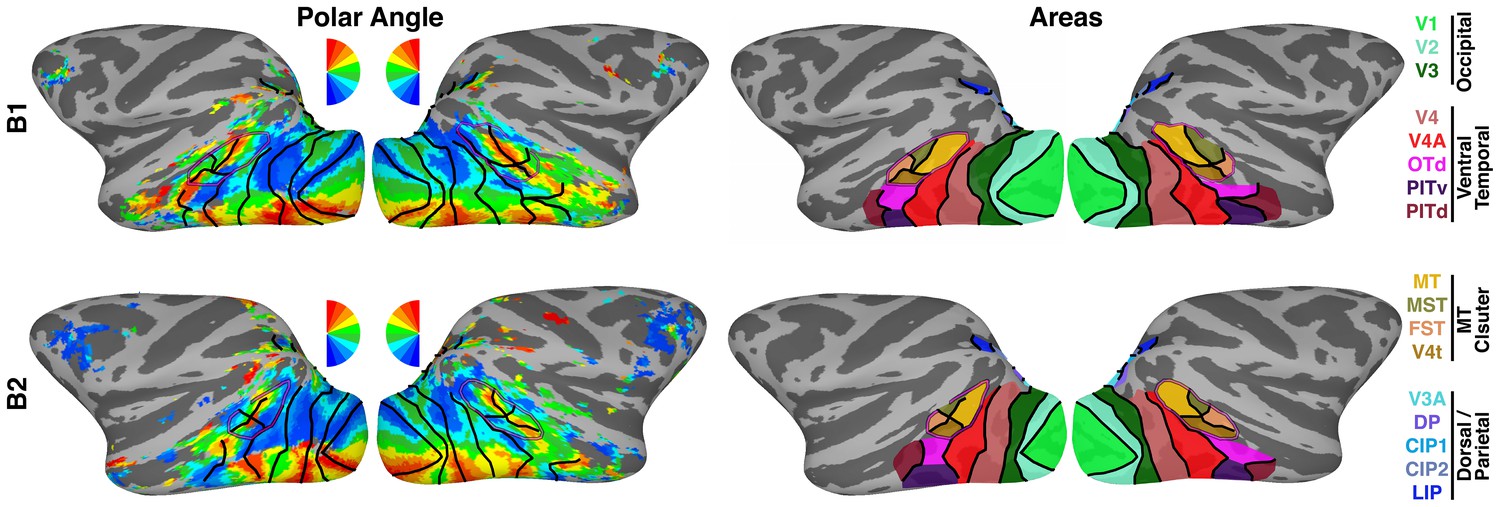
Retinotopic mapping.
(left) Polar angle maps of contralateral visual space for monkeys B1 and B2 at >1.5 years of age. (right) 19 retinotopic cortical areas across occipital, temporal and parietal cortices were identified from polar angle and eccentricity maps. Areas OTS1 and OTS2 (not shown) were identified on the ventral surface within a region of the occipitotemporal sulcus medial to PITv. For the seed-based analyses areas CIP1 and CIP2 were combined, as were areas V3A and DP, and areas OTS1 and 2, yielding 16 seed areas for the correlation analyses. Black lines mark borders between visual areas. Purple line corresponds to the peripheral eccentricity ridge of the MT cluster (comprising areas MT, MST, FST, V4t).
Figure 1—figure supplement 2
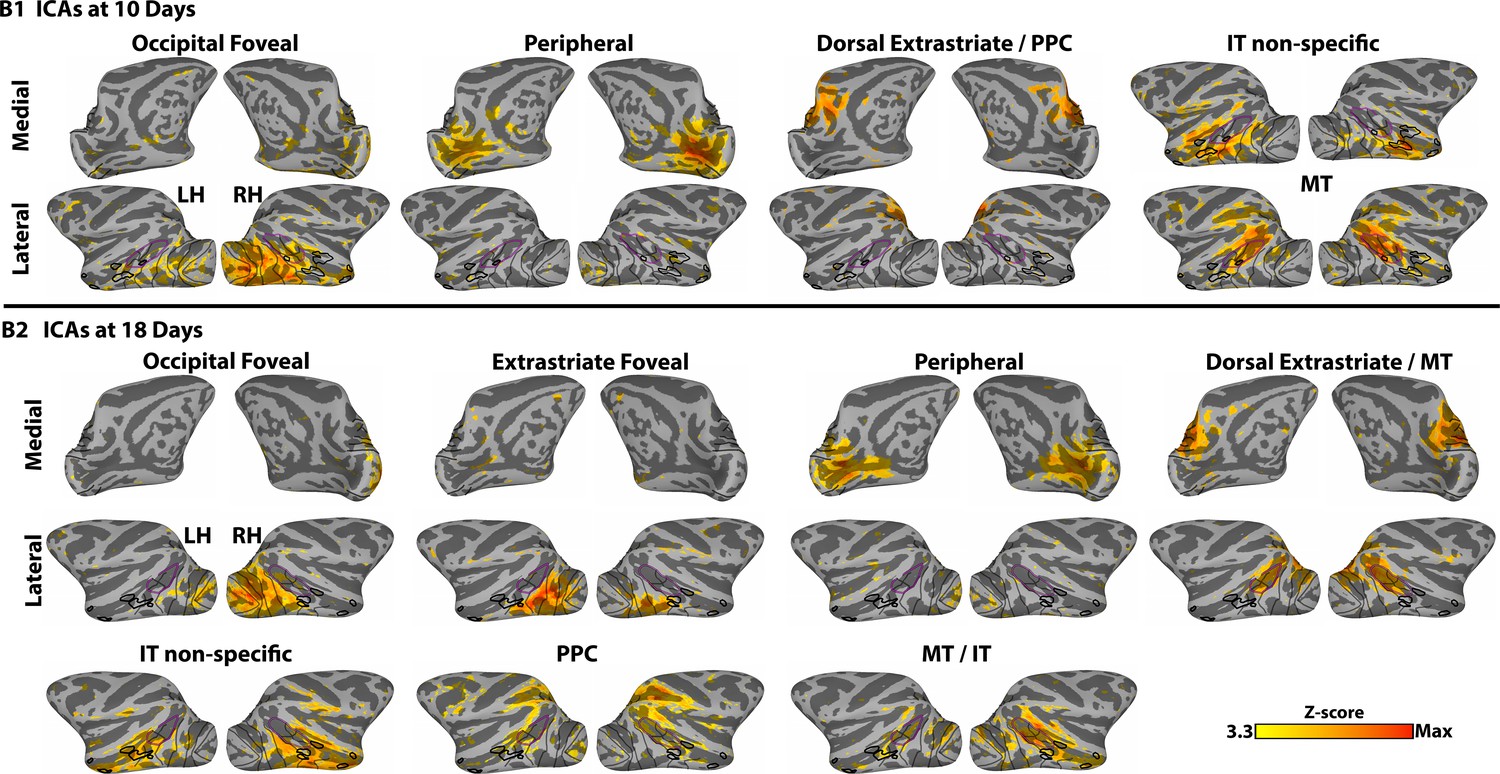
Data-driven spatial ICA maps reveal regional organization in monkeys B1 and B2, at 10 and 18 days postnatal respectively.
ICs also demonstrated retinotopic specificity (e.g., individual ICs covered foveal or peripheral representations) and arealization (e.g., ICs localized to occipital, MT, PPC, and IT). Data threshold at Z > 3.3 (p<0.001). Anatomically focal IC maps were found also within somato-motor, anterior parietal, frontal, and auditory cortices as well as several regions of the thalamus and cerebellum, similar to adults (Hadj-Bouziane et al., 2014; Hutchison et al., 2011; Moeller et al., 2009) (data not shown).
Figure 2
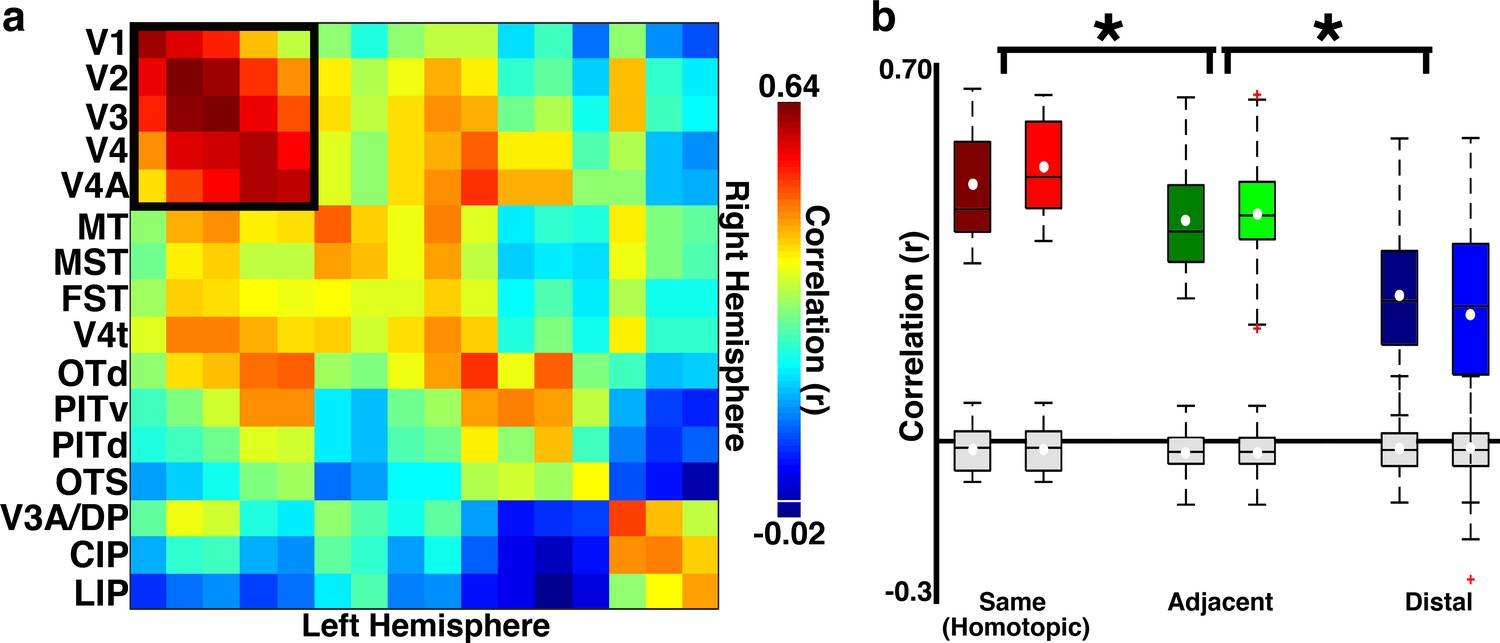
Across-hemisphere correlations reveal arealization in neonates 10 and 18 days old.
(a) Across-hemisphere neonatal correlation matrix for what we could later identify as 16 visual cortical areas from retinotopic mapping (Figure 1—figure supplement 1). Black square illustrates the areas included in the dorsal vs. ventral analysis presented in Figure 6. Colorbar range scaled to min and max correlation values. White line in colorbar indicates 0. (b) Box plots for three area groups: same (homotopic) contralateral cortical areas, adjacent (to homotopic) contralateral areas, and distal (nonhomotopic and nonadjacent) contralateral areas in B1 (dark boxes) and B2 (light boxes). Mean (white circle), median (black horizontal line), interquartiles (whiskers), and outliers (red cross). There was a clear effect of area grouping (2-way ANOVA; main effect of area group: F(2,506)=92.57, p<0.0001; no main effect of monkey and no interaction between monkey and area group, ps>0.1). Comparable effects were found for data averaged across hemispheres. Grey box plots show what would be expected from any biases in our fMRI acquisition or analyses (Materials and methods: Simulation of correlation due to instrumentation and analyses).
Figure 3
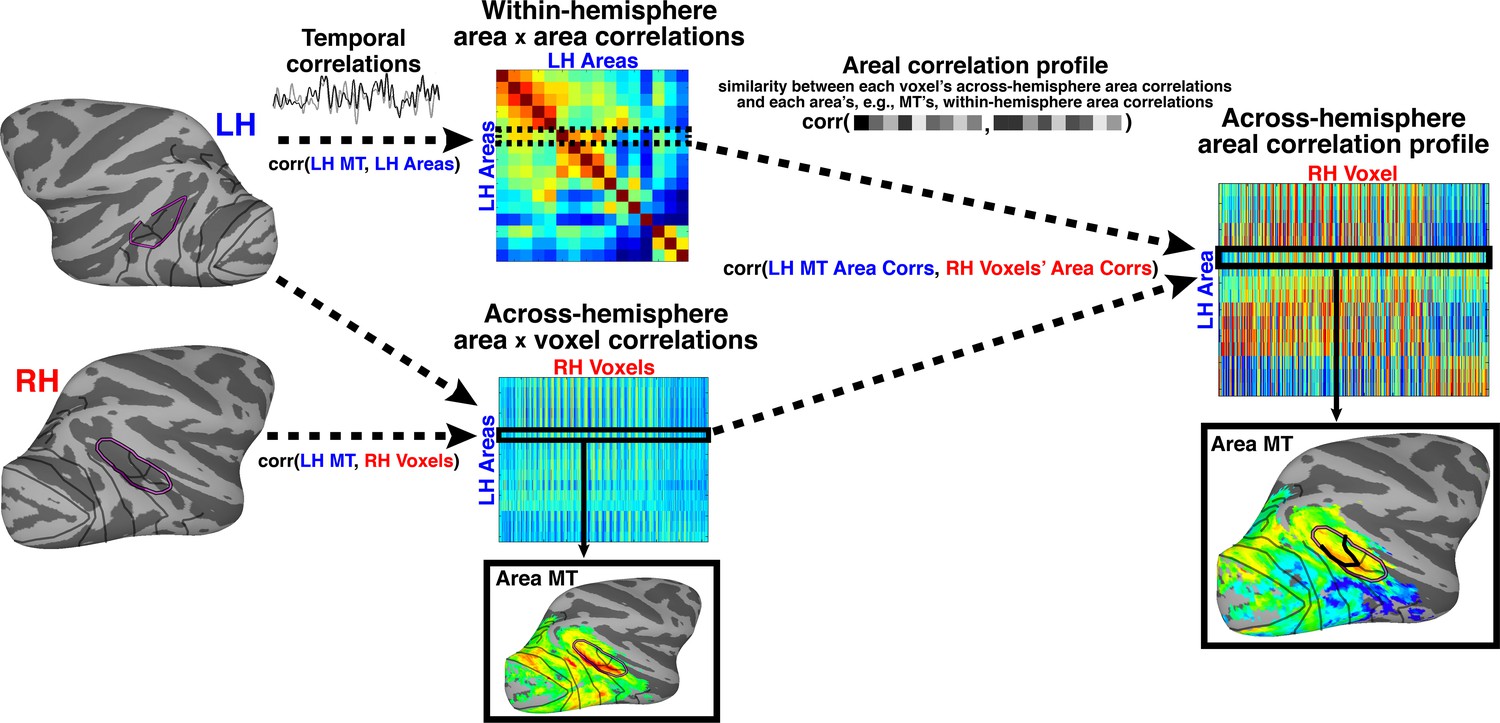
Pipeline of correlation analysis.
The two-step analysis consisted of first measuring temporal correlations followed by the areal correlation profile. First, within-hemisphere pairwise temporal correlations were calculated between 16 retinotopic seed cortical areas for each hemisphere. The resulting matrix (labeled ‘Within hemisphere area x area correlations’) is, by definition, symmetric, with each row or column corresponding to correlations between one seed cortical area and all other seed areas. Figure example is given for left hemisphere. Temporal correlations were also computed between each cortical seed area and voxels in the opposite hemisphere. Figure example is for left hemisphere seed areas and right hemisphere voxels. Each row of this matrix (labeled ‘Across-hemisphere area x voxel correlations’) can be visualized as the spatial map of correlated activity for a given seed area (e.g., MT) with every voxel in the contralateral hemisphere. This is the typical approach for voxel-wise, seed-based correlation analyses (Biswal et al., 1995). Next, the within-hemisphere area x area matrix was correlated with the across-hemisphere area x voxel matrix of the contralateral hemisphere. This yields a matrix (labeled ‘Across-hemisphere areal correlation profile’) of similarity measurements between the profile of each seed area’s within-hemisphere correlations with all other areas and the correlation profile of each voxel in the contralateral hemisphere with all other areas. Each row of this matrix can be visualized as a spatial map of similarity between a given area’s (e.g., MT) within-hemisphere correlations and each contralateral voxel’s across hemisphere area correlations. i.e., illustrating which voxels have an across-hemisphere area correlation pattern similar to contralateral MT. Code for analysis available on GitHub (Arcaro, 2017) A copy is archived on https://github.com/elifesciences-publications/AreaProfileCorrelation.
Figure 4 with 1 supplement
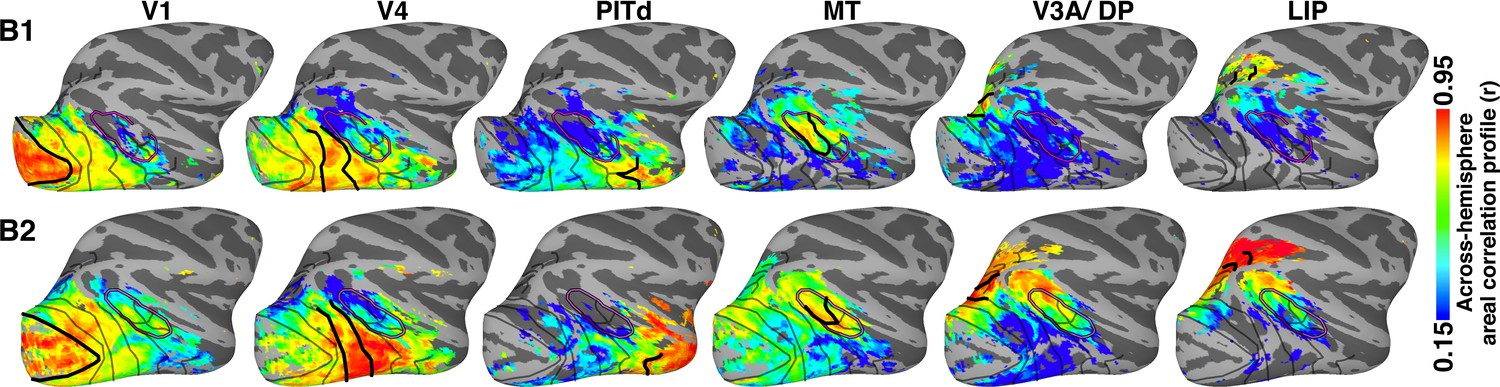
Across-hemisphere areal correlation profile maps for retinotopic seed areas in occipital (V1 and V4), middle temporal (MT), posterior IT (PIT), dorsal extrastriate (V3A/DP), and lateral intraparietal cortex (LIP) in the right hemispheres of newborn monkeys B1 and B2.
Thick black lines mark the borders of the area whose counterpart in the contralateral hemisphere served as the seed; areas were identified by retinotopic mapping in the same monkey at >1.5 years old. Data threshold on the initial across-hemisphere temporal correlations (r > 0.15; t > 5.66; p<0.0001, FDR-corrected). See Figure 4—figure supplement 1 for (a) comparison of contralateral correlations for both hemispheres in both monkeys and for (b) within-hemisphere correlation maps. Thinner black lines mark what we could later identify as the borders between visual areas. Purple line corresponds to what we could later identify as the peripheral eccentricity ridge of the MT cluster comprising areas MT, MST, FST, V4t; (Kolster et al., 2009).
Figure 4—figure supplement 1
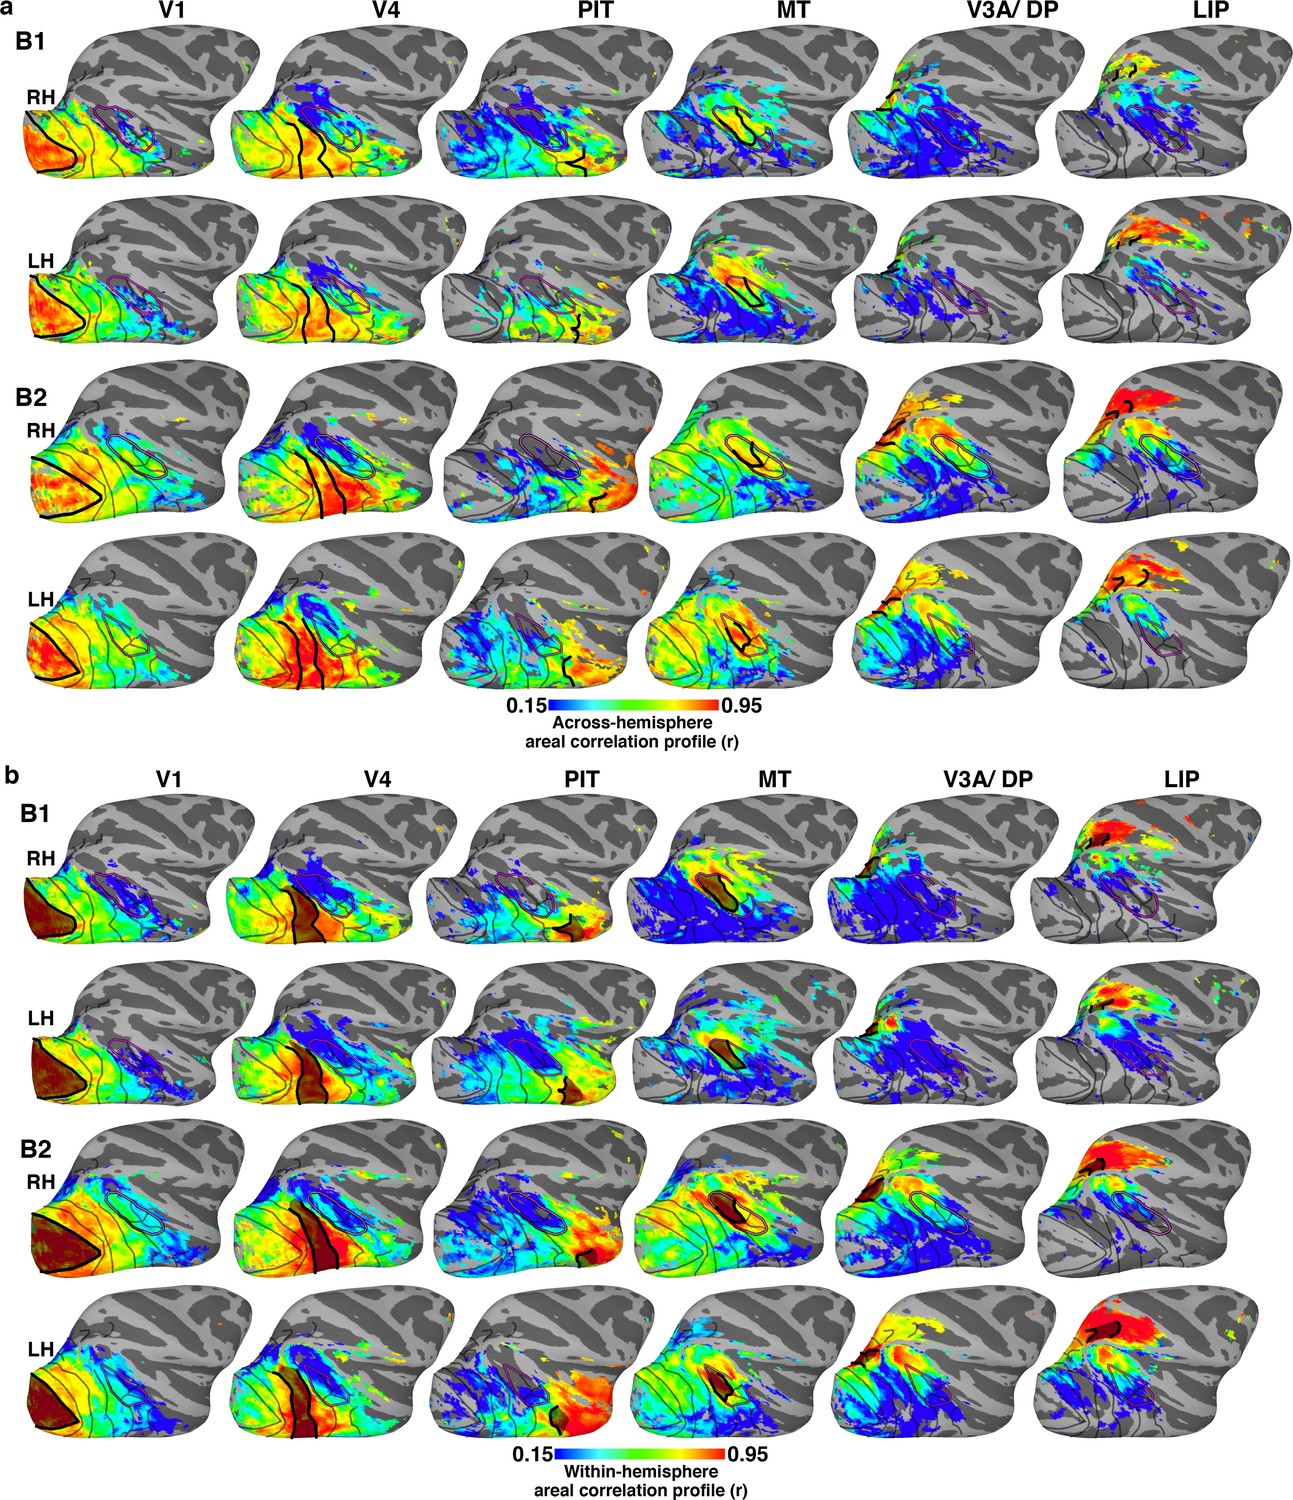
Across- and within-hemisphere similarity maps.
(a) Across-hemisphere similarity maps for right and left (mirror-reversed to match right) hemisphere in monkeys B1 and B2 illustrate the correlation structure of seed areas in contralateral cortex. Data from Figure 4 reproduced here to illustrate consistency between hemispheres. (b) Within-hemisphere similarity maps for monkeys B1 and B2 visualized on the lateral surface of the right and left (mirror reversed) hemispheres. These maps illustrate the correlation structure of seed areas in ipsilateral cortex (calculated using a within-hemisphere temporal correlation profile). (a) Across-hemisphere similarity maps resembled the (b) within-hemisphere similarity maps, which serve as a metric for how differentiable signals are across voxels in the seed hemisphere. Thick black lines mark the borders of each area that served as the seed. Thinner black lines mark borders between visual areas. Purple line corresponds to we could later identify as the peripheral eccentricity ridge of the MT cluster (comprising areas MT, MST, FST, V4t).
Figure 5
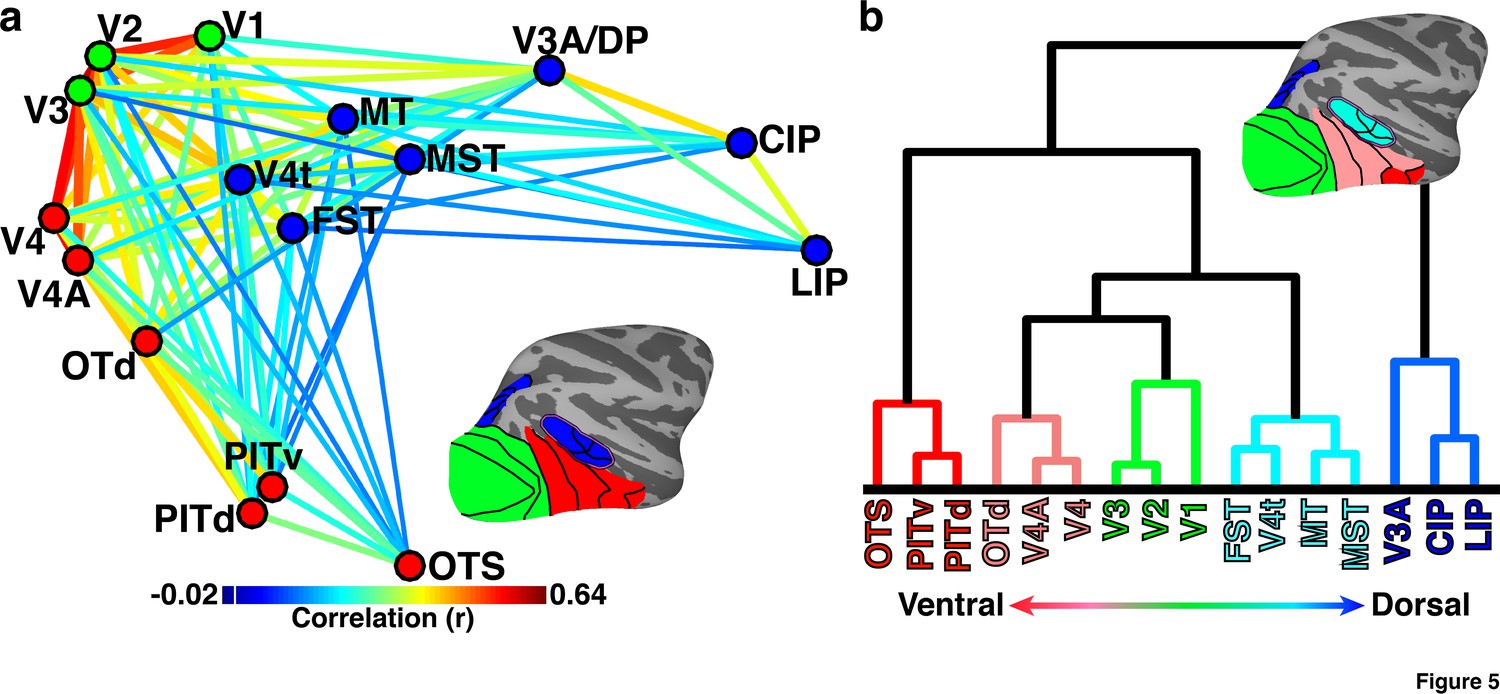
Hierarchical organization of dorsal and ventral visual pathways in newborns.
(a) Multidimensional scaling (MDS) and community segmentation on pairwise contralateral correlations of the mean signals between 16 areal seeds (See Figure 2 for seed correlation matrix). Data were collapsed across hemispheres prior to MDS. Average monkey pairwise correlations (r) >0.15 are visualized with correlation strength indicated by line color (ts > 5.66; ps<0.0001, FDR-corrected). Dots are color-coded based on community clustering. Areas showed a modest degree of modularity (Q = 0.11). Colorbar range scaled to min and max of matrix in Figure 2a. White line in colorbar indicates 0. (b) Hierarchical clustering of pairwise contralateral correlations. Leaf (area) ordering of the dendrogram maximized similarities between adjacent leaves (areas). The functional distances between areas were well captured by the hierarchical dendrogram (cophenetic correlation = 0.83). Lines are color-coded based on hierarchical cluster. For both sets of data, the inset lateral surfaces illustrate the anatomical location and cluster membership of each area by matching color code. OTS (not shown) is located on the ventral surface within a region of the occipitotemporal sulcus medial to area PITv.
Figure 6
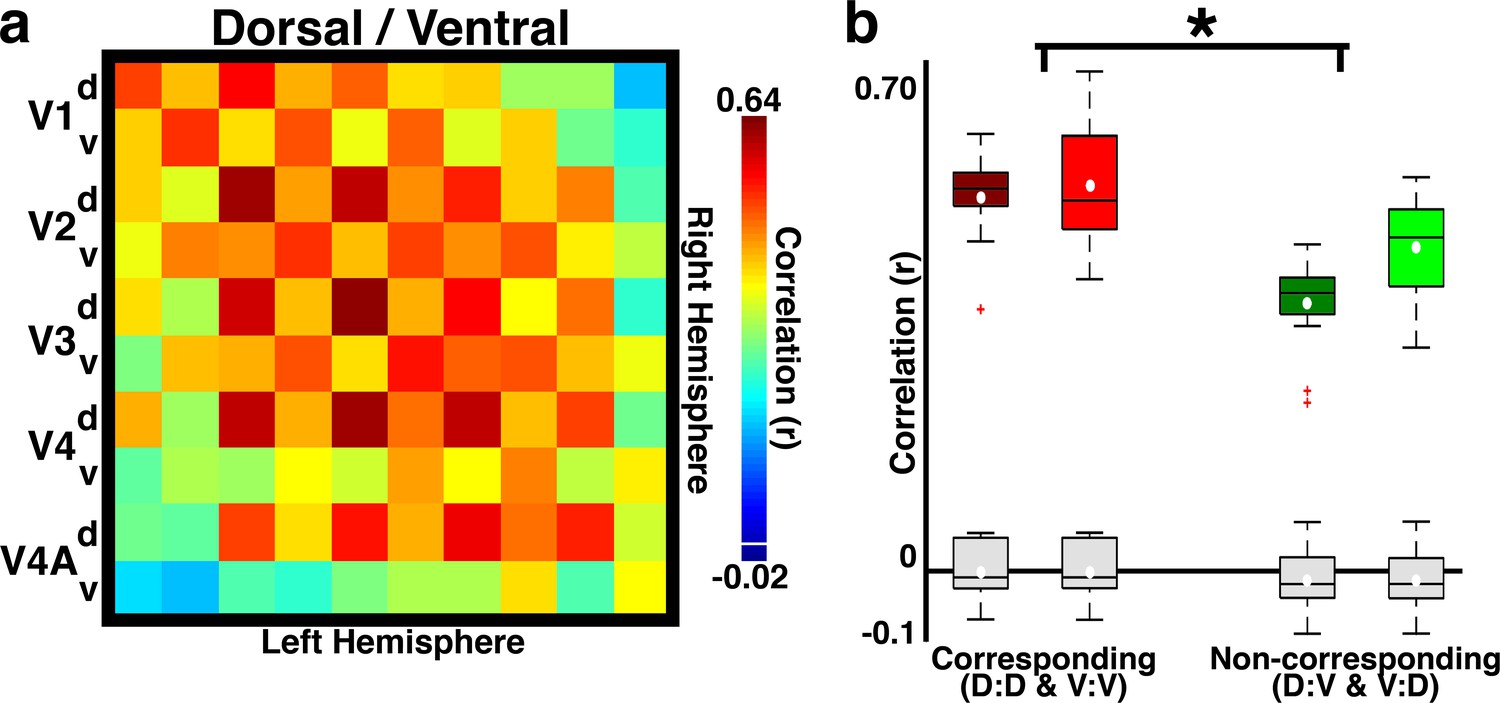
Temporal correlations distinguish upper and lower visual field representations.
(a) Across-hemisphere correlation matrix for dorsal/ventral quadrants of areas V1, V2, V3, V4, and V4A. The checkerboard pattern reveals dorsal vs. ventral visual field specificity for within- and between-area correlations. Colorbar range scaled to min and max of matrix in Figure 2a. White line in colorbar indicates 0. (b) Box plot for corresponding and non-corresponding dorsal vs. ventral quadrants for homotopic areas V1, V2, V3, V4, and V4A in B1 (dark boxes) and B2 (light boxes). Mean (white circle), median (black horizontal line), interquartile (whiskers), and outliers (red crosses) are presented. Correlations were strongest between corresponding (vs. non-corresponding) quadrants (2-way ANOVA with monkey and quadrant group as factors; main effect of quadrant group: F(1,52) = 33.17, p<0.0001; main effect of monkey: F(1,52) = 5.47, p<0.05; no interaction between monkey and quadrant group, p>0.1). Comparable effects were found for data averaged across hemisphere. Grey box plots show the correlation expected from any biases in our fMRI acquisition or analyses (Materials and methods: Simulation of correlation due to instrumentation and analyses).
Figure 7 with 1 supplement
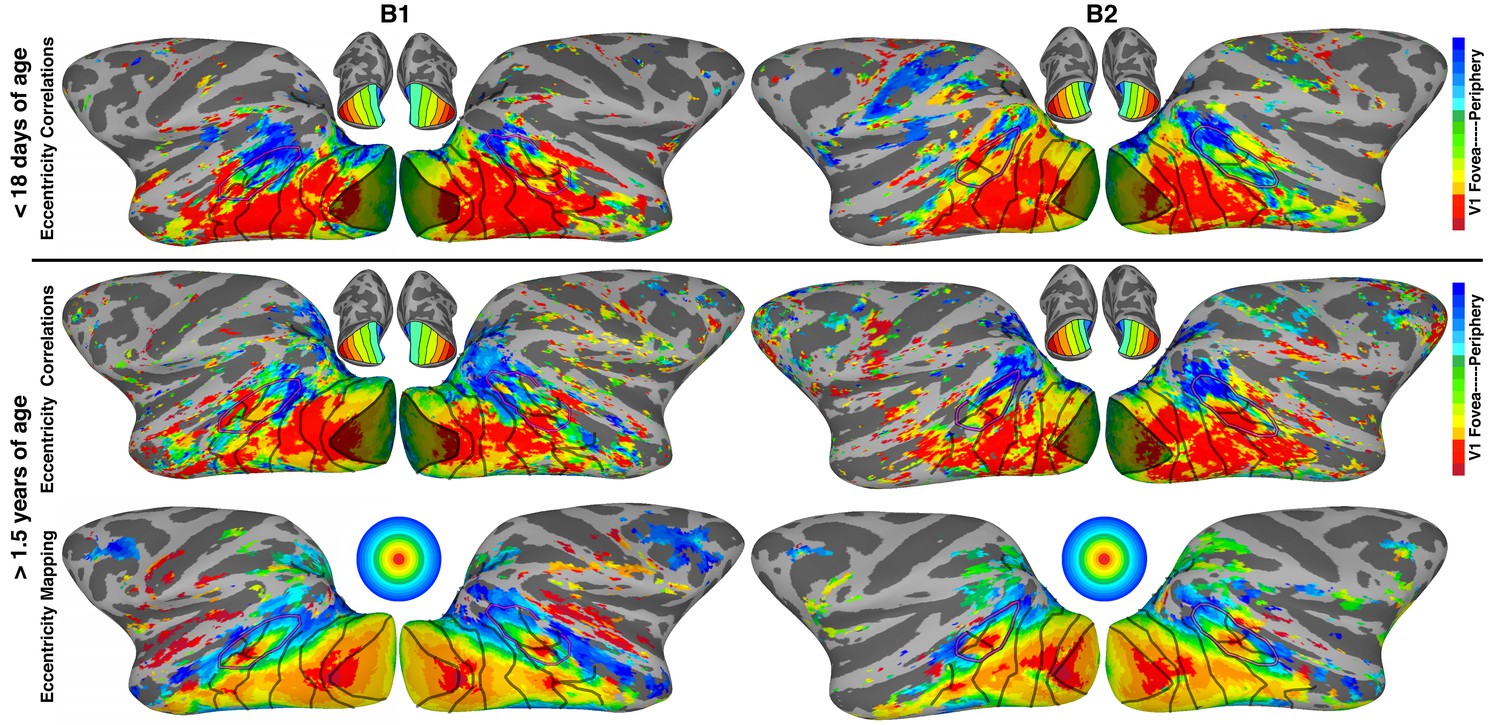
Retinotopically-specific correlated activity across ipsilateral visual cortex.
Spatial maps color-coded according to peak correlations with ipsilateral V1 eccentricity bands (top) in two neonatal monkeys < 18 days postnatal and (middle) in the same monkeys at ~3 years. Shaded area indicates V1 seeds. (bottom) Eccentricity maps (by conventional retinotopic mapping) in same monkeys at >1.5 years old. Excluding V1, the mean absolute deviation between (top) eccentricity correlations in neonates and (bottom) the eccentricity maps from retinotopic mapping was 2.2° (1.4°, 2.4°, 1.9°, and 2.1° for occipital areas V1-V4, MT cluster, inferior temporal areas, and dorsal/parietal areas, respectively). Excluding V1, the mean absolute deviation between eccentricity correlations (top) in neonates and (middle) in juveniles was 2.0° (1.8°, 2.5°, 1.7°, and 2.5° for occipital areas, MT cluster, inferior temporal, and dorsal/parietal areas, respectively). Excluding V1, the mean absolute deviation between (middle) eccentricity correlations in juveniles and (bottom) the eccentricity maps from retinotopic mapping was 1.4° (1.4°, 1.3°, 1.4°, and 1.3° for occipital, MT cluster, inferior temporal, and dorsal/parietal areas, respectively). Maps show lateral surface of the brain; see Figure 1 for additional conventions.
Figure 7—figure supplement 1
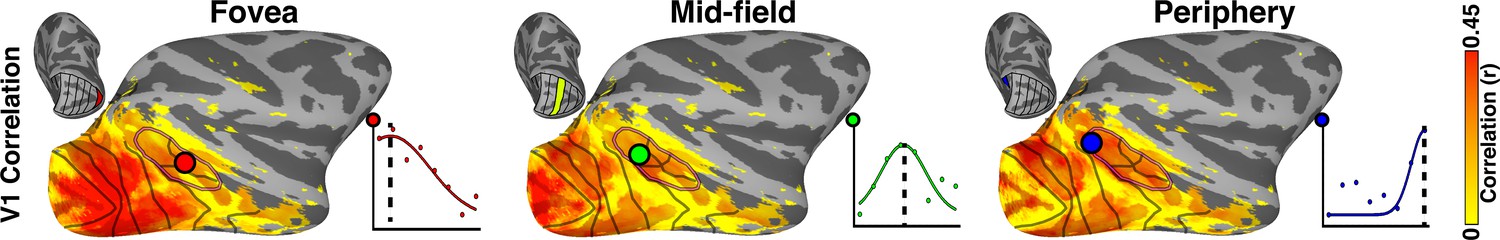
Illustration of curve fitting of V1 eccentricity seed correlations.
Example ipsilateral correlation maps are shown for foveal, midfield, and peripheral V1 seeds. Colored dots in each image illustrate a voxel showing strongest correlations (r > 0.15; p<0.0001) for that particular V1 eccentricity band as illustrated in the scatter plots with curve fits. Inset surfaces indicate the matching V1 eccentricity seed for each correlation map.
Figure 8 with 2 supplements
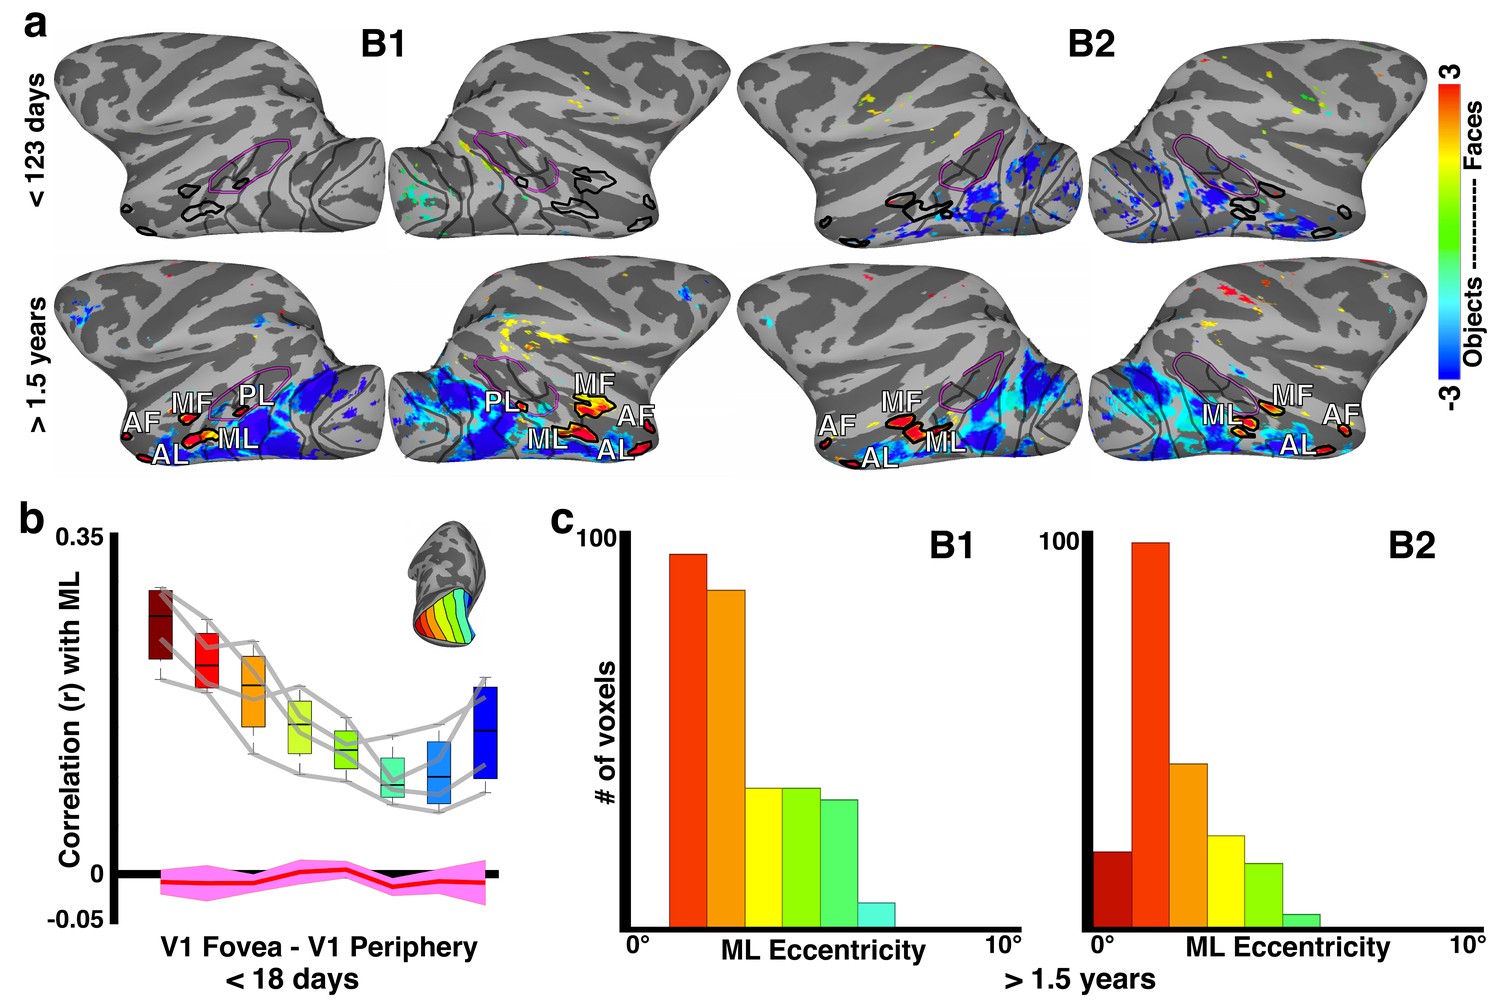
Relationship between correlation-based retinotopy and precursor-face-patches in newborns.
(a) Faces-minus-objects contrast maps for monkeys B1 and B2 at <123 days and >1.5 years. In each animal, the contrast maps for <123 days summarizes data across four scan sessions reported individually in Livingstone et al. (2017). Average beta contrasts are shown for voxels that were significant in at least two scan sessions (p<0.05, FDR-corrected). The contrast maps for >1.5 years are from a single session in each animal when the face patches were stable and robust (p<0.05, FDR corrected). Thick black outlines illustrate the extent of face-selective regions in IT as defined at >1.5 years by the faces-minus-objects contrast; these outlines were overlaid onto the neonatal data at <123 days. (b) Box plots of correlations between the precursor-middle face patch and V1 eccentricity bands in neonates < 18 days old averaged across hemispheres and monkeys. Data from individual hemispheres are plotted as gray lines. Red line illustrates correlations expected from instrumentation noise and preprocessing. (c) Histogram of eccentricity representations averaged across all voxels in the middle face patch (ML) and both monkeys >1.5 years of age.
Figure 8—figure supplement 1
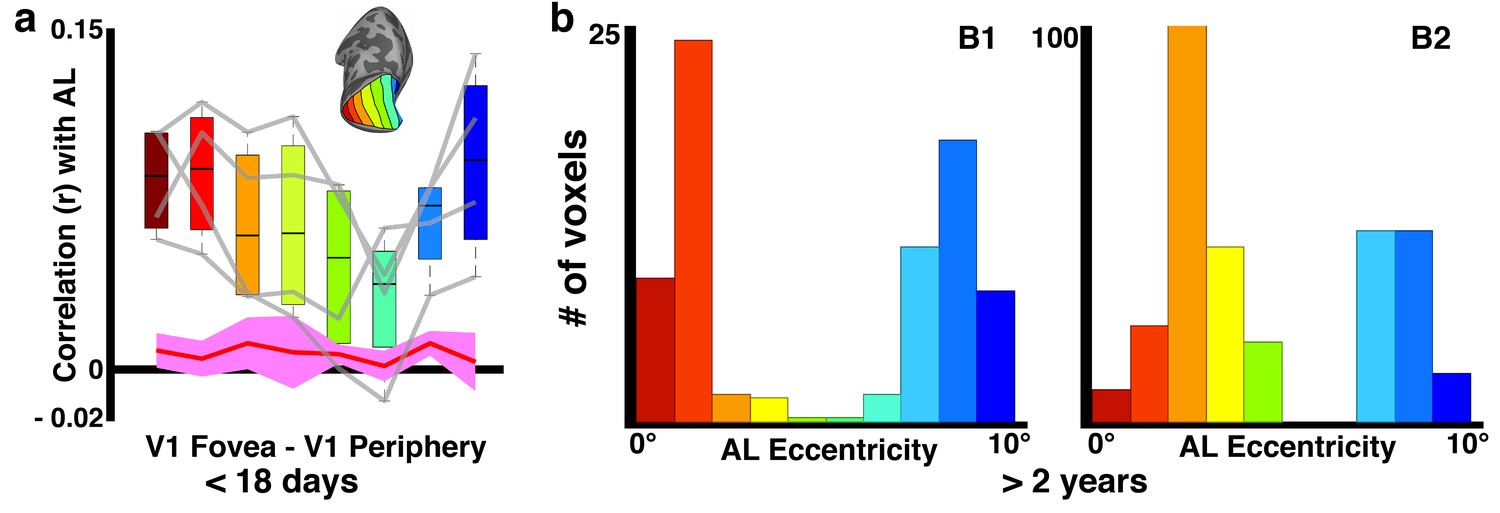
Sub-threshold retinotopic correlations with anterior face patch, AL.
(a) Weak correlations between V1 eccentricity bands and what will become AL show peaks in both foveal and peripheral V1 in each hemisphere (gray lines) and the group average. (b) Sub-threshold distribution of eccentricity preference in older-juvenile AL also shows a preference for both foveal and peripheral visual field.
Figure 8—figure supplement 2
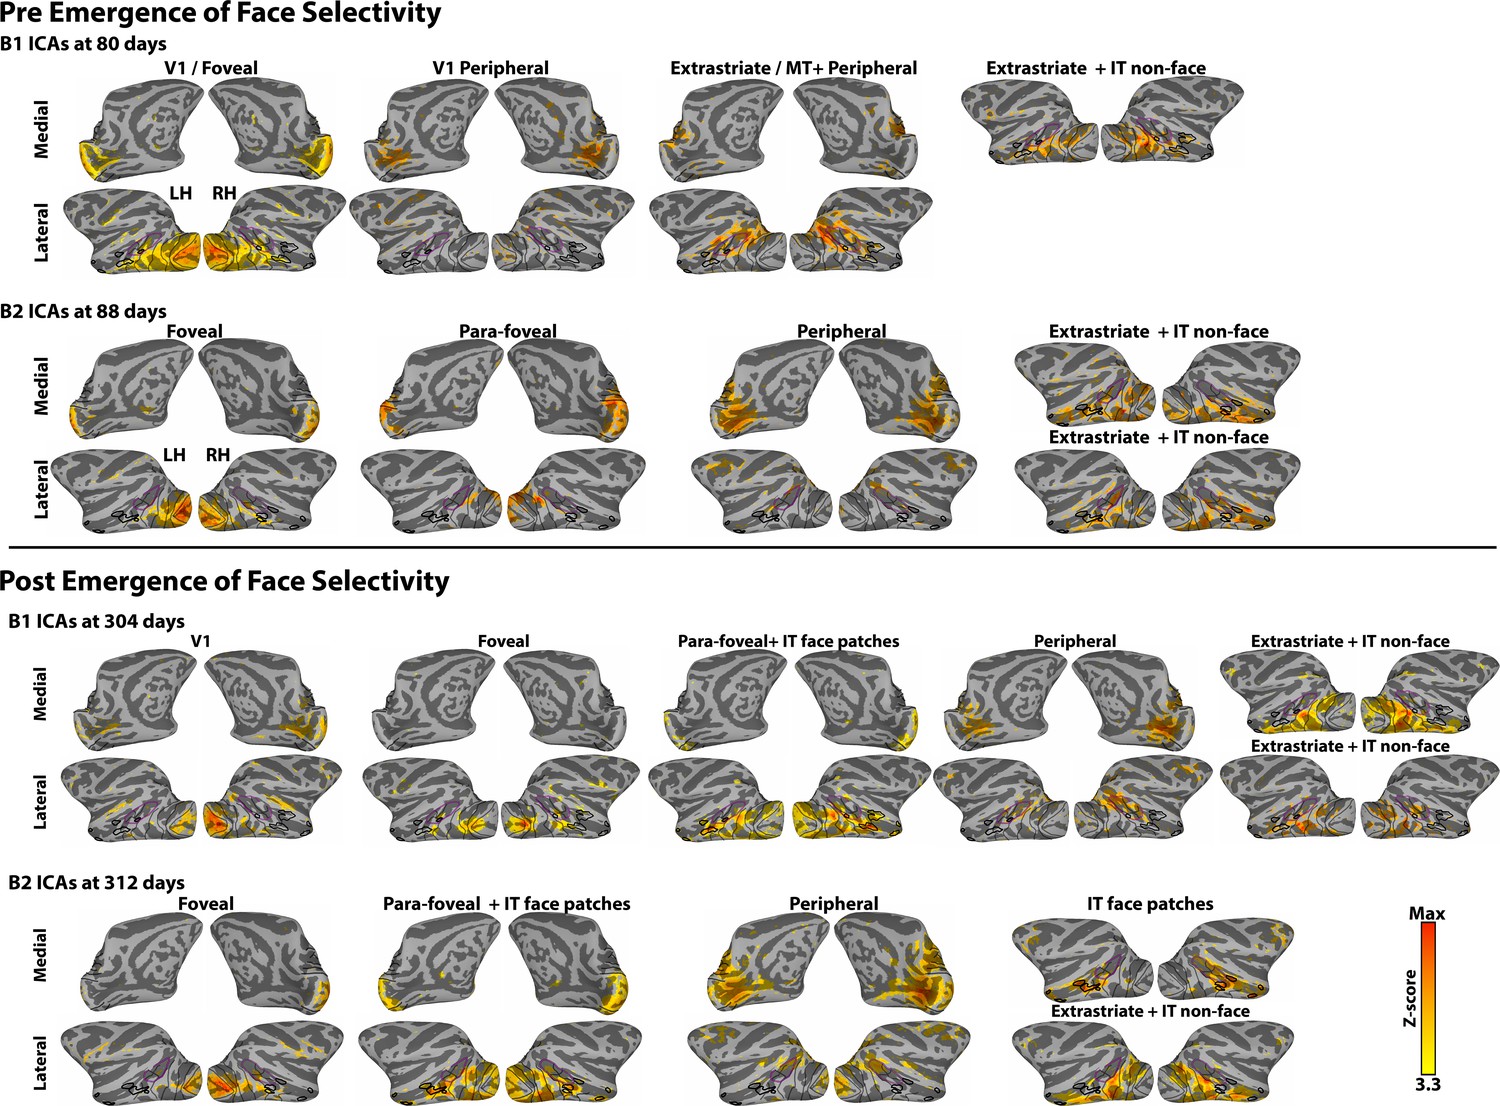
Data-driven spatial ICA maps in four additional data sets.
ICAs were calculated in data sets collected both pre- and post- emergence of face patches: for B1 at 80 (pre-emergence of face patches) and 304 (post-emergence of face patches) days postnatal and B2 at 88 (pre-emergence of face patches) and 312 (post-emergence of face patches) days postnatal. The ICAs are similar to the ICA analysis in the newborn data (Figure 1—figure supplement 2), in that retinotopically-specific ICs (e.g., individual ICs specific to either foveal or peripheral representations) were identified in both sessions for both monkeys. After the emergence of face patches (B1 304 days, B2 312 days), both monkeys showed an additional component that corresponded to face selective regions. In B1 (304 days), the ICA component containing the face-selective patches also covered parafoveal occipital cortex (2–5°), though significant voxels in IT were specific to face regions. Prior to the emergence of face patches, however, we found no evidence for spatially specific correlated activity between regions of IT that were later identified as face patches. The only IC component covering IT cortex was spatially non-specific with respect to the location of future face patches and included additional posterior extrastriate cortex.
Figure 9
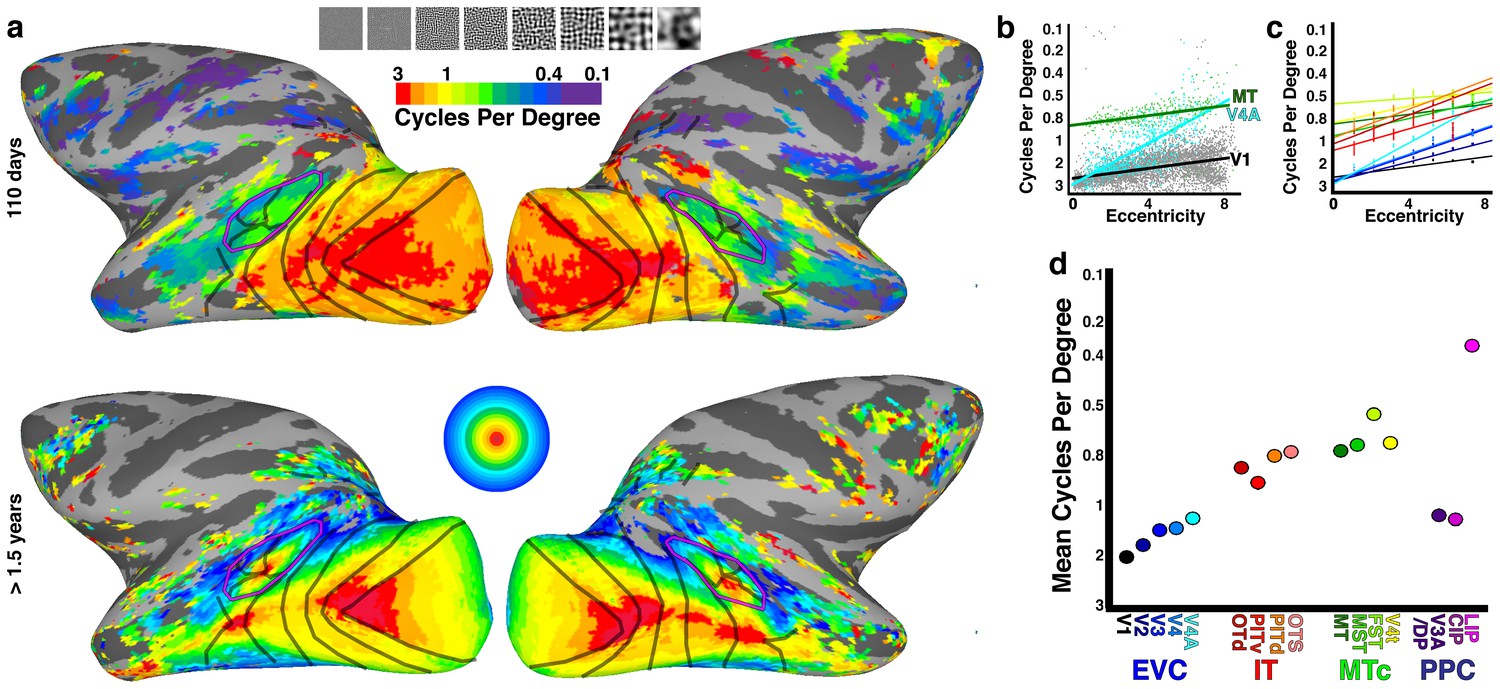
Spatial tuning correlates with retinotopic organization.
(a, top) Cortical surface maps of preferred spatial frequency in monkey B3 at 110 days. Data threshold at p<0.001. (a, bottom) Cortical surface map of average eccentricity organization calculated from four other monkeys at >1.5 years. Data threshold such that only voxels with p<0.001 in at least 3 out of 4 monkeys are displayed. See Figure 1 for additional conventions. (b) Scatter plot of preferred spatial frequency (i.e., cycles per degree) in every voxel in three visual areas vs. eccentricity; lines show linear fit. (c) Linear fits of preferred spatial frequency vs. eccentricity for areas V1-V4A, MT, MST, FST, V4t, OTd, PITv, and PITd as indicated by corresponding color in panel d. Areas CIP1/2, V3A/DP, OTS1/2 and LIP were not included due to two or more eccentricity bins lacking any voxels. (d) Mean preferred spatial frequency for each retinotopic area.
Figure 10
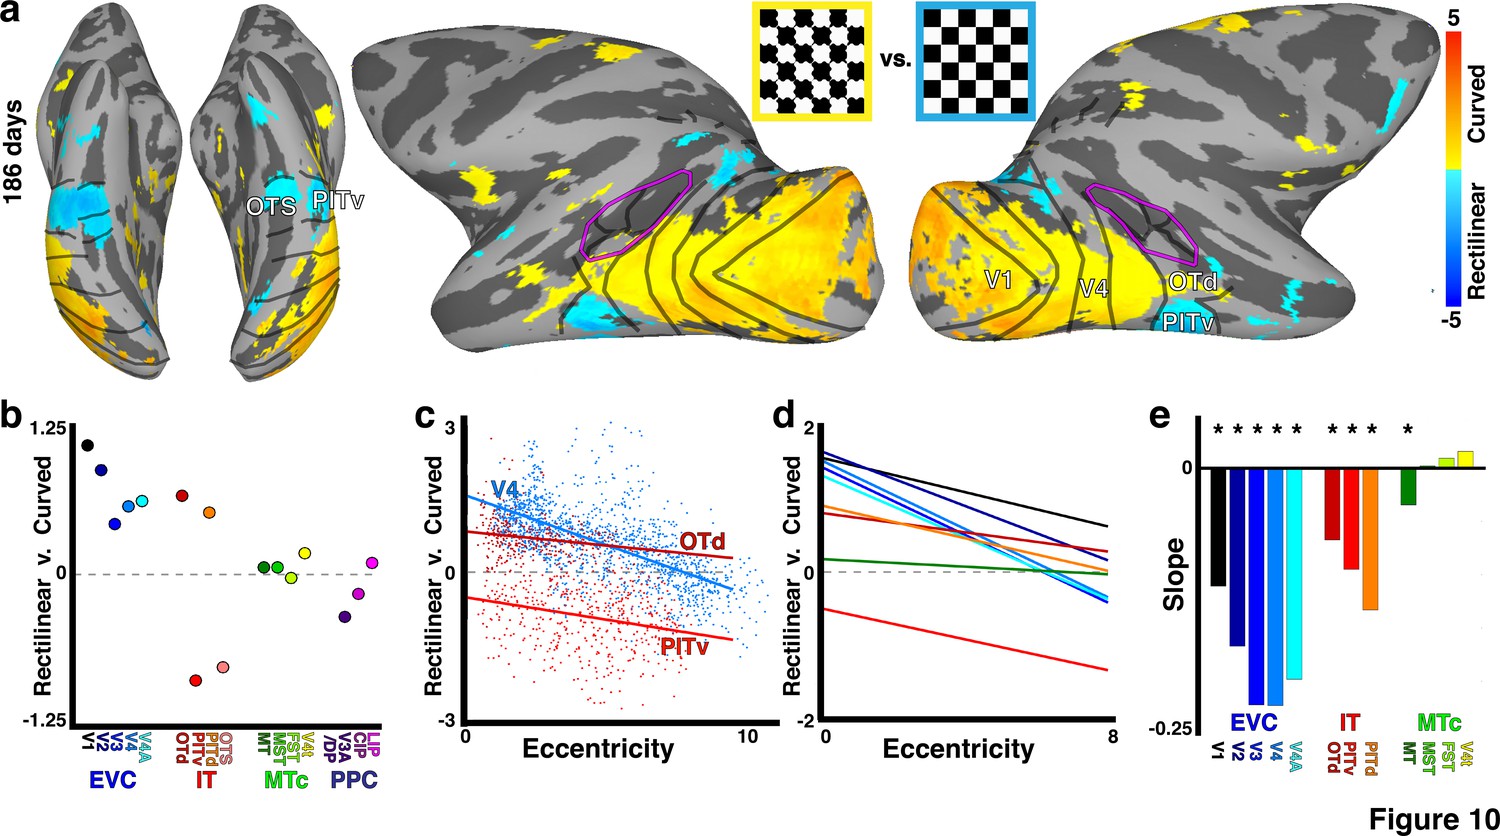
Low-level shape selectivity correlated with retinotopic organization.
(a) Cortical surface map of curved-minus-rectilinear contrast in monkey B4 at 186 days. Data threshold at p<0.05 FDR corrected. (b) Mean response contrast to curved-minus-rectilinear stimuli for each retinotopic area. (c) Scatter plot of the curved-minus-rectilinear contrast as a function of eccentricity for areas V4, OTd, and PITv; lines show linear fit. (d) Linear fits of the curved-minus-rectilinear contrast vs. eccentricity for areas V1-V4A, MT, MST, FST, V4t, OTd, PITv, and PITd as indicated by corresponding color in panel e. Areas CIP1/2, V3A/DP, OTS1/2, and LIP were not included in the linear fits due to two or more eccentricity bins lacking any voxels. Eccentricity bins comprising less than five voxels were excluded from the plot. (e) Slopes of linear fits (p<0.05 FDR corrected as indicated by asterisk).
Download links
A two-part list of links to download the article, or parts of the article, in various formats.
Downloads (link to download the article as PDF)
Open citations (links to open the citations from this article in various online reference manager services)
Cite this article (links to download the citations from this article in formats compatible with various reference manager tools)
A hierarchical, retinotopic proto-organization of the primate visual system at birth
eLife 6:e26196.
https://doi.org/10.7554/eLife.26196


