Structural basis for anion conduction in the calcium-activated chloride channel TMEM16A
- University of Zurich, Switzerland
Figures
Figure 1 with 4 supplements
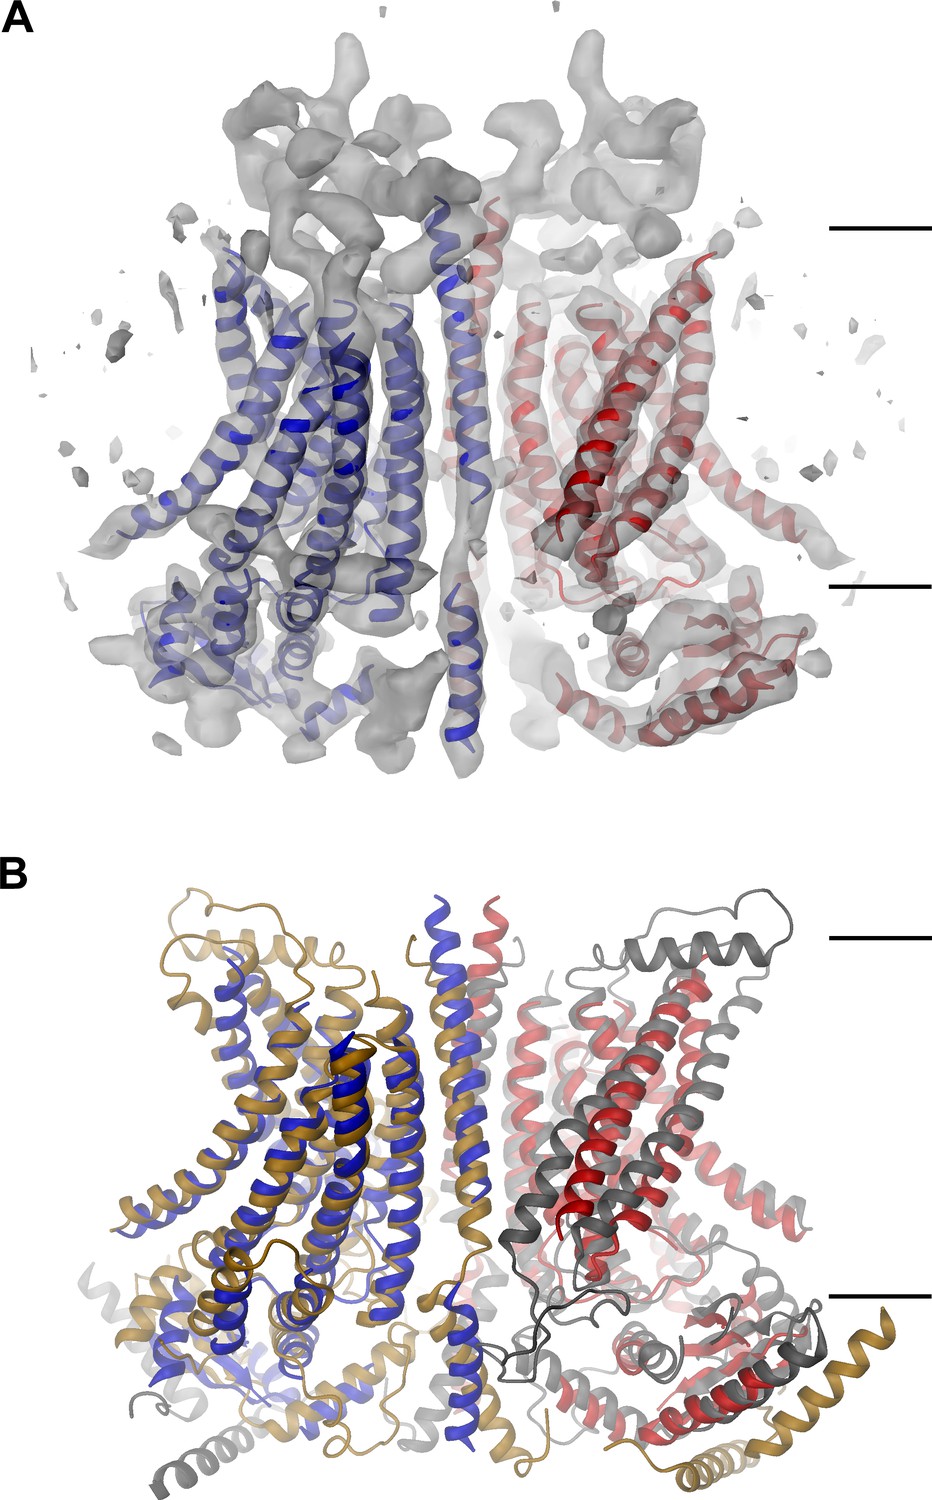
mTMEM16A structure.
(A) Ribbon representation of the mTMEM16A dimer with the EM density (contoured at 11σ) superimposed. (B) Superposition of mTMEM16A (blue and red) and nhTMEM16 (beige and grey). A and B, The view is from within the membrane with the extracellular side at the top. The membrane boundary is indicated.
Figure 1—figure supplement 1
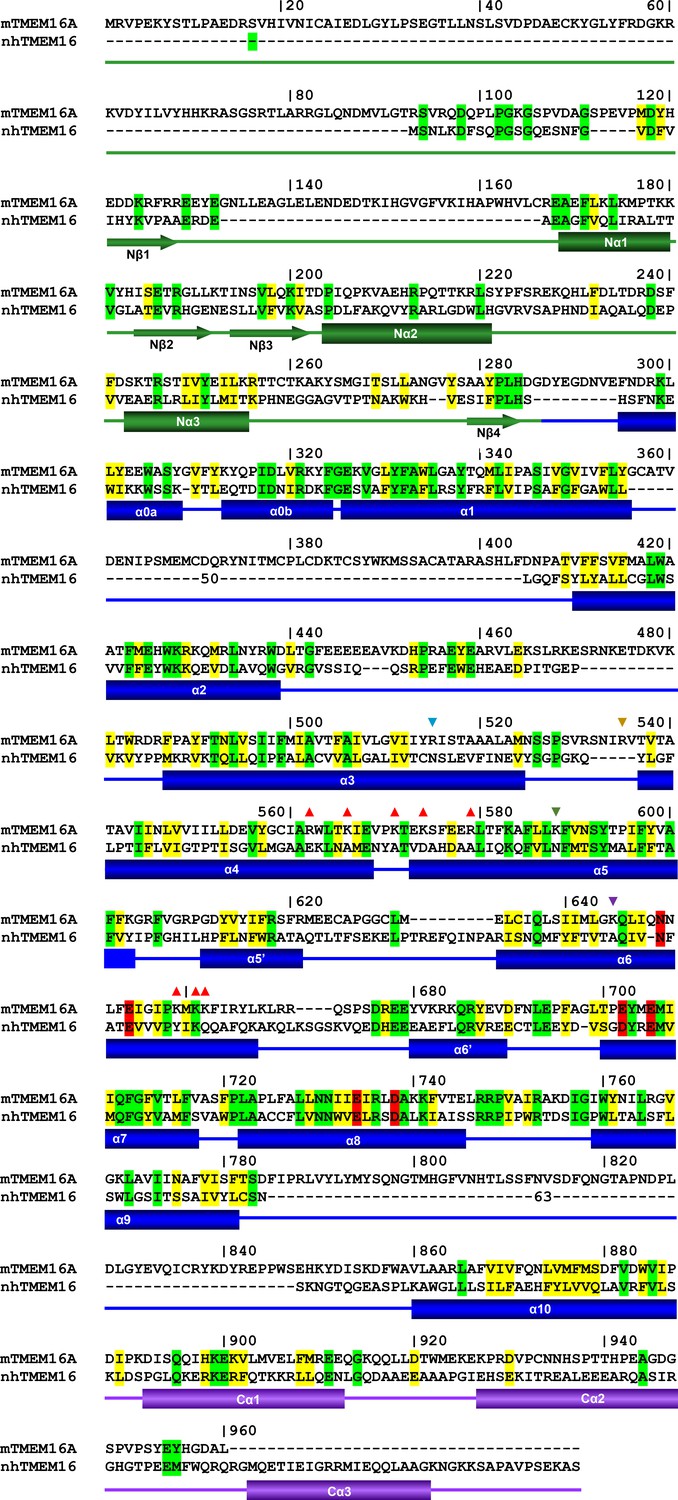
Sequence alignment.
Sequences of mTMEM16A(ac) (UniProt Q8BHY3.2) and nhTMEM16 (NCBI Reference Sequence: XM_003045982.1) were aligned with Clustal Omega (Sievers et al., 2011) and edited manually based on the nhTMEM16 structure (PDBID 4WIS). Identical residues are highlighted in green, homologous residues in yellow and residues of the Ca2+ binding site in red. Secondary structure elements of nhTMEM16 are indicated below. The numbering corresponds to mTMEM16A. (▼) Indicates mutated positions of the narrow neck and (▲) of the intracellular vestibule.
Figure 1—figure supplement 2
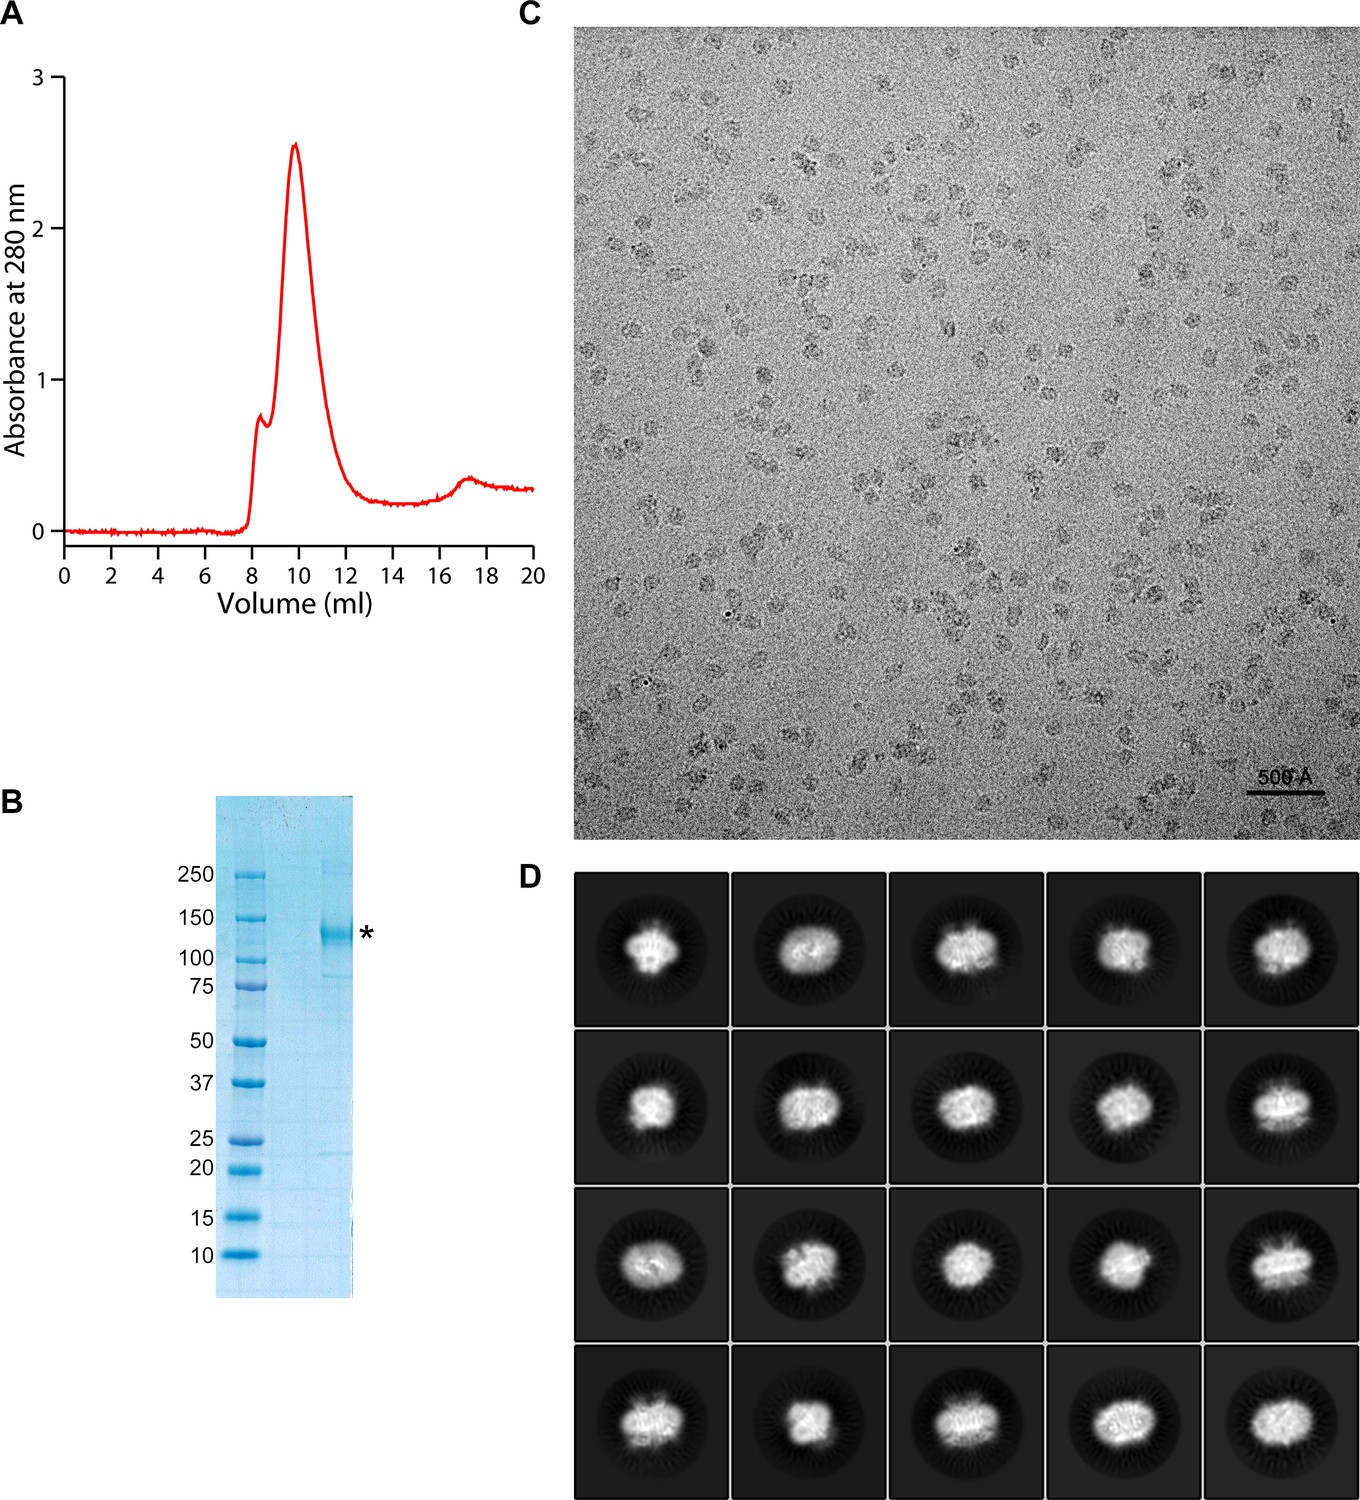
Protein preparation and cryo-EM image processing.
(A) Gel-filtration profile of purified and de-glycosylated mTMEM16A run on a Superdex200 column equilibrated with the detergent digitonin. (B) SDS-PAGE gel of the concentrated peak fractions used for cryo-EM sample preparation. mTMEM16A is labeled (*). The molecular weight of marker proteins (kDa) is indicated. (C) Representative micrograph of purified mTMEM16A in vitreous ice. (D) Representative images of 2D class averages from two-dimensional classification in RELION.
Figure 1—figure supplement 3
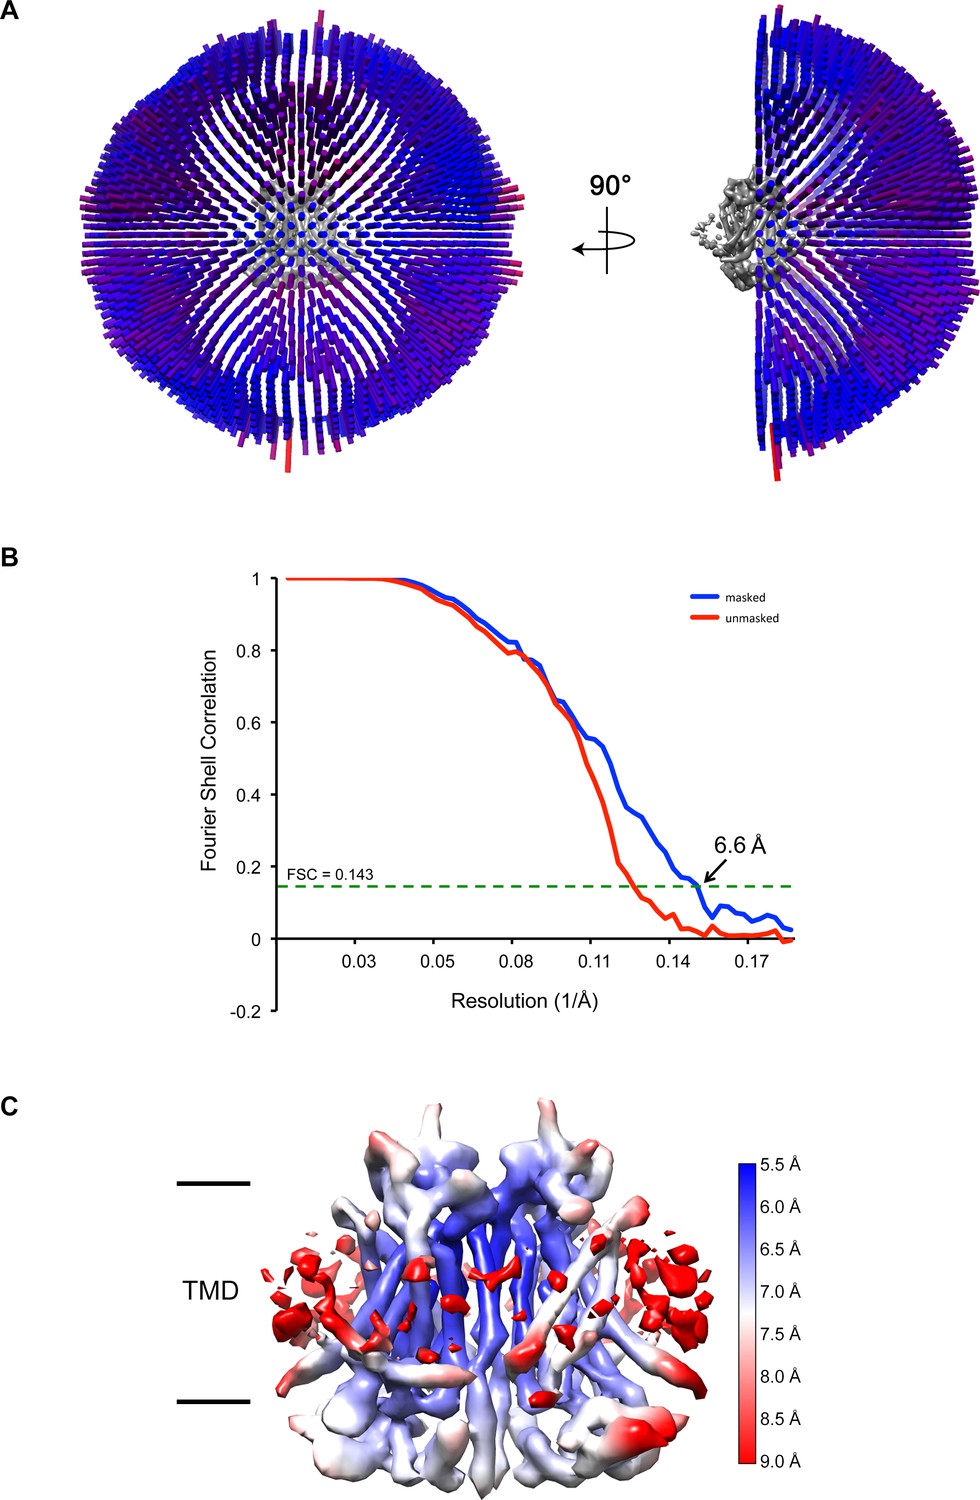
Three-dimensional reconstruction of mTMEM16A.
(A) Angular distribution of particles included in the final 3D reconstruction. The number of particles with respective orientations are represented by length and color of the cylinders. (B) Fourier shell correlations (FSC) calculated between independently refined half-maps before (red) and after (blue) masking indicating a final resolution of 6.6 Å on the basis of the FSC = 0.143 criterion. (C) 3D density map of mTMEM16A colored according to the local resolution.
Figure 1—figure supplement 4
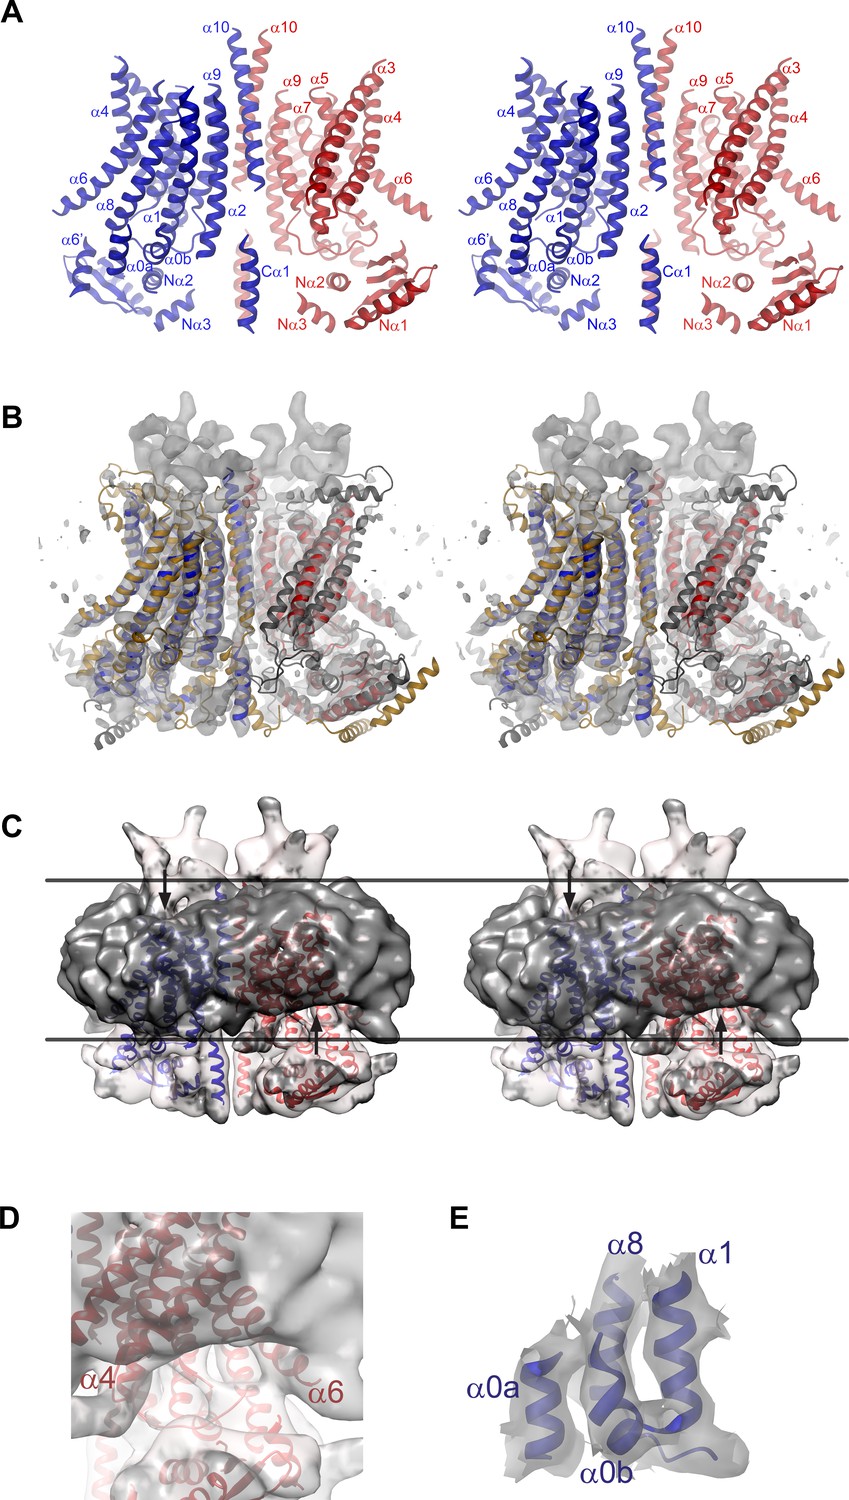
EM density of the mTMEM16A channel.
(A) Stereo view of the mTMEM16A dimer. The protein is displayed as ribbon, selected α-helices are labeled. (B) Stereo view of a superposition of the mTMEM16A and the nhTMEM16 dimers. The EM-density (contoured at 11σ) is shown superimposed. (C) Stereo view of the unmasked EM density at low contour superimposed on the mTMEM16A model. The micelle is highlighted by coloring the density below a resolution threshold of 5.5 Å in dark grey. Lines indicate the membrane boundary and arrows the micelle distortion. Compared to A, the view is rotated by −25° around the y axis. (D) Close-up of the density in b at low contour near the intracellular region between α-helices 4 and 5 showing the distortion of the detergent micelle. (E) EM-density (contoured at 7σ) surrounding the two short amphiphilic helices α0a and α0b at the start of the TMD. EM density in B and E was sharpened with a b-factor of −700 Å2. A and B, view and color coding is as in Figure 1.
Figure 2
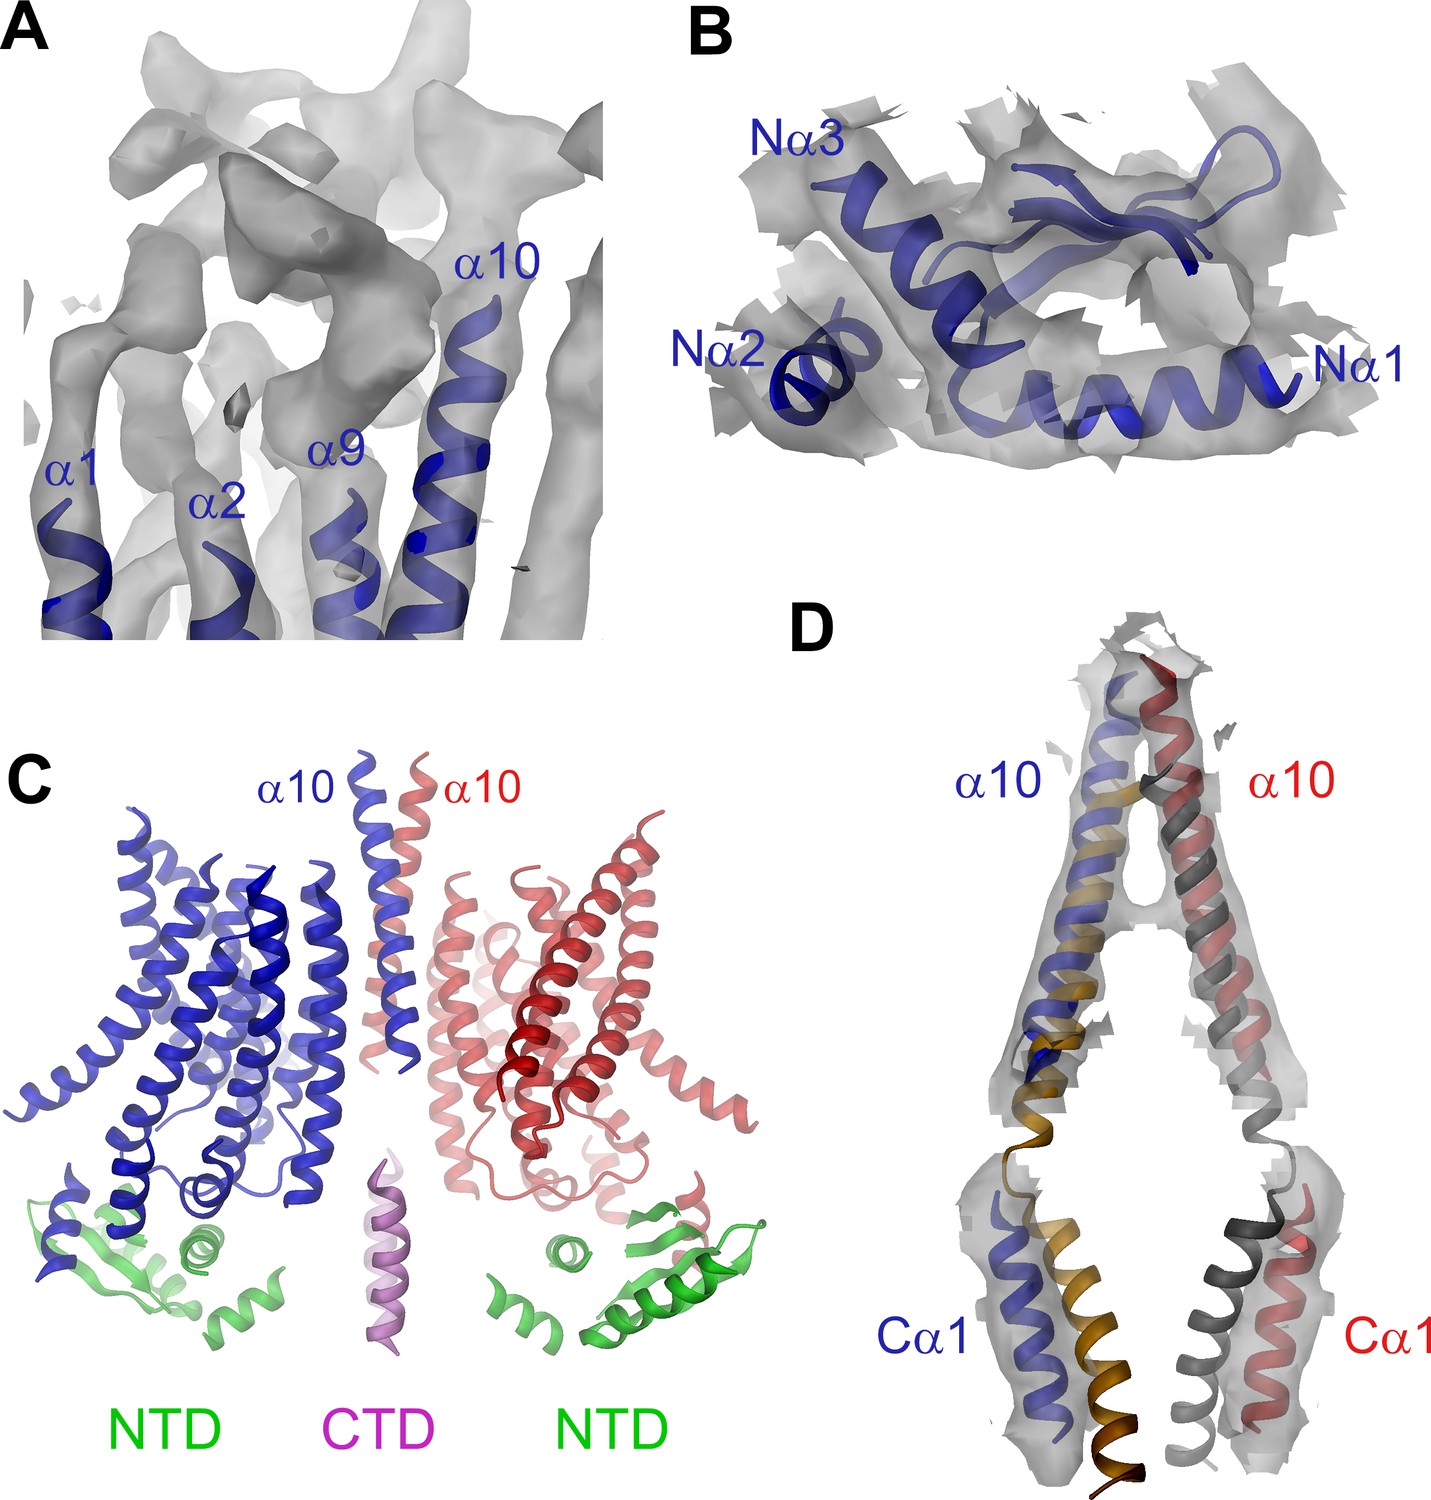
Features of the mTMEM16A structure.
(A) Unassigned EM density (contoured at 11σ) of the extracellular α1α2 and α9α10 loops. Connected transmembrane α-helices are shown as ribbon and labeled. (B) Structure of the N-terminal domain. Secondary structure elements are shown as ribbon, α-helices are labeled. (C) Ribbon representation of the mTMEM16A dimer. The transmembrane domains (TMD) of individual subunits are colored in blue and red, respectively, N-terminal domains (NTD) in green and the C-terminal domains (CTD) in violet. The view is as in Figure 1A. (D) Helices α10 of the TMD and Cα1 of the CTD of both subunits of the superimposed dimeric mTMEM16A and nhTMEM16 structures are shown. The view is from within the membrane towards the dimer interface. B and D, Sections of the EM density (contoured at 7σ) are superimposed on selected parts of the model.
Figure 3 with 1 supplement
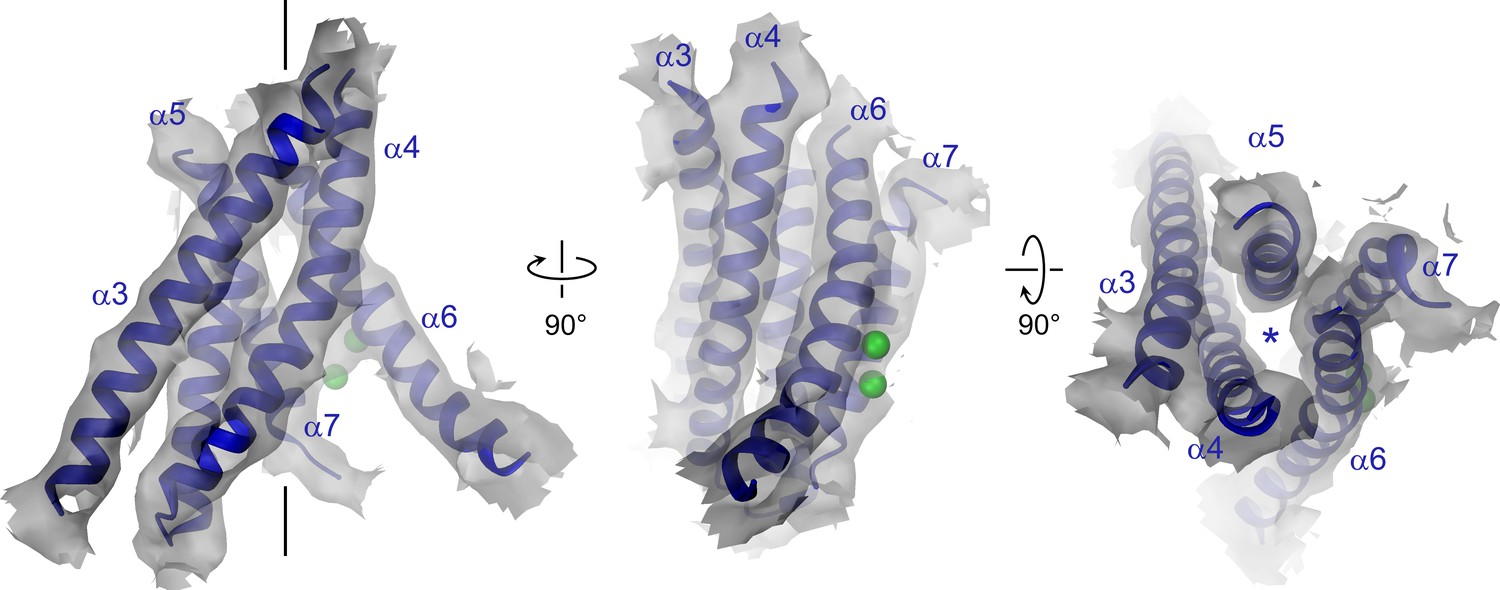
Pore region of mTMEM16A.
Transmembrane α-helices 3–7 constituting the ion conduction pore of a single mTMEM16A subunit are shown as ribbon and labeled. Sections of the EM density (contoured at 7σ) are superimposed on the model. Green spheres correspond to the positions of bound Ca2+ in nhTMEM16. The view in the left panel is as in Figure 1A, the relationship of other panels is indicated. The location of the ion conduction pore is marked by a black line (left panel) or an asterisk (right panel).
Figure 3—figure supplement 1
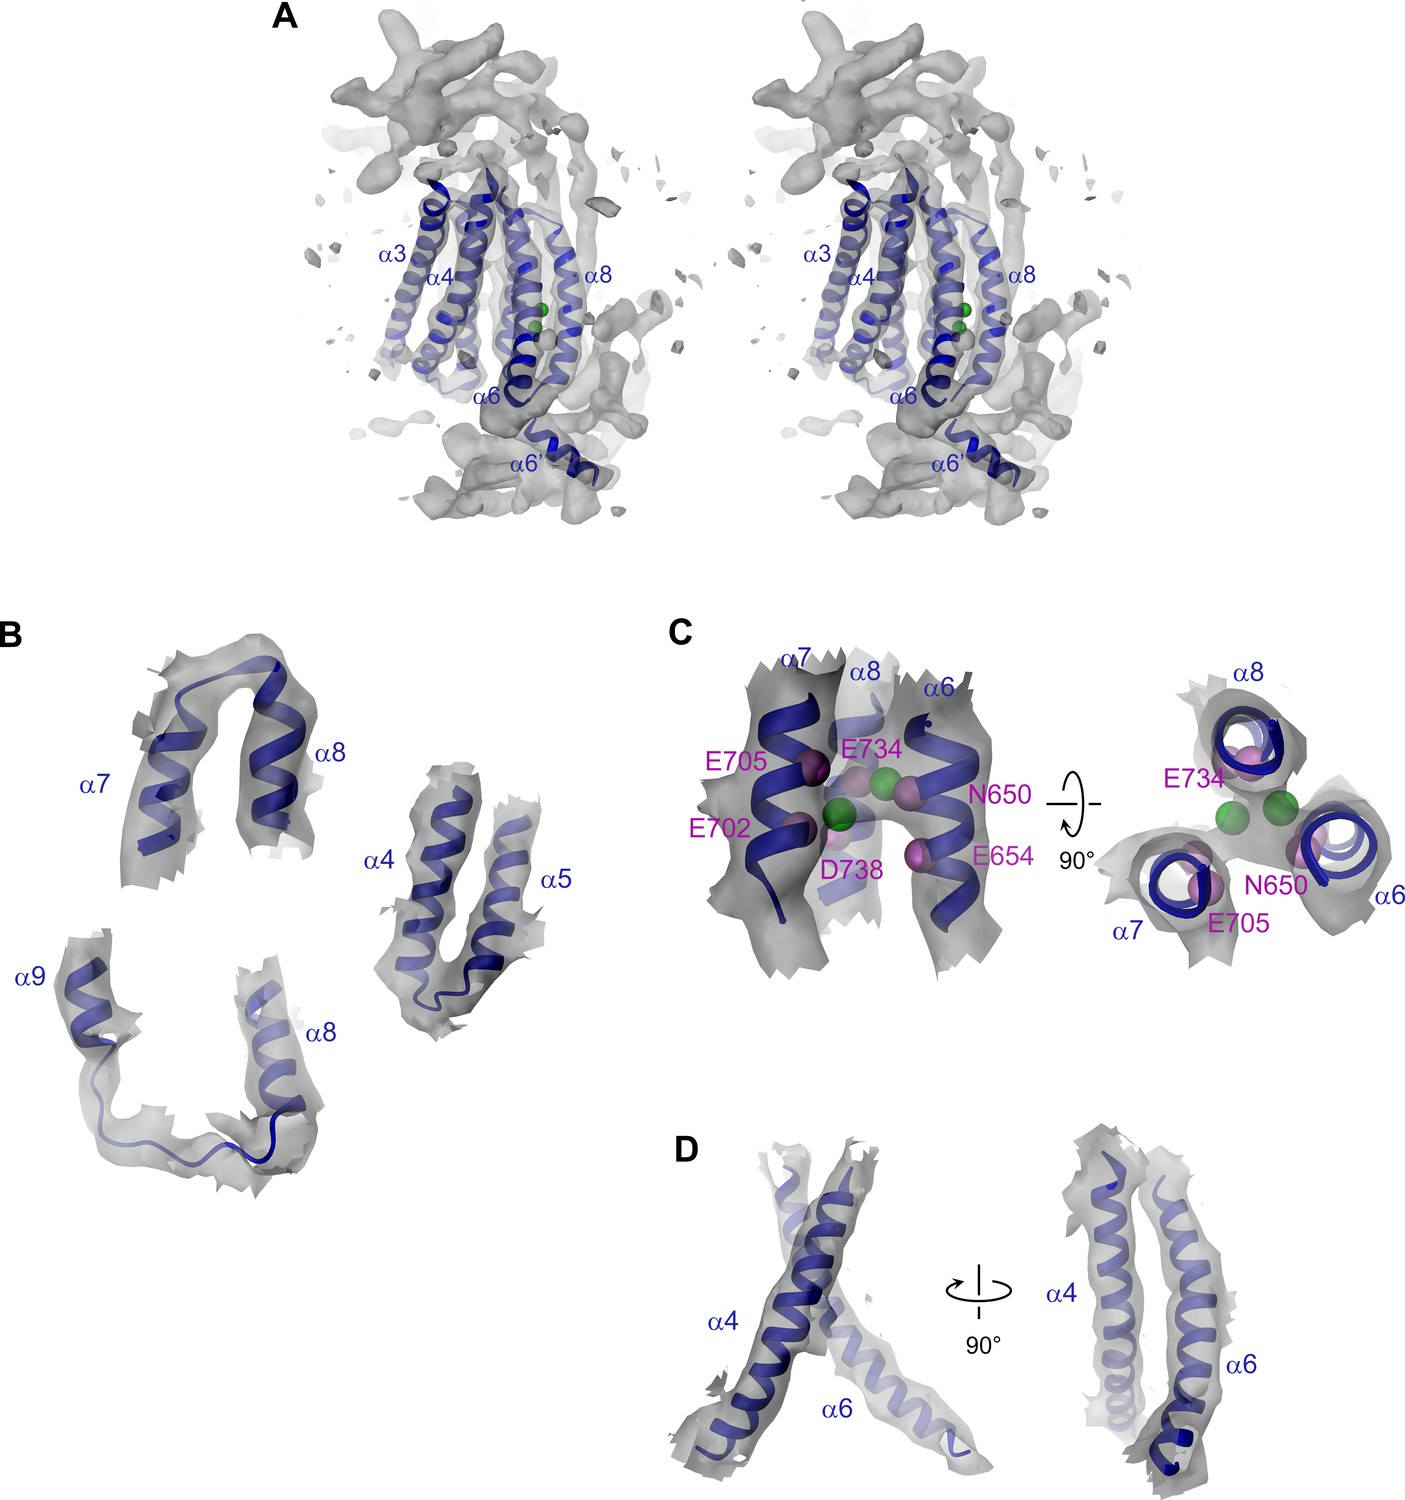
Pore region and Ca2+ binding site.
(A) Stereo view of the pore region of mTMEM16A. The view is from within the membrane. The pore region including the Ca2+ binding site encompassing transmembrane α-helices 3–8 is shown as ribbon. EM density (contoured at 11σ) of the entire molecule is shown superimposed. (B) EM density (contoured at 7σ) corresponding to conserved α7α8, α4α5 and α8α9 loops superimposed on the model. (C) EM density (contoured at 7σ) corresponding to the Ca2+-binding region superimposed on the model. The Cα positions of conserved residues constituting the binding site are shown as violet spheres and labeled. (D) EM density around α-helices 4 and 6. A and C, Green spheres indicate bound Ca2+ ions identified in nhTMEM16. C and D, The relationship between different views is indicated.
Figure 4 with 1 supplement
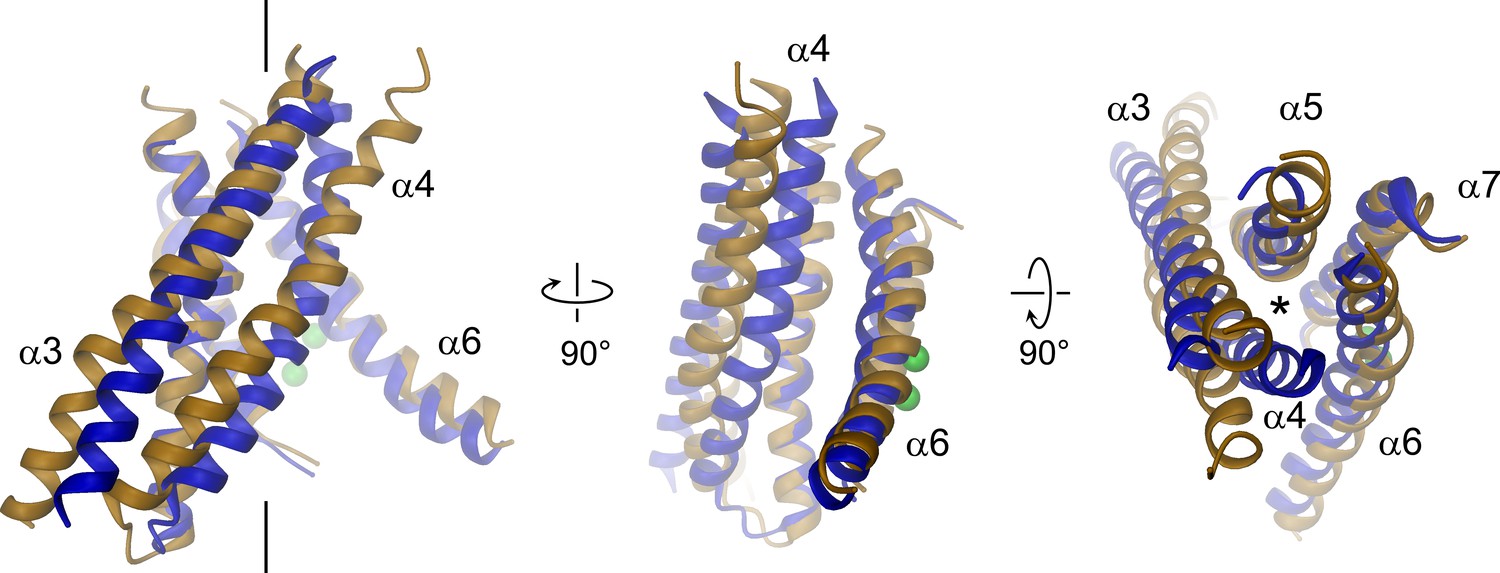
Structural relationships between TMEM16 channels and scramblases.
Superposition of pore lining helices of mTMEM16A (blue) and nhTMEM16 (beige). Ca2+ ions bound to nhTMEM16 are displayed as spheres (green). Views are as in Figure 3. The location of the ion conduction pore is marked by a black line (left panel) or an asterisk (right panel).
Figure 4—figure supplement 1
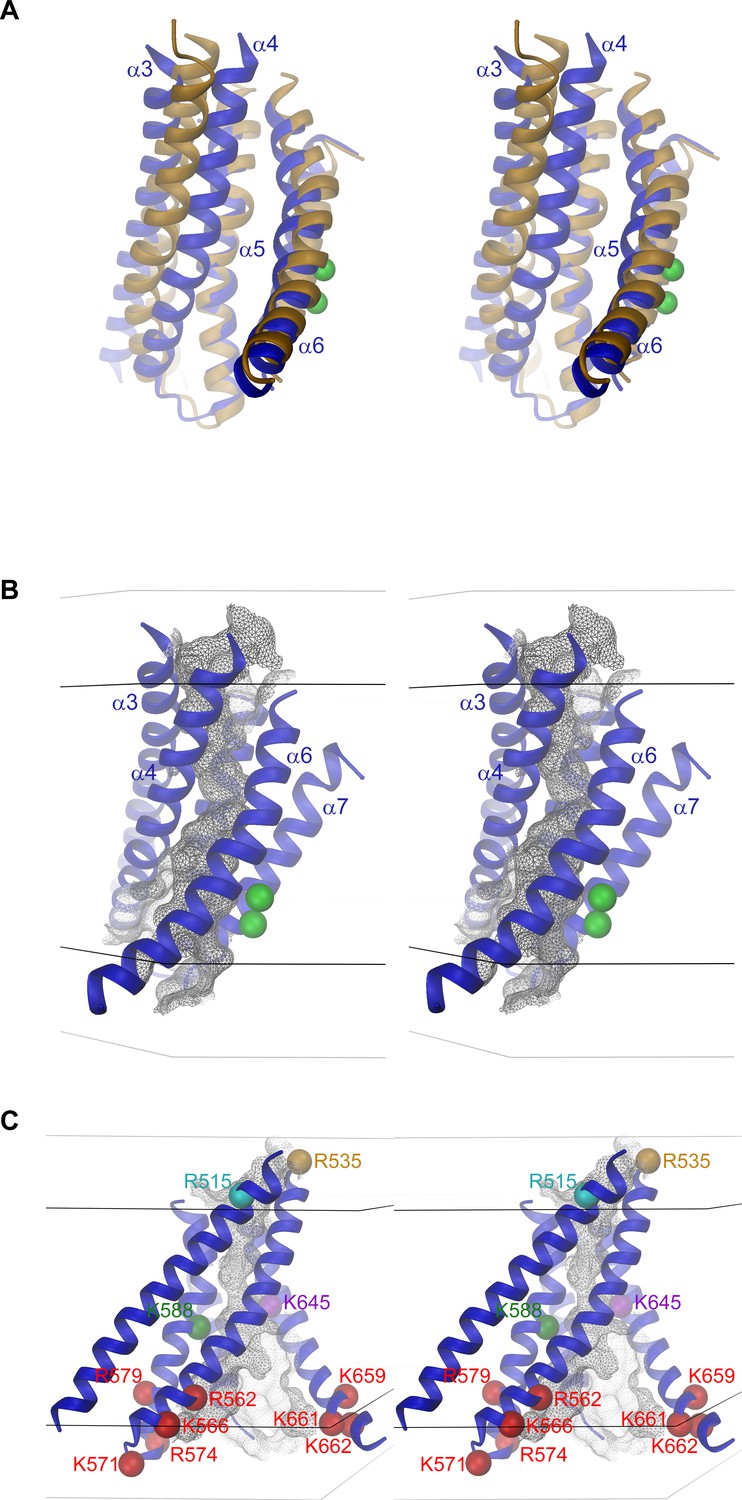
Pore geometry.
(A) Stereo view of a superposition of the pore regions of the ion channel mTMEM16A (blue) and the lipid scramblase nhTMEM16 (beige). The perspective is as in Figure 4 (center). (B) Stereo view of the pore region of mTMEM16A. (C) Stereo view defining positions of basic residues within the pore. Cα positions of selected residues mutated in this study are indicated as spheres and labeled. The perspective is as in Figure 4 (left). B and C, The molecular surface of the pore is shown as grey mesh. Black and grey lines indicate the boundaries of the hydrophobic and polar parts of the membrane, respectively. A and B, Green spheres indicate bound Ca2+ ions identified in nhTMEM16.
Figure 5 with 3 supplements
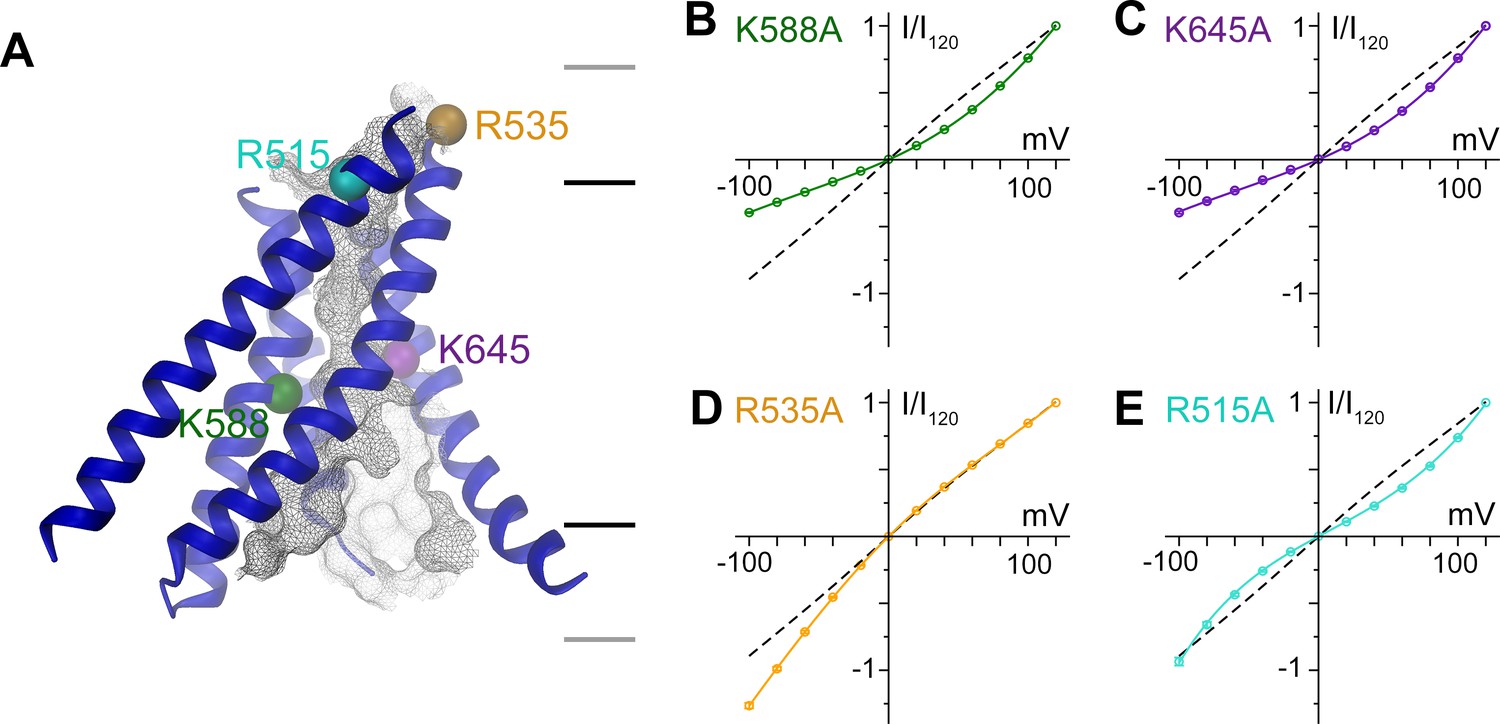
Functional properties of mutants of pore lining residues.
(A) Structure of the pore region of mTMEM16A viewed from within the membrane as shown in the left panel of Figure 3. The molecular surface of the ion conduction pore is shown as grey mesh, transmembrane α-helices of the pore region as ribbon, the Cα positions of mutated residues as spheres. Black and grey lines indicate the boundaries of the hydrophobic and polar regions of the bilayer, respectively. I-V relationships of pore mutants (B) K588A, (C) K645A, (D) R535A and (E) R515A. Currents were recorded from inside-out patches at 1 mM Ca2+ and symmetric Cl- concentrations. Rundown-corrected data were normalized to the response at 120 mV and show mean and s.e.m. of 8–15 independent recordings. Solid lines show fits to a barrier model. The I-V relationship of WT is shown as dashed line for comparison.
Figure 5—figure supplement 1
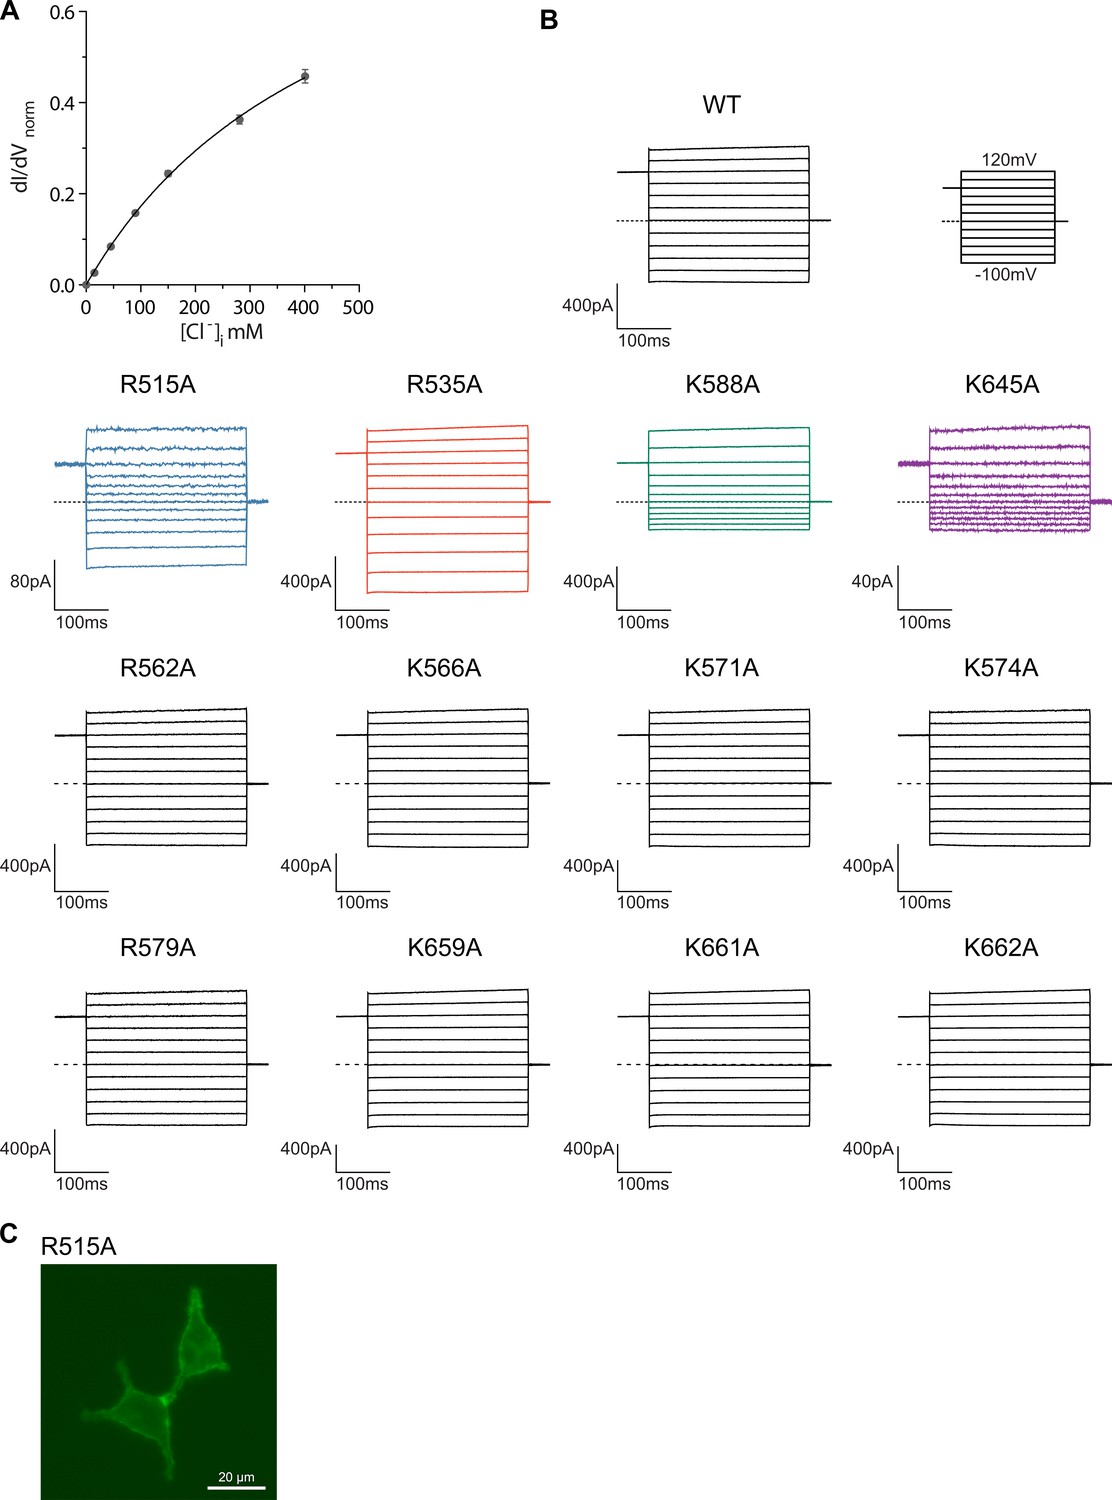
Electrophysiology.
(A) Concentration-conductance relationship of mTMEM16A currents. Slope conductance was measured from inside-out patches excised from HEK293T cells expressing mTMEM16A at −100 mV, 1 mM Ca2+ and different intracellular Cl- concentrations. Data show mean of 8 independent experiments, errors are s.e.m. (B) Averaged traces of the rundown-corrected and normalized independent datasets of WT and pore mutants used for the characterization of I-V relationships. Data were recorded from inside-out patches excised from HEK293T cells expressing mTMEM16A at 1 mM Ca2+ and symmetric Cl- concentrations. Currents were corrected for the irreversible rundown of the channel. Top right panel shows the voltage protocol. Scale bars represent the mean amplitude of averaged datasets. (C) Fluorescence of HEK293T cells transfected with a YFP fusion construct of the mutant R515A.
Figure 5—figure supplement 2
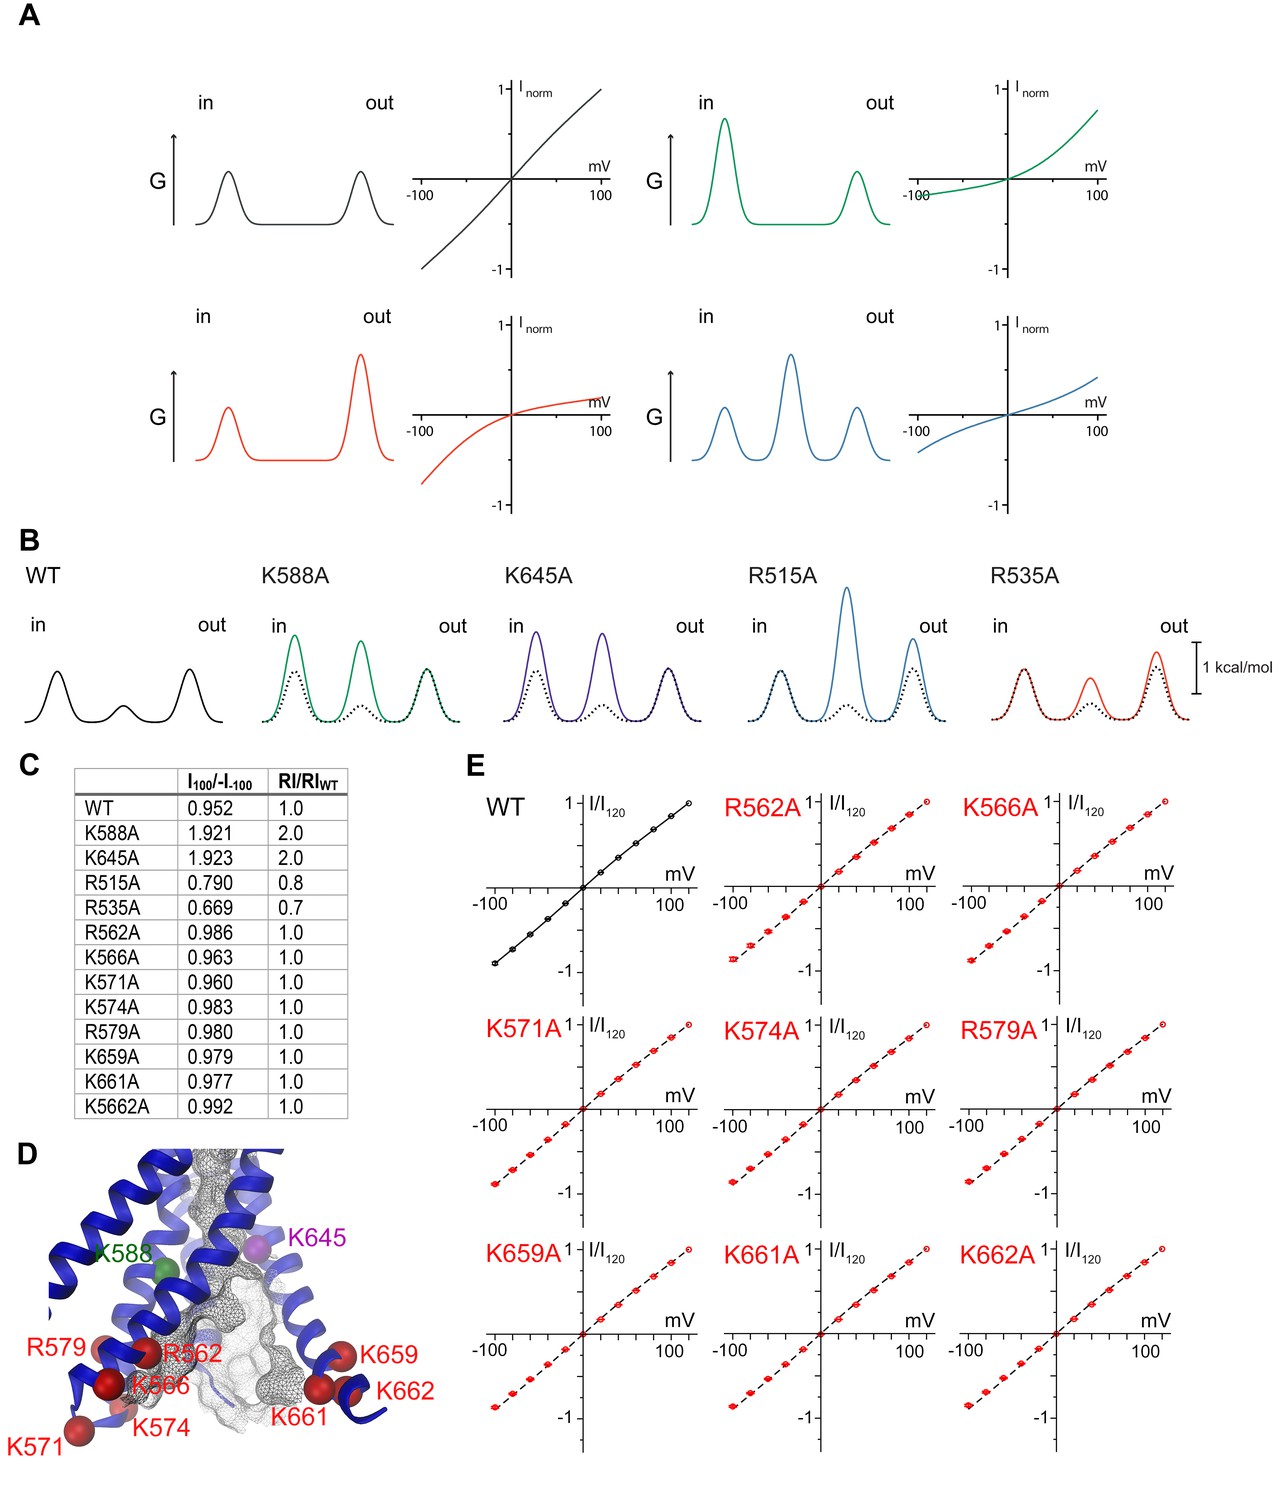
Permeation model and properties of pore mutants.
(A) Rectification in a barrier model of ion conduction. Panels show idealized energy profiles on the permeation path containing up to three energy barriers (left) and the consequence on I-V relationships (right). Top, left, two barriers of same height results in a linear I-V relationship. Top, right, the increase of the intracellular barrier results in outward rectification of the current. Bottom, left, the increase of the extracellular barrier results in inward rectification of the current. Bottom, right, the increase of a central barrier results in rectification in both directions. (B) Energy profile for ion permeation across mTMEM16A derived from the fits of the I-V relationships shown in Figure 5B–E. (C) Table of the rectification index (RI) of WT and pore mutants calculated as the ratio of the currents measured at 100 and −100 mV. (D) Close-up of the intracellular vestibule of mTMEM16A. The view is as shown in Extended Data Figure 6C. The locations of residues mutated in this study are indicated by spheres. (E) I-V relationships of mutants in the intracellular vestibule. Currents were recorded as in Figure 5 from inside-out patches at 1 mM Ca2+ and symmetric Cl- concentrations. Data were normalized to the response at 120 mV and show mean and s.e.m. of 8 independent recordings. For WT, solid line shows a fit of the data to a barrier model. For mutants, I-V relationship of WT is shown as dashed line for comparison.
Figure 5—figure supplement 3
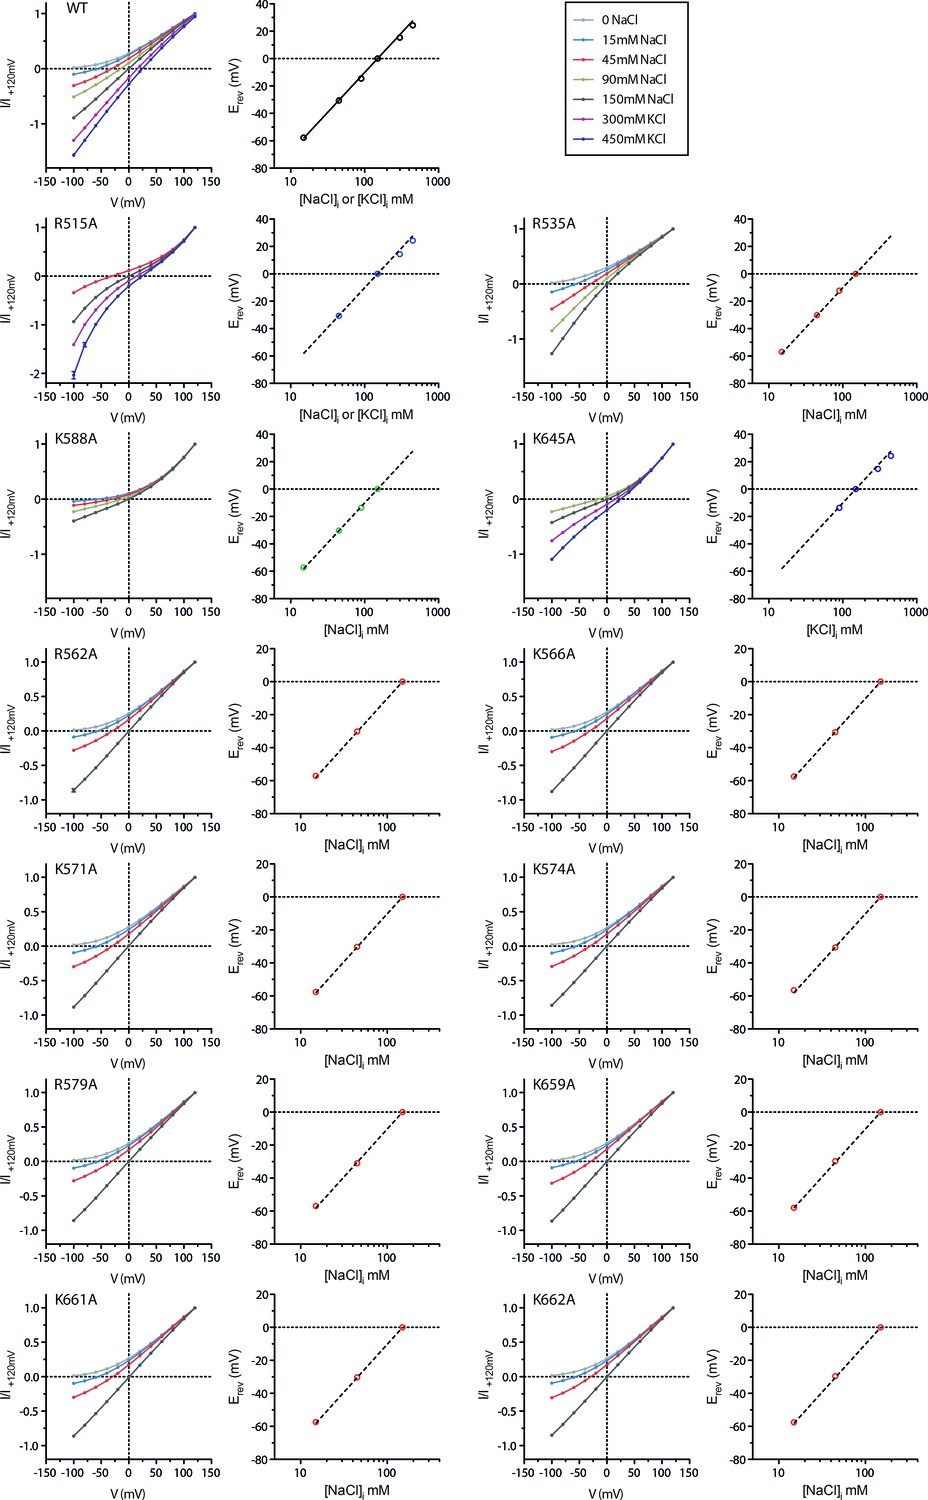
Ion selectivity of pore mutants.
Na+ vs. Cl- selectivity of WT mTMEM16A and pore mutants. For each construct, left panels show I-V plots of the instantaneous current in response to the indicated voltage steps at 150 mM extracellular and the indicated intracellular NaCl concentrations at 1 mM Ca2+. Right panels show the relation between the intracellular NaCl concentration and the reversal potential (Erev). The line indicates the Nernst potential of Cl−. A,B, Data are mean values of normalized I-V plots from 5 to 12 individual patches, errors are s.e.m.
Figure 6
Mechanistic relationships within TMEM16 family.
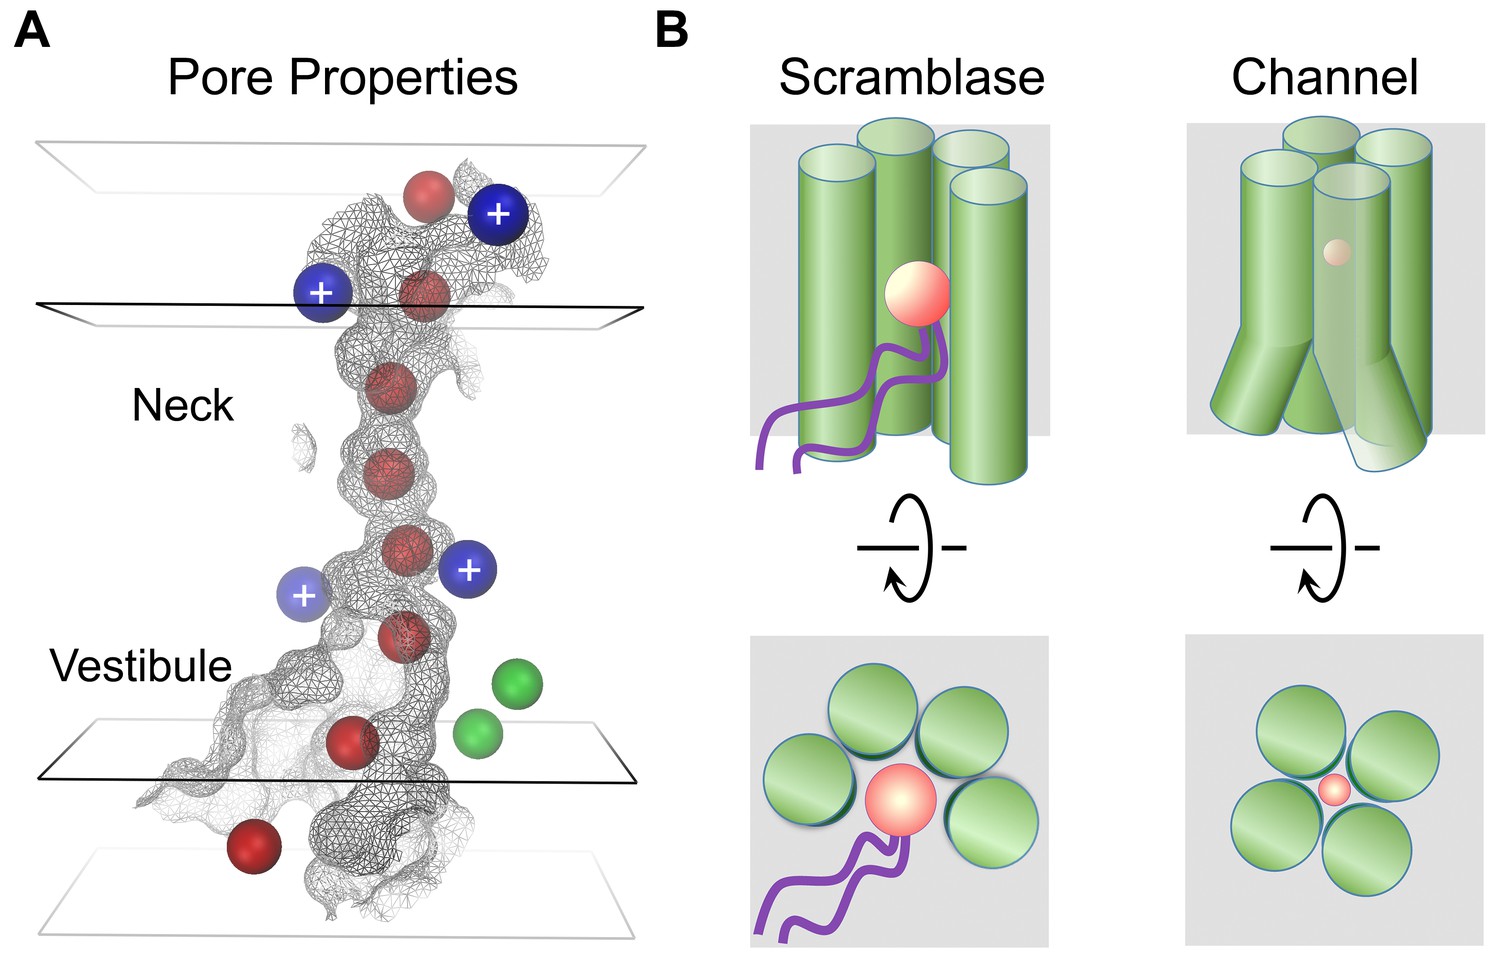
(A) Depiction of the mTMEM16A pore. The molecular surface of the pore region is shown as grey mesh. The boundaries of hydrophobic (black) and polar regions (grey) of the membrane are indicated by rectangular planes. The positions of positively charged residues affecting ion conduction are depicted as blue and bound Ca2+ ions as green spheres. Hypothetical Cl− ions (radius 1.8 Å) placed along the pore are displayed as red spheres. (B) Schematic depiction of features distinguishing lipid scramblases (left) from ion channels (right) in the TMEM16 family. The view is from within the membrane (top panels) and from the outside (bottom panels). The helices constituting the membrane accessible polar cavity in scramblases have changed their location in channels to form a protein-enclosed conduit. A and B, Permeating ions and lipid headgroups are indicated in red.
Scheme 1
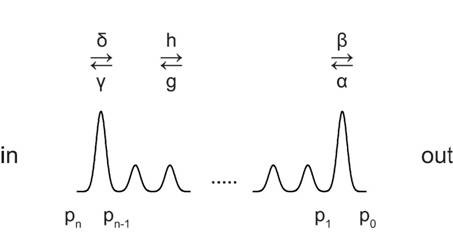
Depiction of the free energy profile of ions permeating the pore of an ion channel.
https://doi.org/10.7554/eLife.26232.023
Appendix 1—figure 1
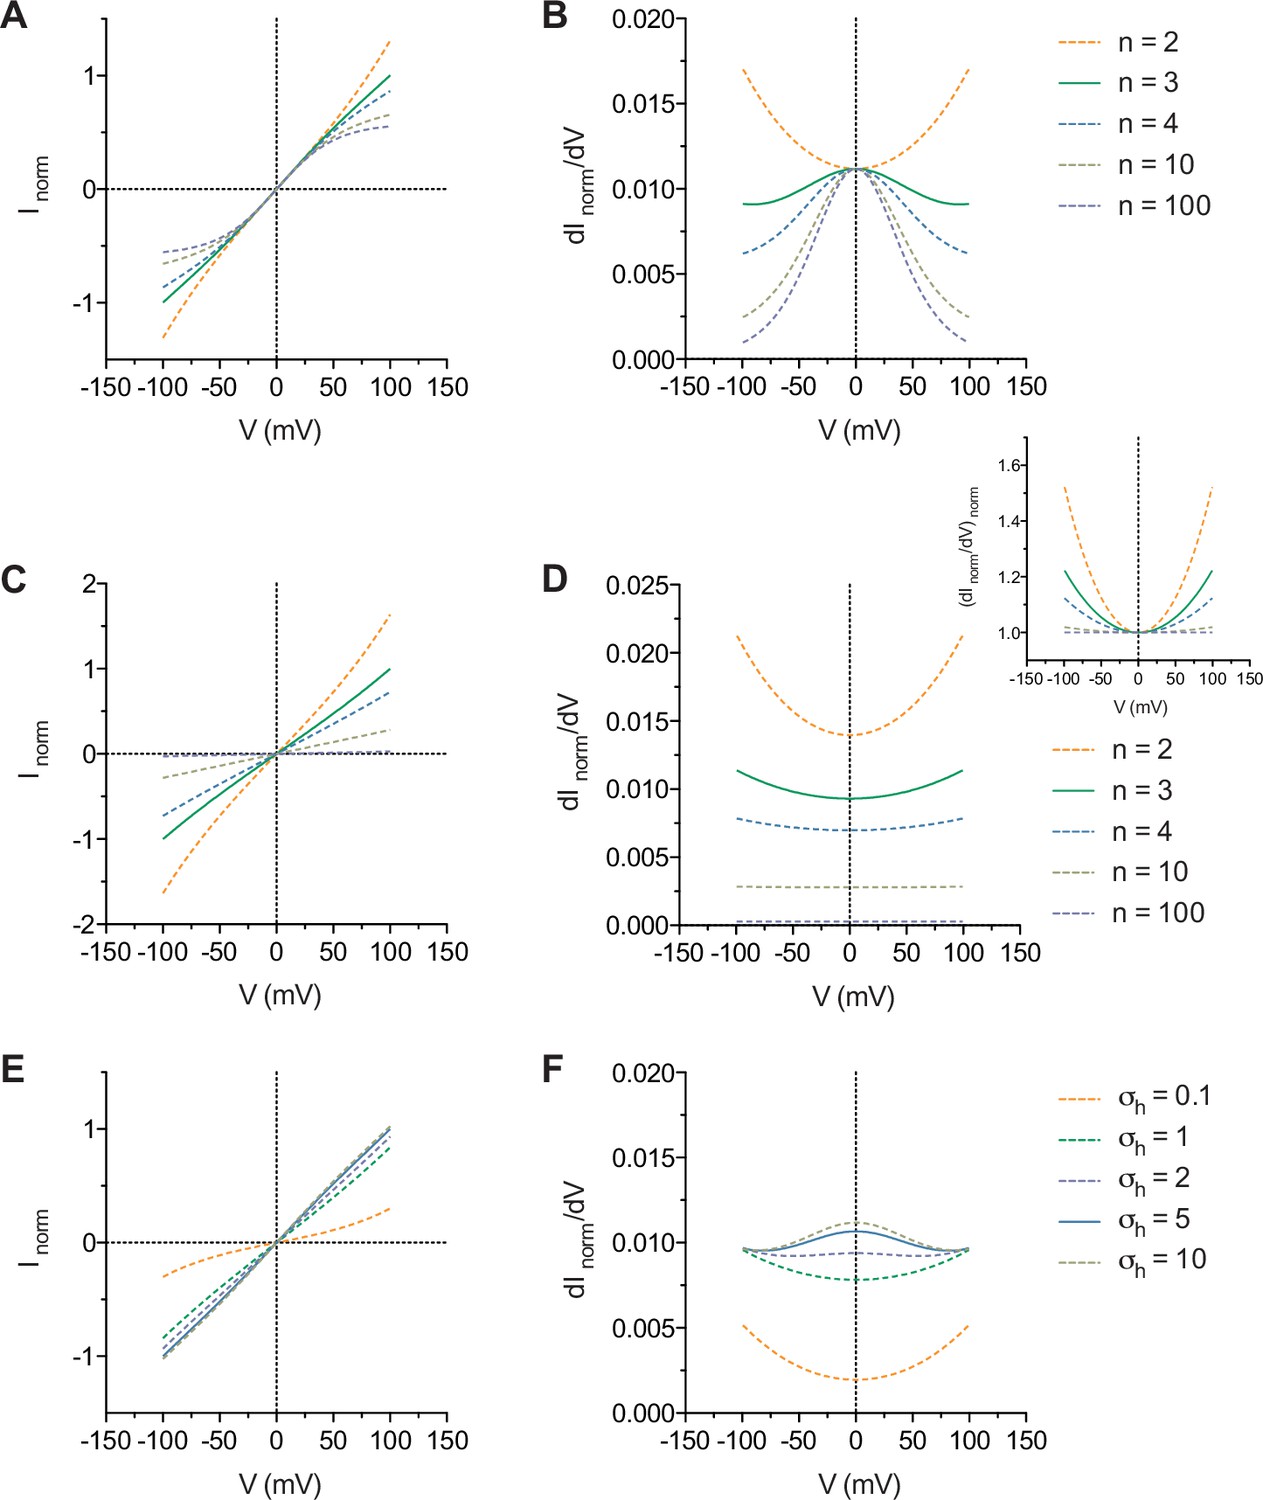
General features of the model.
(A) I-V and (B) conductance-V curves calculated with σβ = 1 with the term omitted and the indicated values of n. (C) I-V and (D) conductance-V curves calculated with σβ = σh = 1 and the indicated values of n. Inset, as in D but normalized to the minima of the curves. (E) I-V and (F) conductance-V curves calculated with n = 3, σβ = 1 and the indicated values of σh. The curves are relative to the curve where n = 3 (A, B, C and D) and σh = 5 (E and F).
Appendix 1—figure 2
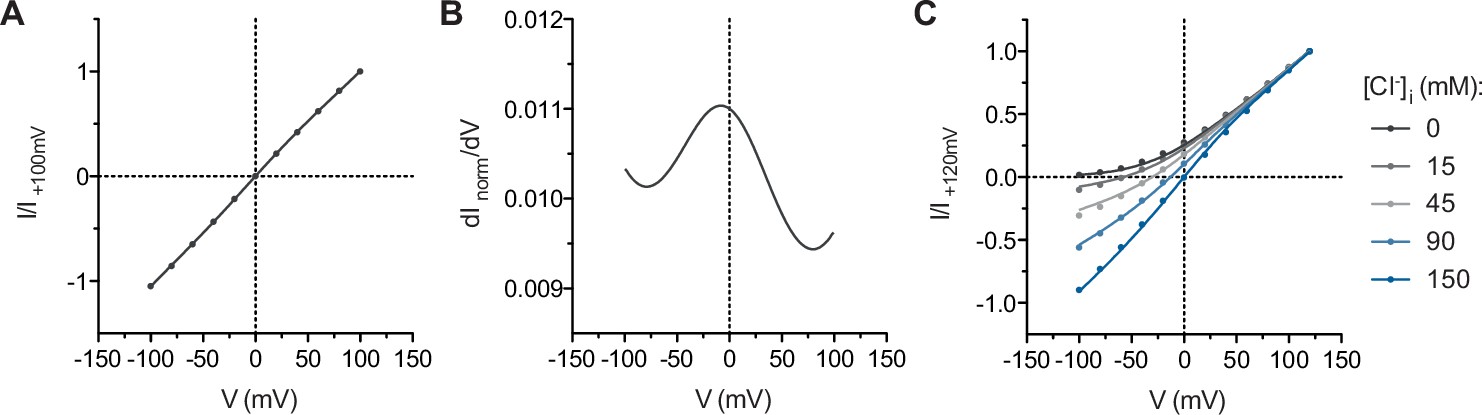
Parameter estimation.
(A) I-V relation of WT mTMEM16A at symmetrical 150 mM Cl-. The curve is a fit to the model with the term omitted. n = 2.79 (2.60 to 2.98), σβ = 1.06 (1.03 to 1.09). (B) Conductance-V relation of WT mTMEM16A calculated from the interpolated I-V curve shown in A. (C) Family of I-V curves of WT mTMEM16A at 150 mM extracellular Cl− and the indicated intracellular concentrations of Cl-. The curves are a global fit to the model with the term omitted. n = 3.14 (3.09 to 3.20), σβ = 1.08 (1.07 to 1.09). Data in this figure are as in Figure 5—figure supplement 3. The values in parentheses indicate the 95% confidence interval of the parameter estimate.
Author response image 1
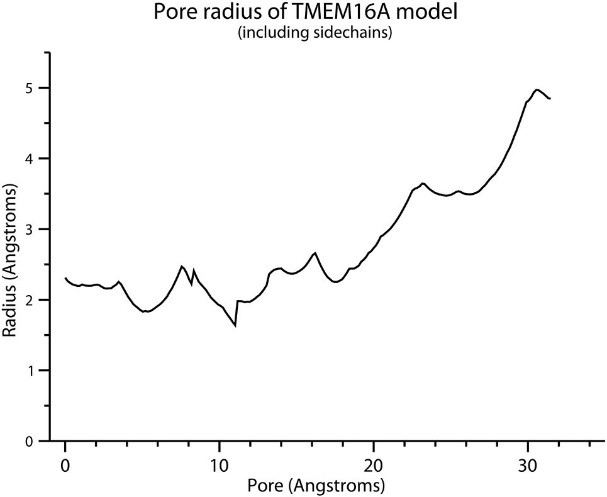
Analysis of the pore radios along the channel axis as calculated by the program HOLE from a model of the channel containing side-chains.
https://doi.org/10.7554/eLife.26232.026Videos
Video 1
The mTMEM16A structure.
Ribbon representation of the mTMEM16A model with the EM density and the nhTMEM16 structure superimposed. The structures are seen from within the membrane. Ribbons are colored as in Figure 1 and the positions of bound Ca2+ in nhTMEM16 are indicated by green spheres.
Video 2
Pore region of mTMEM16A.
Transmembrane α-helices 3–8 constituting the ion conduction pore and the Ca2+ binding site of one mTMEM16A subunit (blue). EM density is superimposed. Green spheres correspond to the positions of bound Ca2+ in nhTMEM16. The views are as in Figure 3.
Video 3
Comparison of pore regions.
Superposition of transmembrane α-helices 3–7 of one subunit of mTMEM16A (blue) and nhTMEM16 (beige). Helices line the ion conduction pore in the channel and the lipid pathway in the scramblase, respectively. Green spheres correspond to the positions of bound Ca2+ in nhTMEM16. The views are as in Figure 4.
Video 4
Helix arrangements in the TMEM16 family.
Morph (cyan, middle panel) between transmembrane α-helices 3–7 of one subunit of mTMEM16A (blue, left panel) and nhTMEM16 (beige, right panel). The morph between both structures emphasizes the different arrangement of helices in a lipid scramblase and an ion channel of the TMEM16 family and does not reflect conformational changes in TMEM16A. Helices line the ion conduction pore in the channel and the lipid pathway in the scramblase, respectively. Green spheres correspond to the positions of bound Ca2+ in nhTMEM16. The view is similar as in Figure 4.
Tables
Table 1
Statistics of cryo-EM data collection, 3D reconstruction and model building.
| Data collection | |
|---|---|
| Microscope | FEI Titan Krios |
| Voltage (kV) | 300 |
| Camera | Gatan K2-summit |
| Camera mode | super-resolution |
| Energy filter | post-column Gatan GIF quantum energy filter (20 eV slit) |
| Defocus range (µm) | −0.5 to −3.8 |
| Pixel size (Å) | 0.675 (in super-resolution) 1.35 (for reconstruction) |
| Objective aperture (µm) | 100 |
| Exposure time (s) | 15 |
| Number of frames | 50 or 100 |
| Dose rate on specimen level (e-/Å2) | 0.8 or 1.5 per frame ~80 in total |
| Reconstruction | |
| Software | RELION1.4 and RELION2.0 |
| Symmetry | C2 |
| Final number of refined particles | 213,243 |
| Resolution of polished unmasked map (Å) | 7.85 Å |
| Resolution of polished masked map (Å) | 6.65 Å |
| Map sharpening B-factor (Å2) | −351 (−700 for model building) |
| Model Statistics | |
| Number of residues modeled | 434 |
| Software | Chimera, Coot, Phenix |
| Map CC (whole unit cell) | 0.552 |
| Map CC (around assigned model) | 0.857 |
Download links
A two-part list of links to download the article, or parts of the article, in various formats.
Downloads (link to download the article as PDF)
Open citations (links to open the citations from this article in various online reference manager services)
Cite this article (links to download the citations from this article in formats compatible with various reference manager tools)
Structural basis for anion conduction in the calcium-activated chloride channel TMEM16A
eLife 6:e26232.
https://doi.org/10.7554/eLife.26232


