Model for a novel membrane envelope in a filamentous hyperthermophilic virus
- University of Virginia, United States
- University of Washington, United States
- Institut Pasteur, France
- NIOZ Royal Netherlands Institute for Sea Research, Netherlands
- Utrecht University, Netherlands
Figures
Figure 1
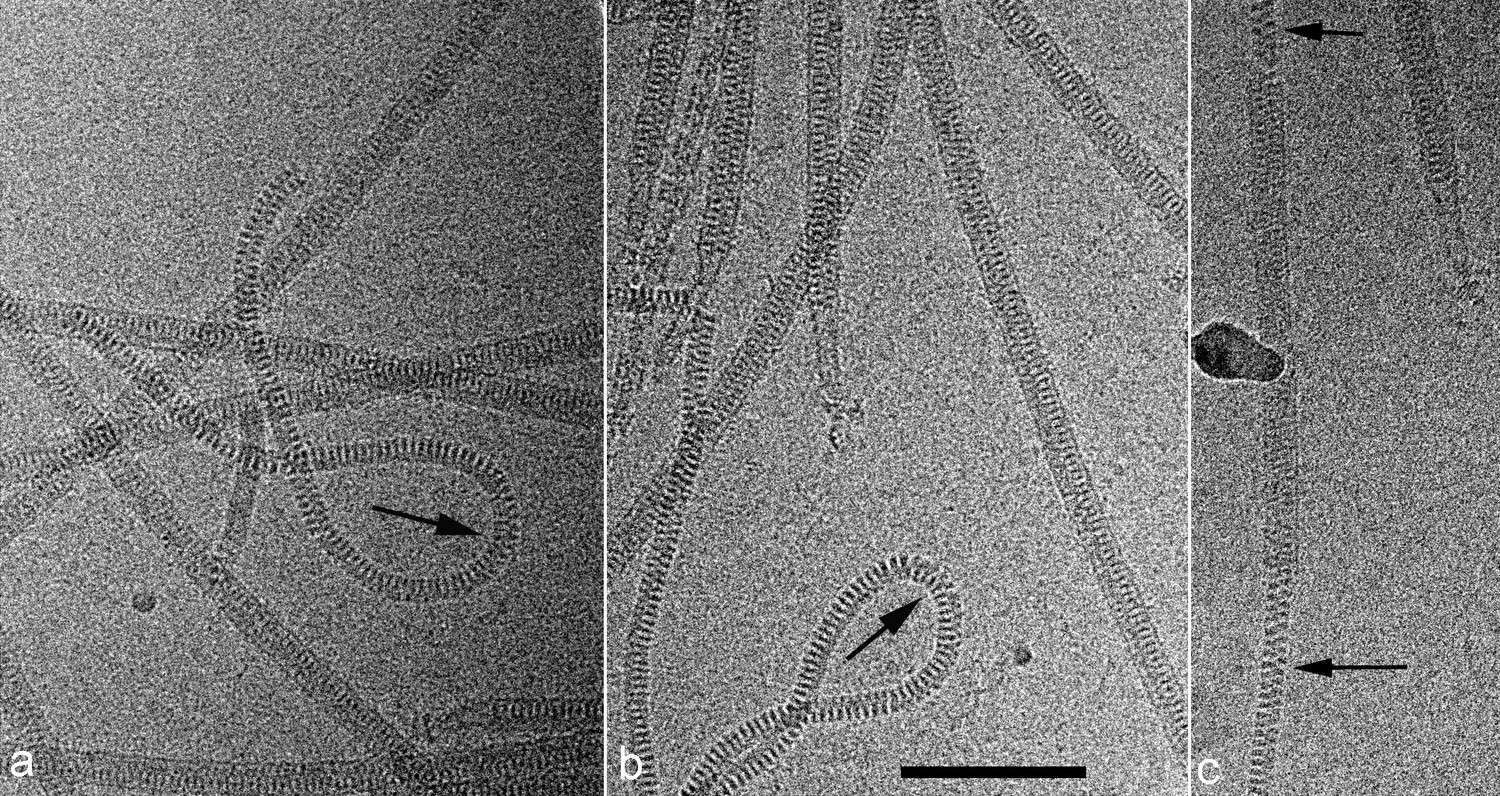
Cryo-EMs of AFV1.
Arrows point to regions where the virions have been demembranated. This leads to a narrower diameter of the virions and a greatly increased flexibility, as seen by the loops in a,b. The loss of the membrane does not necessarily occur over the whole virion, as can be seen in c where a membrane-enveloped region in the center is bracketed by two regions with no membrane. The scale bar (b) is 1,000 Å.
Figure 2
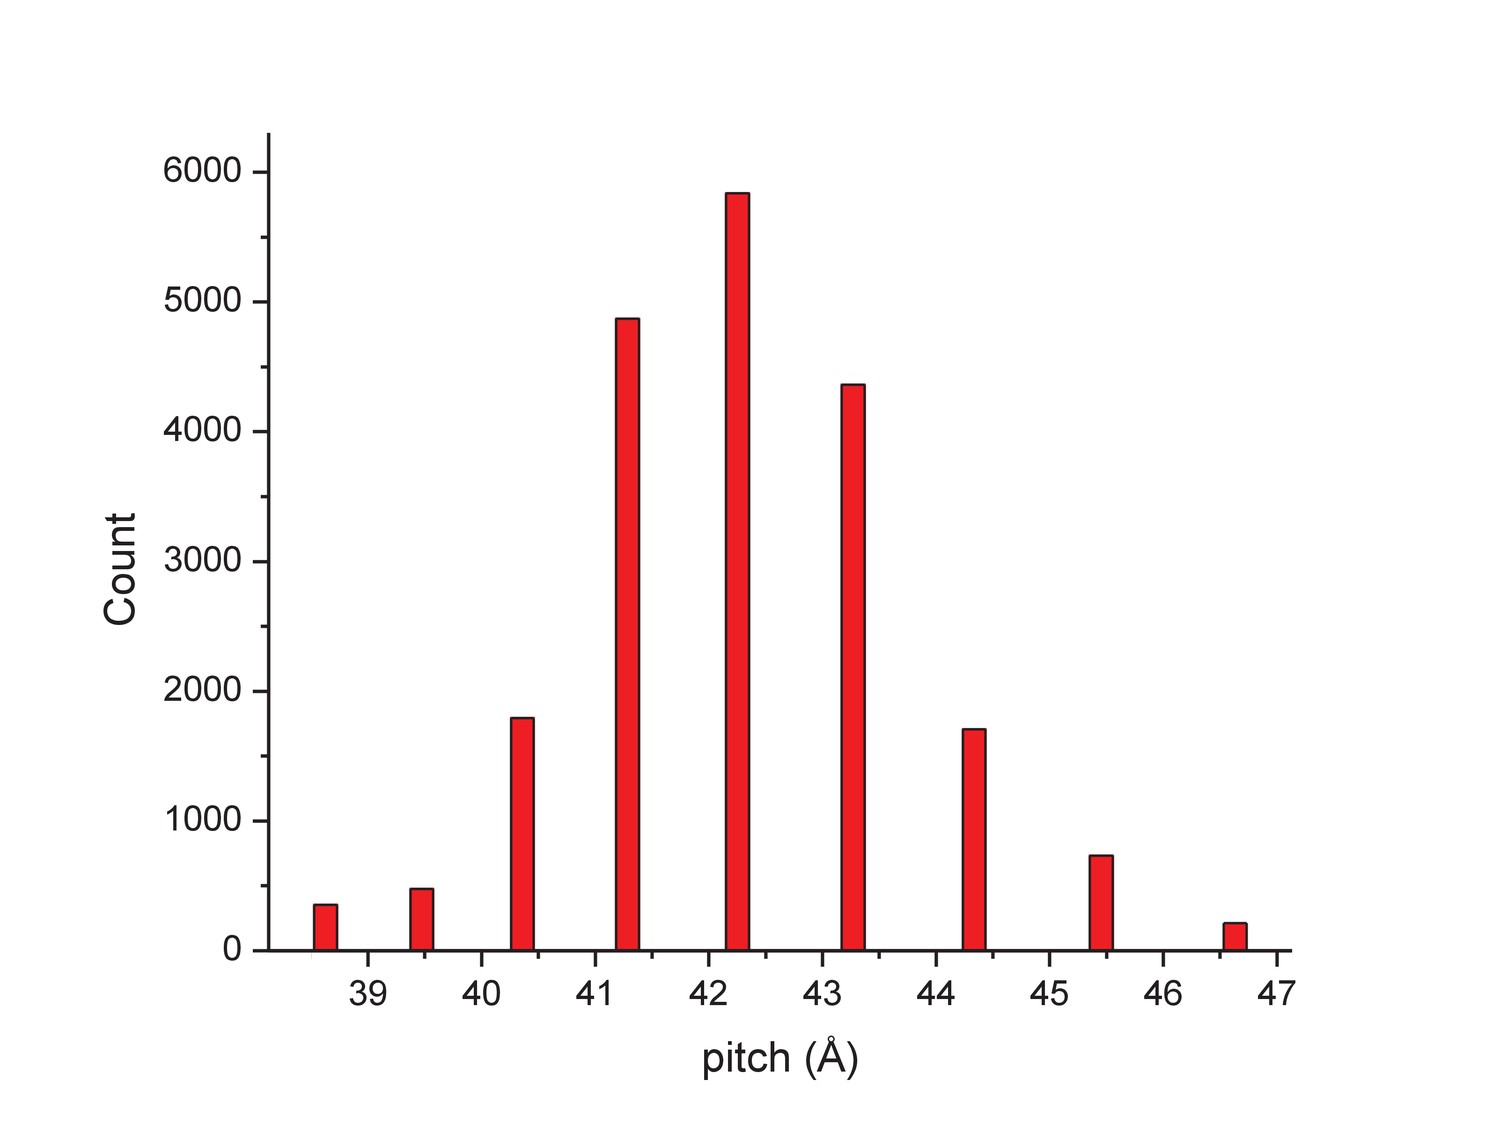
The distribution of segments sorted against references containing 1-start helices with different pitch values.
The validity of this sorting was confirmed by taking power spectra from different bins, which behaved as expected and showed the helical pitch of the corresponding reference. The reconstruction was generated using segments from the central three bins.
Figure 3

Three-dimensional reconstruction of AFV1.
(a) A slice perpendicular to the filament axis. The red arrows define a distance of 20 Å, the approximate thickness of the membrane enveloping the virions. The membrane has a denser outer component and a less dense inner part, separated by a region of lower density. (b) A view of the protein core, looking from the membrane. The asymmetric unit in the virus is a pseudo-symmetric heterodimer of MCP1 (red) and MCP2 (yellow). (c) A view looking down the filament axis (perpendicular to that in b) with the model for the DNA phosphodiester backbone underneath the protein in blue. The helix-turn helix motif of each subunit faces into the narrow lumen. The resolution is good enough in this region that some bulky amino acids can be unambiguously located, and three Tyr21 residues are labeled. (d) The heterodimer in AFV1 has a pseudo-2-fold symmetry, in contrast to the homodimer in SIRV2 (e) which has strict 2-fold symmetry. In both, A-form DNA is bound within the central cleft. The N- and C-terminal ends in both (d) and (e) are labeled Nt and Ct, respectively.
Figure 4
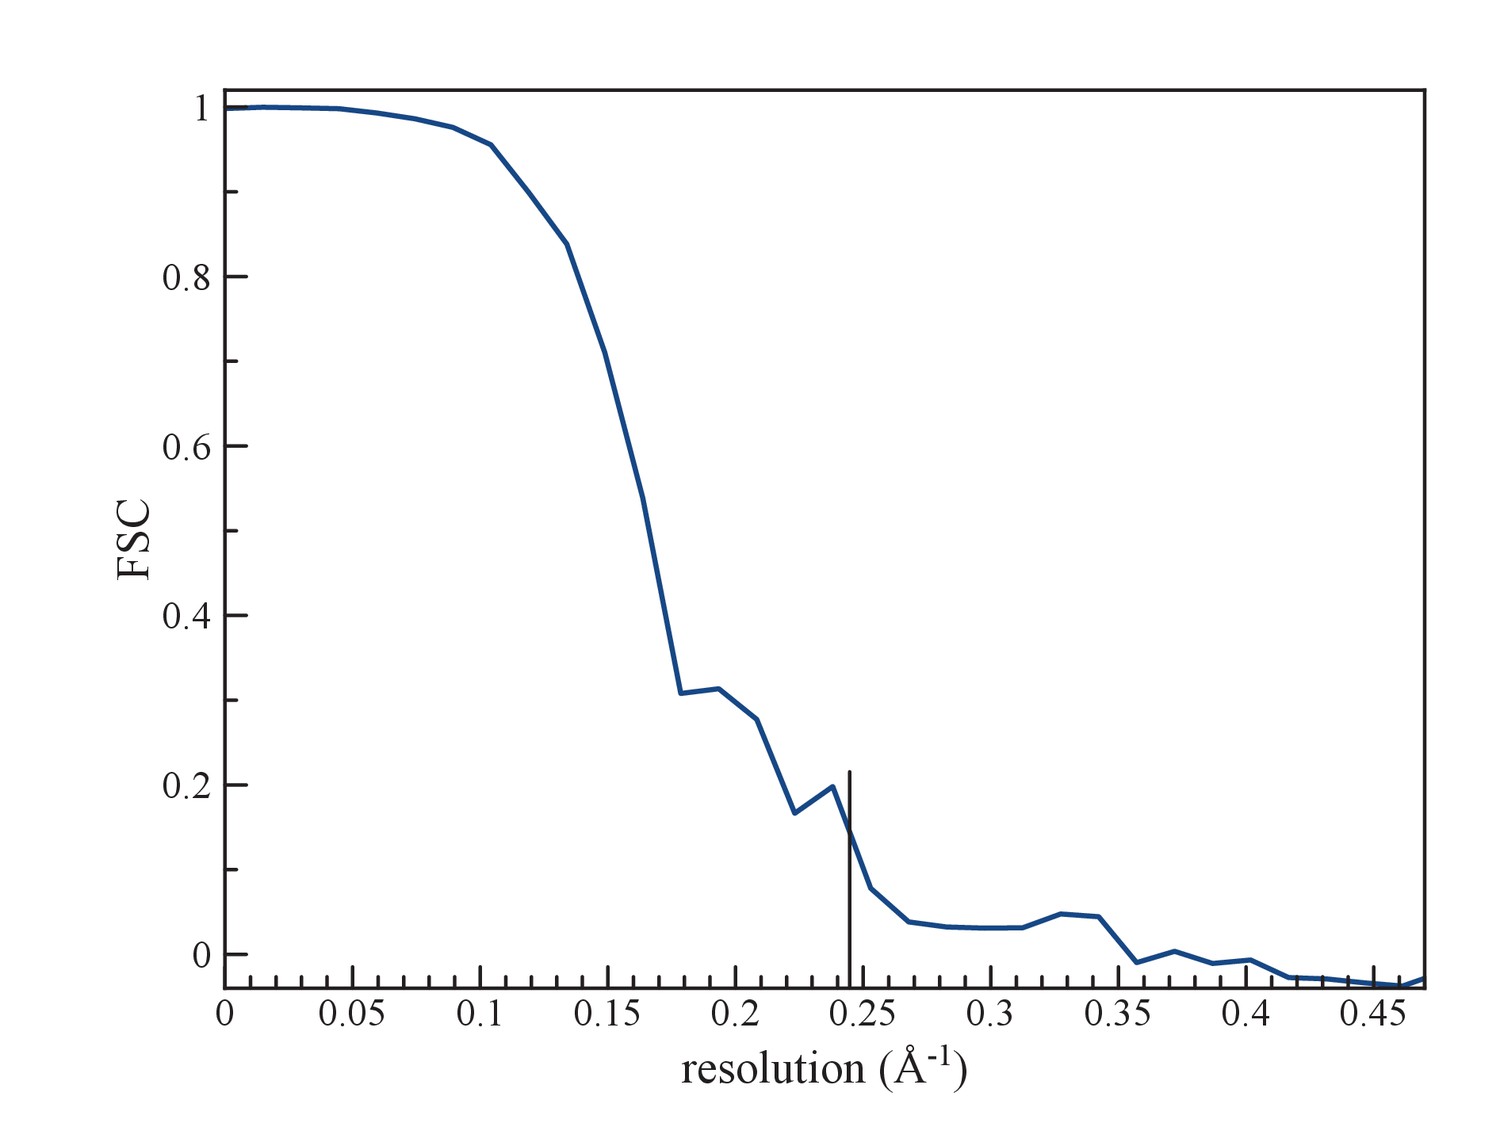
(a) An FSC curve between two reconstructions from completely independent sets of segments (having no overlap), each started independently from a full reconstruction filtered to 7 Å resolution.
The FSC falls to 0.143 at 1/ (4.1 Å).
Figure 5
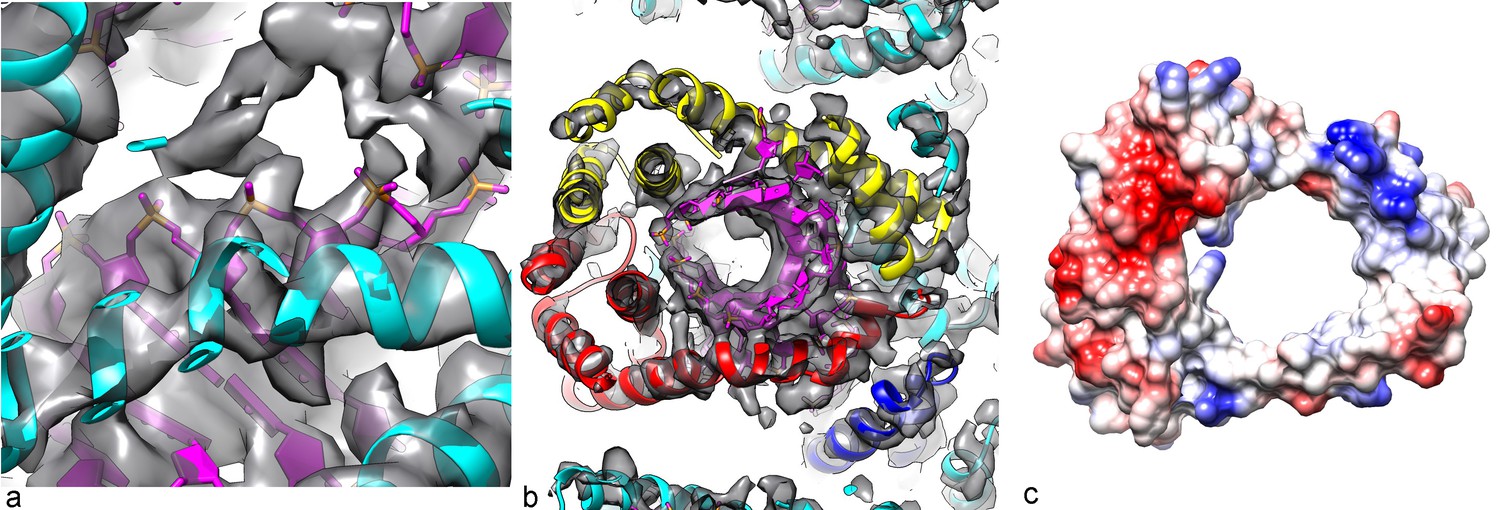
Packing of the DNA in the virion.
(a) The phosphate backbone of the DNA model can be fit nicely into the density map, as most of the phosphate groups are well resolved. (b) A slice perpendicular to the DNA axis through the map and model. As expected for A-form DNA (and in contrast to B-form), a hole is seen along the DNA axis, with the bases surrounding this cavity. (c) The Coulombic potential for the AFV1 capsid heterodimer shows significant positive regions (blue) surrounding the DNA, with negative regions (red) away from the DNA.
Figure 6
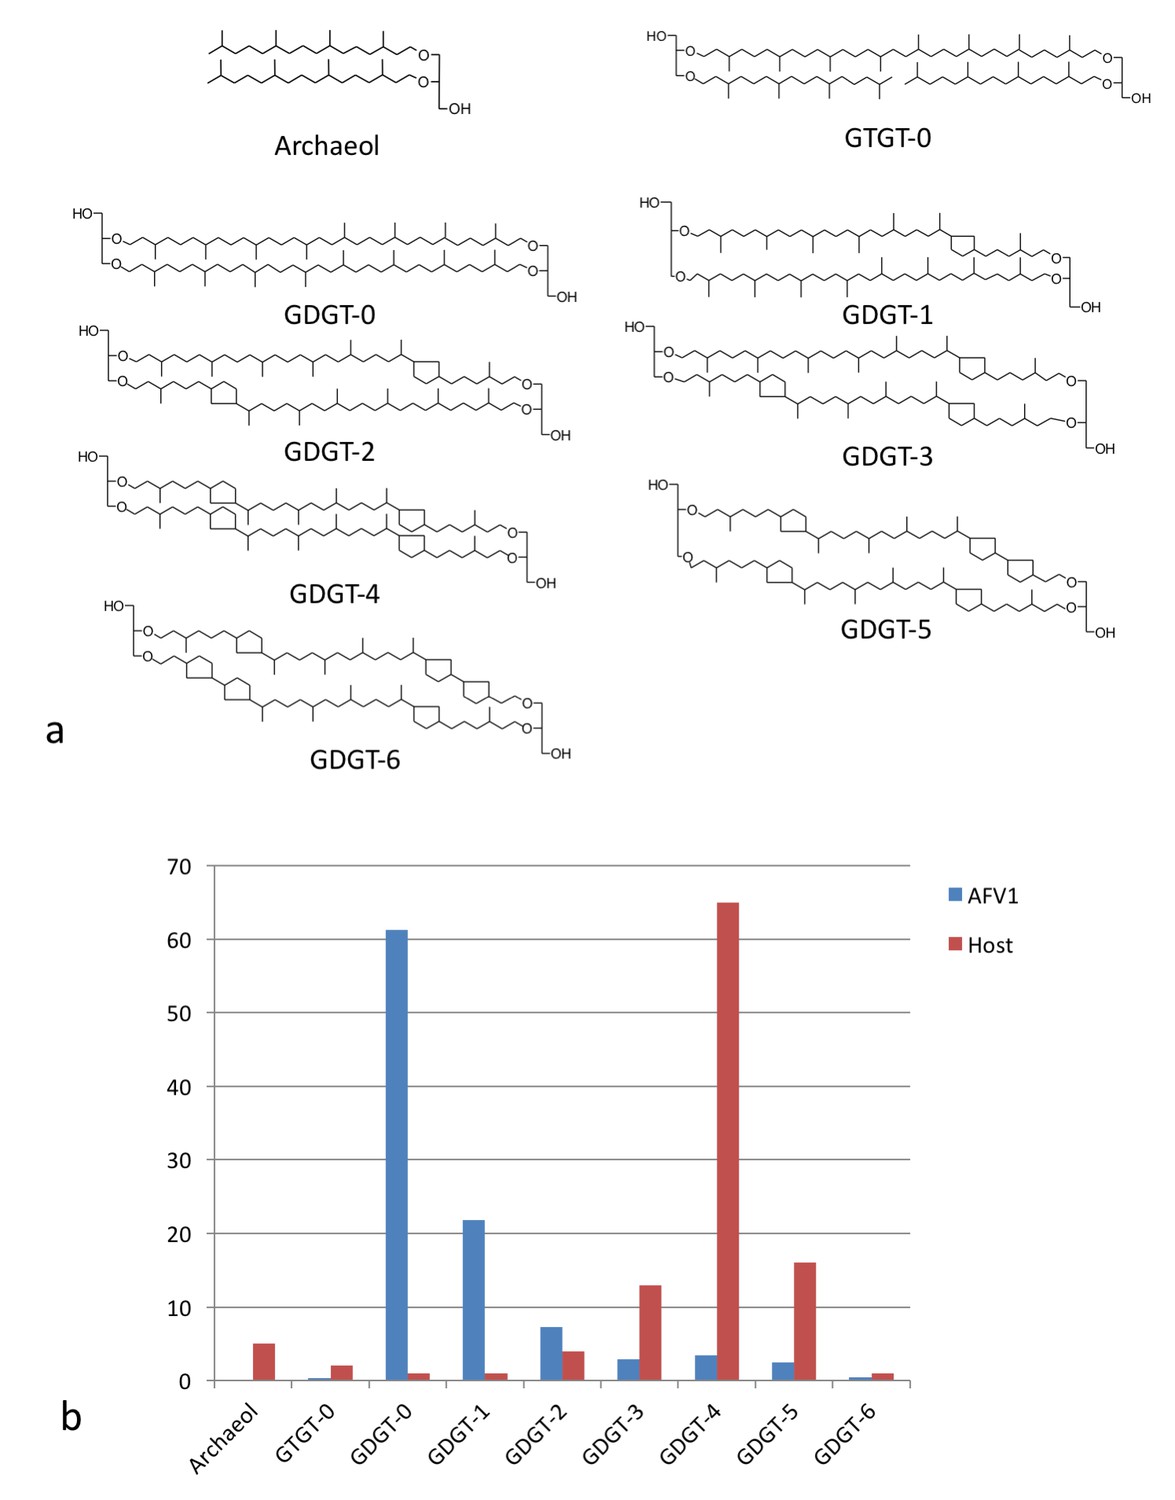
Lipid distribution of virions different from host cells.
(a) Chemical diagrams for the lipids found in Acidianus hospitalis and AFV1. (b) The distribution of lipids in the host membrane (red) differs significantly from the distribution found for AFV1 (blue). The scale is in percentage.
Figure 7 with 2 supplements
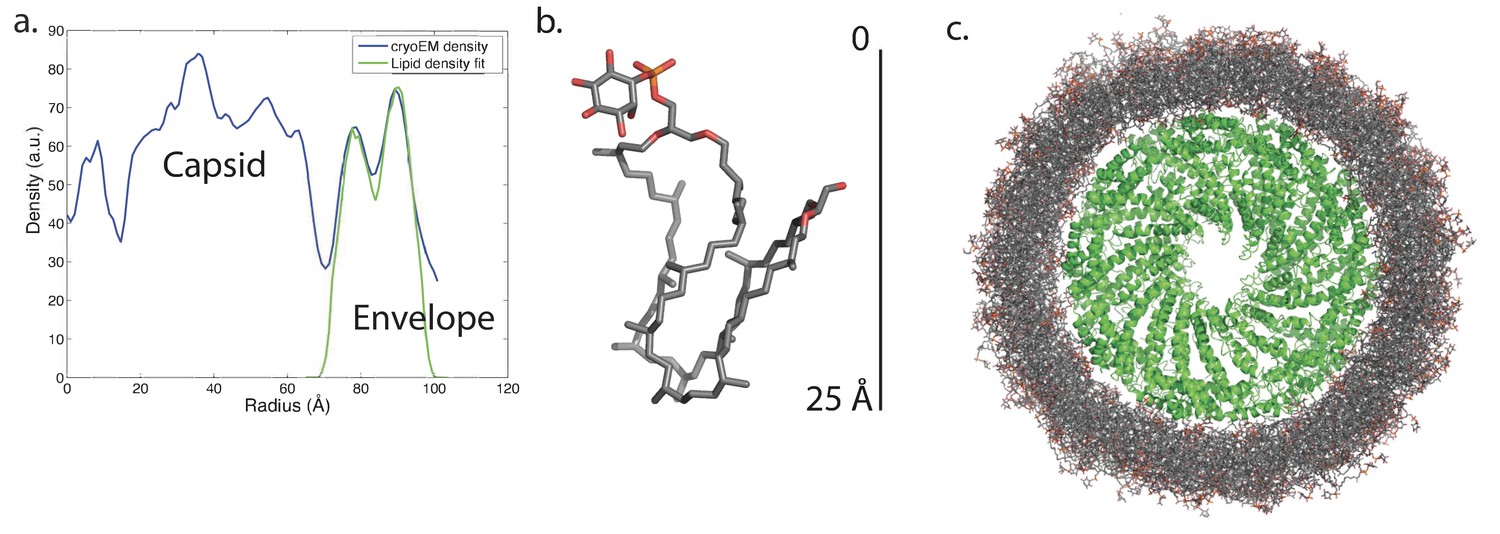
Modeling the viral membrane.
(a) The cylindrically averaged density profile from EM (blue curve) is well fit by a cylindrical envelope (green curve) of phosphoinositol-GDGT0 lipids in horseshoe conformations (b) with 60% having headgroups facing away from the capsid and 40% having headgroups facing towards the capsid. Molecular dynamics simulations of the protein capsid and phosphoinositol-GDGT0 lipids constructed in this arrangement produced a stable envelope rich in horseshoe-conformation lipids (c), while all other envelope arrangements tested failed to maintain the experimentally-derived thickness of 20–25 Å. The density peak at ~30 Å radius (a) arises from the DNA. The central cryo-EM density (radius <15 Å) could not be explained by the capsid proteins, and most likely involves either a minor viral protein or a host protein (Figure 7—figure supplement 1). Since the symmetry of the virion was imposed on this density, which likely does not have such a symmetry, the density was uninterpretable and removed from the other figures. Reconstructed density profiles from the simulations are shown in Figure 7—figure supplement 2, accompanied by movies of 20 envelope lipids in Video 1 and of the entire envelope and interfacial water layers in Video 2.
Figure 7—figure supplement 1
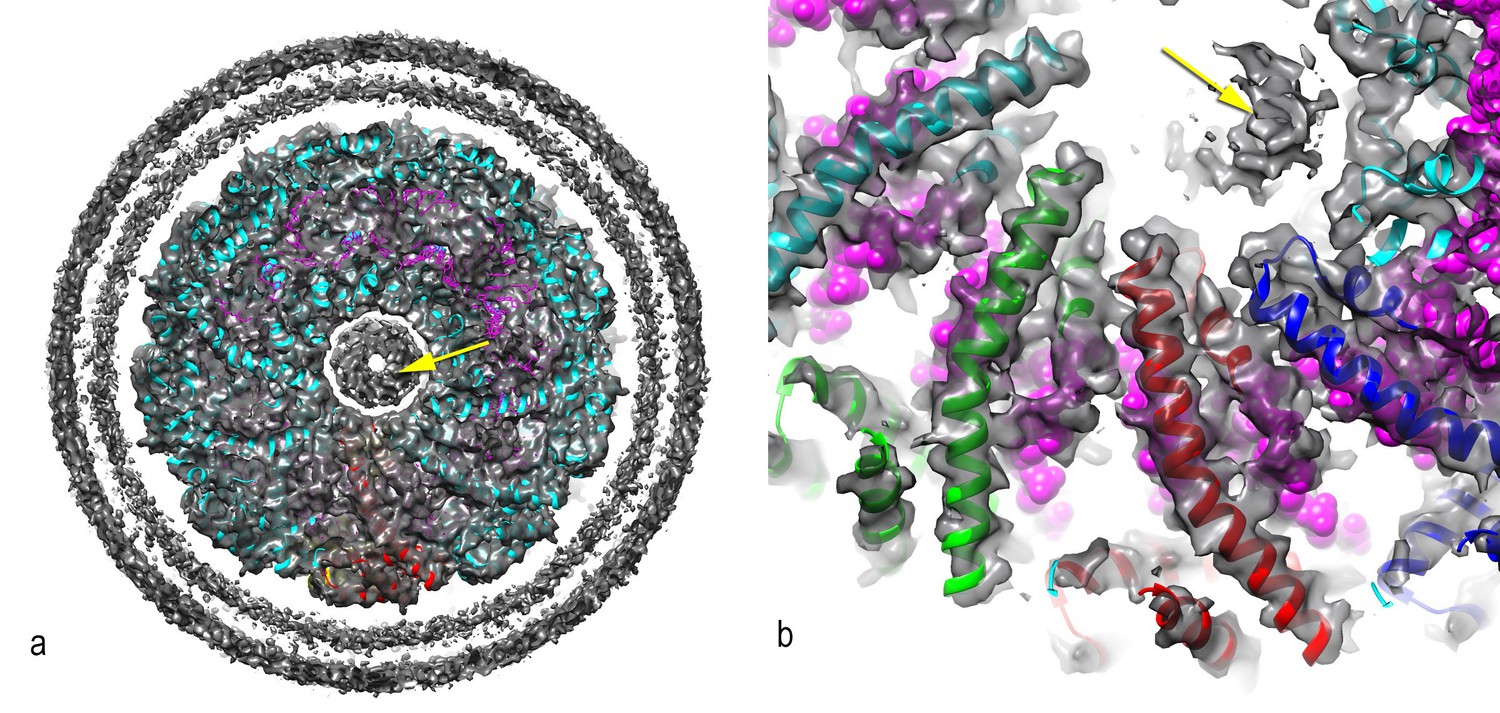
A central disconnected density (yellow arrow) cannot be explained by the two capsid proteins and most likely involves either a minor viral protein or a host protein.
Since the symmetry of the capsid has been imposed upon this density, it is uninterpretable. In (a), a thick cross-section is shown containing more than one helical turn of the capsid. In (b), a higher magnification view is shown of a thin slice containing less than a helical turn.
Figure 7—figure supplement 2

Computed radial density from molecular dynamics simulations.
Radial density functions are plotted from the cryo-EM data and from 10-ns intervals in a molecular dynamics simulation of the AFV1 capsid and envelope. Simulations were performed with protein, lipid, and solvent; to compare with the observed electron density, DNA was modeled into each snapshot. Major envelope features reproduced by the simulations—the thickness and the water gap between capsid and envelope—were stably maintained over the course of the simulations. Although the envelope remained rich in horseshoe-conformation lipids, the highly ordered double-peak envelope structure that we can analytically match using electron density from horseshoe lipids was not maintained. This structure is likely quite sensitive to lipid density in the capsid, although it may also result from larger headgroup moieties, as discussed in the text.
Figure 8
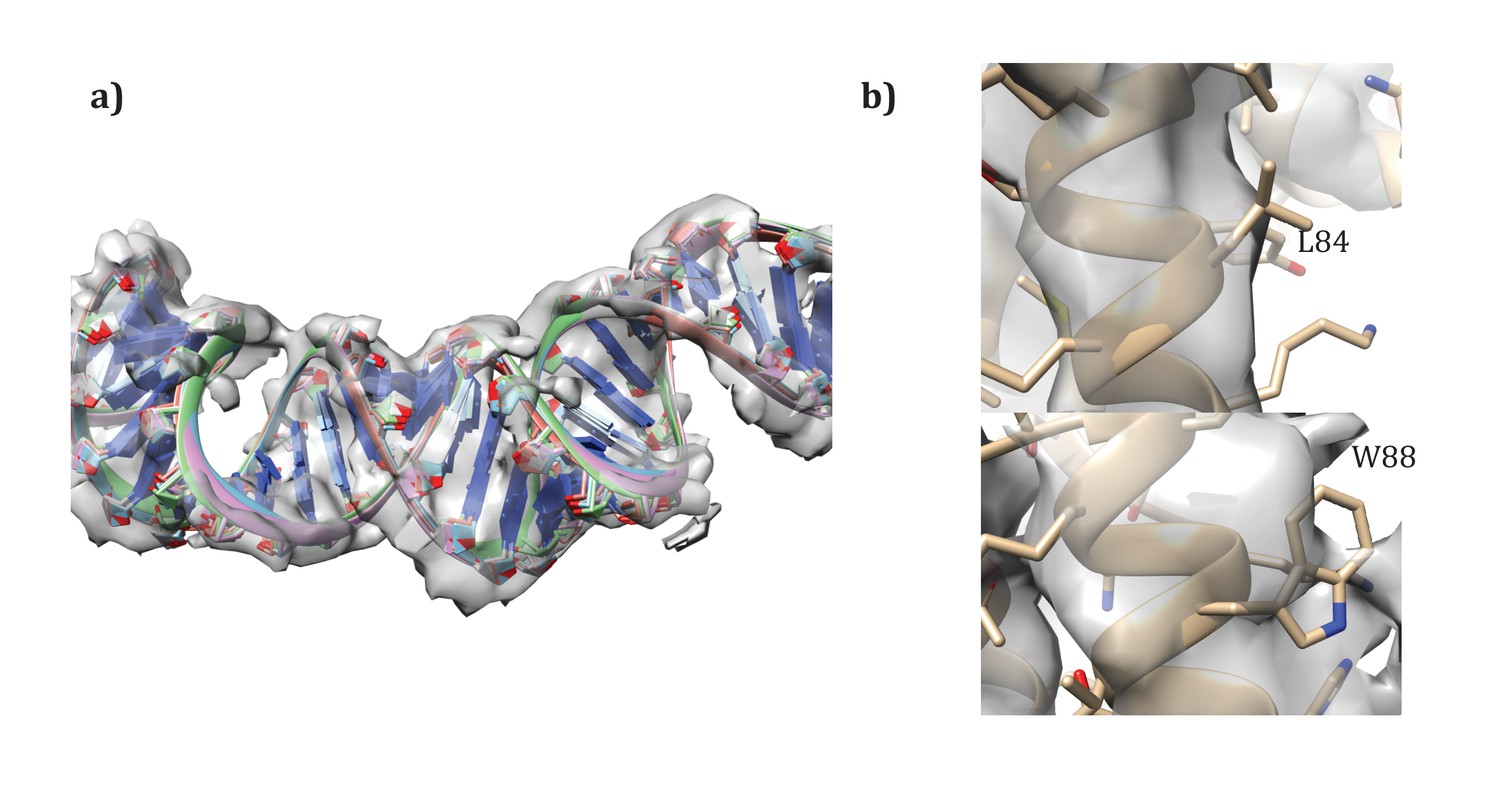
Details of the modeling.
(a) Convergence of DNA model refinement results. Sampling DNA conformations revealed a very tight cluster of models with 12 bp/repeat, showing good agreement with the density. (b) Two corresponding residues that helped guide initial placement of the two distinct subunits: the extra density visible around W88 compared to the corresponding residue, L84, where no sidechain density is visible.
Videos
Video 1
Conformational dynamics of 20 lipids from the simulated AFV1 envelope.
Rendered in this movie are 20 sequential lipids from the simulated AFV1 envelope in stick form and the capsid protein in cartoon form. Frames are at nanosecond intervals.
Video 2
Conformational dynamics of AFV1 envelope lipids and interfacial water.
Rendered in this movie are the simulated AFV1 envelope in stick form, all water molecules within 10 Å, and the capsid protein in cartoon form. Frames are at nanosecond intervals.
Download links
A two-part list of links to download the article, or parts of the article, in various formats.
Downloads (link to download the article as PDF)
Open citations (links to open the citations from this article in various online reference manager services)
Cite this article (links to download the citations from this article in formats compatible with various reference manager tools)
Model for a novel membrane envelope in a filamentous hyperthermophilic virus
eLife 6:e26268.
https://doi.org/10.7554/eLife.26268


