Anti-nociceptive action of peripheral mu-opioid receptors by G-beta-gamma protein-mediated inhibition of TRPM3 channels
- Philipps-Universität Marburg, Germany
- Max-Planck-Institut für Experimentelle Medizin, Germany
- Universität des Saarlandes, Germany
- Medical Faculty Mannheim Heidelberg University, Germany
- University of Freiburg, Germany
- Institut für Experimentelle und Klinische Pharmakologie und Toxikologie, Universität Tübingen, Germany
- Dalhousie University, Nova Scotia, Canada
- University of Illinois College of Medicine, United States
Figures
Figure 1 with 6 supplements
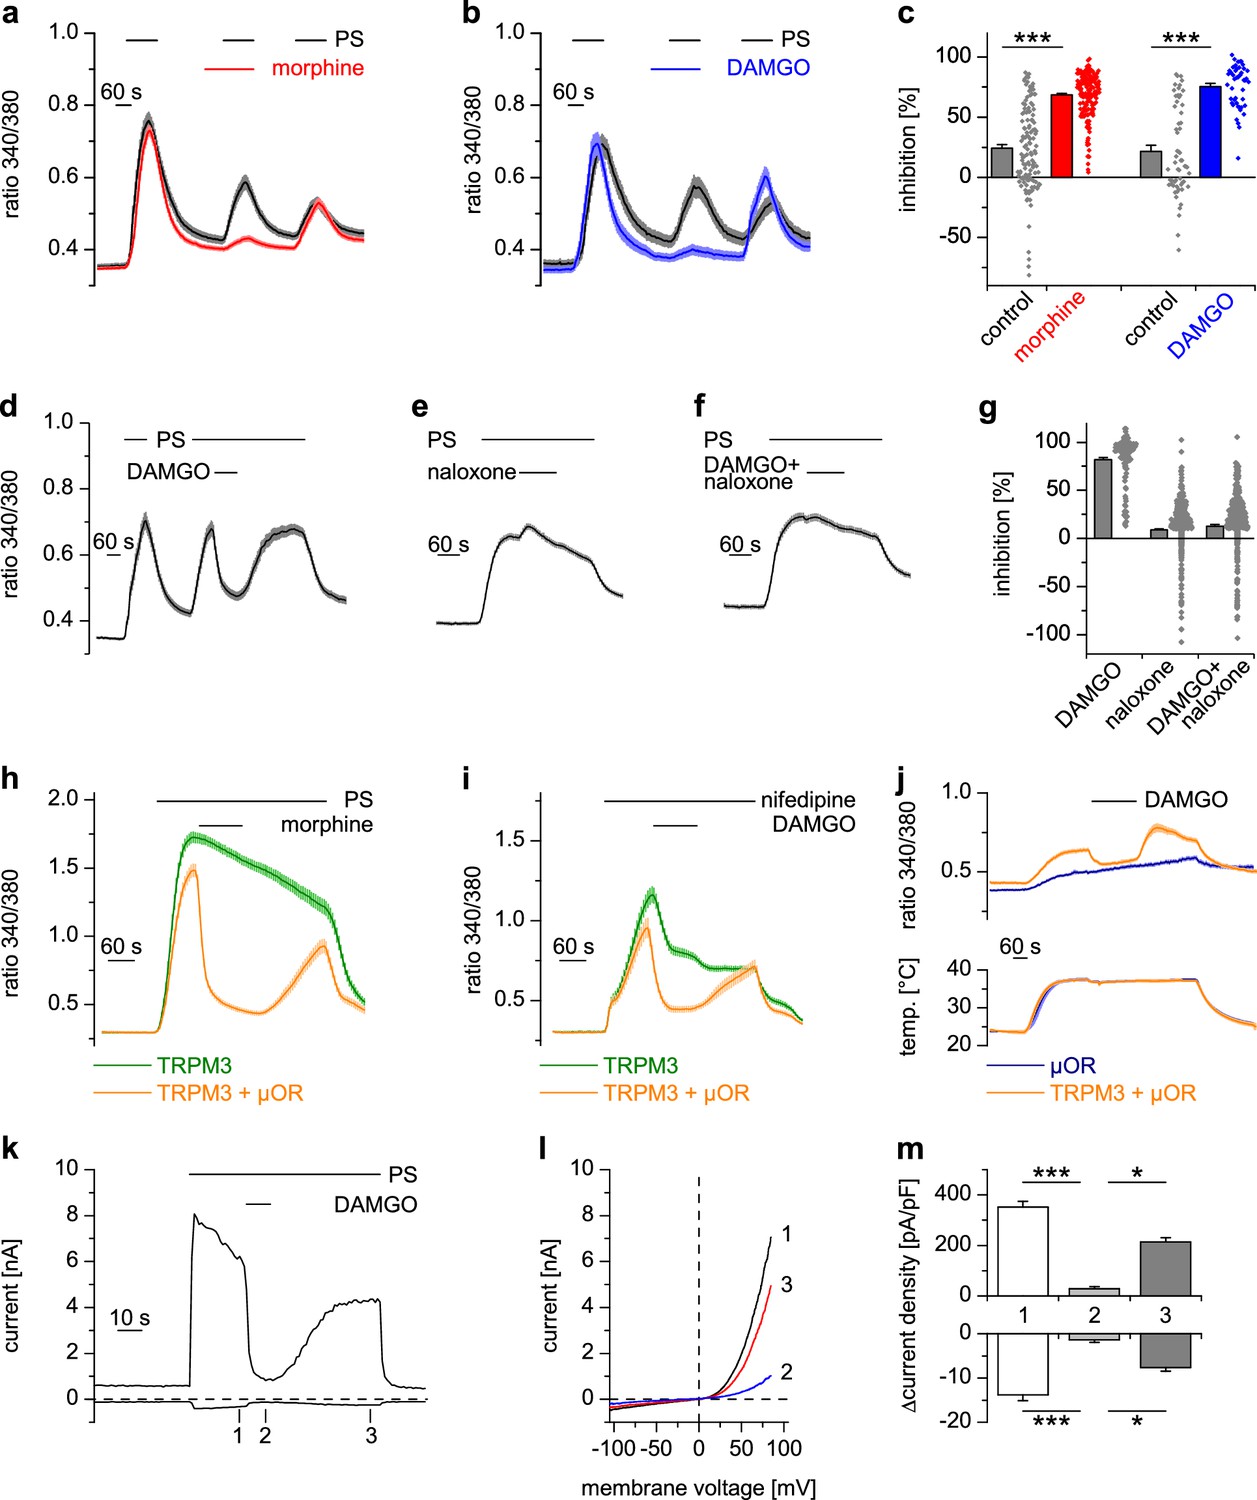
Activated µORs inhibit TRPM3-induced Ca2+ signals in somatosensory neurons and in an overexpression system.
(a) DRG neurons were stimulated three times with PS (25 µM) and morphine (1 µM, red trace, n = 188 neurons, five recordings) or vehicle as control (black trace, n = 130 neurons, four recordings). (b) Instead of morphine, DAMGO (0.3 µM, blue trace, 47 neurons, three recordings) was applied (control, black trace, 59 neurons, three recordings). Images of cells isolated from DRGs as used in these experiments are presented in Figure 1—figure supplement 5, example traces of individual cells in Figure 1—figure supplement 6a. (c) Quantification of the inhibition measured in (a) and (b); each dot-like symbol next to the bars represents the inhibition measured and calculated for a single, individual cell. Control experiments showing that the recorded Ca2+ signals are TRPM3-dependent are presented in Figure 1—figure supplement 1. Similar data with two chemically distinct µOR agonists are shown in Figure 1—figure supplement 2. (d) Inhibition by 0.3 µM DAMGO and recovery in DRG neurons stimulated with 25 µM PS, 0.3 µM DAMGO as indicated (n = 111 neurons, seven recordings). (e) The opioid receptor antagonist naloxone (5 µM) did not have an effect on its own (n = 412 neurons, 14 recordings). (f) Naloxone blocked the inhibitory effect of DAMGO on TRPM3 (n = 364 neurons, 15 recordings). Example traces of individual cells from these experiments are shown in Figure 1—figure supplement 6b. (g) Statistical analysis of the recordings shown in panels (d–f). The inhibition caused by DAMGO or naloxone was evaluated. The symbols on the right side of the bars represent inhibition measured in individual cells. (h) In HEK cells overexpressing TRPM3 and µORs, morphine (1 µM) inhibited Ca2+ signals evoked by 25 µM PS (orange trace, n = 115 cells, four recordings), but not in control cells expressing only TRPM3 (green trace, n = 97 cells, same four recordings). (i) DAMGO (0.3 µM) inhibits TRPM3-dependent Ca2+ signals induced by 50 µM nifedipine (orange trace: n = 58 cells, green trace: n = 75 cells, both from three recordings). (j) DAMGO (0.3 µM) inhibits TRPM3-dependent Ca2+ signals induced by heat (upper panel). Orange trace (n = 59 cells from four recordings) is the average of cells overexpressing TRPM3 and µORs. The blue trace (n = 89 cells, three recordings) represents control measurements from HEK cells expressing only µORs; there, TRPM3-independent heat-evoked Ca2+ signals are not inhibited by µOR activation. The lower panel shows the time course of the applied temperature. (k) Exemplary patch-clamp recording of a HEK cell overexpressing TRPM3 (activated by 25 µM PS) and µORs (activated by 0.3 µM DAMGO). Traces were obtained at +80 and −80 mV from voltage ramps. (l) I/V-curves measured at time points indicated in (k). (m) Statistical analysis of the baseline-subtracted current densities (n = 15 cells). A graphical representation of the recorded values for each cell is given in Figure 1—figure supplement 3. A dose response curve for the DAMGO-induced inhibition of TRPM3 currents is shown in Figure 1—figure supplement 4.
Figure 1—figure supplement 1
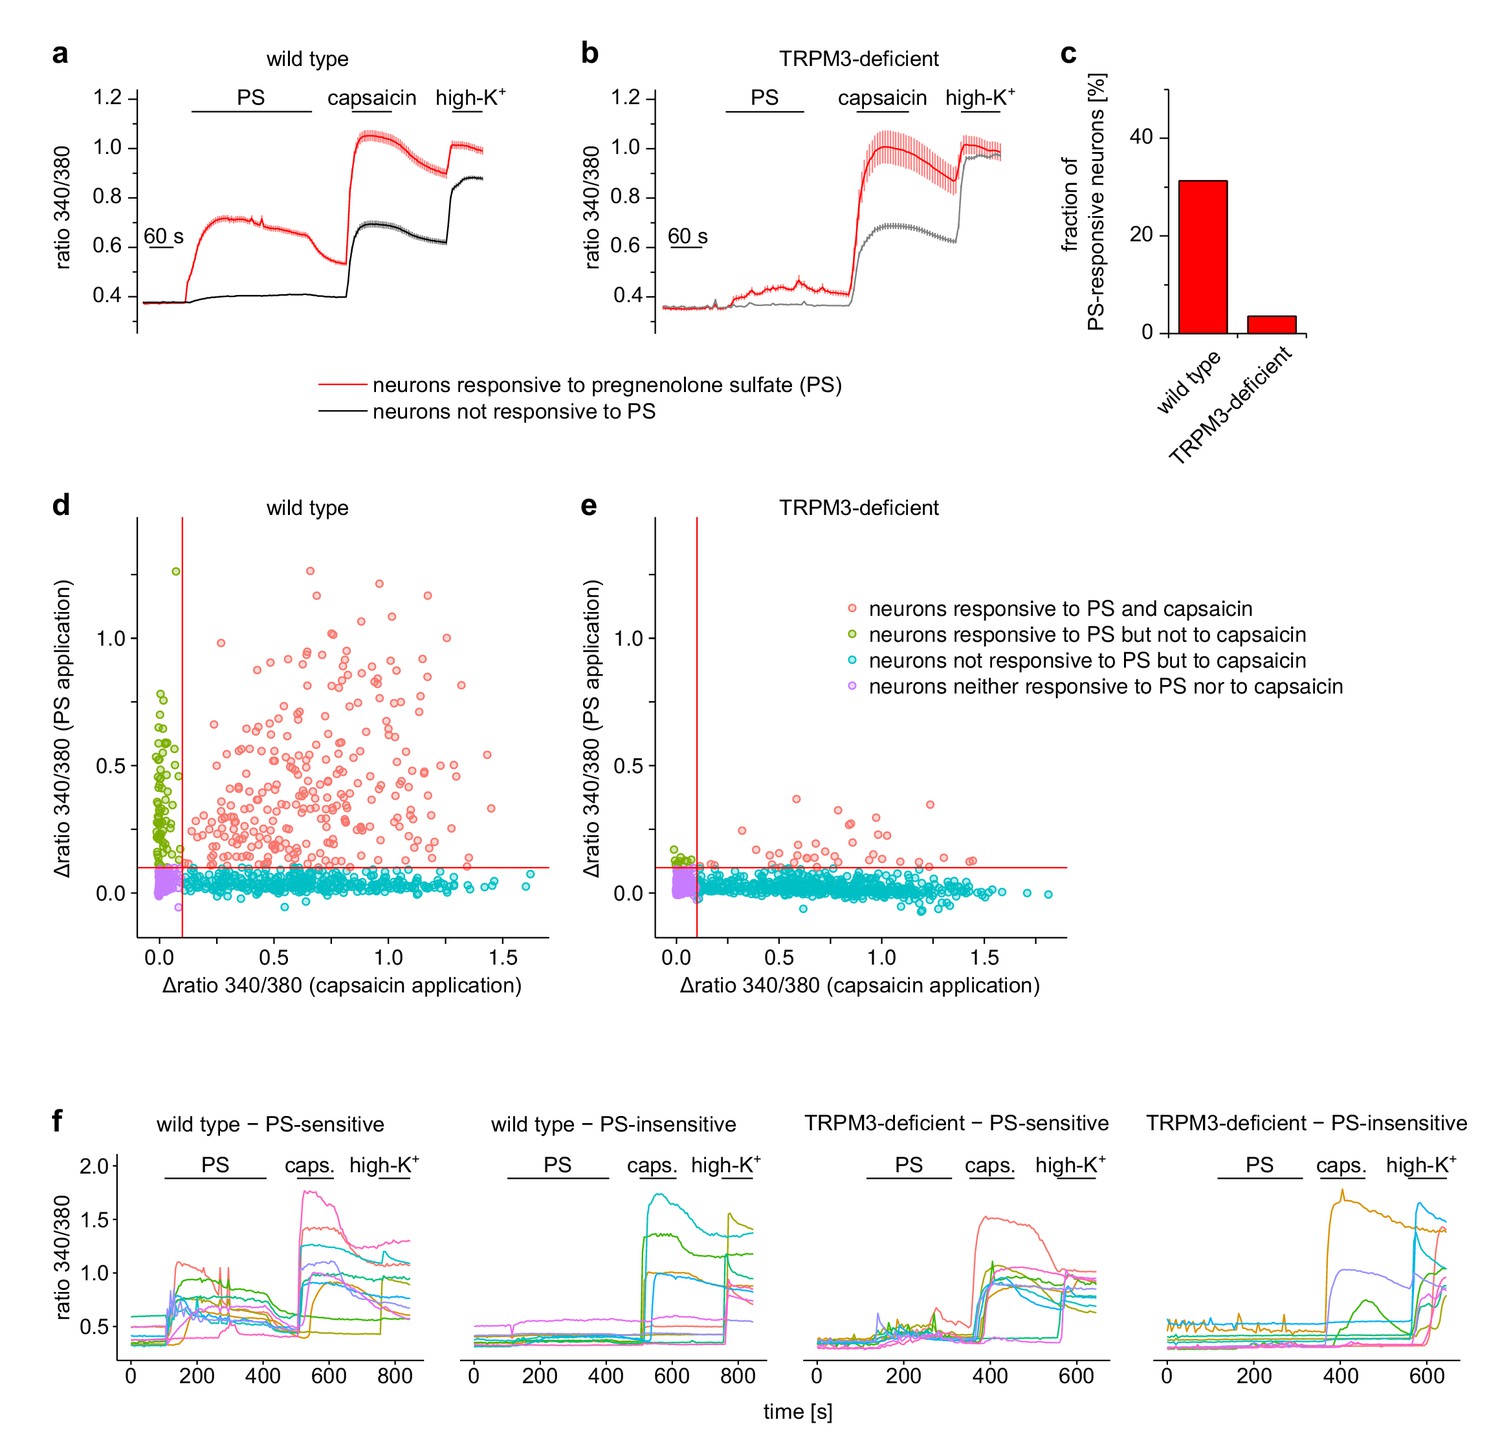
Pregnenolone sulfate (PS)-induced Ca2+ signals are dependent on TRPM3.
Isolated DRG cells obtained from wild-type (a) or TRPM3-deficient (b) mice (i.e. TRPM3 knock-out mice) were exposed to PS (25 µM) and capsaicin (2 µM). At the end of the experiment, application of a depolarizing solution containing 75 mM K+ ascertained the identification as neurons. Neurons were categorized according to responsiveness to PS: 341 out of a total of 1091 neurons from two wild-type mice responded to PS (14 recordings) and 48 out of 1339 neurons from two TRPM3-deficient mice (14 recordings). (c) Visual representation of the fraction of PS-responsive neurons in the two genotypes. (d, e) Scatter-plot representation of all cells analyzed. The response of the Fura2 signal to the application of PS (y-axis) is plotted over the response of the Fura2 signal to the application of capsaicin (x-axis). The continuous red lines indicate the thresholds used throughout this study to categorize cells as PS-responsive or capsaicin-responsive. (f) In each panel, 10 randomly chosen traces, each obtained from an individual cell, are shown to illustrate single cell responses. Overall, these data show that in the TRPM3-deficient mice, the number of neurons categorized as PS-responsive was much reduced. Also, the magnitude of the response of these neurons to PS was much less than in the neurons of wild-type mice, showing that the PS-induced Ca2+ signals in wild type cells are overwhelmingly due to Ca2+ influx through TRPM3 channels under our recording conditions.
Figure 1—figure supplement 2
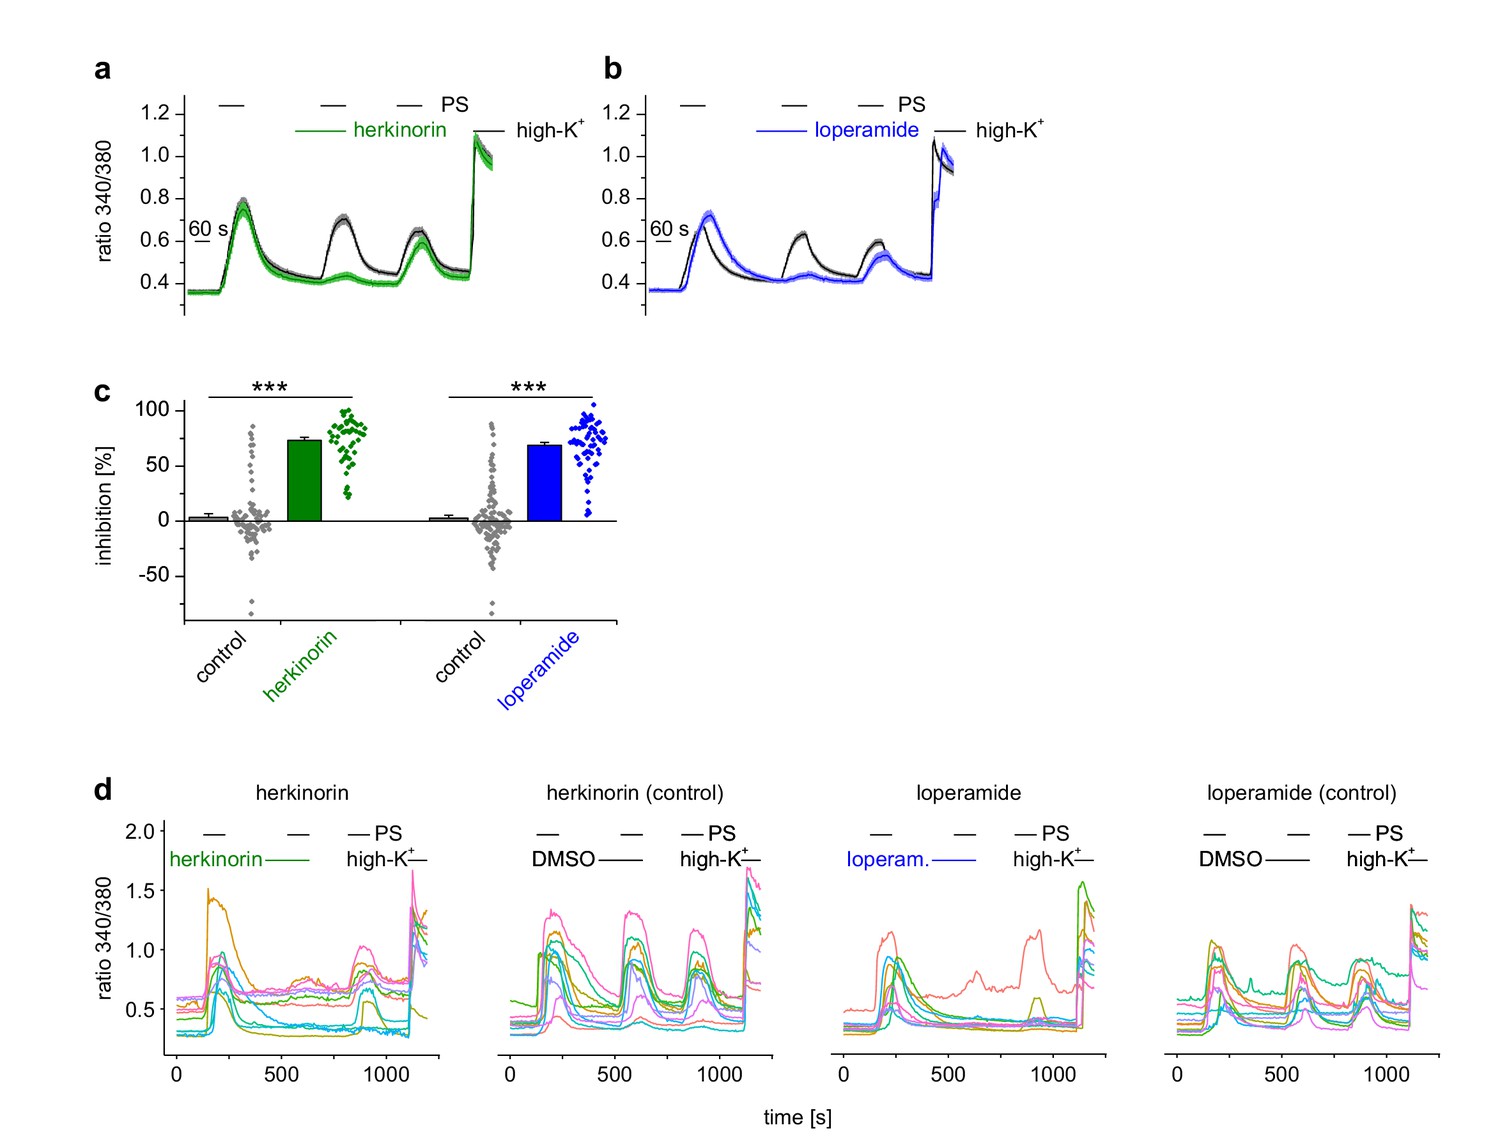
The chemically different opioid receptor agonists herkinorin and loperamide also cause inhibition of TRPM3 channels.
(a, b) Experiments were performed similar to Figure 1a,b on isolated DRG neurons sensitive to 25 µM pregnenolone sulfate (PS), but using (a) 1 µM herkinorin (green trace: n = 57 neurons from one mouse, three recordings; black trace: n = 83 neurons from one mouse, three recordings) or (b) 0.5 µM loperamide (blue trace: n = 68 neurons from one mouse, three recordings; black trace: n = 117 neurons from one mouse, three recordings) to activate µORs. (c) Statistical analysis of the data shown in panel (a) and (b). Dot-like symbols next to the bars represent the corresponding inhibition measured for single, individual cells. (d) In each panel, 10 randomly chosen traces, each obtained from an individual cell, are shown to illustrate single cell responses. Both agonists induced highly significant inhibition of TRPM3 activity.
Figure 1—figure supplement 3
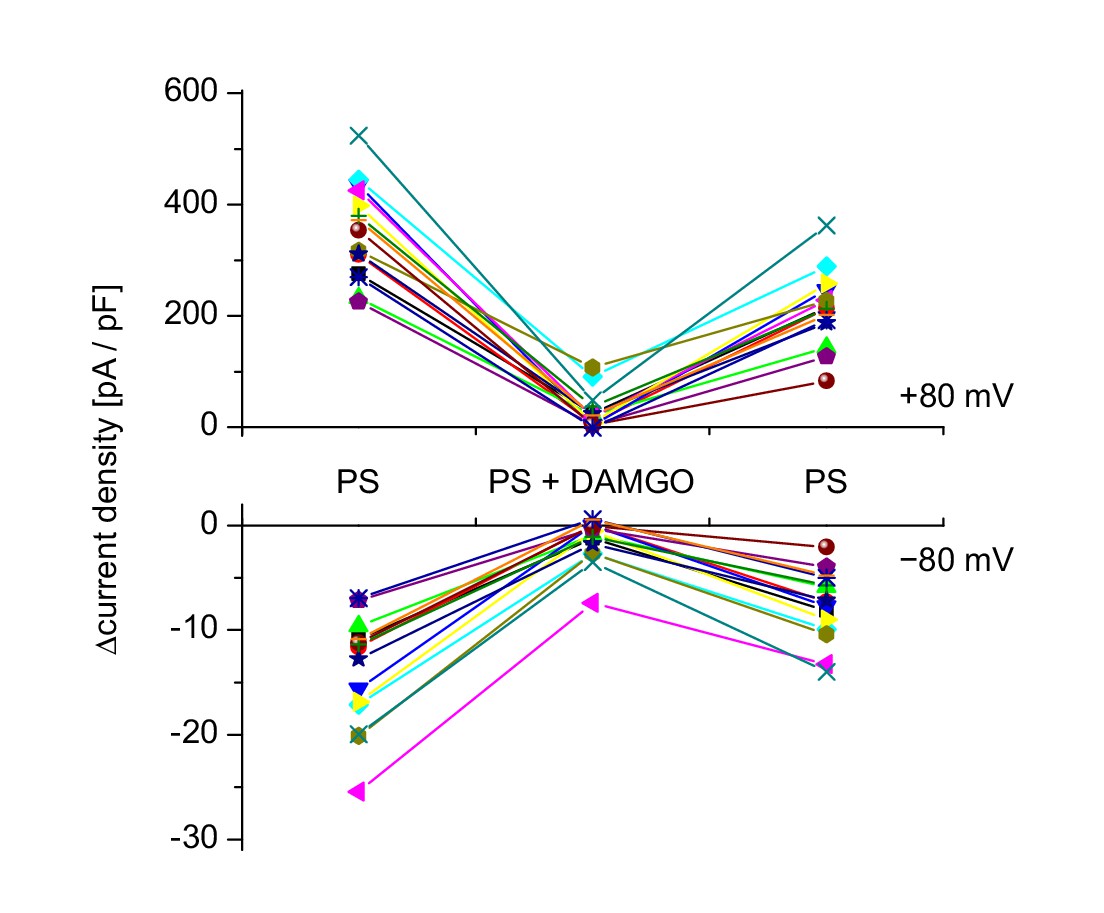
Data of each individual cell analyzed for Figure 1m.
Each combination of color and symbol represents a single cell. Baseline-subtracted current densities measured during the application of pregnenolone sulfate (PS) and before, during and after DAMGO co-application were plotted at +80 mV (upper panel) and −80 mV (lower panel).
Figure 1—figure supplement 4
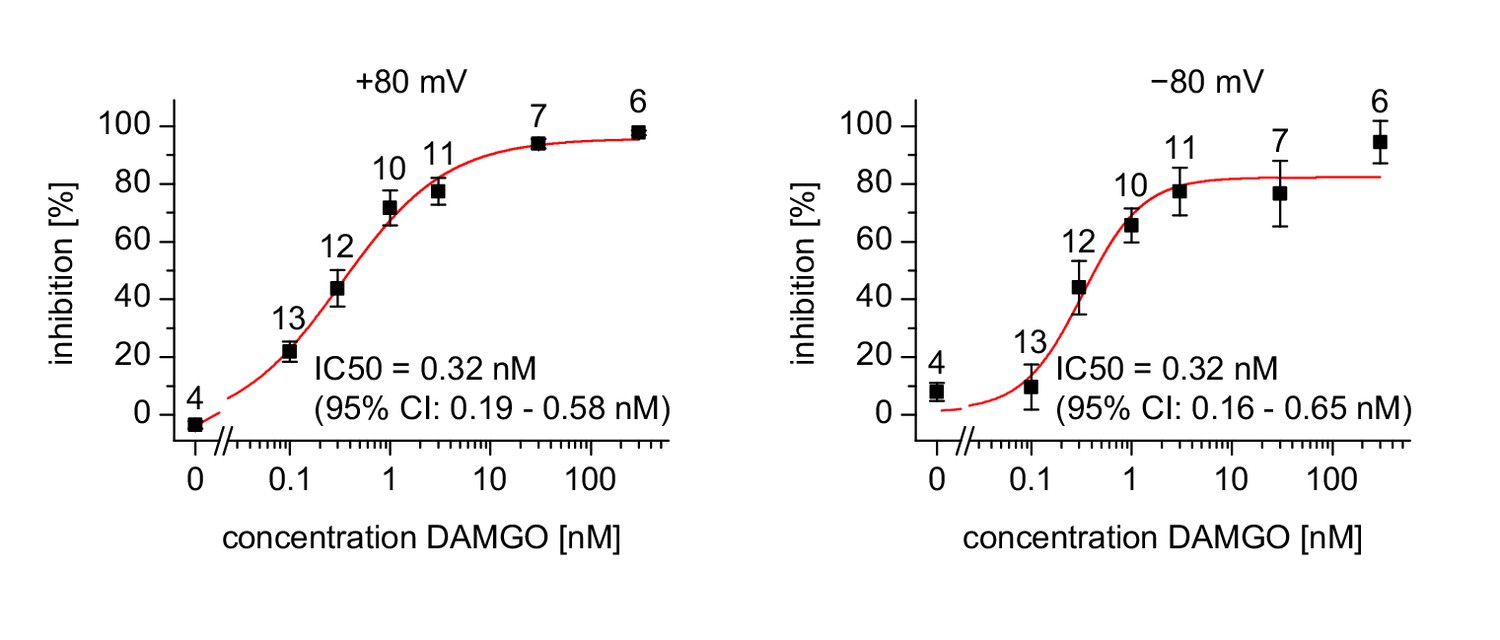
Dose-response relationship for the inhibition measured in a similar way as the recordings in Figure 1k–m.
Inhibition was calculated for each cell (numbers indicated above the data points) separately at membrane potentials of +80 mV and −80 mV. A variable-slope Hill function was fitted with no parameters constrained. The resulting values IC50 (and the corresponding 95% confidence intervals) are shown in the figures. The Hill slopes determined by the fit were 0.83 (95% confidence interval: 0.52 to 1.13) for +80 mV and 1.46 (95% confidence interval: 0.26–2.7) for −80 mV. Note that the data obtained at a holding potential of −80 mV are less reliable due to the much smaller current amplitudes. Nevertheless, the data are compatible with the statement that inhibition of TRPM3 currents by DAMGO-induced activation of µOR was independent of the membrane potential.
Figure 1—figure supplement 5
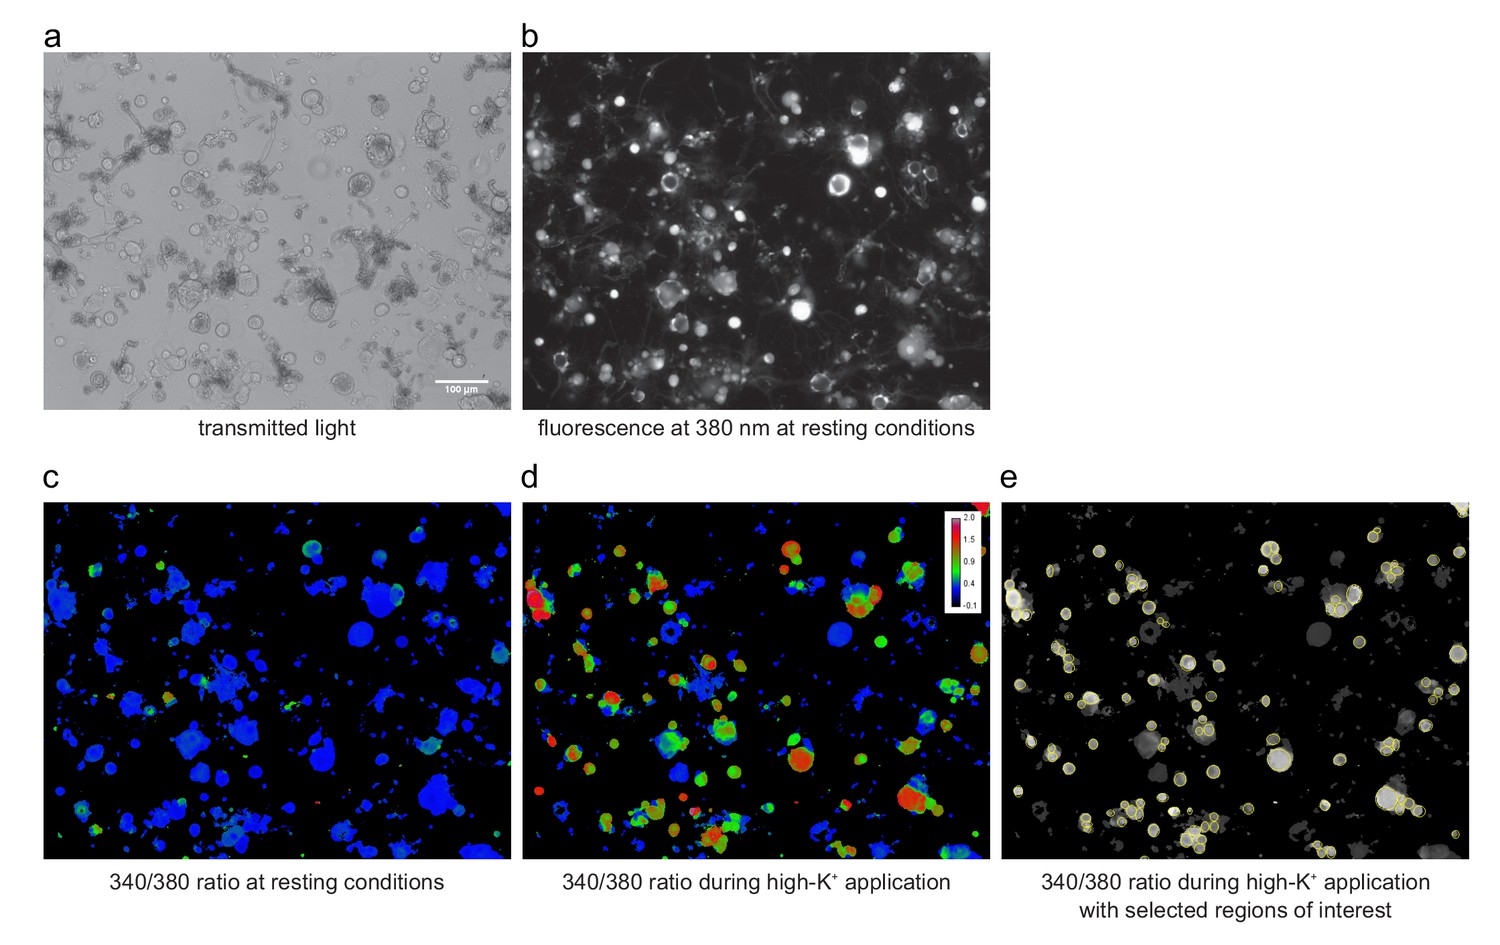
Images of isolated DRG cells plated on a coverslip and loaded with Fura2.
(a) In the transmitted light image, not only cells, but also debris and other non cellular structures might be visible. (b) The same cells imaged with epi-fluorescence illumination at an excitation wavelength of 380 nm. (c, d) Pseudo-colored image of the same cells showing the calculated Fura2 ratio (340/380 ratio, as explained in Materials and methods) under resting conditions at the beginning of an experiment and under stimulation with the high-K+ solution at the end of the experiment. The pseudo-color scale shown in (d) applies also to panel (c). (e) Same image as in (d), but shown as a black-and-white representation with ROIs (regions of interest, used later to obtain time series traces of individual cells) superimposed. The high-K+ stimulation allowed to select neuronal cells with high prevalence. All images shown are from exactly the same region of the coverslip and were obtained with 10x SFluor objective (NA: 0.5) on a Nikon inverted microscope. The calibration bar in (a) applies to all panels.
Figure 1—figure supplement 6
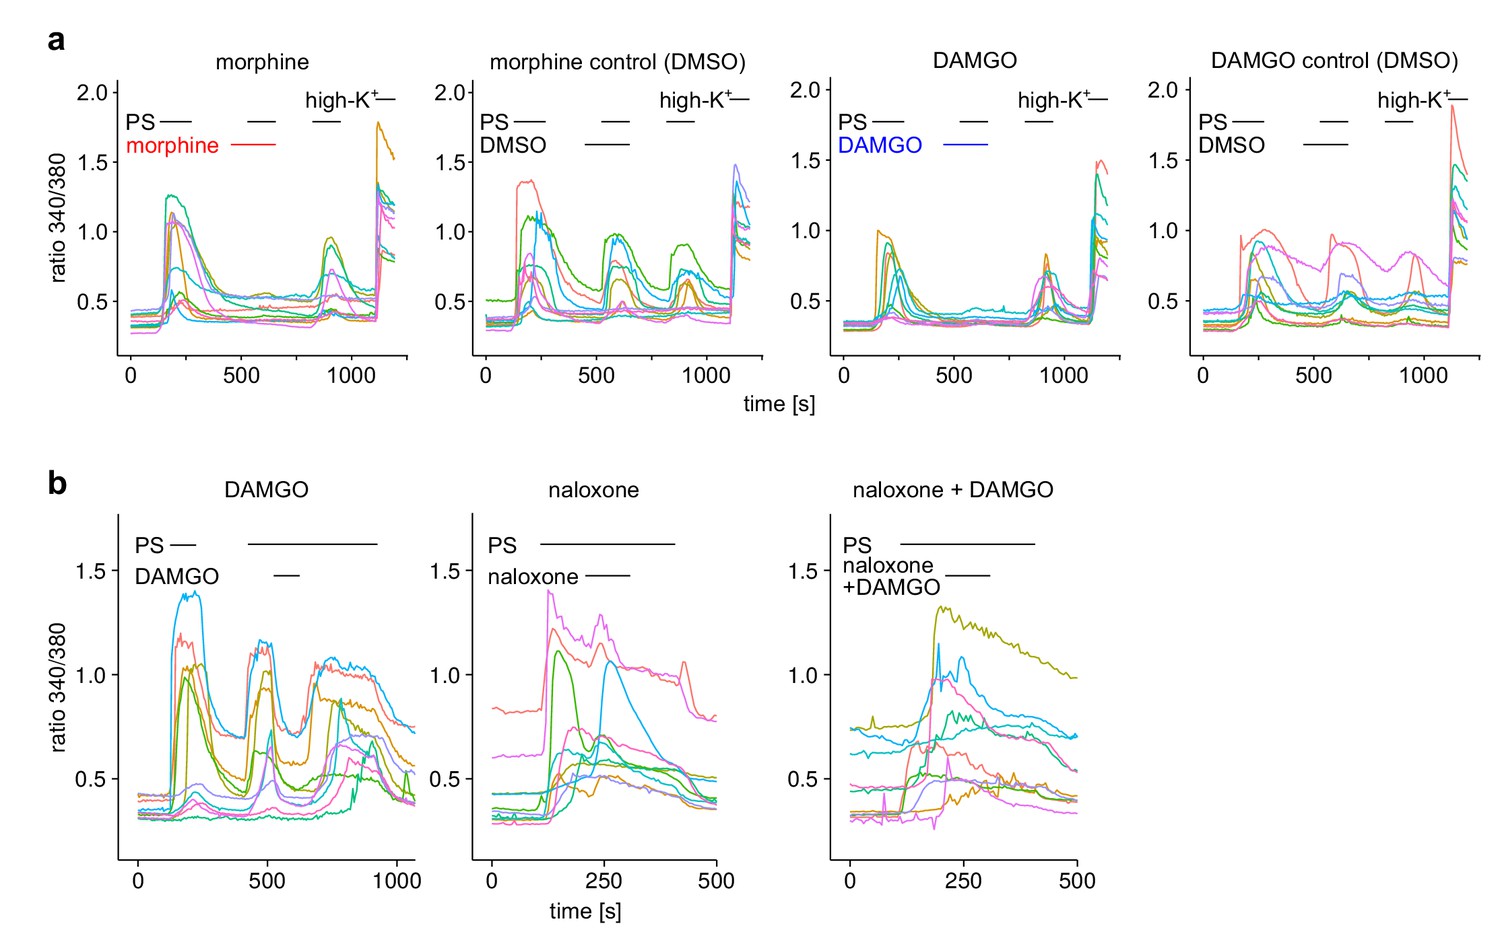
Exemplary responses of single cells from the experiments shown in Figure 1a–c (a) or Figure 1d–g (b).
For each recording condition, 10 individual cells were chosen randomly from the pool of all recorded cells.
Figure 2 with 2 supplements
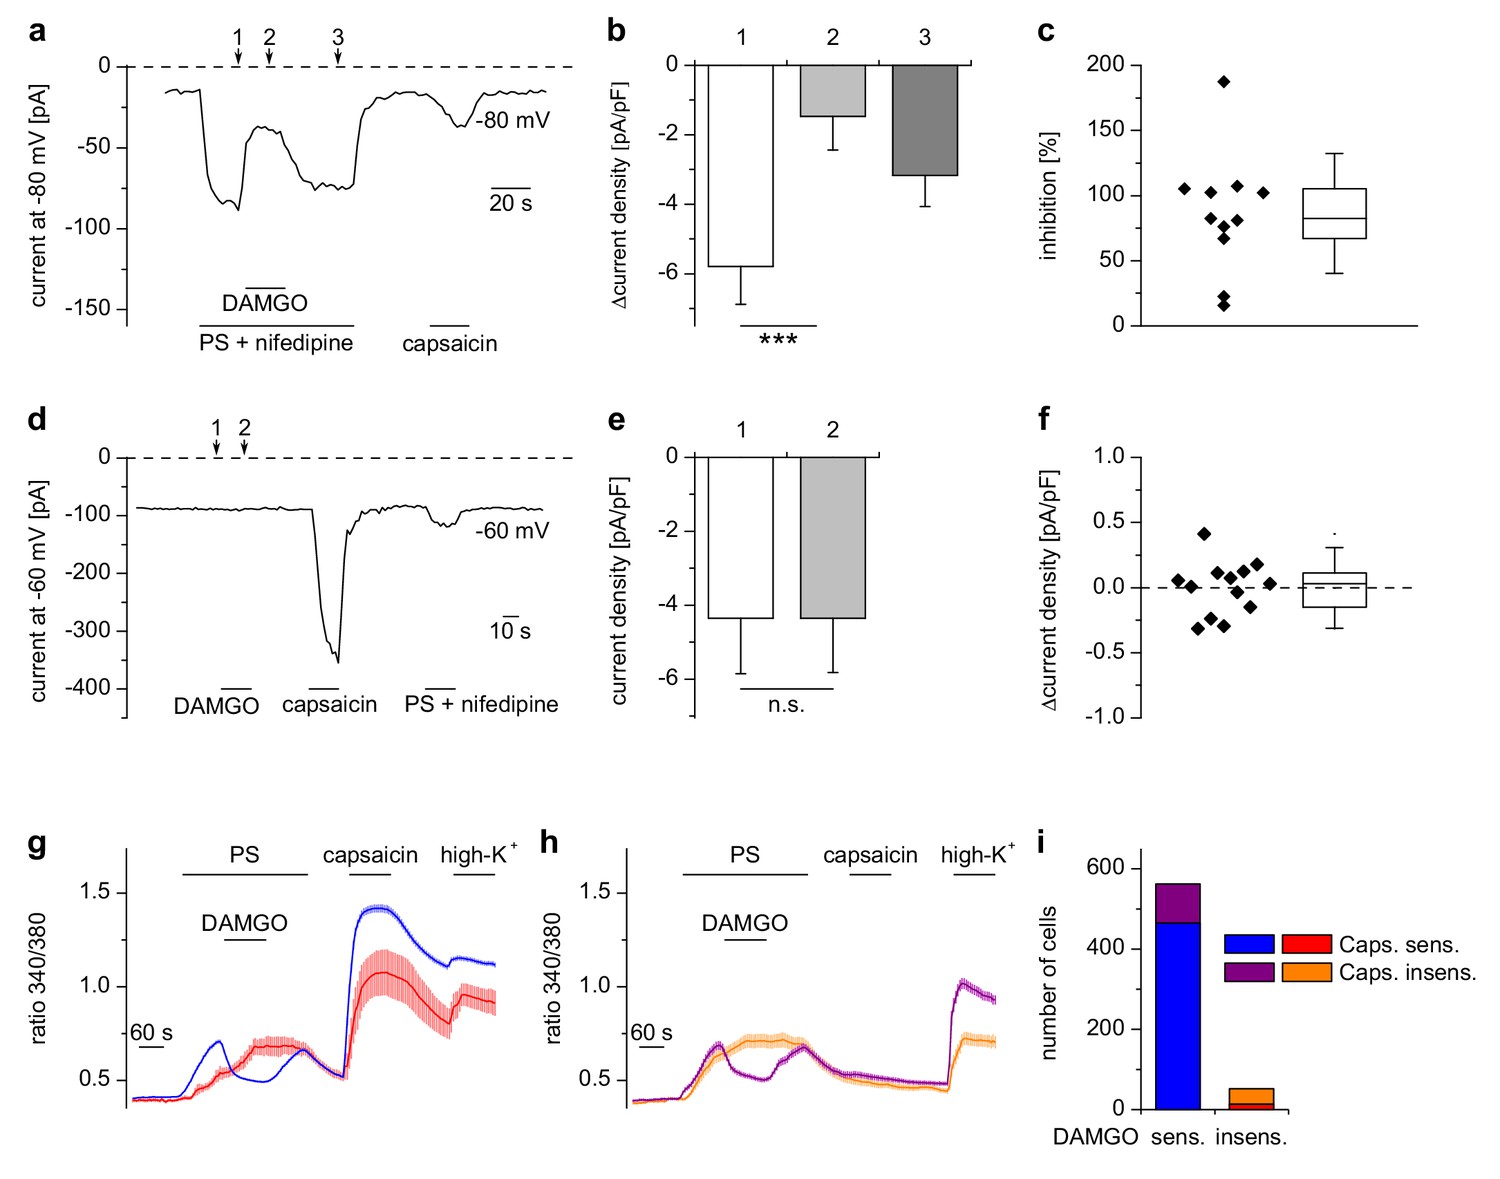
Inhibition of TRPM3 by µORs in DRG neurons is variable.
(a) Example of an electrophysiological whole-cell patch-clamp recording from an isolated DRG neuron responding to TRPM3 agonists (PS and nifedipine at 50 µM each), DAMGO (0.3 µM) and capsaicin (0.1 µM). The recording was performed in monovalent-free solution in order to reduce currents through endogenous voltage-gated channels. (b) Statistical analysis of 11 cells responding with an inward current to the combined application of PS and nifedipine. Baseline-subtracted current densities were evaluated at similar time points as indicated by arrows and numbers in (a). (c) To illustrate the variability, the inhibition observed in individual cells is shown. (d–f) Application of DAMGO alone (in standard extracellular solution containing K+) did not evoke significant currents in DRG neurons responsive to TRPM3 or TRPV1 agonists. (d) Exemplary recording of a neuron at −60 mV holding potential sensitive to 1 µM capsaicin and TRPM3 agonists (PS and nifedipine at 50 µM each), (e) statistical analysis of 13 different DRG neurons, (f) DAMGO-induced increase in current density in individual cells, evaluated as difference in current density for each cell between time points 1 and 2 marked with arrows in (d). In (c) and (f), the box indicates mean and 25 and 75 percentiles, the whiskers represent standard deviations. (g–i) Similarly, in Ca2+ imaging experiments, Ca2+ signals evoked by 25 µM PS in DRG neurons were variably sensitive to inhibition by DAMGO (3 µM). PS-sensitive DRG neurons (17% of total neurons, i.e. 614 out of 3576 neurons, obtained from 5 mice in 35 recordings) were classified as sensitive (g) or insensitive (h) to 2 µM capsaicin, and each subgroup was further divided into DAMGO-sensitive and DAMGO-insensitive cell populations and averaged separately. (i) Overview of the number of cells in each subgroup (which also corresponds to the number of neurons averaged for the traces in (g) and (h). Overall, 91.5% (562 of 614) of the PS-sensitive neurons were inhibited by DAMGO. The size distribution of the cells analyzed in (g–i) is shown in Figure 2—figure supplement 1. A graphical representation of the response of the individual cells analyzed in this experiment is given in Figure 2—figure supplement 2.
Figure 2—figure supplement 1
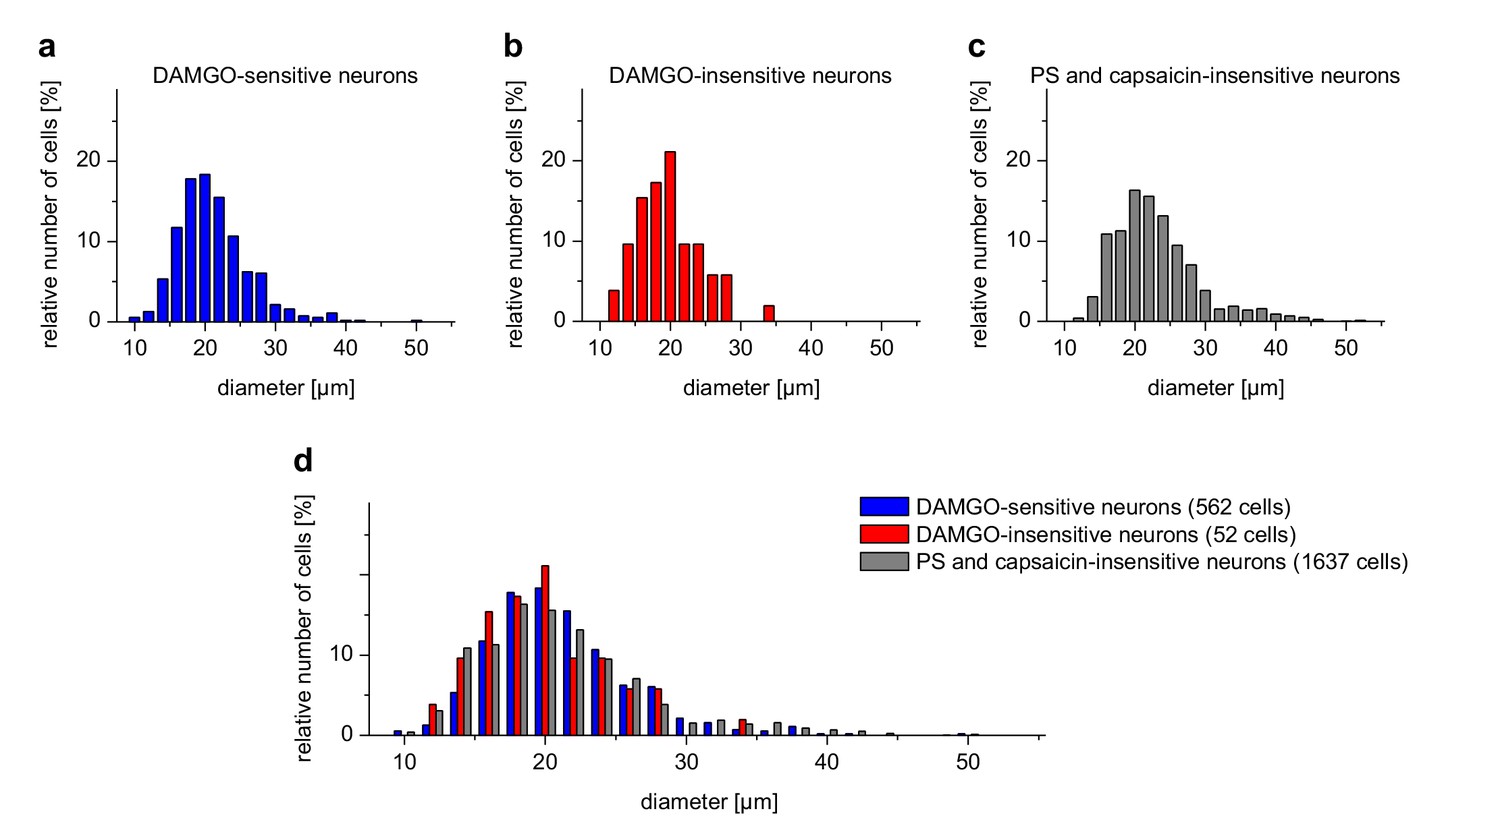
DAMGO-sensitive and DAMGO-insensitive TRPM3-expressing neurons have similar size distributions.
The distribution of the sizes (expressed as Feret's diameter) of the cells analyzed in Figure 2g–i is shown in histograms with a bin size of 2 µm. (a) PS-sensitive cells also responding to DAMGO (corresponding to the cells represented in the blue trace of Figure 2g and the violet trace of Figure 2h). (b) PS-sensitive cells not responding to DAMGO (corresponding to the cells represented in the red trace of Figure 2g and the orange trace of Figure 2h). (c) Neuronal cells from the same cover slips that did not respond to either PS or capsaicin. This group of cells was included as control. (d) Side-by-side comparison of the same histograms as in (a–c). The number of cells included in the analysis (which originated from five mice) is indicated on the figure. No obvious difference was found between PS-sensitive cells with or without sensitivity to DAMGO. However, the neurons shown in (c) clearly contained additional, larger diameter cells not present in the PS-sensitive cell population. Both groups of PS-sensitive cells therefore appear to belong to small-diameter somatosensory neurons, consistent with previous reports. Please note that from the total of 3576 neuronal cells, those responding to capsaicin, but insensitive to PS (n = 1325) were omitted from this analysis.
Figure 2—figure supplement 2
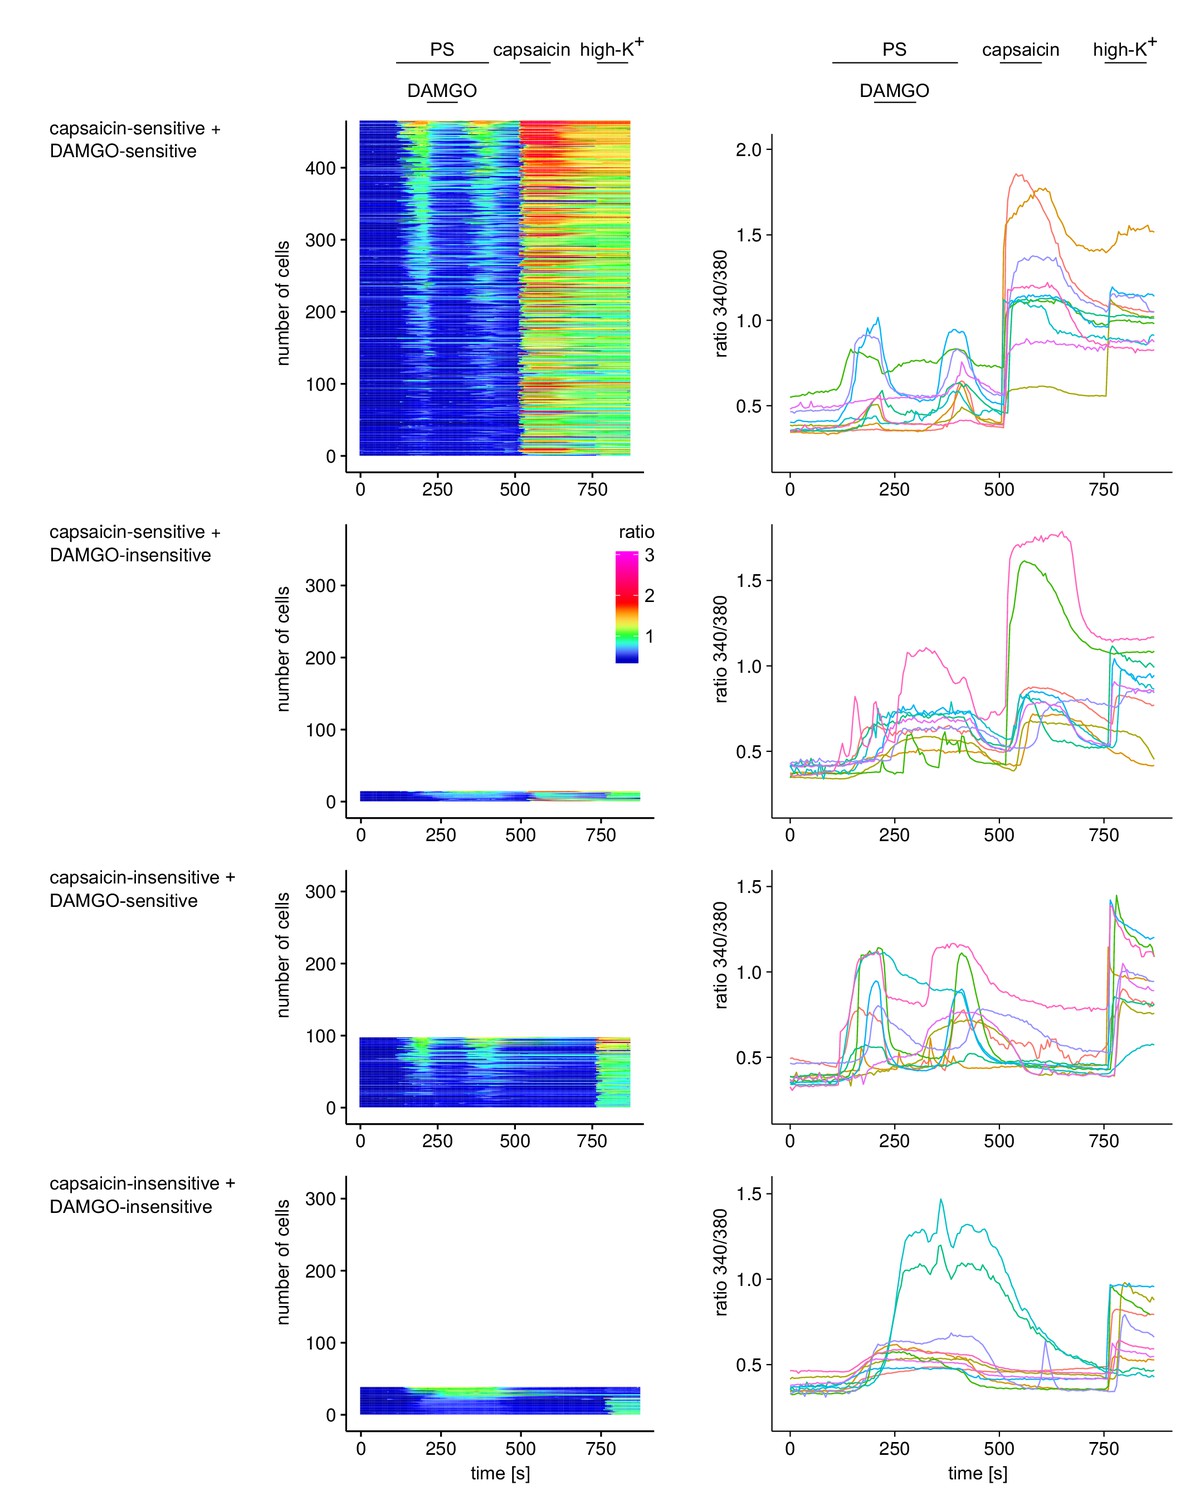
Responses of individual cells from the experiments shown in Figure 2g–i.
Individual cells were categorized according to their response to capsaicin and DAMGO, resulting in four categories. For each of these four categories, the responses of all cells are displayed in the panels on the left as ‘heatmaps’, where each row represents an individual cell. Cells were ordered according to the size of their response to PS (cells with largest response on top). The recorded Fura2 ratio was converted to a color scale according to the scale bar shown. In the panels on the right, 10 individual cells were chosen randomly from the pool of all recorded cells and are shown as time series.
Figure 3 with 1 supplement
A variety of different Gαi-coupled receptor types inhibits TRPM3 channels in isolated DRG neurons.
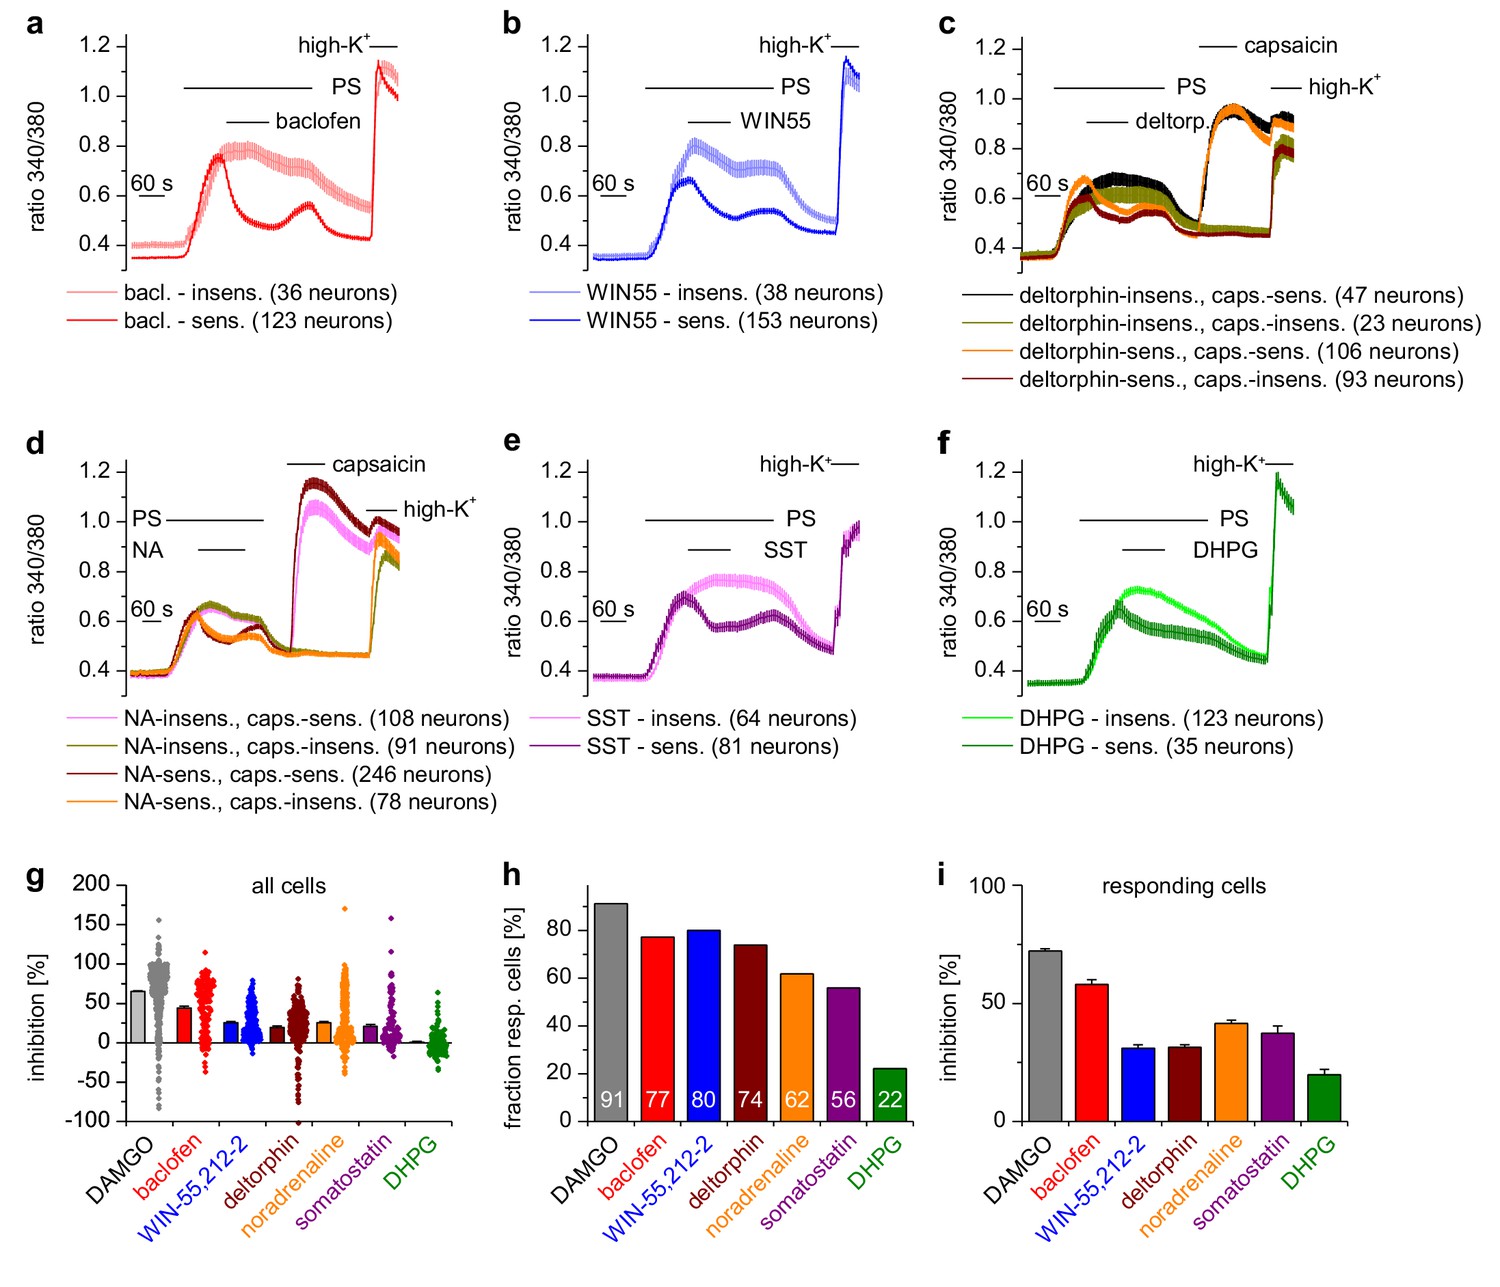
Neurons sensitive to pregnenolone sulfate (PS, 25 µM) were selected post-hoc and categorized as sensitive or insensitive with respect to the GPCR agonist used. In (c) and (d), neurons were additionally subdivided in groups according to capsaicin (2 µM) sensitivity, similar to the analysis in Figure 2g–i. Traces represent averages within these categories, numbers in brackets give the number of neurons used for the analysis. (a) 100 µM baclofen (bac) was used to stimulate GABAB receptors (four recordings, cells from one mouse). (b) 1 µM WIN-55,212–2 (WIN55) was used to stimulate cannabinoid receptors (four recordings, cells from one mouse). (c) 1 µM deltorphin (deltorp.) was used to stimulate δ-opioid receptors (18 recordings, cells from three mice). (d) 2 µM noradrenaline (NA) was used to stimulate adrenoreceptors (17 recordings, cells from two mice). (e) 0.5 µM somatostatin (SST) was used to activate somatostatin receptors (eight recordings, cells from two mice). (f) Gαq-coupled mGluR5 receptors were stimulated with 20 µM dihydroxyphenylglycine (DHPG, four recordings, cells from one mouse). Traces of individual cells from the subgroups shown in panels (a) – (f) are shown in Figure 3—figure supplement 1. (g) Percentage of inhibition of the PS-evoked Ca2+ signal of all PS-sensitive neurons. The dot-like symbols on the right side of the columns represent the inhibition measured for each individual cell. (h) Summary of the experiments showing the percentage of PS-sensitive neurons responding with a reduction of PS-induced Ca2+ signals (larger than the predefined threshold of 7.5%, see Materials and methods section) to the stimulation with the indicated agonist. The numerical value of the percentage of GPCR-agonist-sensitive cells is indicated on the columns. (i) Same as panel (g), but calculating the average inhibition of only those cells that show an inhibition larger than the predefined threshold value. The data for the µOR agonist DAMGO in panels (g–i) are taken from Figure 2g–i. Combined, these data indicate that the inhibition of TRPM3-dependent signals is especially pronounced when stimulating µORs (with DAMGO) or GABAB receptors (with baclofen).
Figure 3—figure supplement 1
Ca2+ responses of 10 individual, randomly chosen, neuronal DRG cells for each group of the experiments shown in Figure 3.
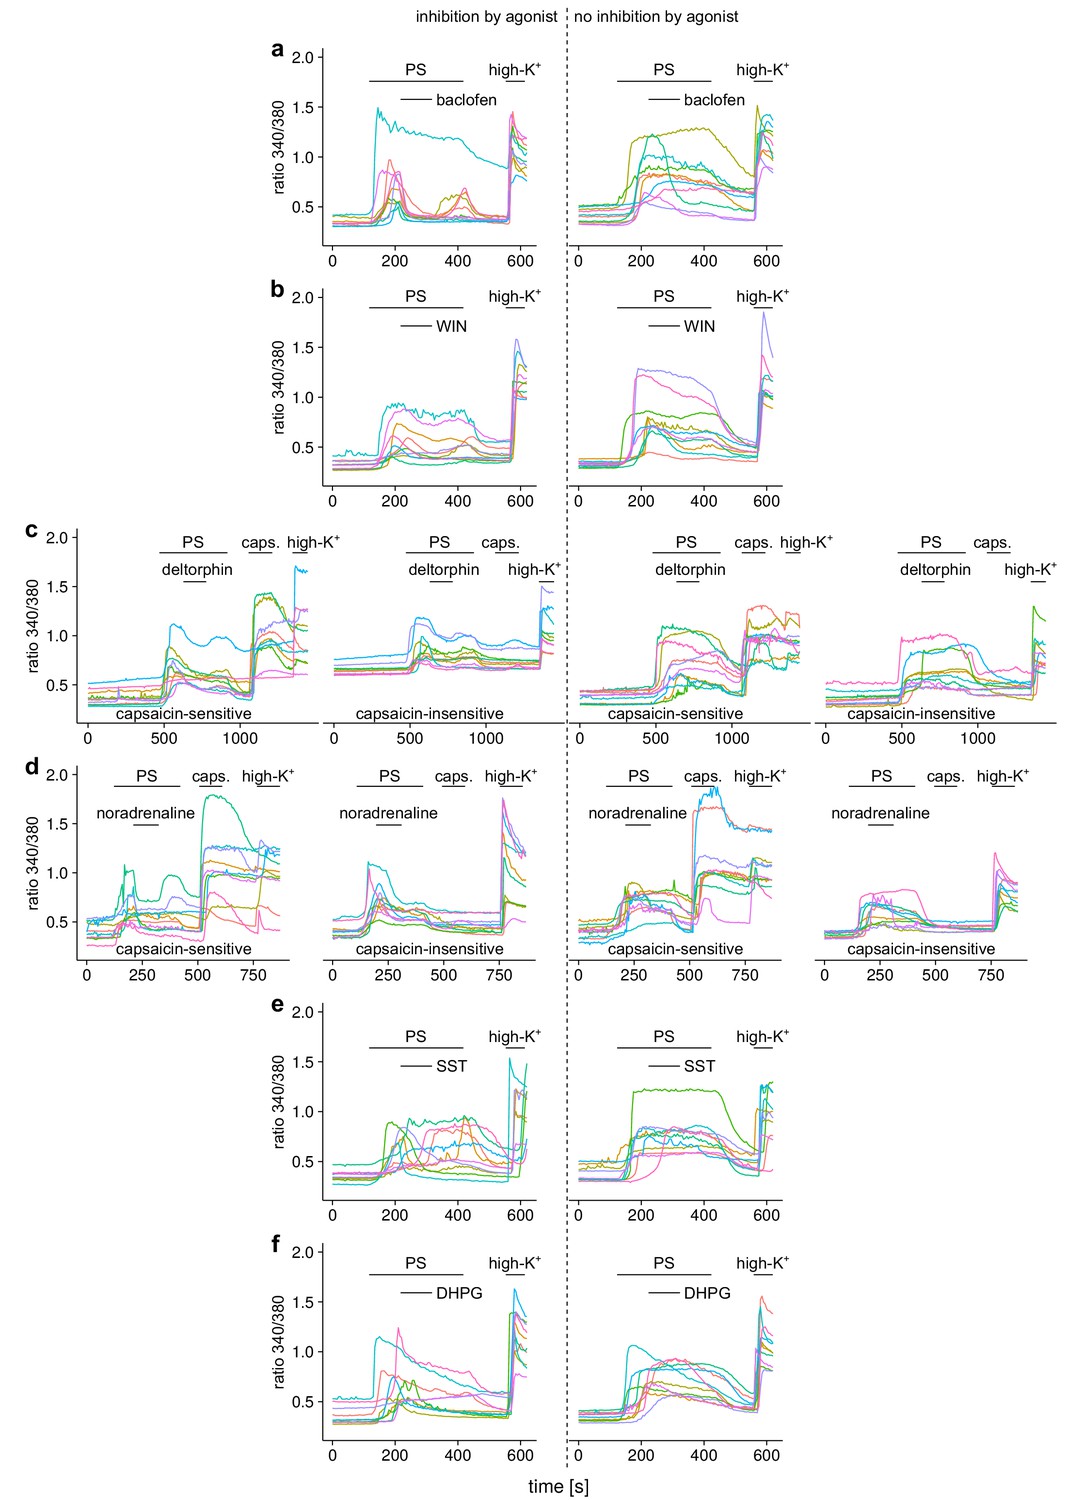
(a) In the top row, responses to the GABAB receptor agonist baclofen are shown, (b) in the second row responses to the cannabinoid receptor agonist WIN 55,212–2 (WIN), (c) in the third row responses to the δ-opioid receptor agonist deltorphin (deltor.), (d) in the fourth row responses to the adrenoreceptor agonist noradrenaline, (e) in the fifth row responses to the somatostatin receptor agonist somatostatin (SST) and (f) in the sixth row responses to the agonist of mGluR5 receptors dihydroxyphenylglycine (DHPG). In the panels left to the dashed line cells that displayed an inhibitory reaction (larger than 7.5%) to the agonist are shown, in the panels to the right of the dashed lines, traces from cells that were classified as not inhibited are shown. For the agonists deltorphin (c) and noradrenaline (d), the two groups were further subdivided according to the response towards capsaicin application, resulting in four different subgroups, as indicated in the panels.
Figure 4 with 2 supplements
Activation of µORs does not rapidly inhibit the somatosensory temperature-sensitive TRP channels TRPV1, TRPA1 and TRPM8.
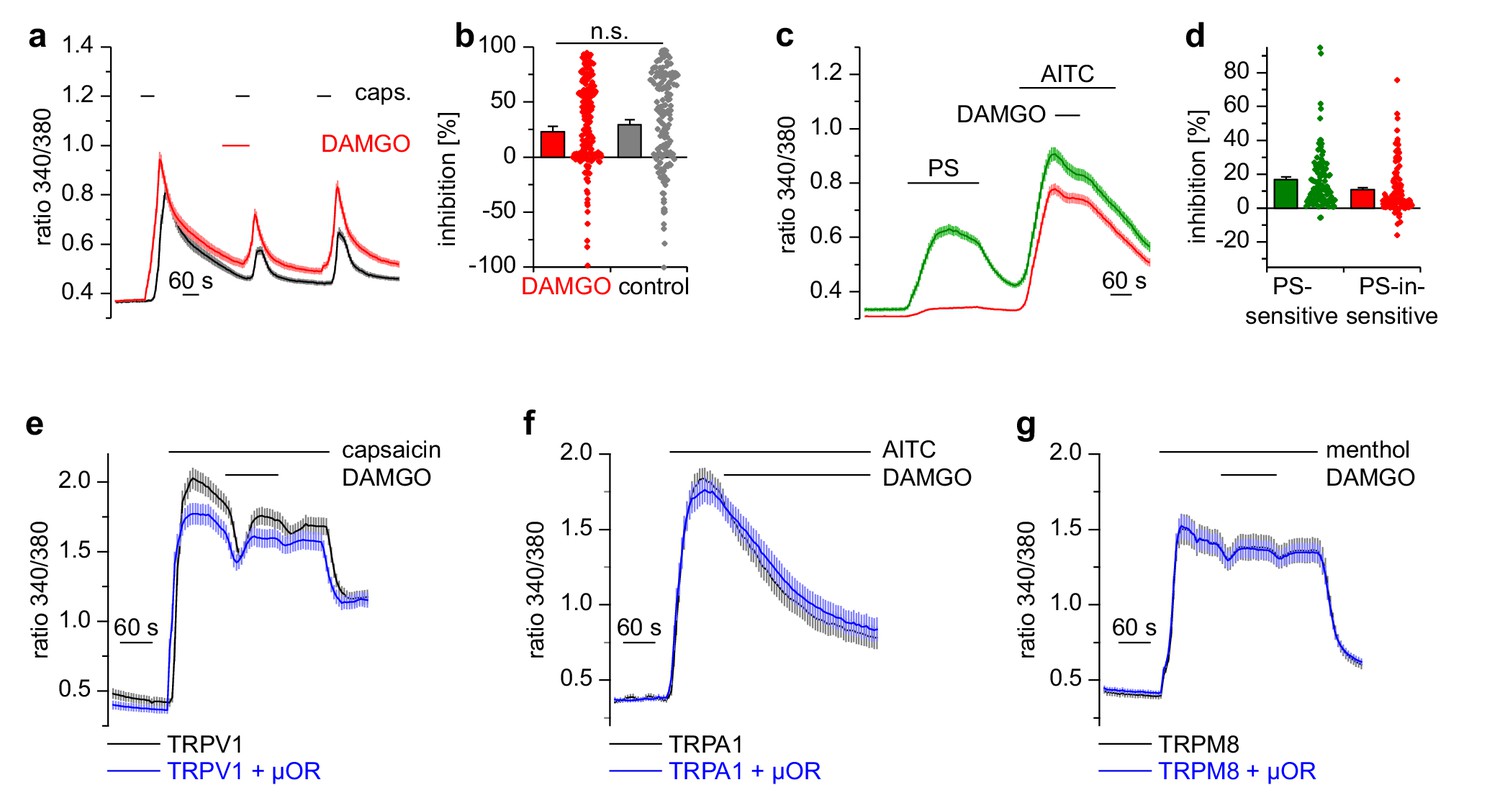
(a) The capsaicin-sensitive subset of DRG neurons showed no reduction of the capsaicin-evoked Ca2+ signals (0.1 µM capsaicin, red trace: n = 166 neurons from 10 recordings, cells from two mice) after application of 0.3 µM DAMGO that was stronger than the reduction observed during the application of the solvent (control trace: 0.015% DMSO, black trace: n = 186 neurons from nine recordings, cells from the same two mice). (b) Statistical summary of the inhibition evoked by DAMGO or DMSO in the experiment in (a). The dot-like symbols on the right side of the bars indicate inhibition values measured in individual cells. Please note, that for both measurement conditions (‘DAMGO’ and ‘control’), two cells showing strongly increased responses during the application of DAMGO or DMSO (corresponding to inhibition values smaller than −100%) are not shown in the scatter plots. These data, however, were included in the calculation of mean and SEM as shown in the bars. (c) With a different application protocol, AITC-sensitive DRG neurons were selected and tested for inhibition of the AITC-evoked Ca2+ signals by DAMGO (3 µM). Averaged traces show that the AITC-evoked Ca2+ signals were not strongly inhibited by DAMGO, regardless of whether they were PS-sensitive (green trace: n = 107 neurons) or not (red trace: n = 132 neurons, recordings of both traces come from the same eight recordings, all cells were from one mouse). (d) Statistical summary of the experiments in (c). The dot-like symbols in (b) and (d) on the right of the columns represent inhibition values of single cells. Data obtained for TRPV1 channels with the same stimulation protocol as in (c) are shown in Figure 4—figure supplement 1. Examples of recordings from individual DRG neurons are shown in Figure 4—figure supplement 2. (e) HEK cells overexpressing TRPV1 and µORs were exposed to 0.1 µM capsaicin and 3 µM DAMGO (blue trace, n = 81 cells, three recordings). Control cells were only transfected with TRPV1 (black trace, n = 94 cells, three recordings). (f) In similar experiments CHO cells expressing TRPA1 and µORs were exposed to 50 µM AITC and 3 µM DAMGO (blue trace, n = 53 cells, two recordings). In control experiments, CHO cells expressing only TRPA1 were treated identically (black trace, n = 65 cells, two recordings). (g) In further experiments, HEK cells expressing TRPM8 and µORs (blue trace, n = 103 cells, two recordings) or only TRPM8 (black trace, n = 64 cells, two recordings) were exposed to 200 µM menthol and 3 µM DAMGO. In (e–g), application of DAMGO did not lead to a reduction of Ca2+ signals evoked by the specific agonists of TRPV1, TRPA1 and TRPM8, indicating that these channels were not inhibited by activated µORs.
Figure 4—figure supplement 1
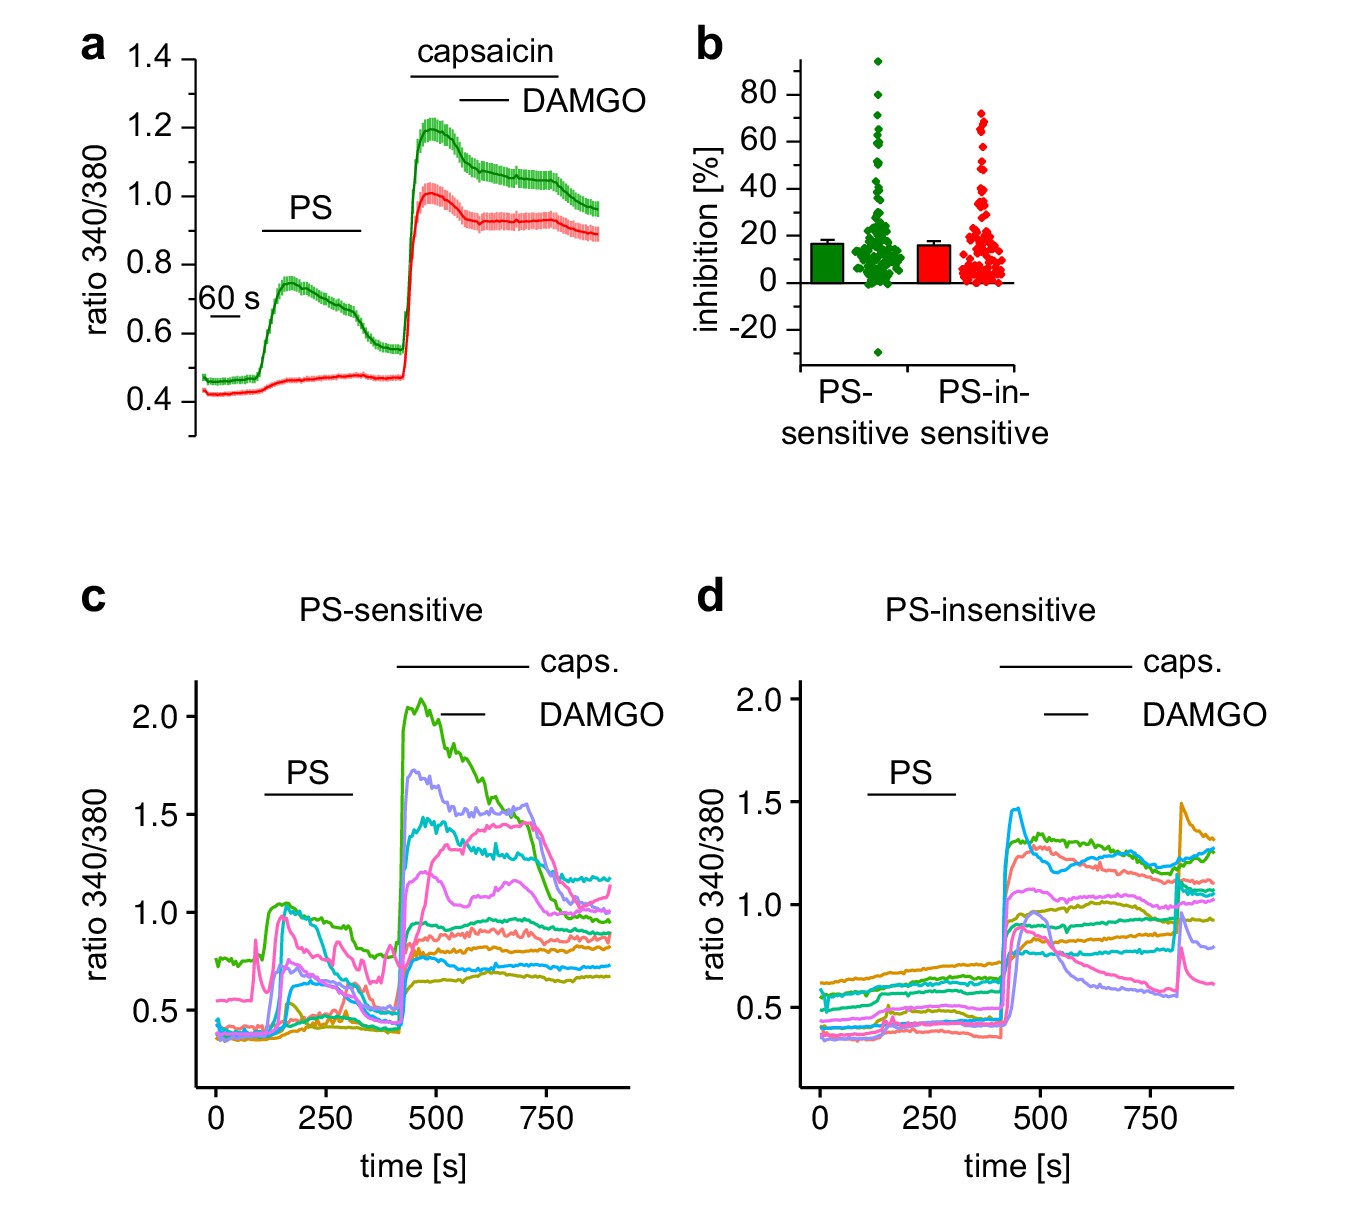
Activation of µORs in TRPV1-expressing neuronal DRG cells causes only little inhibition of TRPV1 channels.
(a) Cells were exposed for a prolonged period (40 s) to capsaicin, and during this period DAMGO was co-applied. Only a small inhibition could be detected that did not recover. This result was obtained in both, PS-insensitive (red trace: n = 103) and PS-sensitive cells (green trace: n = 137, four recordings, all cells from one animal) despite the fact that PS-sensitive cells contain a higher proportion of DAMGO-sensitive cells (see Figure 2g–h). (b) Statistical analysis of the inhibition obtained during the DAMGO application. The dot-like symbols represent the inhibition measured in individual cells. (c, d) Traces from 10 randomly chosen neuronal cells from the PS-sensitive and PS-insensitive groups are shown.
Figure 4—figure supplement 2
Example traces from individual DRG neurons of experiments shown in Figure 4.
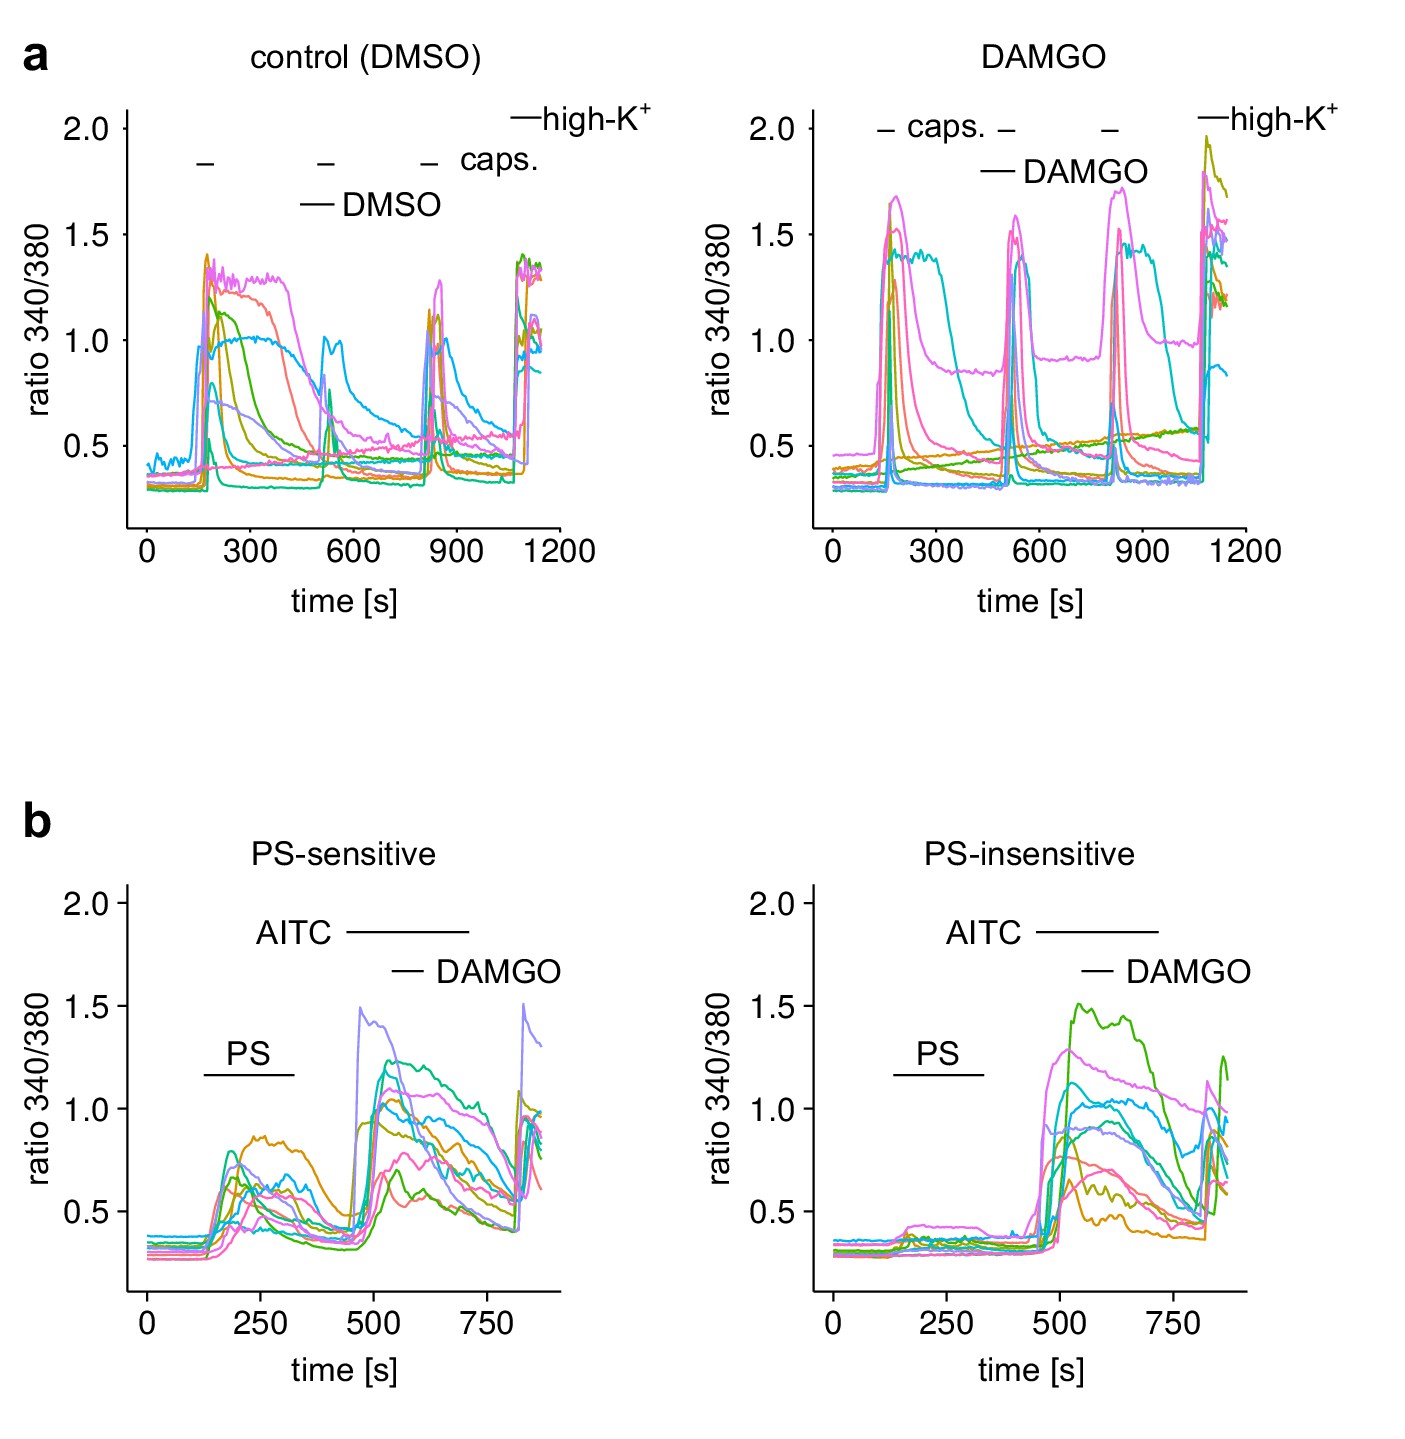
(a) The Ca2+ signal of 10 randomly chosen individual neurons from the experimental groups of Figure 4a. (b) The Ca2+ signal of 10 randomly chosen individual neurons from the PS-sensitive and PS-insensitive groups of Figure 4c.
Figure 5 with 2 supplements
Inhibition of TRPM3 by activated µORs is dependent on Gαi/o proteins, but not on cAMP or kinases.
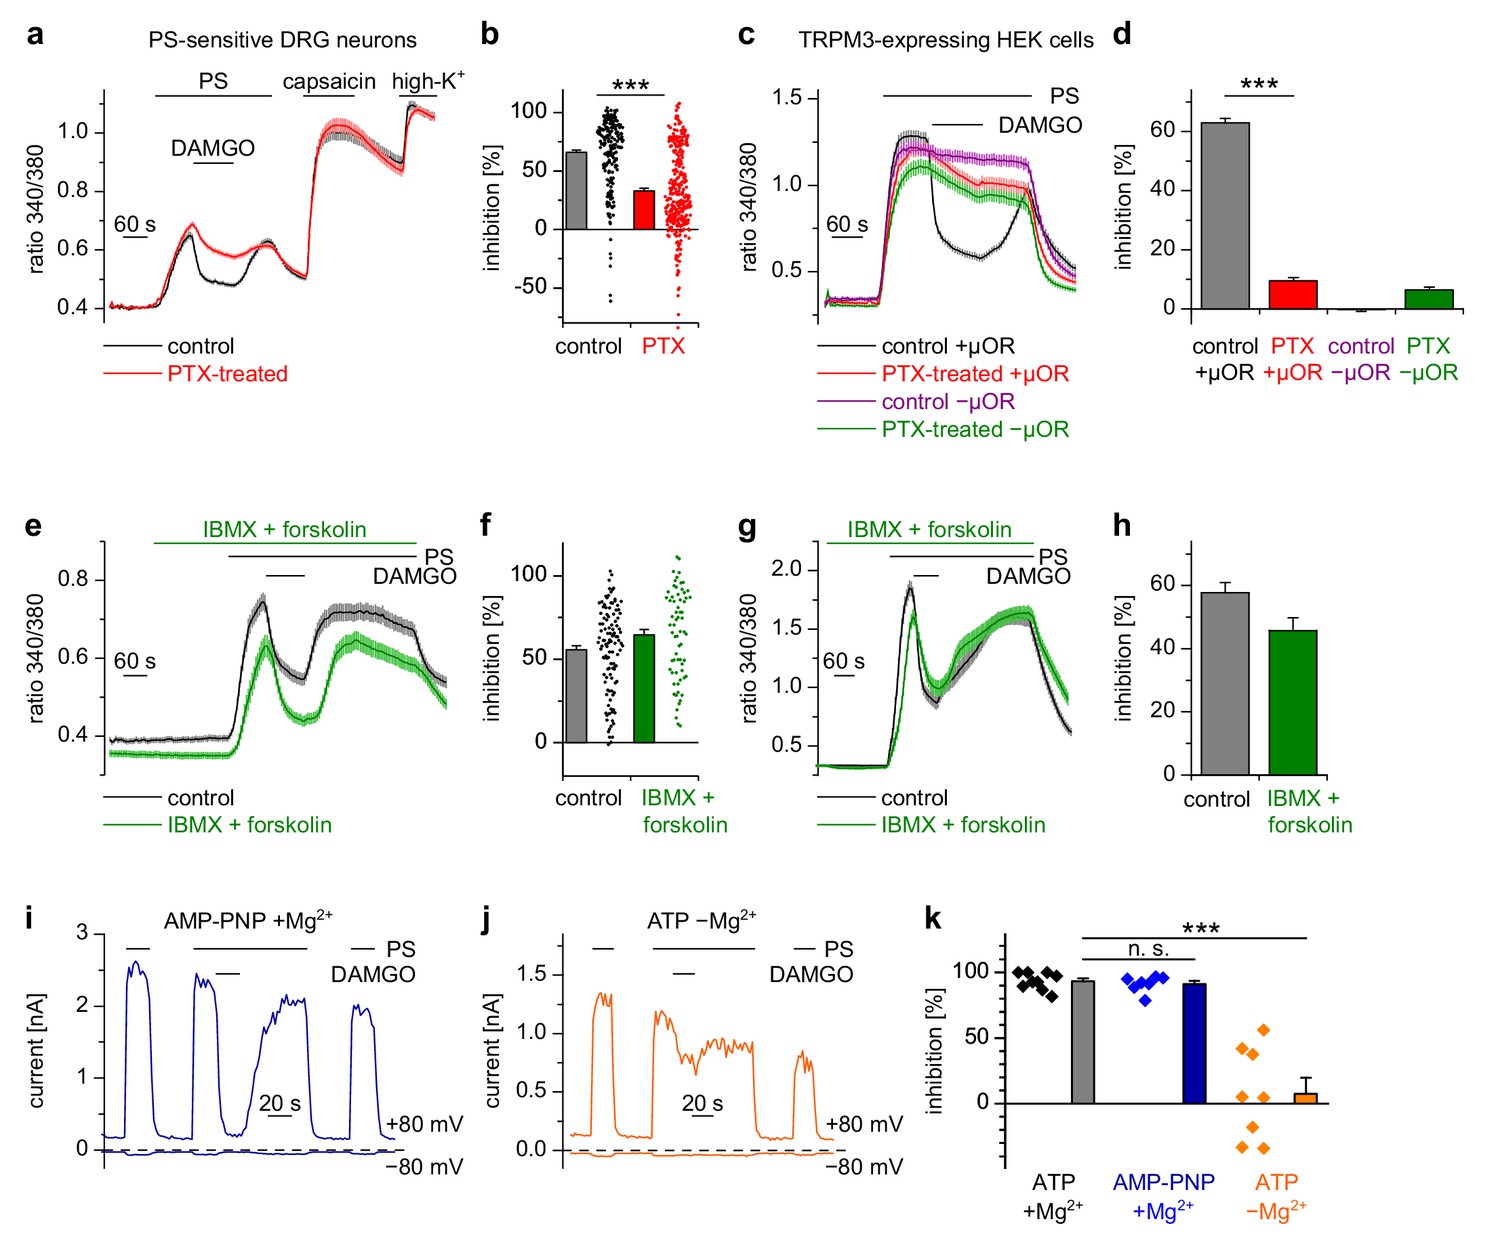
(a) Isolated DRG neurons were treated with PTX (red trace, n = 319 neurons, 14 recordings) or not treated (black trace, n = 211 neurons, seven recordings) and tested as indicated with PS (25 µM), DAMGO (3 µM) and capsaicin (2 µM). Only PS-sensitive neurons were analyzed (all cells were from three mice). (b) Statistical summary: PTX treatment significantly reduced the inhibitory effect of DAMGO. (c) In similar experiments, treatment with PTX (red trace; n = 159 cells, three recordings) abolished the inhibition of TRPM3 channels in HEK cells overexpressing TRPM3 and µORs (control black trace, n = 178 cells, three recordings). The violet trace represents additional control cells untreated with PTX that expressed TRPM3, but not µORs (n = 163 cells, same three recordings as for the black trace), the green trace represents cells treated with PTX but not transfected with µORs (n = 142 cells, same three recordings as for the red trace). (d) Statistical summary of the experiments shown in (c). (e, f) Application of forskolin (10 µM) together with IBMX (200 µM) did not prevent the action of DAMGO (0.3 µM) in isolated DRG neurons (green trace: n = 67 neurons, treated with IBMX +forskolin, three recordings; black trace: n = 114 neurons, untreated, from three recordings). In this panel, all cells are from one mouse. Example traces of individual cells of the experiments shown in (a) and (e) are shown in Figure 5—figure supplement 2. (g, h) The same result was obtained in HEK cells overexpressing TRPM3 and µORs (green trace: n = 76 treated cells; black trace: n = 91 untreated cells, five recordings for each condition). (i) In whole-cell patch-clamp recordings of HEK cells overexpressing TRPM3 and µORs, the inhibition of PS-activated TRPM3-dependent currents (25 µM PS) by 3 µM DAMGO was almost complete, even when intracellular ATP was replaced by the non-hydrolyzable analog AMP-PNP. (j) However, removal of intracellular Mg2+ abolished the inhibition by DAMGO. two exemplary recordings are shown in (i, j), an exemplary control measurement is shown in Figure 5—figure supplement 1a. In these recordings, the break-in to the whole-cell configuration occurred 200 s before the beginning of the traces shown (i.e. 300 s before the application of DAMGO). (k) Quantitative analysis of the inhibition of 9 cells under control (with ATP and with Mg2+) conditions, 7 cells with AMP-PNP (and Mg2+) and 8 cells without Mg2+ (but with ATP) at membrane potentials of +80 mV. Figure 5—figure supplement 1b demonstrates that the series resistance of the recordings was not statistically different between the experimental groups analyzed here. In (b), (f) and (k), each individual symbol represents the value obtained from a single cell.
Figure 5—figure supplement 1
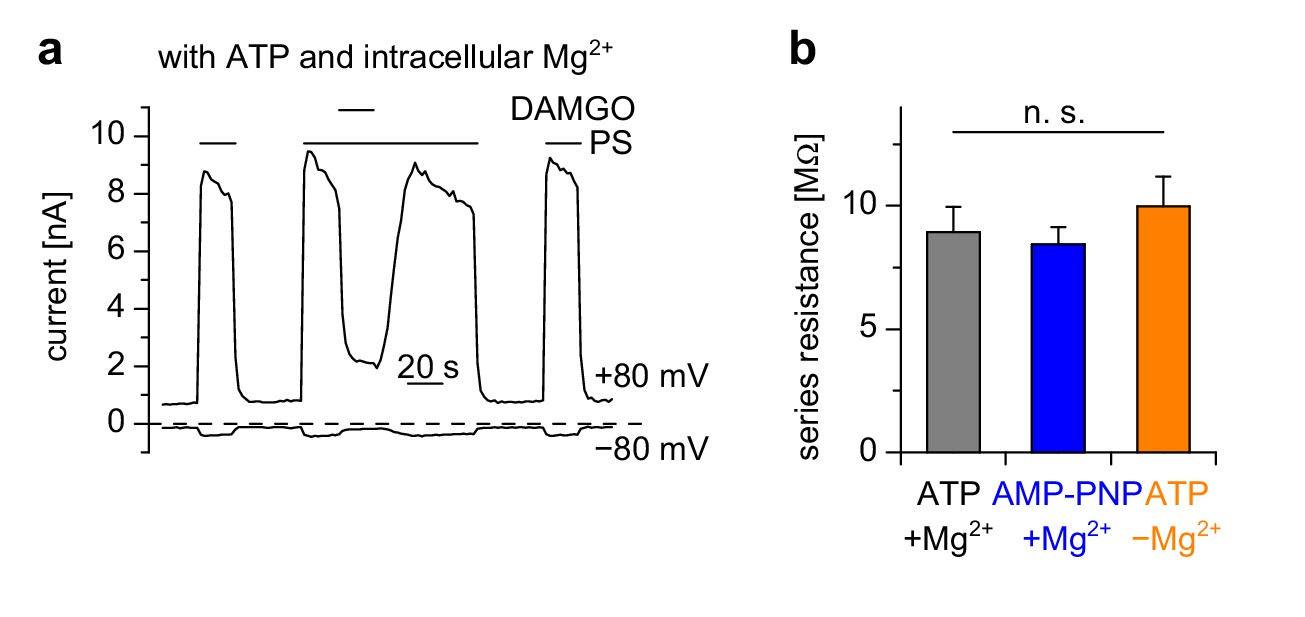
Control experiments for measurements in Figure 5i–k.
(a) Example trace for the control conditions for the experiments shown in Figure 5i–k. For these control measurements, the intracellular (pipette) solution contained Mg2+ and ATP. Shown are current amplitudes at +80 mV and −80 mV extracted from voltage ramp recordings. (b) The series resistance values were not statistically different in the three groups. Numbers of cells analyzed were n = 7–9, the same as in Figure 5k.
Figure 5—figure supplement 2
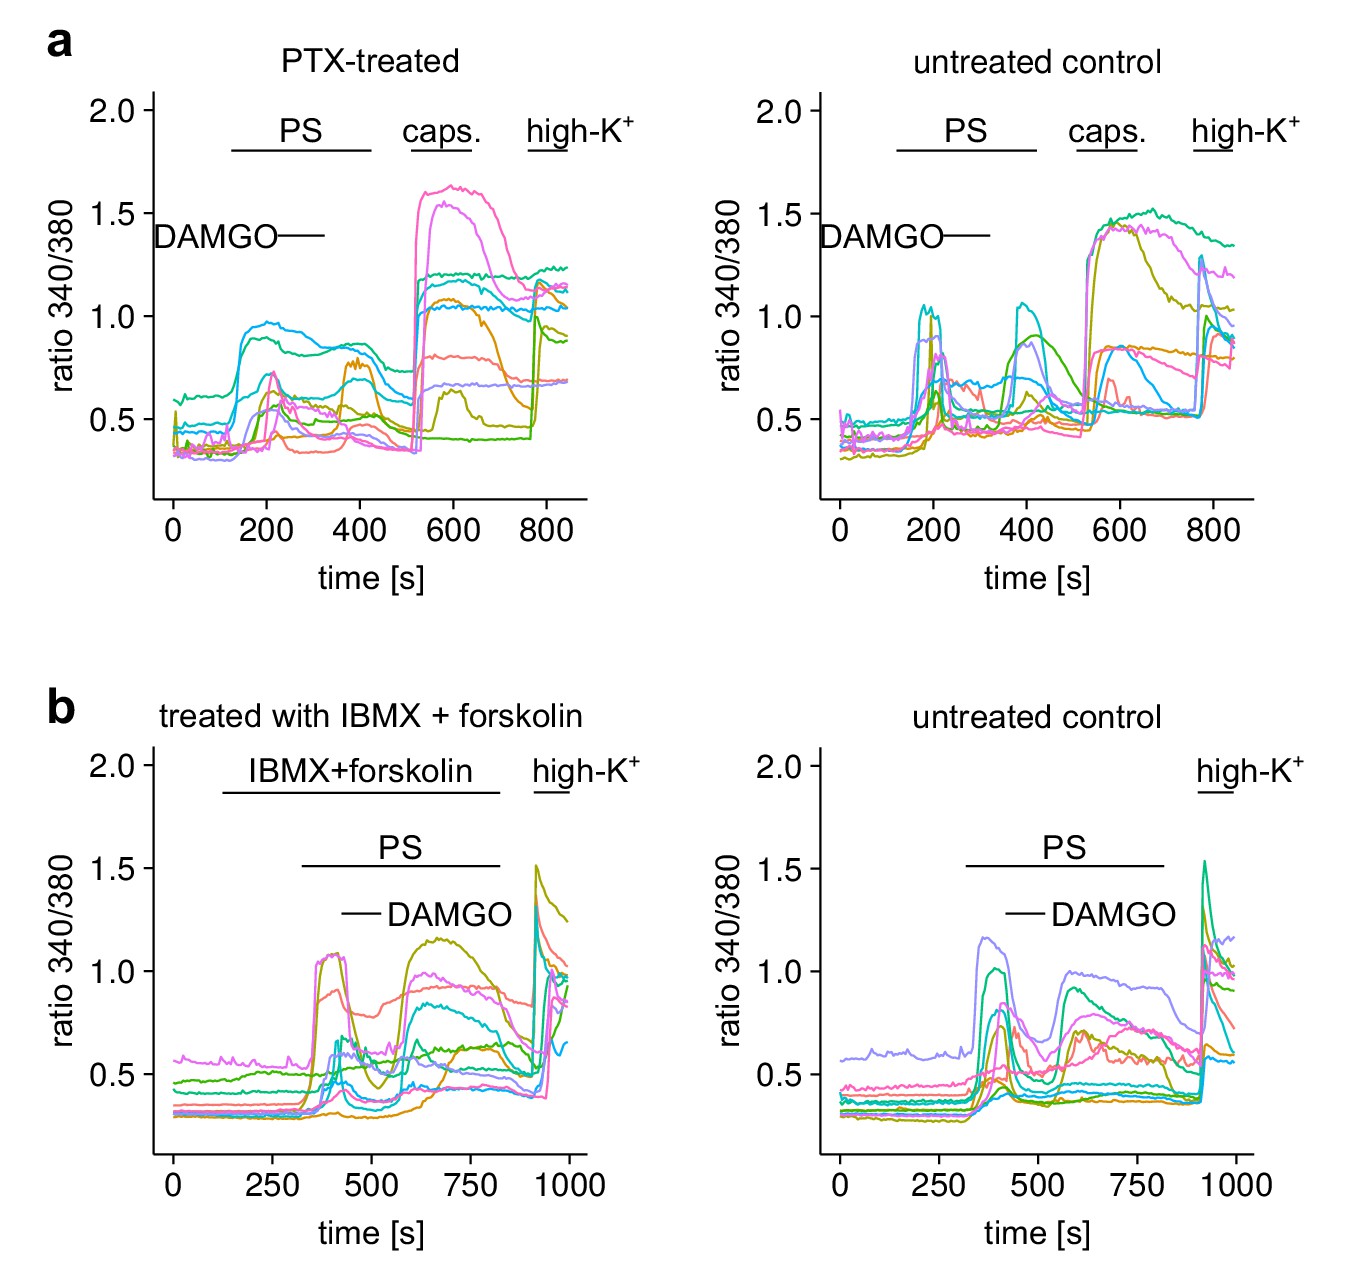
Responses of individual neurons from the experiments shown in Figure 5.
(a) 10 individual cells either treated with PTX or untreated (as control) from the experiment of Figure 5a,b are shown. (b) Equally, 10 cells from the two treatment groups of Figure 5e,f are shown.
Figure 6 with 1 supplement
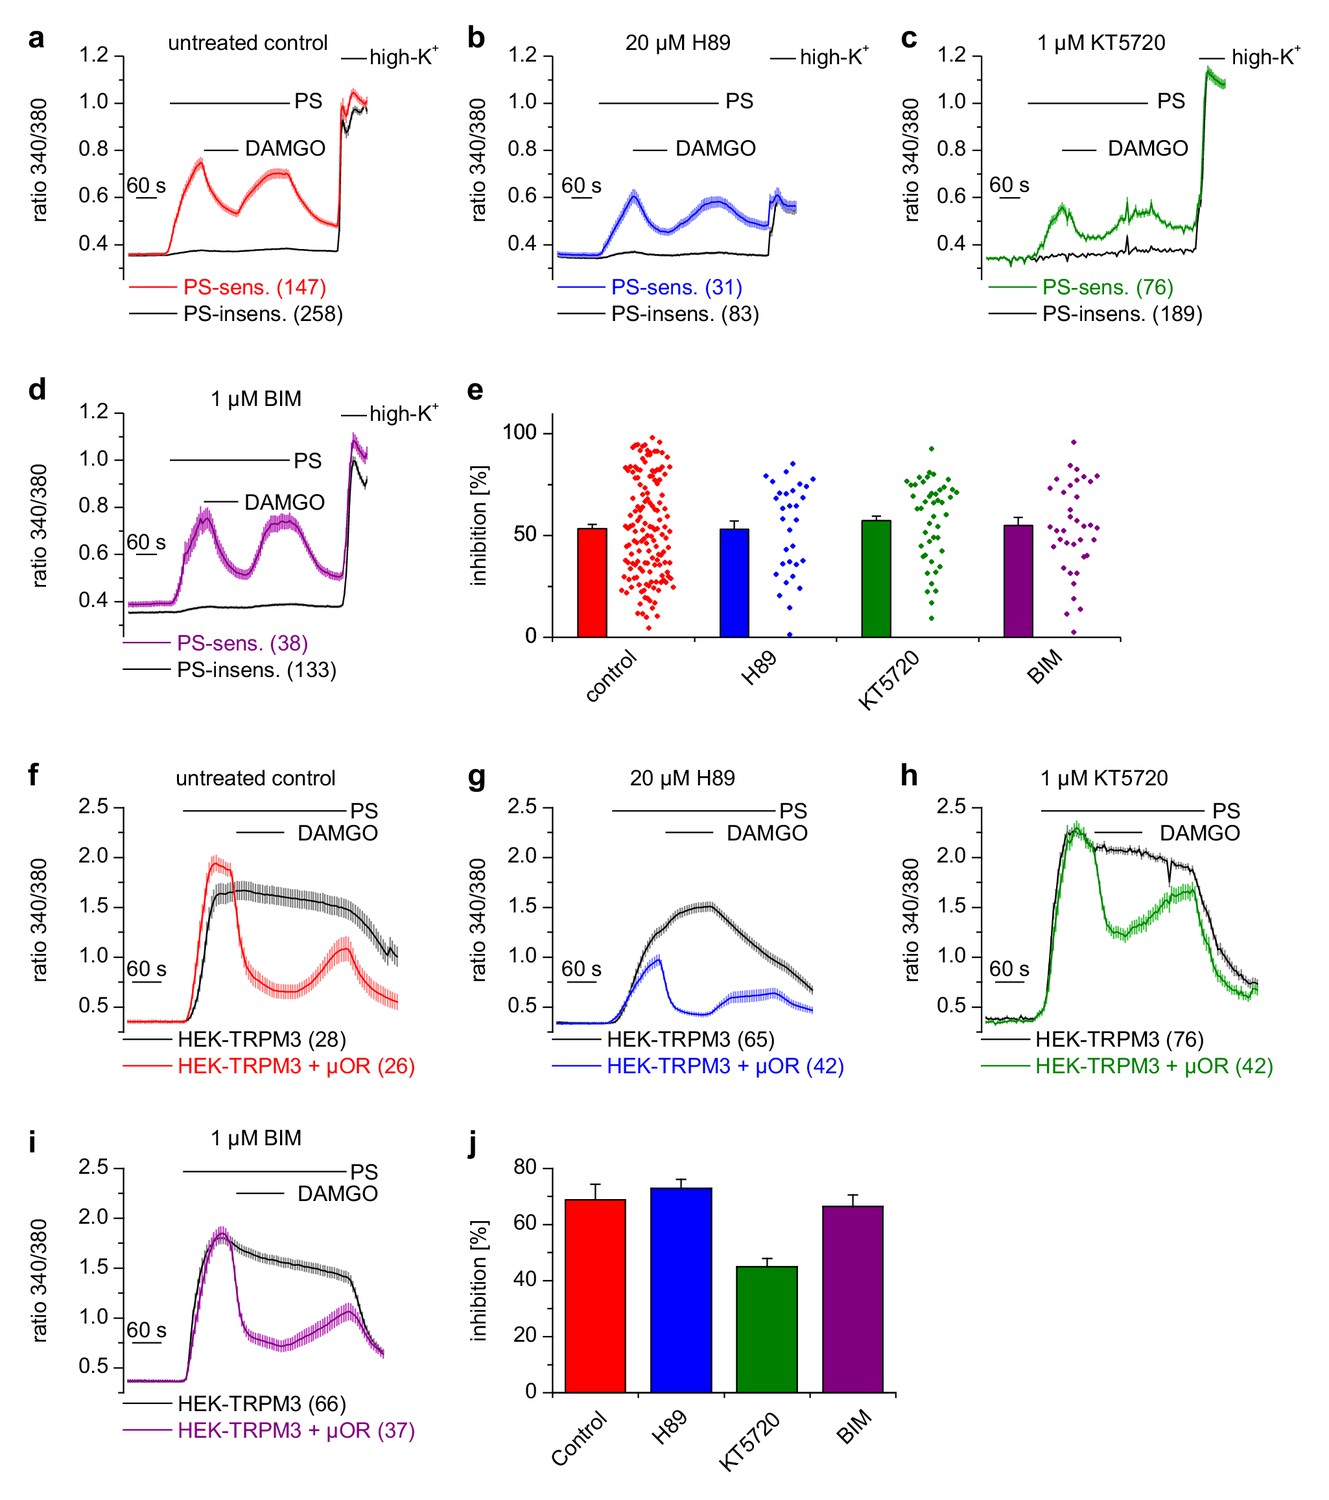
Inhibition of TRPM3 channels is not blocked by kinase inhibitors.
(a–e) Isolated DRG neurons were treated with kinase inhibitors for 30 min before the response to 25 µM pregnenolone sulfate (PS) and its inhibition by 0.3 µM DAMGO was assayed. Colored traces represent PS-sensitive, black traces PS-insensitive neurons, all treated as indicated (control cells were exposed to the equivalent amount of vehicle, 0.1% DMSO). In panels (a–d), the number of neurons averaged is indicated in brackets, they were isolated from two mice and measured in 3 (panels b–d) or six recordings (panel a). (e) Quantitative summary of the inhibition induced by DAMGO shows that treatment with kinase inhibitors did not impede the inhibitory action of µORs. The dot-like symbols on the right side of the bars indicate inhibition measured in individual cells. Example traces of individual cells are shown in Figure 6—figure supplement 1. (f–i) Similar experiments on HEK cells overexpressing TRPM3 and µORs (colored traces) or only TRPM3 (black traces). The number of cells averaged is indicated in brackets. They were measured in three (panel f) or four (panels g–i) recordings. (j) Quantitative summary showing that the treatment with the indicated kinase inhibitors did not prevent the inhibitory action of activated µORs. Unspecific effects on TRPM3 and other Ca2+ channels were observed, especially with 20 µM H89 (b, g), which, however, does not change the main conclusion that kinases are not involved in the inhibitory actions of µORs on TRPM3 channels.
Figure 6—figure supplement 1
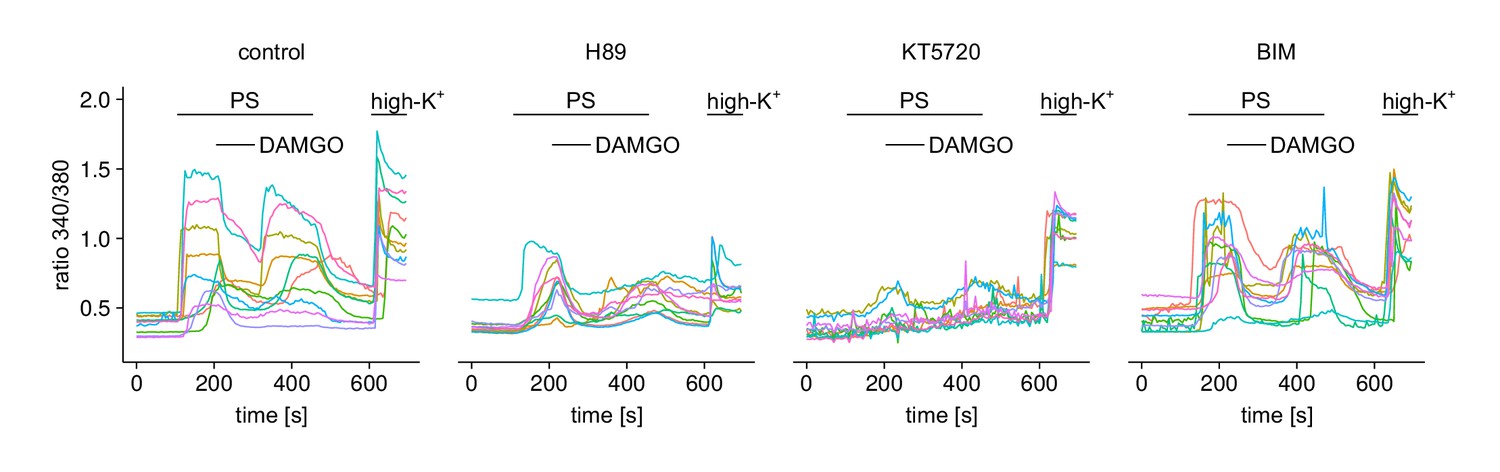
Responses of individual cells (10 in each panel) under one of the four treatment conditions from Figure 6a–e.
https://doi.org/10.7554/eLife.26280.022
Figure 7 with 3 supplements
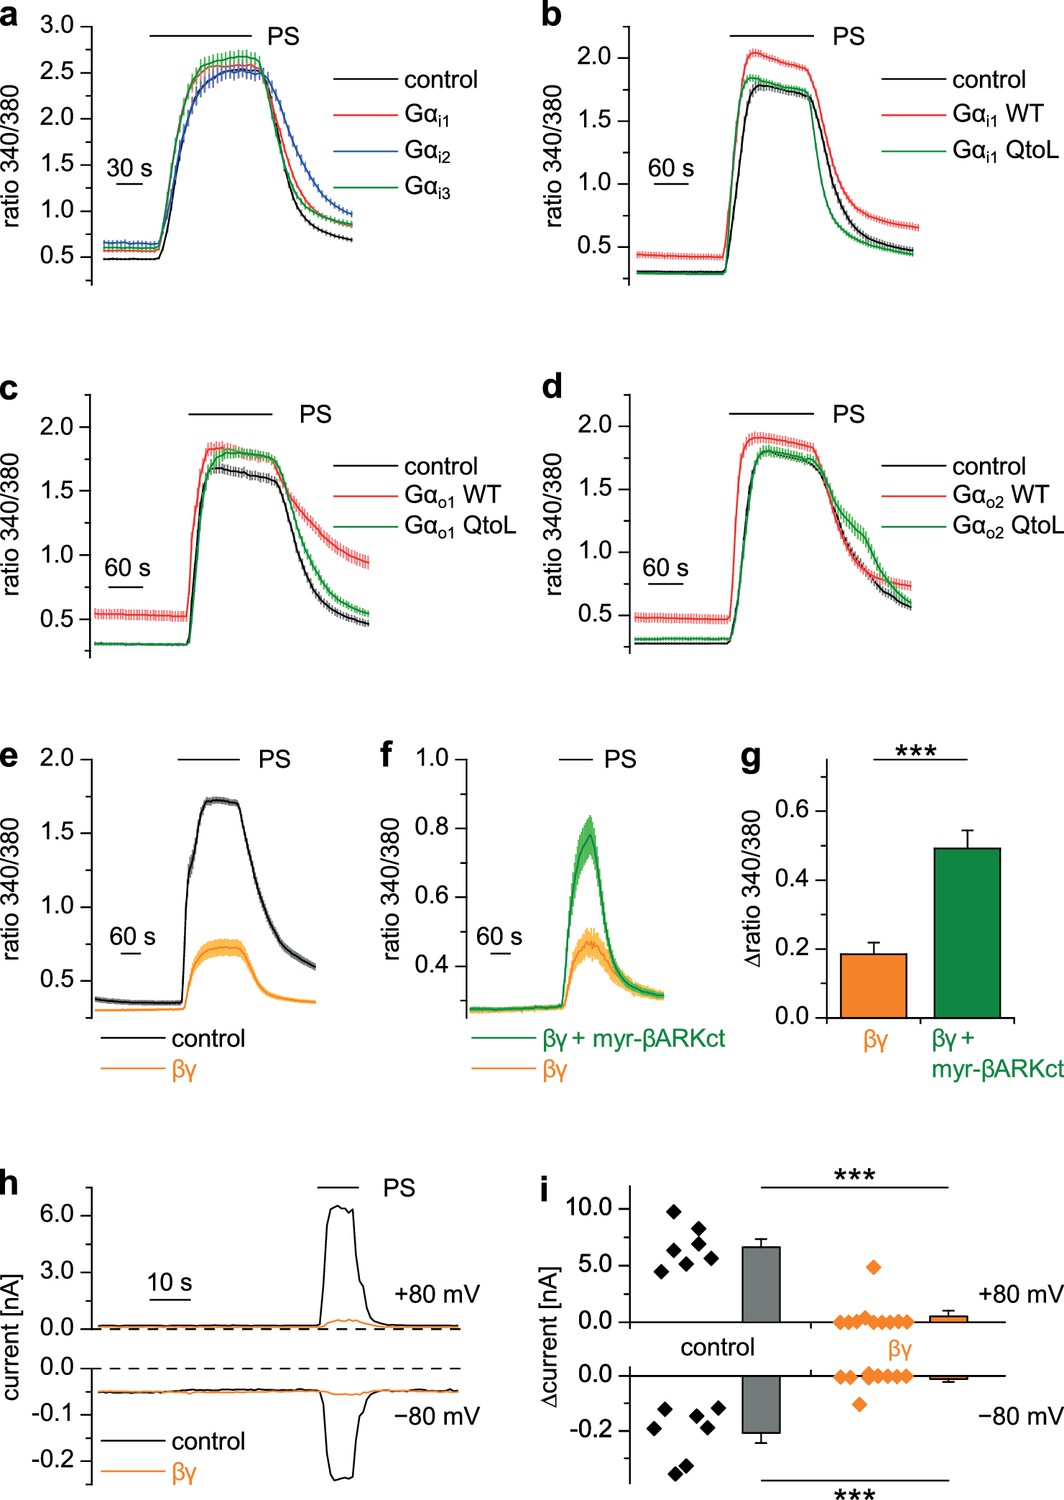
Gβγ dimers, but not the αi or αo subunits of G proteins inhibit TRPM3 channels.
(a–d) TRPM3-expressing HEK cells were transfected with various G protein subunits (and Ds-Red for marking successfully transfected cells): (a) Gαi1 (red trace: n = 178 cells, four recordings), Gαi2 (blue trace: n = 123 cells, three recordings) or Gαi3 (green trace: n = 147 cells, four recordings; black control trace: n = 124 cells, four recordings), (b) Gαi1 as wild-type protein (red trace: n = 189 cells, four recordings) or with the Q204L (QtoL) mutation that renders the Gα subunit constitutively active (green trace: n = 128 cells, three recordings; black control trace: n = 92 cells, two recordings), (c) with wild-type Gαo1 (red trace: n = 75 cells, three recordings) or constitutive active (QtoL mutated) Gαo1 (green trace: 87 cells, four recordings; black control trace: 77 cells, three recordings), or (d) with wild-type Gαo2 (red trace: 101 cells, three recordings) or with QtoL mutated Gαo2 (green trace: 75 cells, three recordings; control cells shown as black trace: 114 cells, three recordings). In these experiments, control cells were mock-transfected with a vector expressing only GFP. None of the overexpressed Gα proteins reduced the PS-induced TRPM3 activation. Experiments with overexpression of additional Gα subunits are presented in Figure 7—figure supplement 1. (e) In contrast, overexpressing Gβ1 and Gγ2 proteins in TRPM3-expressing HEK cells strongly reduced TRPM3 channel activity (orange trace: n = 68 cells, four recordings; control cells were mock-transfected, black trace: n = 72 cells, four recordings). (f) This inhibition was reduced by concomitantly overexpressing Gβγ-scavenging myristoylated βARKct (green trace: n = 70 cells, four recordings, compared to the orange trace: n = 41 cells, three recordings). (g) Statistical analysis of the experiment shown in (f). (h) Exemplary whole-cell patch-clamp recordings showing the reduction of PS-induced TRPM3 channel activity in cells transfected with Gβ1 and Gγ2. (i) Statistical analysis of 7 control cells and 10 cells transfected with Gβ1 and Gγ2, evaluated at two different holding potentials (+80 and −80 mV). The effect of Gβγ-scavengers on µOR-induced inhibition of TRPM3 was also investigated and the results are shown in Figure 7—figure supplement 2. The effect of application of mSIRK (which releases Gβγ without receptor activation) on TRPM3-dependent Ca2+ signals is shown in Figure 7—figure supplement 3.
Figure 7—figure supplement 1
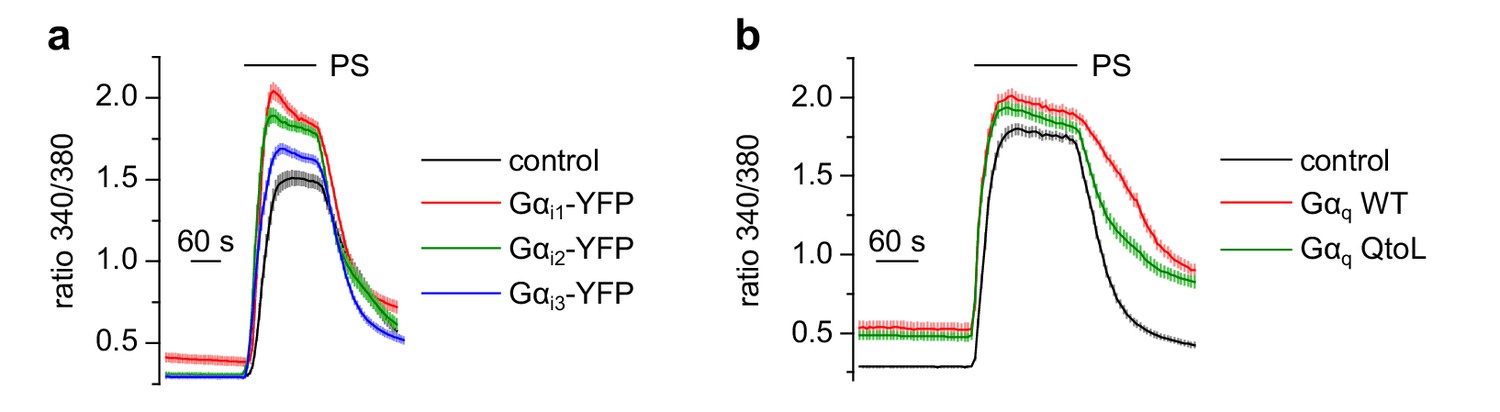
Overexpression of additional Gα proteins did not inhibit TRPM3 channels.
(a) Gαi1 (red trace: 86 cells, three recordings), Gαi2 (green trace: 94 cells, three recordings) or Gαi3 proteins (blue trace: 77 cells, three recordings) tagged with YFP did not reduce the Ca2+ signals induced by 50 µM pregnenolone sulfate (PS) in HEK cells transfected with TRPM3 and the tagged G protein subunit. However, the positive identification of the YFP fluorescence allowed for easy control of expression of the fusion proteins. Control cells expressed TRPM3 and GFP (black trace: 53 cells, three recordings). (b) Equally, overexpression of wild-type Gαq (red trace: 76 cells, three recordings) or constitutively active Gαq proteins (QtoL mutation, green trace: 83 cells, three recordings) did not inhibit TRPM3 channels compared to control recordings where TRPM3 proteins were not co-transfected with Gα proteins (black trace: 87 cells, three recordings).
Figure 7—figure supplement 2
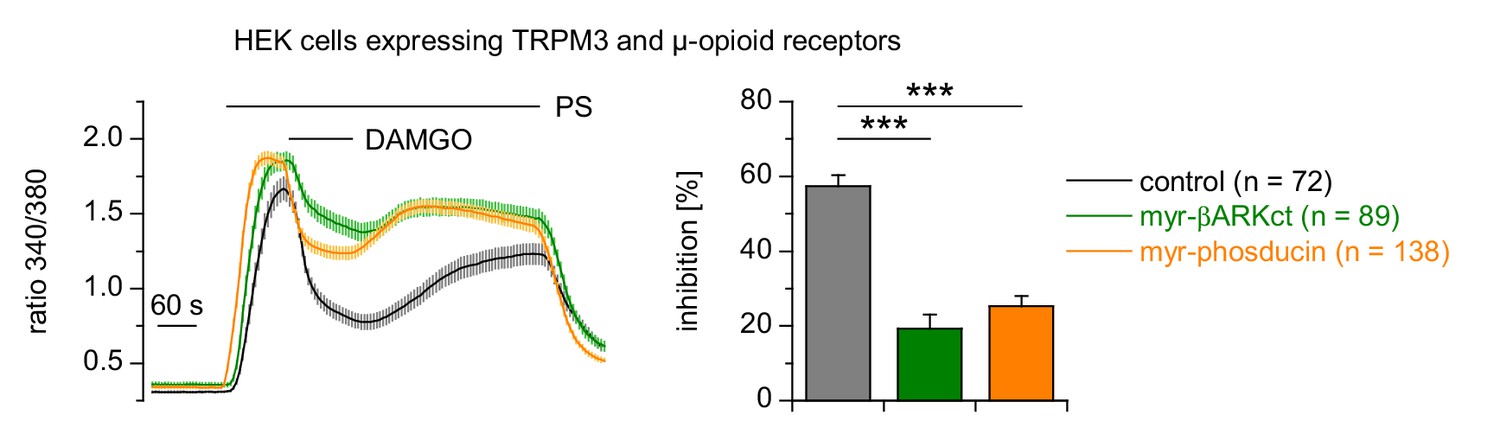
Expression of phosducin or βARKct reduced the inhibition of TRPM3 channels induced by the activation of µORs.
Myristoylated phosducin or βARKct was co-expressed with µORs and TRPM3 in HEK cells and measured in four or five recordings per trace. PS was used at a concentration of 25 µM and DAMGO at 0.3 µM throughout this figure. The number of cells analyzed for each trace is given in the panel Expression of the Gβγ subunit scavengers significantly reduced the inhibition ofTRPM3 channels caused by the activation of µORs with DAMGO.
Figure 7—figure supplement 3
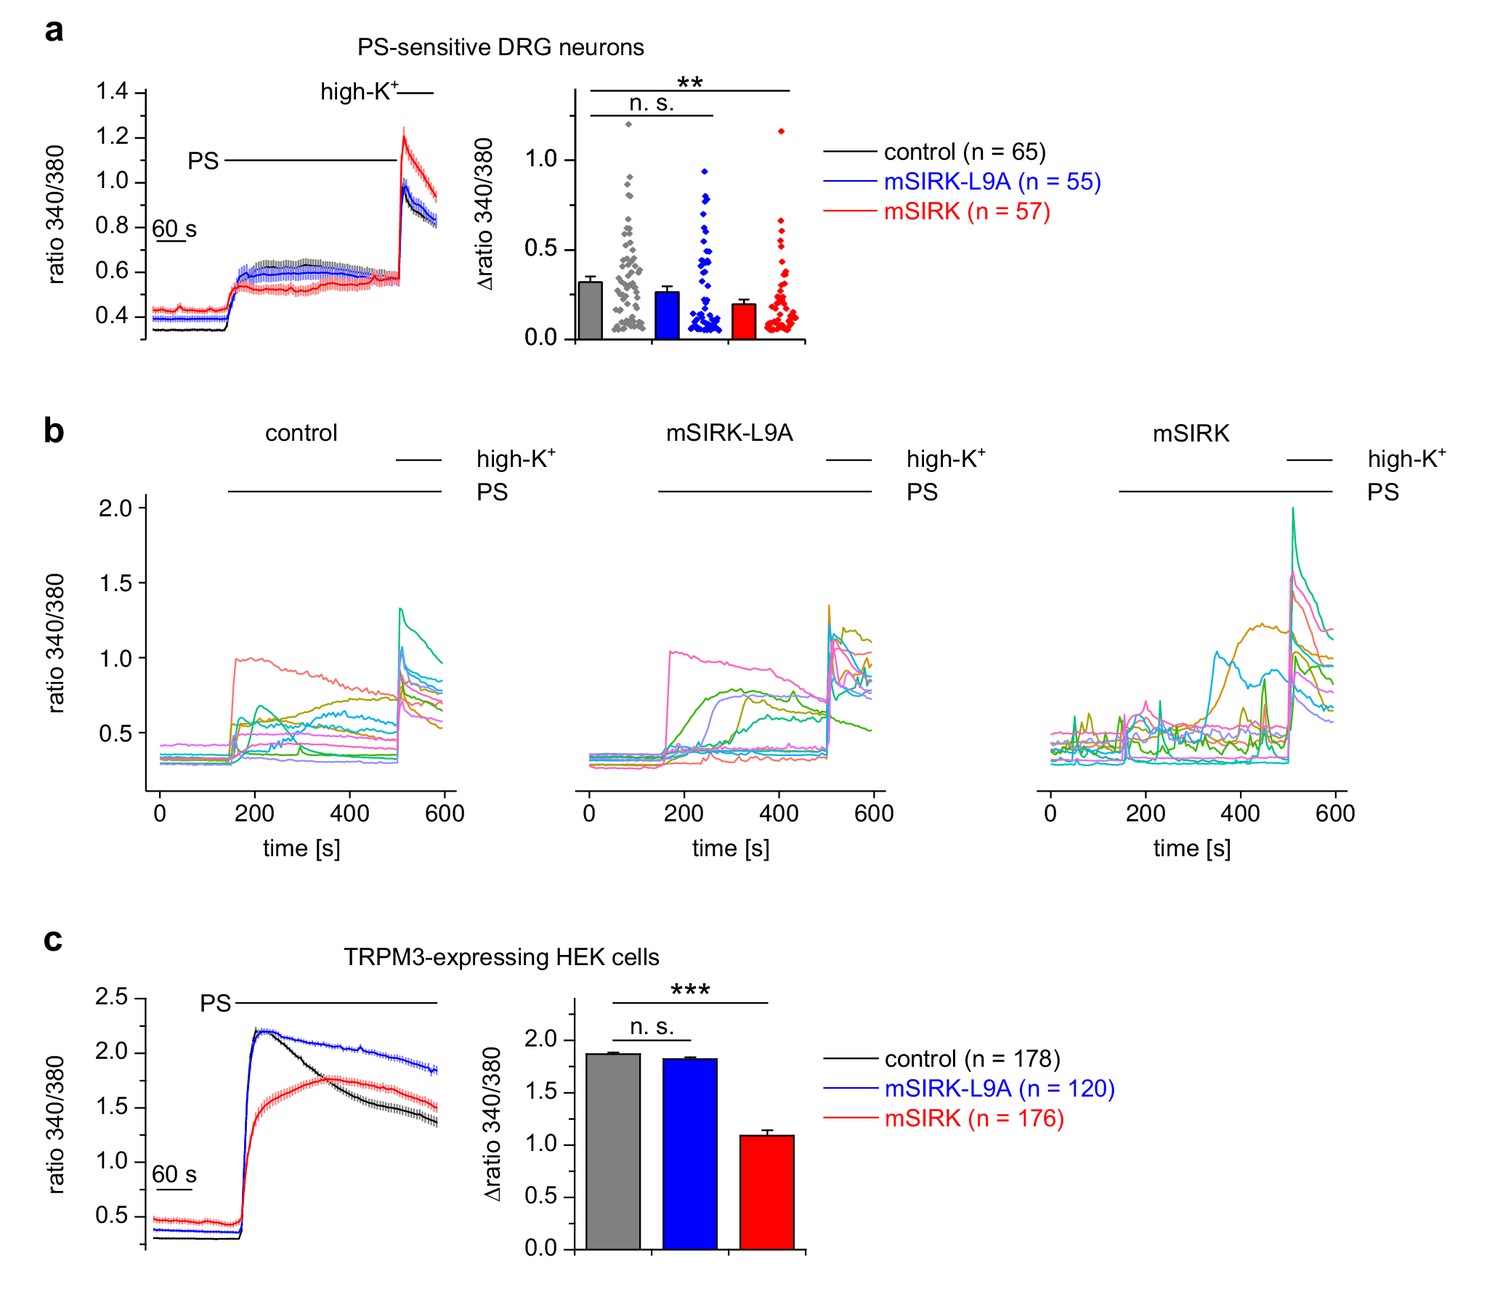
Interfering with Gβγ proteins through exogenous peptides influences TRPM3 activity.
(a) Isolated DRG neurons were incubated with the peptide mSIRK (red trace) that has been reported to separate heterotrimeric Gα subunits from Gβγ subunits without GDP/GTP exchange on the Gα subunit, thereby increasing Gβγ concentrations without increasing the concentration of activated Gα. This manipulation reduced the Ca2+ signals induced by pregnenolone sulfate (PS) compared to vehicle-treated (0.3% DMSO, black trace) cells, but also increased the basal Ca2+ concentration in unstimulated neurons. The effect of the inactive analog mSIRK-L9A (blue trace) was not significant. All traces in this panel were measured in three recordings each, all cells were from one mouse. The number of cells assayed is indicated in brackets, the values obtained for individual cells are shown as dot-like symbols on the right side of the bars. For categorizing the cells as PS-sensitive, a reduced threshold (change in Fura2 ratio larger than 0.05) was used, as described in the Materials and methods section. (b) Traces from 10 randomly chosen individual cells from the three experimental groups shown in (a). (c) Similar experiments as in (a), but using HEK cells stably transfected with TRPM3 (measured in two or three recordings per trace). Again, only mSIRK, but not mSIRK-L9A, reduced PS-induced Ca2+ signals.
Figure 8 with 3 supplements
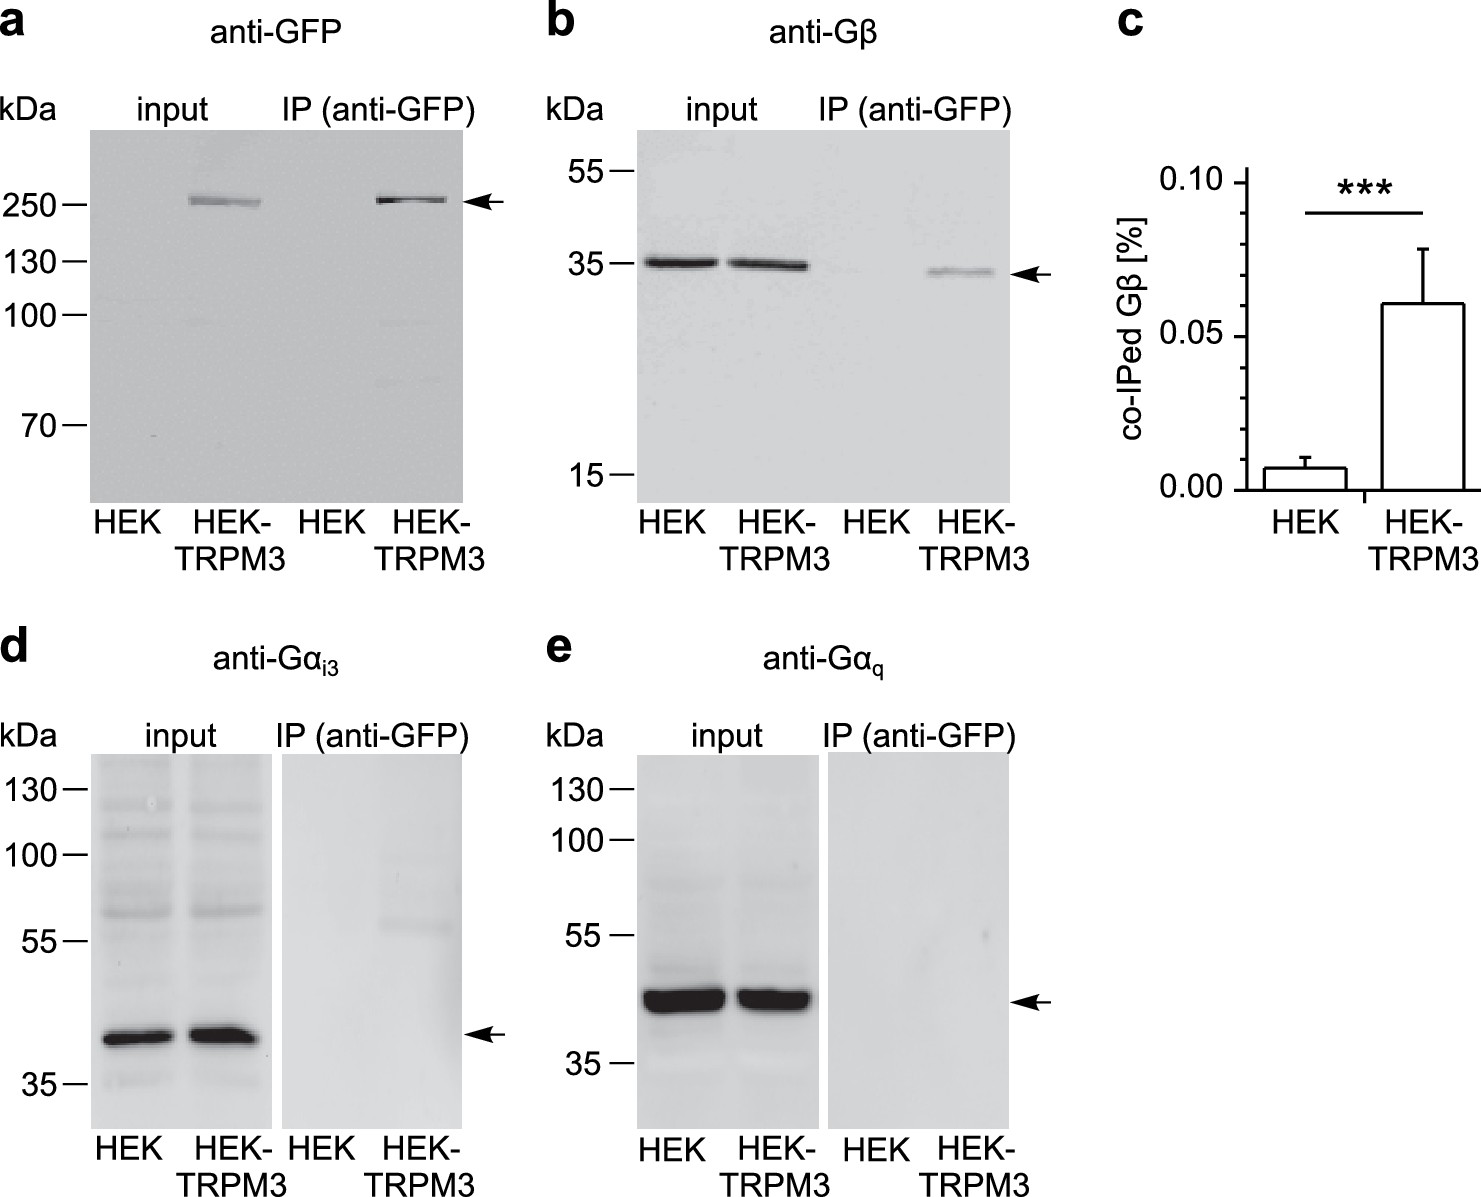
TRPM3 proteins form a complex with β subunits of G proteins.
In co-immunoprecipitation experiments, myc-TRPM3-YFP was precipitated from transfected HEK cells with anti-GFP coated beads (in control experiments we first determined that these tags do not interfere with TRPM3 function, see Figure 8—figure supplement 1). Untransfected HEK cells were used as control. After separation by SDS-PAGE and western-blotting, proteins were detected with antibodies. Antibodies against (a) GFP (these antibodies also detect YFP, one representative blot out of four is shown), (b) Gβ (one of seven blots is shown), (d) Gαi3 (one of four blots is shown) or (e) Gαq (one of two blots is shown) were used. Input represents a defined total lysate fraction. (c) After densitometric quantification of immunoprecipitation experiments similar to those shown in (b), the amount of co-immunoprecipitated Gβ subunits was normalized to the total amount of Gβ in the lysate and averaged (data were obtained from seven individual blots originating from seven independent experiments). Significantly more Gβ protein was precipitated from cells expressing myc-TRPM3-YFP than from untransfected control cells. The densitometric values for each individual blot are shown in Figure 8—figure supplement 2. Additional blots testing the specificity of antibodies against Gαi3 and Gβ are presented in Figure 8—figure supplement 3.
Figure 8—figure supplement 1
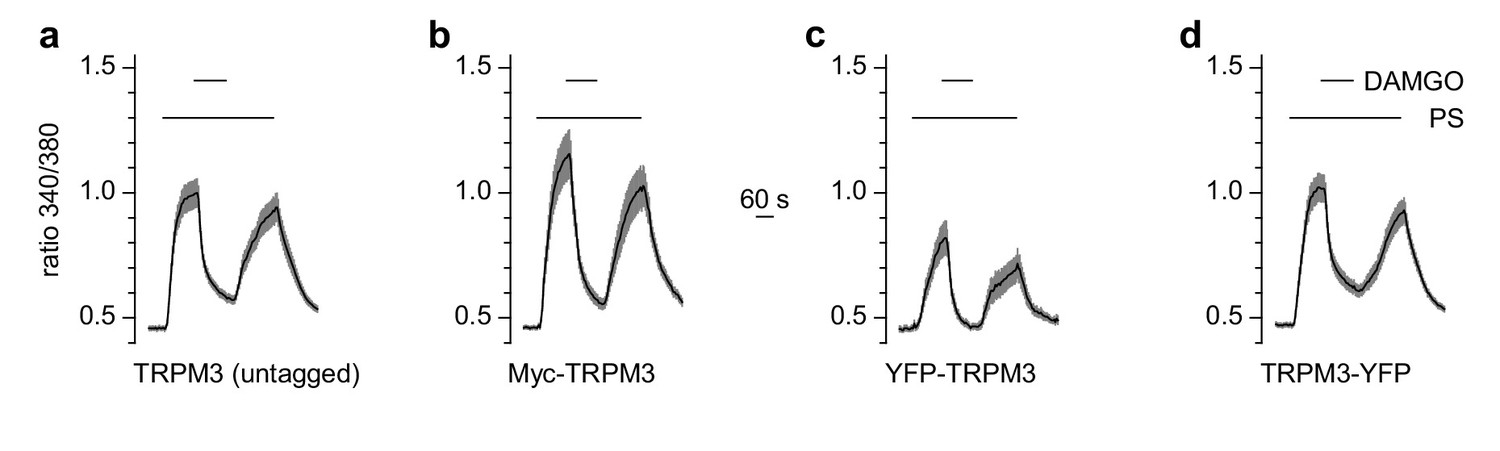
N- or C-terminal tags on TRPM3 proteins do not compromise their functional properties.
HEK cells were transfected transiently with µOR and TRPM3 cDNA. (a) Wild-type TRPM3 (n = 94 cells, three recordings), (b) TRPM3 with an N-terminal myc-tag (n = 68 cells, three recordings), (c) TRPM3 with an N-terminally fused YFP (n = 32 cells, three recordings) and (d) TRPM3 with a C-terminally fused YFP (n = 117 cells, three recordings) were assayed in Ca2+ imaging experiments. While the magnitude of the Ca2+ signals varied (probably due to differences in transfection and expression efficiencies), the ability of pregnenolone sulfate (PS) to activate TRPM3 channels and of µOR agonists to inhibit TRPM3 activity was preserved in all tagged TRPM3 constructs.
Figure 8—figure supplement 2
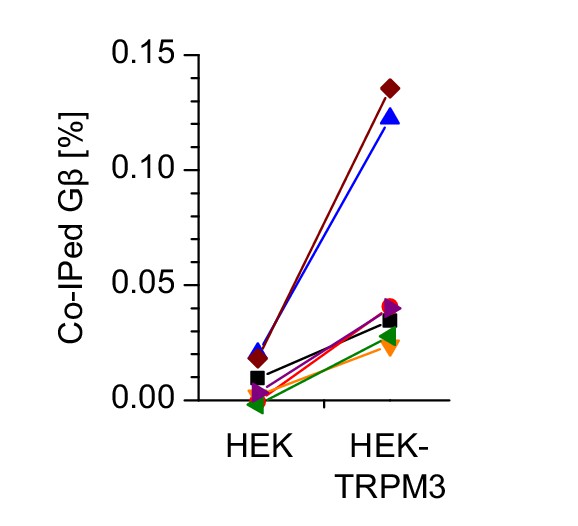
Densitometric data from individual western blots used for the statistical analysis in Figure 8c.
The amount of co-immunoprecipitated Gβ subunits is expressed as percentage of the total amount of Gβ in the lysate. Each combination of color and symbol represents data from a single blot.
Figure 8—figure supplement 3
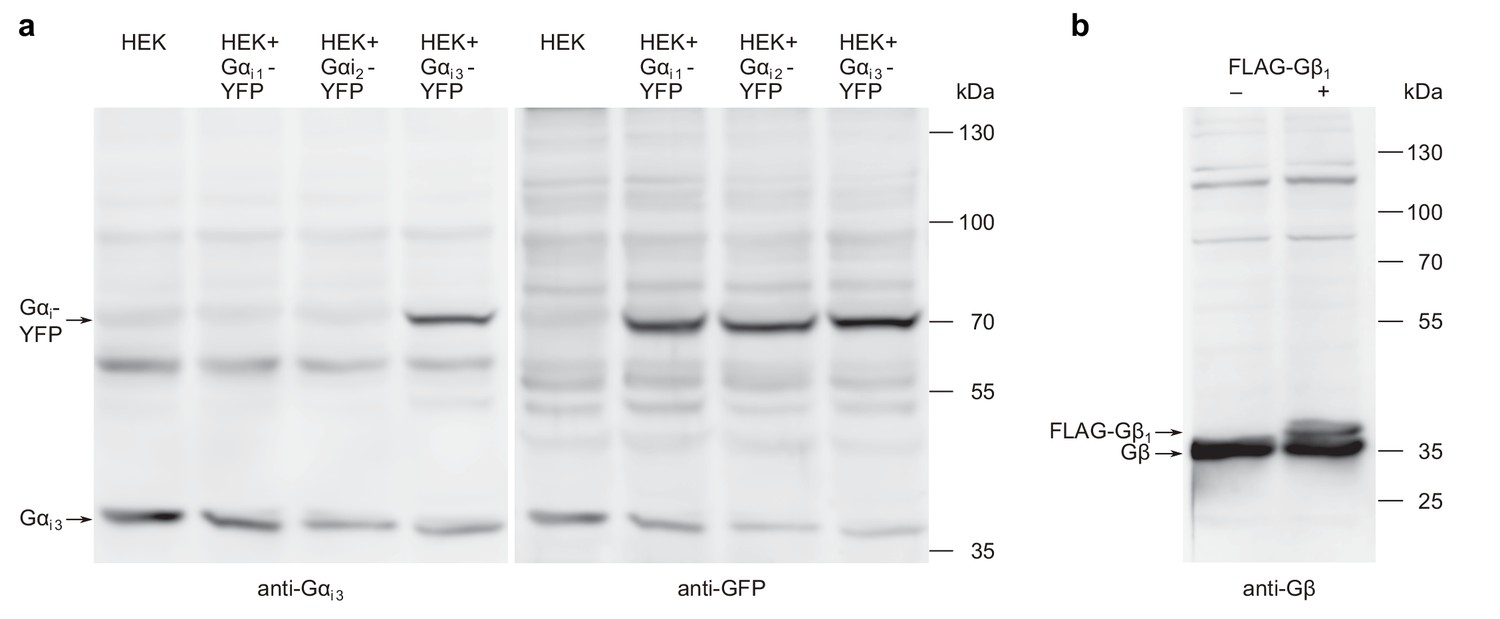
Western blots used for testing of antibody specificity and degradation of G proteins.
(a) The antibodies against Gαi3 and YFP detect Gα subunits at the expected molecular weight. HEK cells transfected with Gαi-YFP cDNAs and mock transfected cells were subjected to western blotting. Gαi3 and Gαi3-YFP proteins were visualized with anti-Gαi3 antibodies (left panel) and afterwards, after extensive washing of the membrane, Gαi-YFP proteins were visualized with anti-GFP antibodies (right panel). The detected proteins appear not to be degraded. (b) Equally, Gβ and FLAG-Gβ1 proteins from transfected HEK cells and from mock transfected control cells were visualized on a western blot with anti-Gβ antibodies, showing that these antibodies detect undegraded proteins of the expected molecular weight.
Figure 9
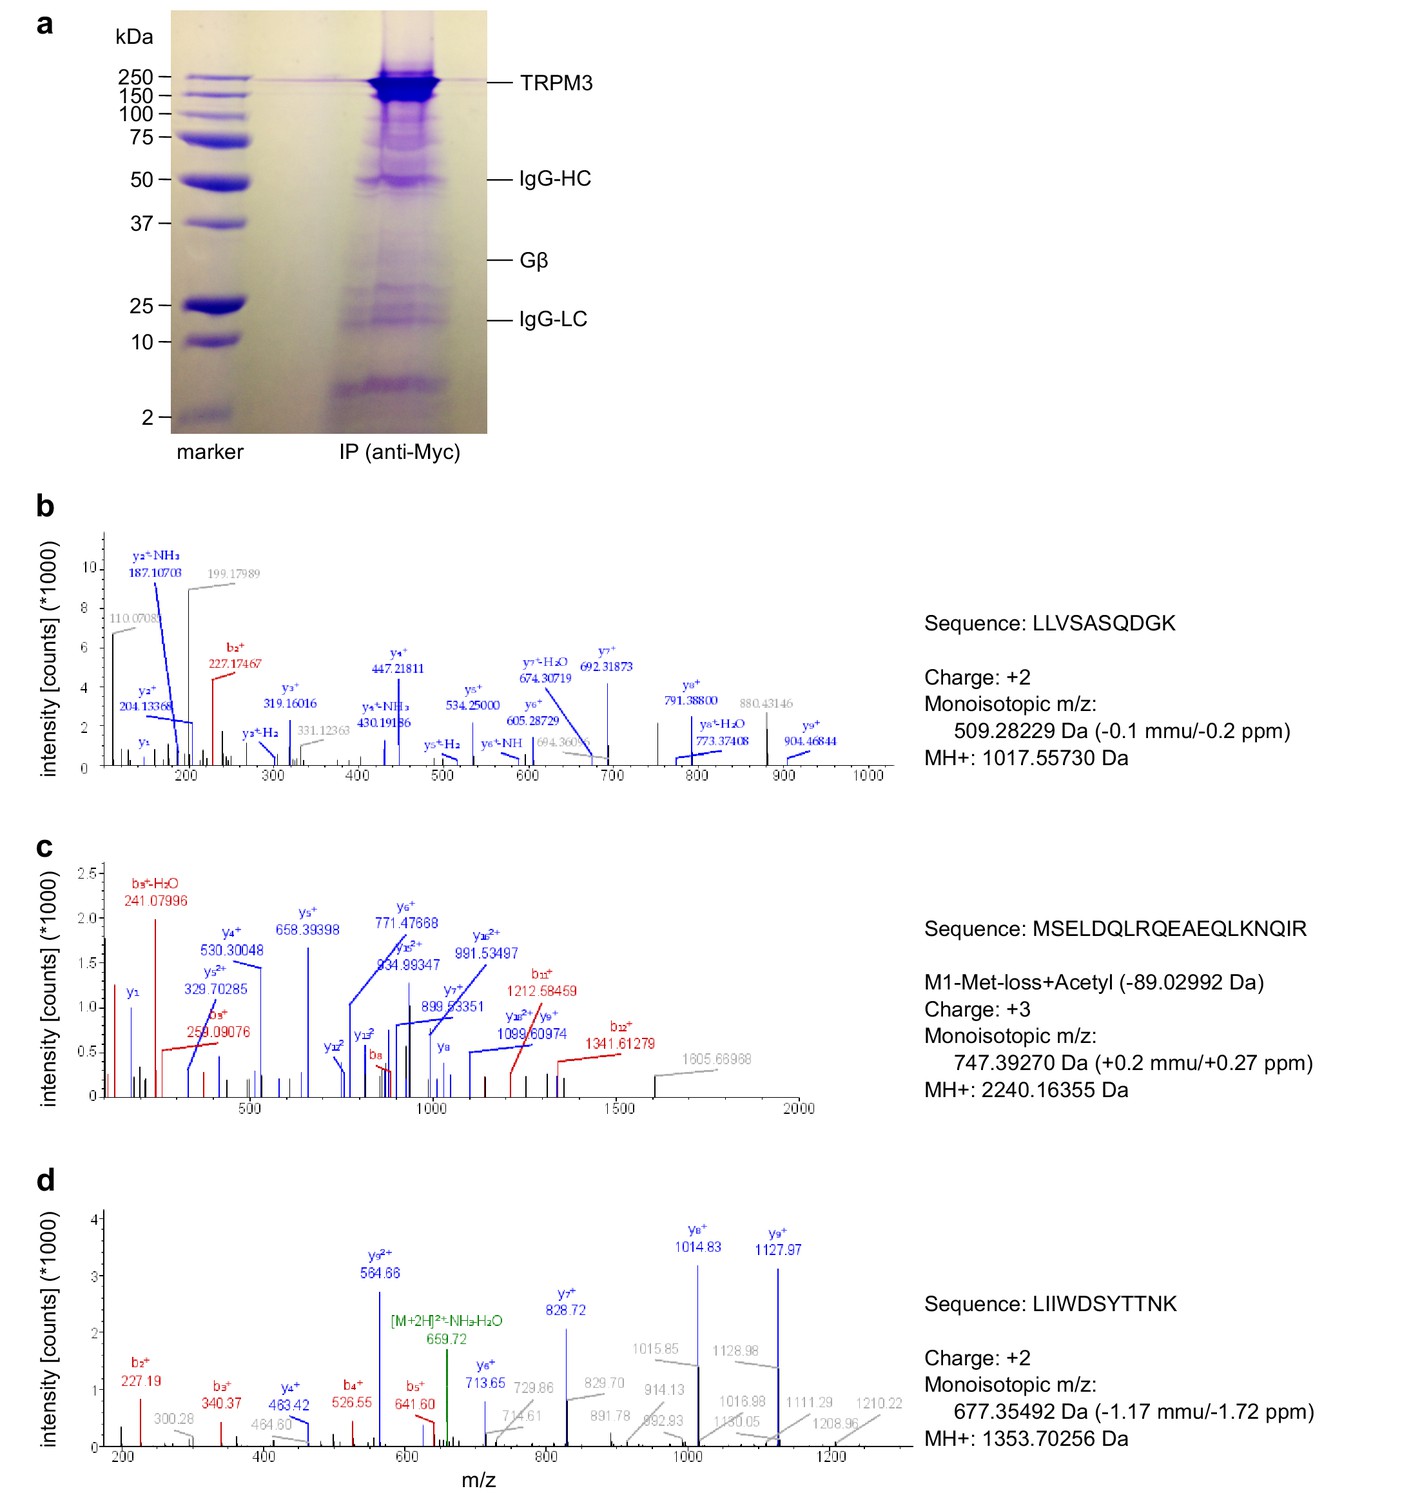
Mass spectrometry confirms the identity of Gβ1 proteins as co-immunoprecipitating with TRPM3 proteins.
(a) Coomassie blue stained SDS-polyacrylamide gel showing the proteins co-immunoprecipitated from HEK cells stably expressing myc-tagged TRPM3 using anti-myc antibodies coupled to magnetic beads. The bands corresponding to TRPM3, Gβ proteins, and the heavy and light chains of the antibodies are indicated. A representative gel of the two gels analyzed is shown. (b–d) Spectra from three different peptides originating from Gβ1 proteins co-immunoprecipitated with TRPM3. In the two different co-immunoprecipitation experiments, the peptide shown in (b) was found twice, the peptide in (c) four times and the peptide in (d) once.
Figure 10
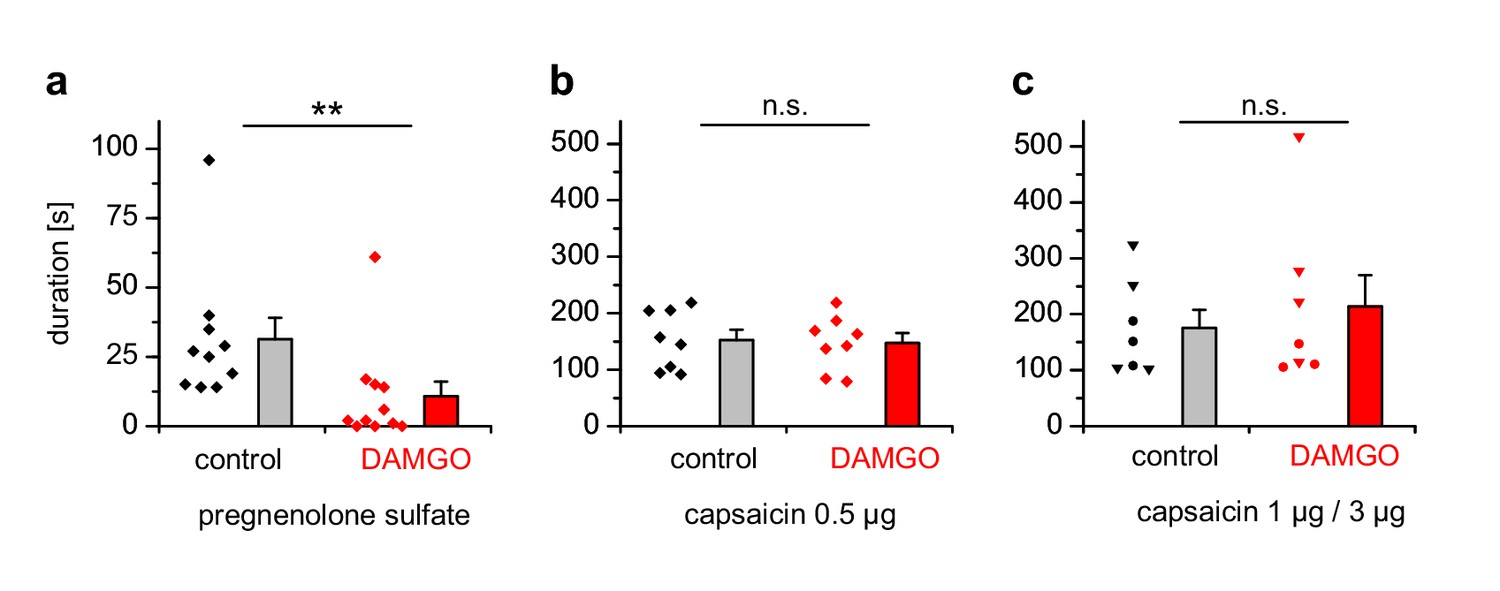
PS-induced, but not capsaicin-induced pain is reduced by co-injected µOR agonists.
(a) Mice were injected 5 nmol PS either together with vehicle as control or with 2 µg DAMGO. The duration of nocifensive behavior was analyzed (n = 10 mice for the control condition and n = 11 mice for the DAMGO condition). (b) Instead of the TRPM3 agonist, 0.5 µg capsaicin was used as TRPV1 agonist (n = 8 mice in each column). (c) An increased concentration of capsaicin (1 µg, three mice, round symbols, or 3 µg, four mice, inverted triangles) was used. To increase the statistical power, the data of the two capsaicin concentrations were combined.
Additional files
-
Transparent reporting form
- https://doi.org/10.7554/eLife.26280.033
Download links
A two-part list of links to download the article, or parts of the article, in various formats.
Downloads (link to download the article as PDF)
Open citations (links to open the citations from this article in various online reference manager services)
Cite this article (links to download the citations from this article in formats compatible with various reference manager tools)
Anti-nociceptive action of peripheral mu-opioid receptors by G-beta-gamma protein-mediated inhibition of TRPM3 channels
eLife 6:e26280.
https://doi.org/10.7554/eLife.26280


