A positive feedback loop linking enhanced mGluR function and basal calcium in spinocerebellar ataxia type 2
- Geffen School of Medicine, University of California, United States
- University of Utah, United States
- Roche Pharmaceutical Research and Early Development, Switzerland
Figures
Figure 1
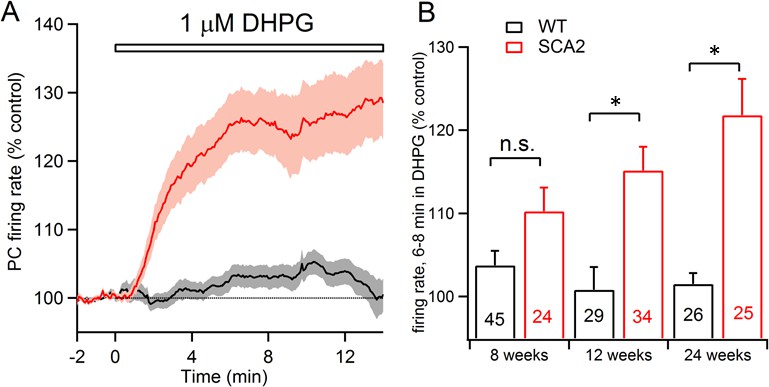
mGluR1-mediated excitation of PCs is enhanced in SCA2 mice.
(A) Extracellular recordings of PN firing from cerebellar slices shows that application of a low concentration of the group1 mGluR1-selective agonist DHPG (1 μM) minimally excites control PNs (black line, grey indicates s.e.m.) but strongly excites PNs from SCA2 mice (red line, lighter red indicates s.e.m.). Data are mean AP firing rates normalized to pre-DHPG control period from 26 and 25 PNs in slices prepared from 24 week-old SCA2 and wild type mice. (B) Summary of mean normalized firing rate 6–8 min after application of 1 μM DHPG as a function of genotype (black=WT; red=SCA2) and age. Note the progressive increase in sensitivity to the mGluR1 agonist with age. Numbers of PNs recorded are listed on each bar; significance is indicated following a two way ANOVA test indicating a significant effect of genotype (p<0.0001) and Sidak’s multiple comparison test (n.s. indicates non-significant; * indicates p<0.0002).
Figure 2
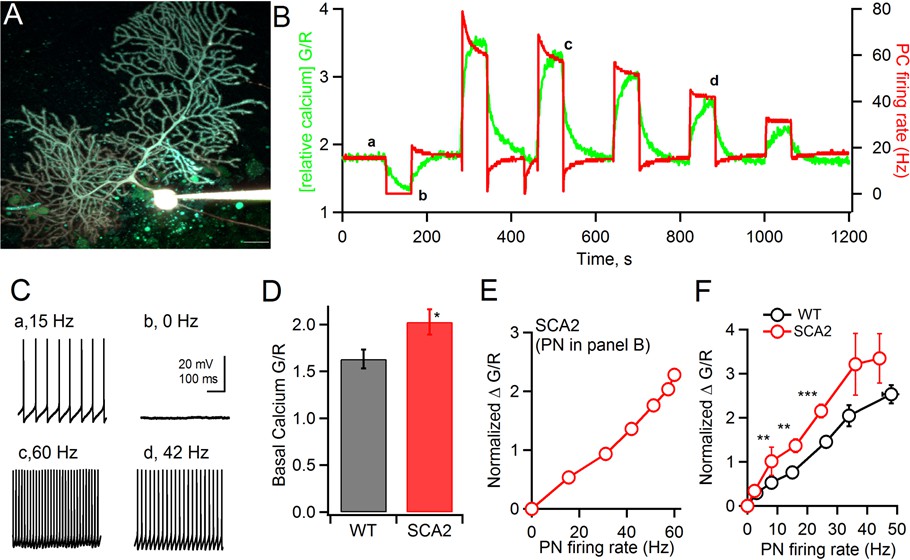
Two-photon calcium measurements show a steeper relationship between action potential (AP) firing frequency and steady-state calcium concentration in SCA2 PNs: (A) An 8 wk old SCA2 PN filled via whole-cell patch pipette with the calcium indicator dye OGB1 (200 μM) and the calcium–independent, red dye Alexa 594 (20 μM).
Scale bar is 25 μm. (B) In green, changes in OGB1 fluorescence intensity normalized to Alexa 594 intensity (G/R) and, in red, the AP firing frequency in response to different current injections which impose a range of steady state AP firing rates. (C) Examples of firing rate at the indicated time points in panel B (a-d). (D) Quantification of mean basal calcium levels (G/R) at 0 Hz firing rate for WT (black 1.63 ± 0.098, n = 15) and SCA2 (red, 2.03 ± 0.13, n = 18). (E) The change in OGB-1 fluorescence relative to basal values at AP rate = 0 Hz (Normalized DG/R), for each firing rate measured in the PN in panel B. (F) Mean values of normalized ΔG/R versus AP firing rate for PNs from 8 to 10 week old mice, WT (black, mice = 15: PNs = 10 at 0 to 5 Hz, PNs = 8 at 6 to 10 Hz, PNs = 6 at 11 to 20 Hz, PNs = 12 at 21 to 30 Hz, PNs = 7 at 31 to 40 Hz, PNs = 2 at 40 to 50) and SCA2 (red, mice = 18, PNs = 28 at 0 to 5 Hz, PNs = 15 at 6 to 10 Hz, PNs = 17 at 11 to 20 Hz, PNs = 29 at 21 to 30 Hz, PNs = 5 at 31 to 40 Hz, PNs = 6 at 40 to 50 Hz). Significance levels indicated by * < 0.05, ** < 0.001, *** < 0.0001.
Figure 3
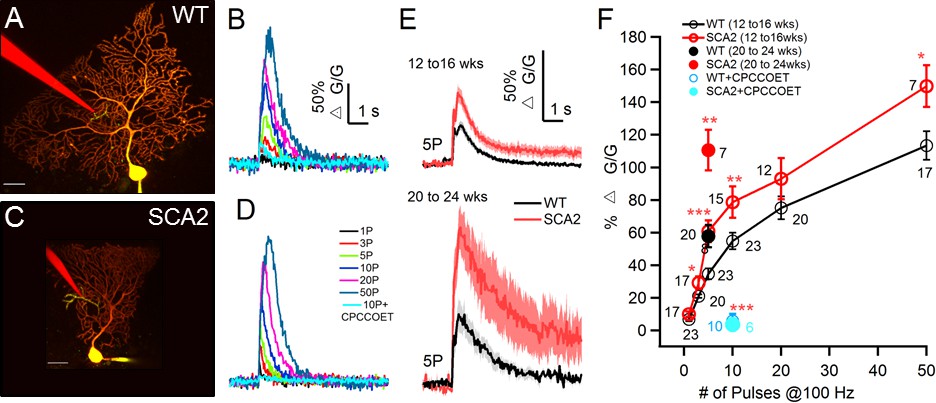
Synaptic mGluR1- mediated calcium transients are significantly increased and prolonged in SCA2 PNs.
(A and C). Two photon images of 12 wk old WT (A) and SCA2 (C) PNs filled via patch pipette (yellow) with the calcium indicator dye 200 μM OGB1 and 20 μM Alexa 594. A second pipette (red) filled with Alexa 594 is placed in the dendritic region to minimally stimulate PF synaptic inputs. Note the local region of [Ca2+] rise near the tip of the stimulating electrode (green). Scale bars are 25 μm in both images. (B and D) Intracellular Ca2+ signals (ΔG/G) for responses from WT (B) and SCA2 (D) PNs elicited by stimulation of PFs with 100 Hz trains and indicated number of pulses in the presence of AMPA, NMDA, and GABAA receptor antagonists. Note, Ca2+ signals are blocked by the mGluR1 antagonist CPCCOET (cyan traces). (E) Mean ± s.e.m. changes in Ca2+ in response to PF stimulation (5 pulses at 100 Hz) across experiments for indicated age groups and genotypes. WT (black lines, grey indicates s.e.m.) and SCA2 (red lines, lighter red indicates s.e.m.). (F) Summary across a range of train lengths of PF-evoked Ca2+ transients at age 12–16 weeks shows larger transients in SCA2 PNs. Open red symbols denote SCA2 and black symbols WT PNs. Larger Ca2+ transients are also seen for SCA2 PNs at age 20–24 weeks in response to five pulse trains (solid red vs. black symbols). Responses are blocked by CPCCOET (WT, blue and SCA2, cyan) confirming mGluR1 dependence. Numbers of synaptic sites recorded are listed next to each symbol (total number of PNs are 21 from 13 WT mice and 12 PNs from 10 SCA2 mice at 12 to 16 wks old, 8 PNs for WT and seven for SCA2);* indicate significance *p<0.05, **p<0.01, ***p<0.001.
Figure 4
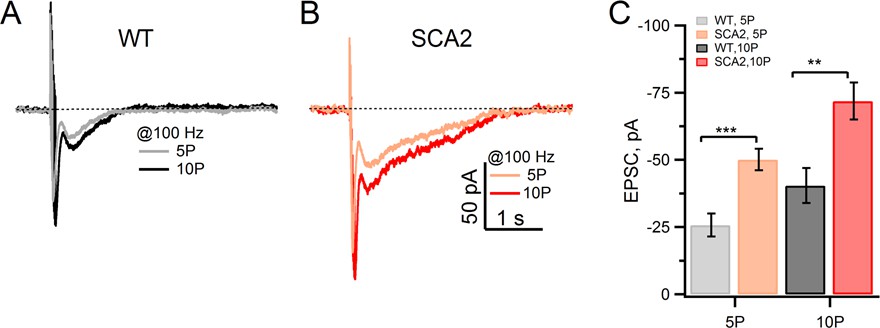
Synaptic mGluR1 EPSCs are significantly larger in SCA2 PNs.
(A and B) Slow mGluR1 EPSCs in response to 5 and 10 pulse, 100 Hz stimuli applied to PFs. mGluR1 EPSCs are measured with 1 mM EGTA (internal pipette solution) and in extracellular solution containing antagonists for GABAA receptors (100 μM PTx), AMPA receptors (2 μM DNQX, leading to a partial block,) and glutamate transporters (100 μM DL-TBOA). (C) Average peak mGluR1 EPSCs in response to 5 or 10 pulses @100 Hz for WT and SCA2 recordings. Average peak values are −26 ± 4 pA, and −40 ± 7 pA in WT mice (n = 14) and −50 ± 4 pA and −72 ± 7 pA in SCA2-Q127 (n = 9) at 5 and 10 pulses, respectively. Significance levels are indicated by *p<0.05, **p<0.01, ***p<0.001.
Figure 5
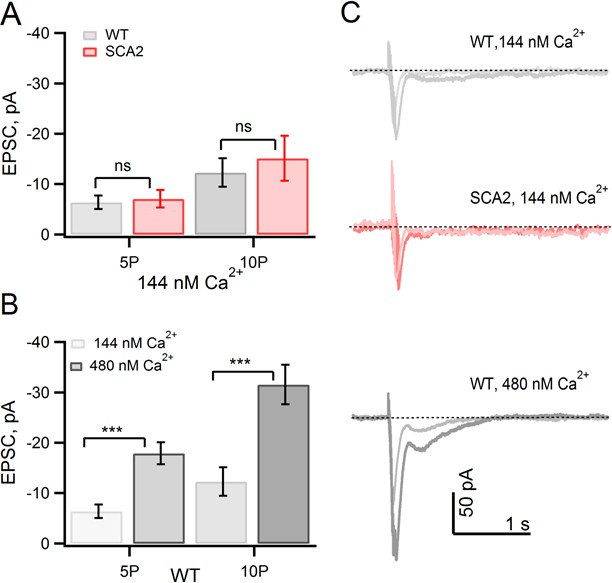
Elevated basal internal [Ca2+] levels in SCA2 PNs account for enhanced mGluR1 EPSCs.
(A) mGluR1 EPSCs are similar both in WT and SCA2 when internal free [Ca2+] is strongly buffered with 10 mM internal BAPTA. Mean values of PF-evoked slow mGluR1 EPSCs in WT (5P, n = 23; 10P, n = 19) versus SCA2 (5P, n = 26; 10P, n = 16). (B) Buffering internal free [Ca2+] to an elevated level of 480 nM in WT PNs increases peak mGluR1 EPSCs. Mean mGluR1 EPSCs at 5P is −18 ± 2 (n = 12 at 5P) and −32 ± 4 (n = 11 at 10P) pA. (C) Representative synaptic mGluR1 EPSCs from PNs recorded with free Ca2+ strongly buffered at 144 nM (WT and SCA2) or 480 nM (WT) levels (see Materials and methods). These findings are consistent with the hypothesis that the observed increased mGluR1 EPSCs in SCA2 mice is due to an elevated internal [Ca2+] in PNs; significance of p<0.001 indicated by ***.
Additional files
-
Supplementary file 1
Statistics for Figures 1–5 and power analysis for the data presented in Figure 1.
- https://doi.org/10.7554/eLife.26377.007
Download links
A two-part list of links to download the article, or parts of the article, in various formats.
Downloads (link to download the article as PDF)
Open citations (links to open the citations from this article in various online reference manager services)
Cite this article (links to download the citations from this article in formats compatible with various reference manager tools)
A positive feedback loop linking enhanced mGluR function and basal calcium in spinocerebellar ataxia type 2
eLife 6:e26377.
https://doi.org/10.7554/eLife.26377


