Structural basis for plant plasma membrane protein dynamics and organization into functional nanodomains
- Laboratoire de Biogenèse Membranaire (LBM), Unité Mixte de Recherche UMR 5200, CNRS, Université de Bordeaux, France
- GX ABT, Université de Liège, Belgium
- Institute of Chemistry and Biology of Membranes and Nanoobjects (UMR5248 CBMN), CNRS, Université de Bordeaux, Institut Polytechnique Bordeaux, France
- Université de Lyon, ENS de Lyon, Université Claude Bernard Lyon 1, France
- Interdisciplinary Institute for Neuroscience, CNRS, University of Bordeaux, France
- LIPM, Université de Toulouse, INRA, CNRS, France
- Agroécologie, AgroSup Dijon, INRA, Université Bourgogne Franche-Comté, F-21000 Dijon, ERL 6003 CNRS, France
Figures
Figure 1 with 6 supplements
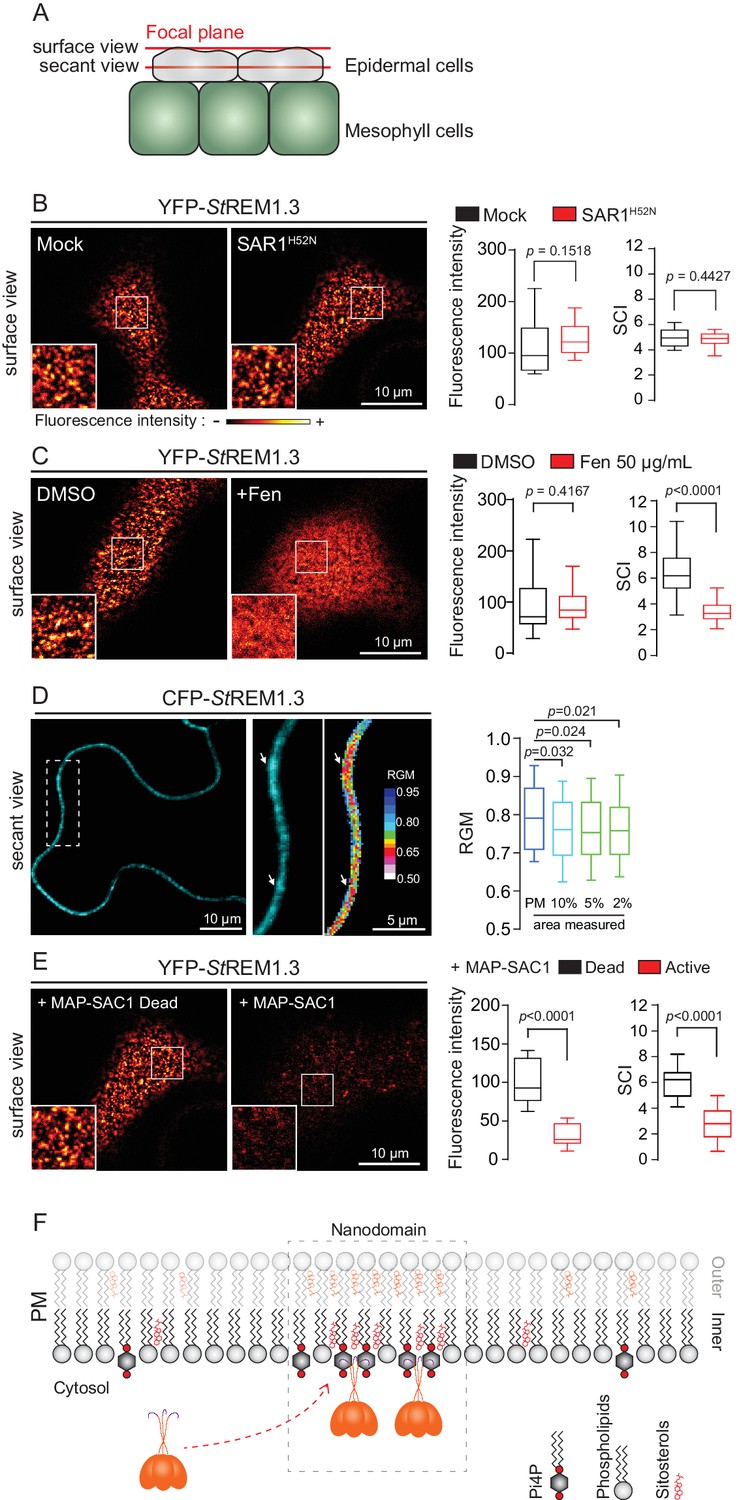
REMORIN localization into highly ordered PM nanodomains is mediated by sterols and PI4P.
(A) Explanatory schematic of the secant or surface views of N. benthamiana leaf abaxial epidermal cell plasma membrane (PM) used throughout the article. (B) Confocal imaging surface views of Nicotinana benthamiana leaf epidermal cells expressing YFP-StREM1.3 with or without dominant-negative SAR1H52N (PMA4-GFP was used as a potency control, see Figure 1—figure supplement 2), 24 hr after agroinfiltration. Tukey boxplots show the mean fluorescence intensity and the Spatial Clustering Index, SCI (n = 3, quantification made on a representative experiment, at least 38 cells per condition). (C) Surface view confocal images showing the effect of Fenpropimorph (Fen) on PM patterning of YFP-StREM1.3 domains 20 hr after agroinfiltration. Tukey boxplots show the mean fluorescence intensity and the SCI of YFP-StREM1.3 in the Mock (DMSO) or Fen-treated leaves (50 µg/mL), at least 46 cells from three independent experiments. (D) Secant view confocal fluorescence microscopy images displaying the degree of order of CFP-StREM1.3‐enriched domains (left panel) by the environment‐sensitive probe Di‐4‐ANEPPDHQ (middle panel) 48 hr after agroinfiltration. Di‐4‐ANEPPDHQ red/green ratio (RGM) was measured for the global PM, and for the 10, 5, 2% most intense CFP-StREM1.3 signal-associated pixels (right panel). A lower red/green ratio is associated with an increase in the global level of membrane order, at least 70 cells from three independent experiments. (E) Surface view confocal images showing the effect of dead or active constructs of MAP-SAC1p (MAP-mTurquoise2-SAC1p from yeast, see Figure 1—figure supplement 5) on PM domain localization of YFP-StREM1.3 20 hr after agroinfiltration. Tukey boxplots show the mean fluorescence intensity and the SCI of YFP-StREM1.3, at least 52 cells from four independent experiments. (F) Model showing the PI4P-driven targeting of the trimer of StREM1.3 to the PM and its PI4P- and sterol-dependant nanodomains organization. In all panels, p-values were determined by a two-tailed Mann-Whitney test.
Figure 1—figure supplement 1
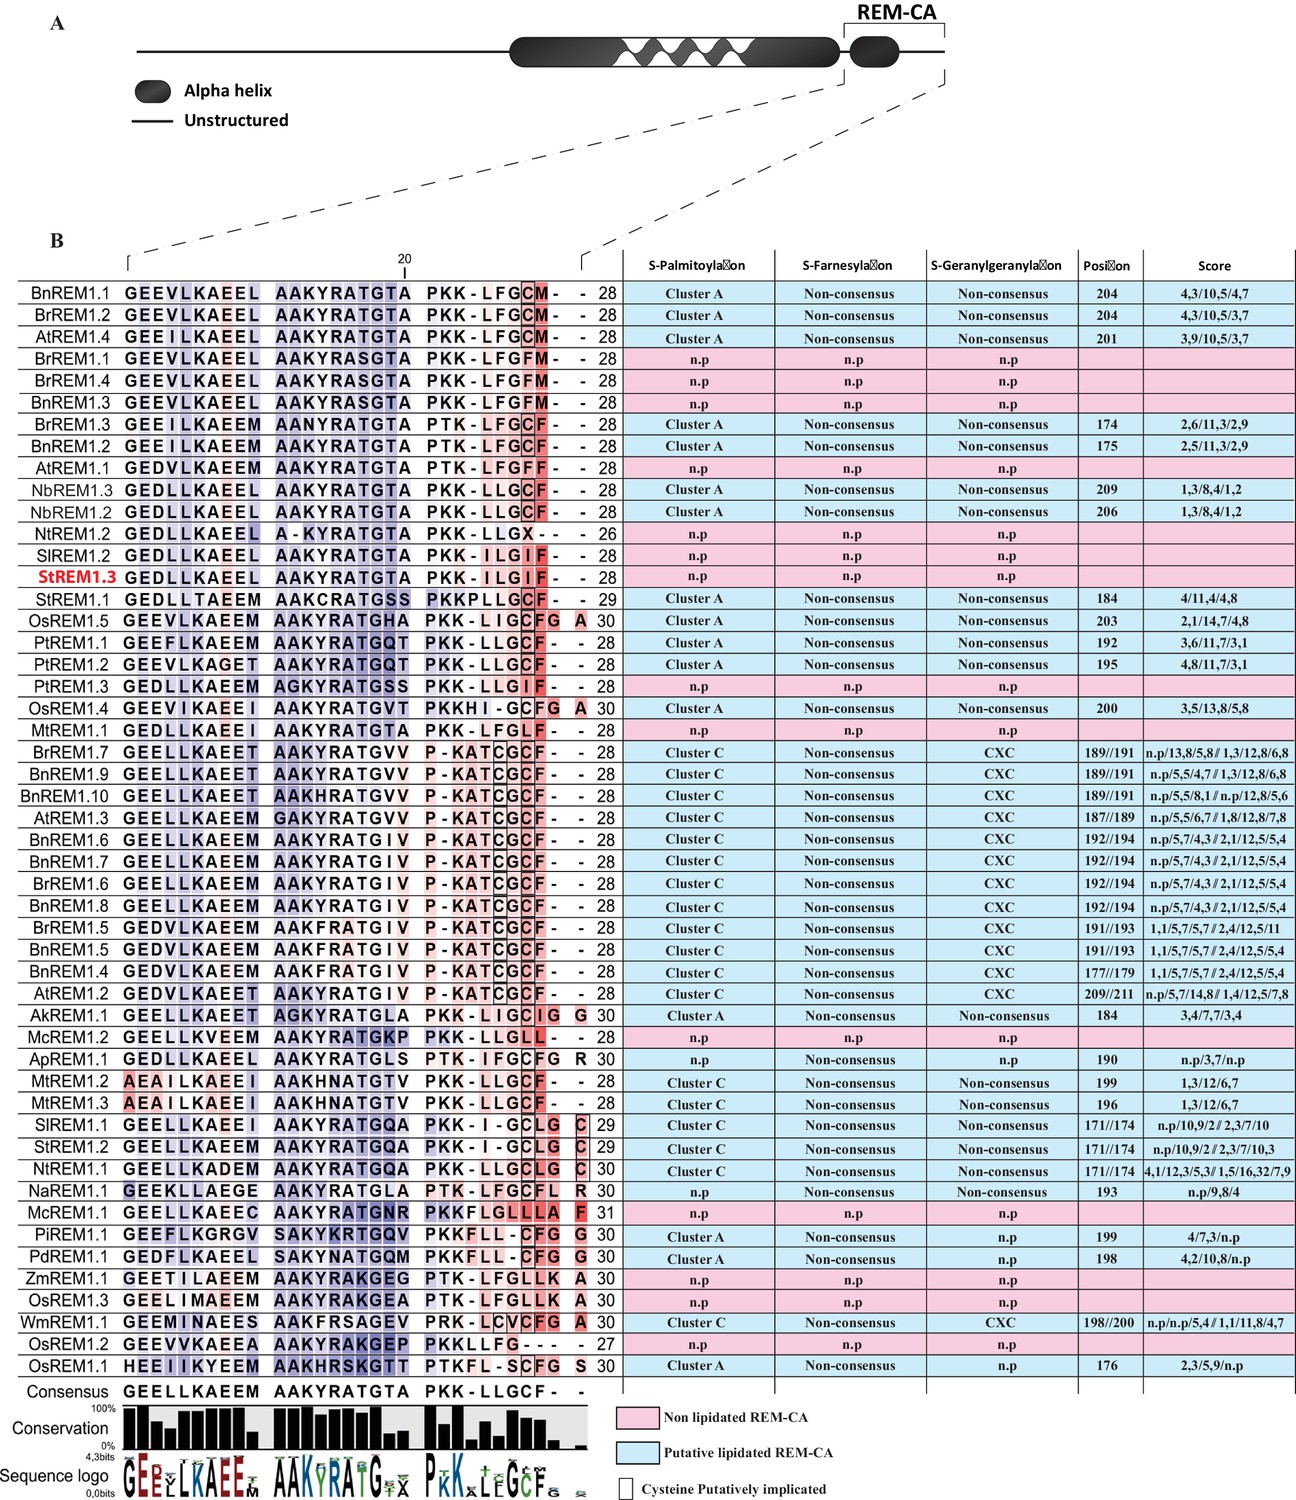
Sequence alignment of 51 group 1 REMORIN C-terminal Anchor sequences.
https://doi.org/10.7554/eLife.26404.003
Figure 1—figure supplement 2
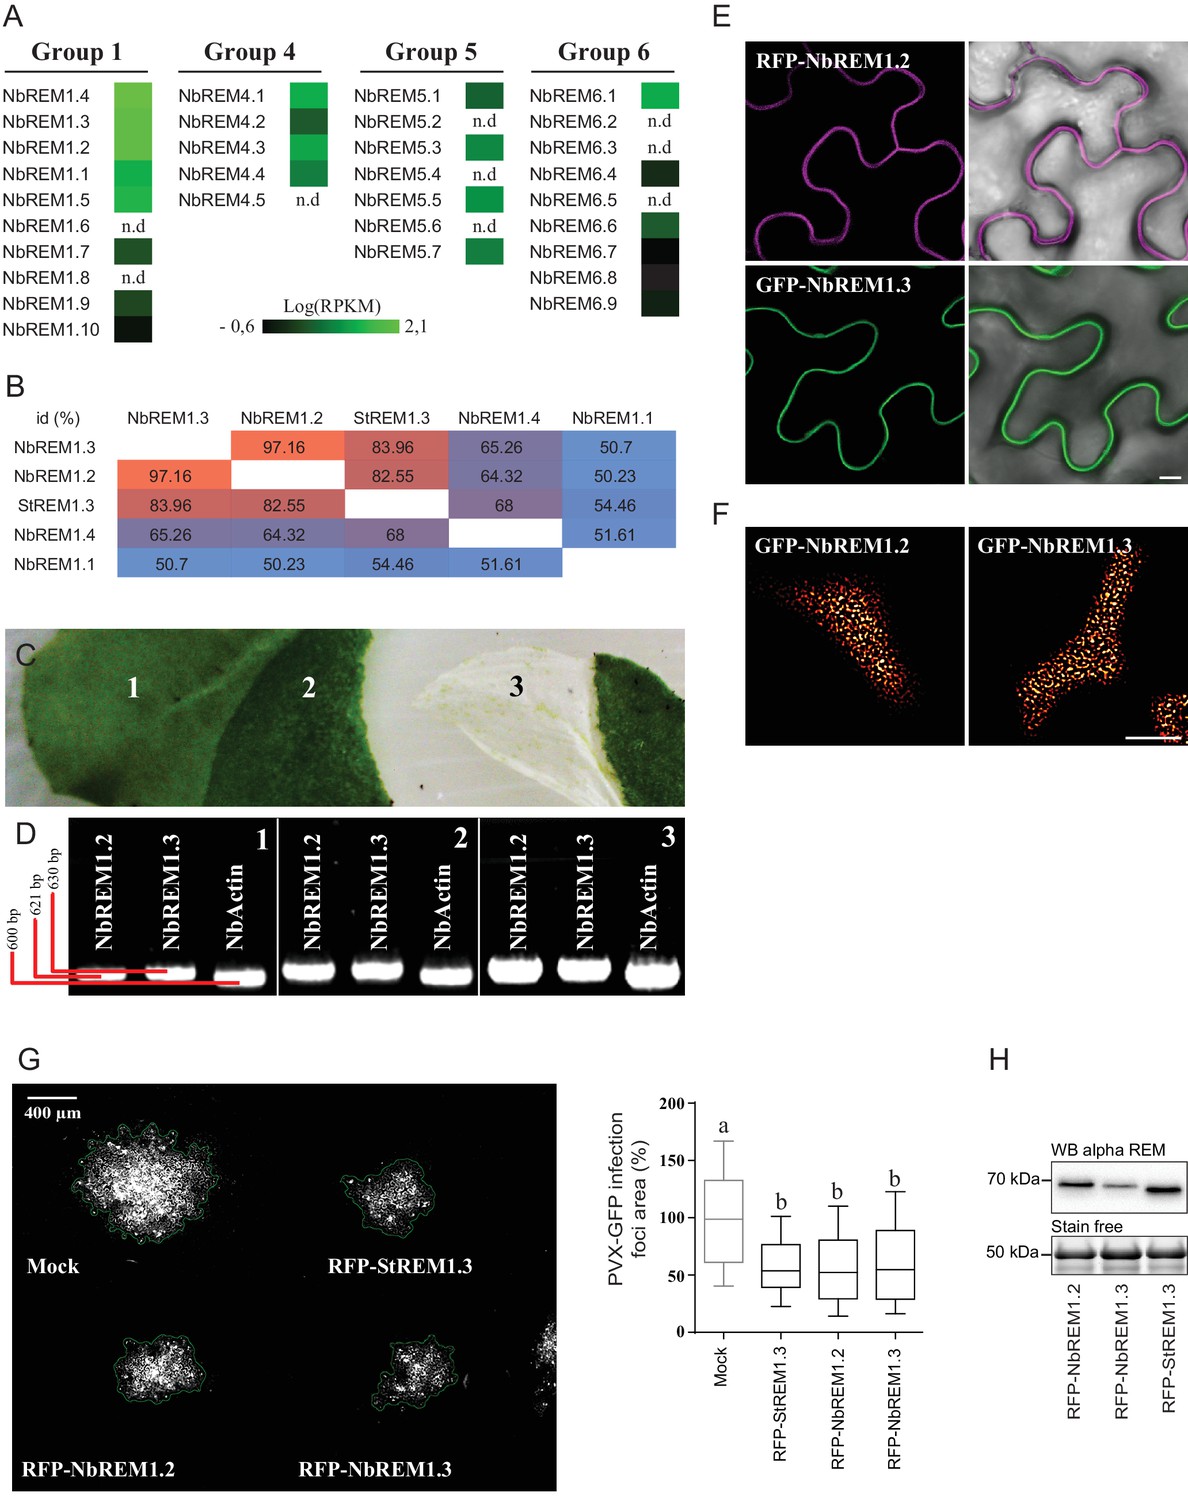
Nicotiana benthamiana Group 1b REMORINs are expressed in leaf epidermal cells, encode for PM nanodomain localized proteins and are functional homologs of StREM1.3 toward PVX propagation.
(A) REMORIN genes of N. benthamiana expressed in Reads Per Kilobase of transcripts per million mapped reads (RPKM). RNAseq data were retrieved using SRA toolkit (see experimental section). (B) Pairwise comparison of protein identity for StREM1.3 and closest group 1 NbREMs expressed as a percentage of identity. (C) Photo of epidermis peeling performed on a glass slide freezing with liquid nitrogen to reduce transcriptional modification due to mechanical stress. Leaf tissue (1) without skin (2) and epidermis (3). (D) The expression of endogenous NbREM1.3 and NbREM1.2 in epidermis was revealed by RT-PCR. (E,F) Confocal microscopy pictures of transiently expressed RFP-NbREM1.2 and GFP-NbREM1.3 transiently-expressed via A. tumefaciens in N. benthamiana epidermal cells at 2 DAI show that they both localize in PM-nanodomains. Scale bar indicate 10 μm. (G) Propagation of PVX::GFP alone and in combination with A. tumefaciens carrying empty vector (mock), RFP-StREM1.3, RFP-NbREM1.2 or RFP-NbREM1.3, and corresponding quantification. Scale bar indicate 400 μm. n = 4. Letters indicate significant differences revealed by Tukey’s comparisons test p<0.001. (H) Total proteins extracted from leaf samples and probed by anti-StREM1.3 antibodies.
Figure 1—figure supplement 3
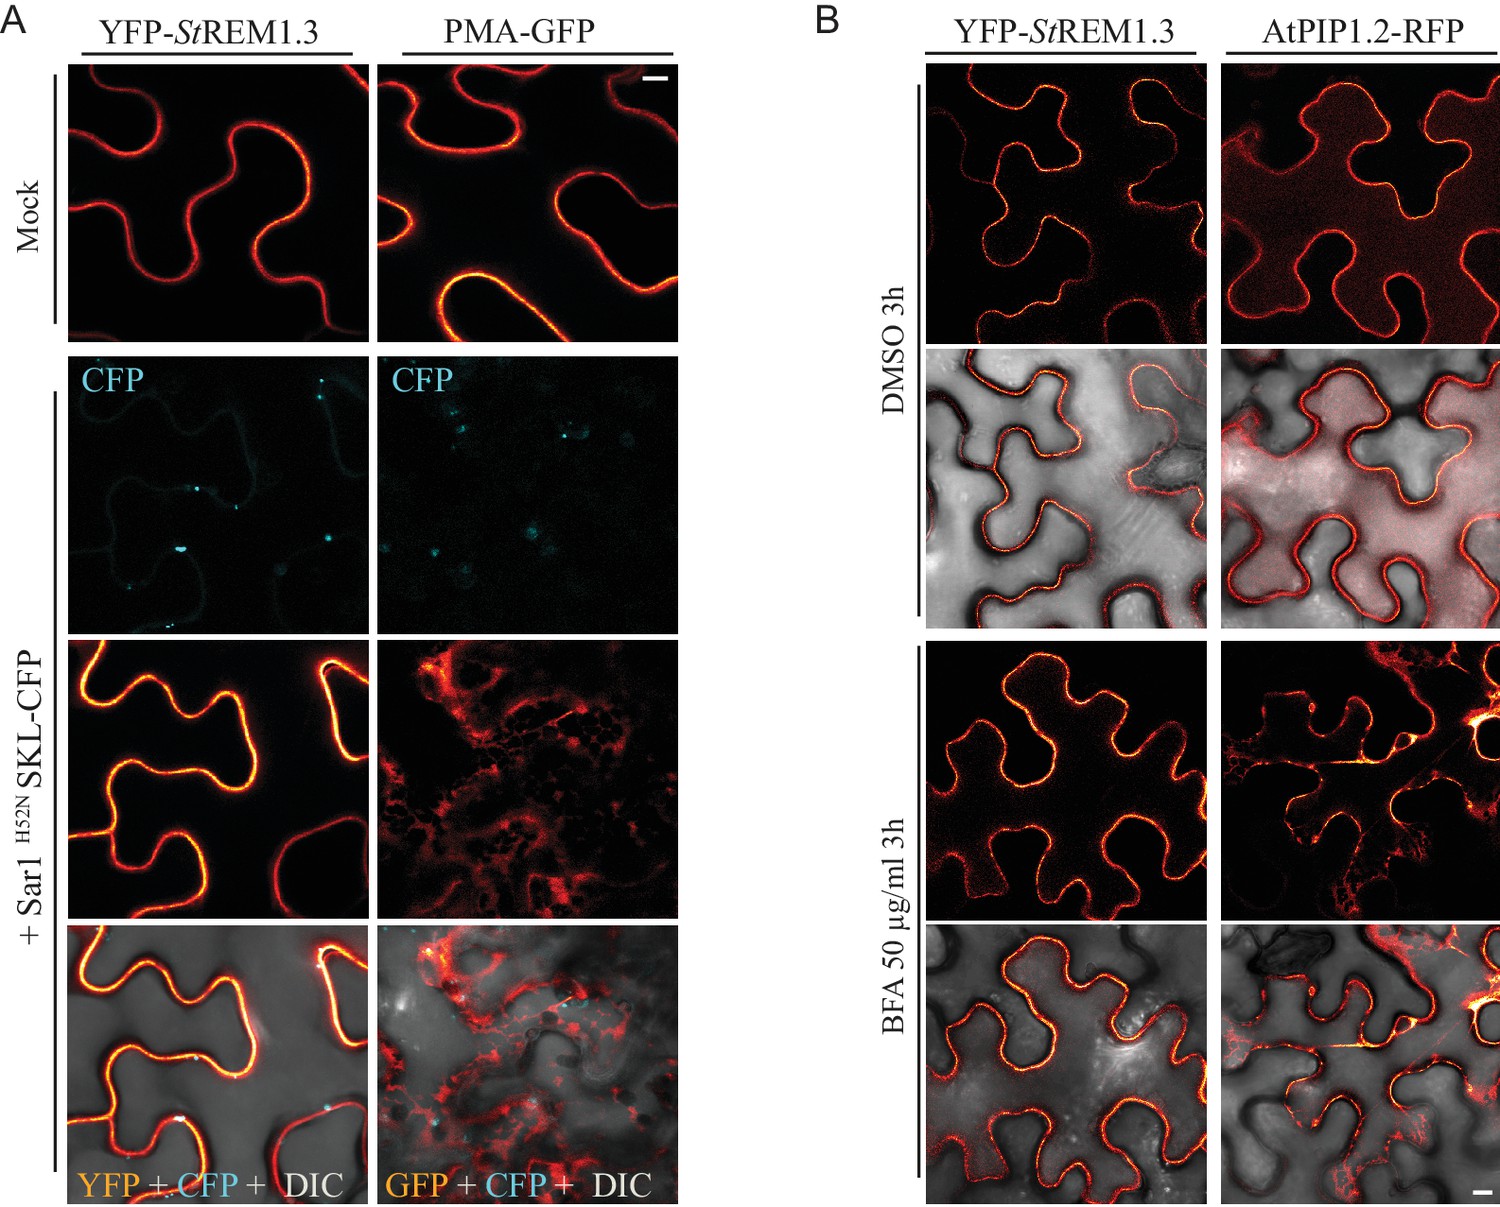
YFP-StREM1.3 is targeted to the PM-domains by a mechanism independent of the COP-I/COP-II secretory pathway.
(A) Secant view of confocal dual-colour imaging of N. benthamiana expressing YFP-StREM1.3 or proton pump PMA4-GFP (used as positive control) with or without dominant-negative Sar1H52N / SKL-CFP 24 hr after agro-infiltration, SKL-CFP is used as a transformation control (de Marcos Lousa et al., 2016). DIC: differential interface contrast. Scale: 10 µm. Lower pictures show merged images. (B) Secant view of confocal images of N. benthamiana expressing YFP-StREM1.3 or aquaporin AtPIP1.1-RFP with or without Brefeldin A, 48 hr after agroinfiltration. Scale bar: 10 µm.
Figure 1—figure supplement 4
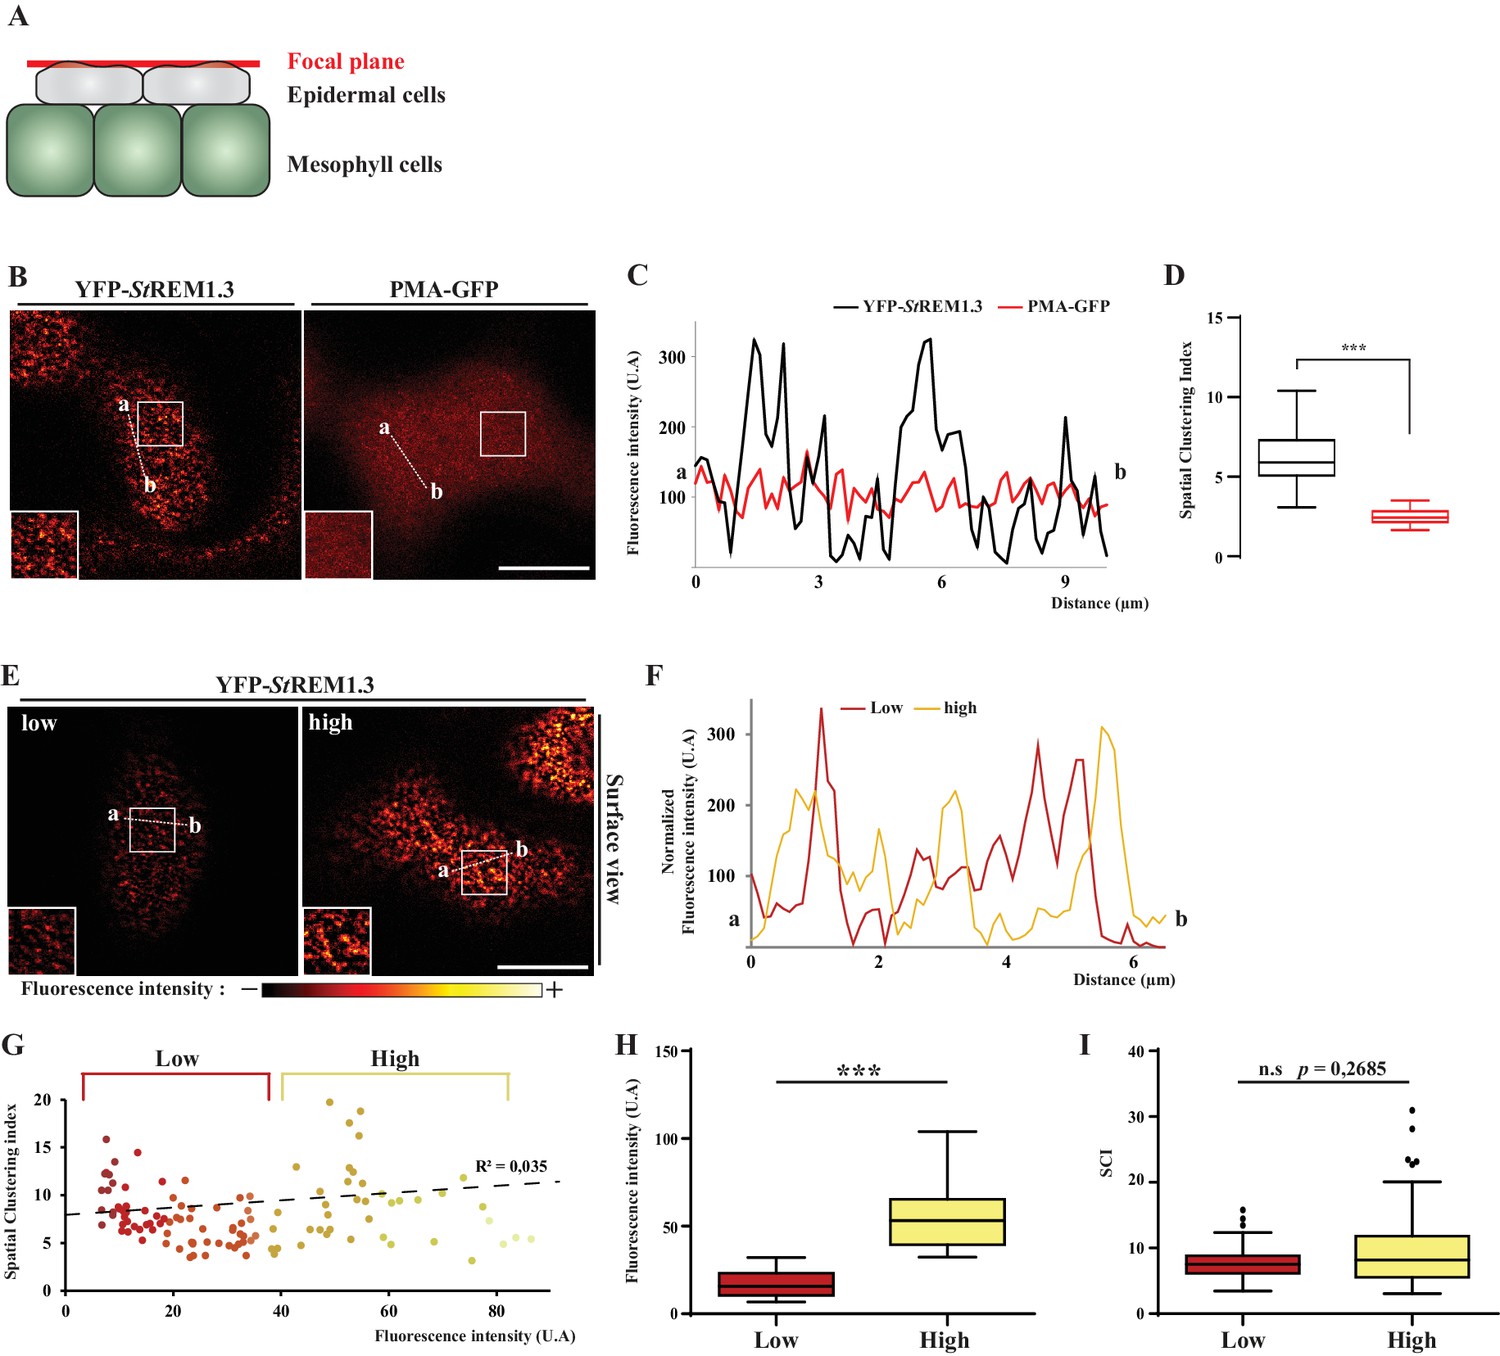
Spatial clustering index calculated as the max-to-min ratio of fluorescence intensity in the PM.
(A, B). Surface view confocal images of N. benthamiana epidermal cells expressing YFP-StREM1.3 or PMA4-GFP 48 hr after agroinfiltration. (C) Fluorescence Intensity plots through the indicated lines. (D) Spatial Clustering Index (SCI) was calculated by dividing the mean of the 5% highest values by the mean of 5% lowest fluorescence intensities values (U.A) in the PM. Comparison of SCI show the difference of clustering between PMA4 (smooth location, n = 27 cells) and StREM1.3 (discrete location, n = 22 cells), significance tested by a two-tailed Mann-Whitney test. E, F G) SCI is not correlated with fluorescence intensity. Surface view confocal images and intensity plots along the indicated lines of N. benthamiana epidermal cells expressing low or high levels of YFP-StREM1.3. (H) Tukey boxplot showing statistical differences in fluorescence intensity of cells expressing low or high levels of YFP-StREM1.3, n = 17. (I) SCI calculated for cells expressing low or high fluorescence levels of YFP-StREM1.3 showing no difference in YFP-StREM1.3-associated nanodomains in the PM between the two levels of expression. Different italicized-letters indicate significant differences among means (p<0.001, two-tailed Mann-Whitney test).
Figure 1—figure supplement 5
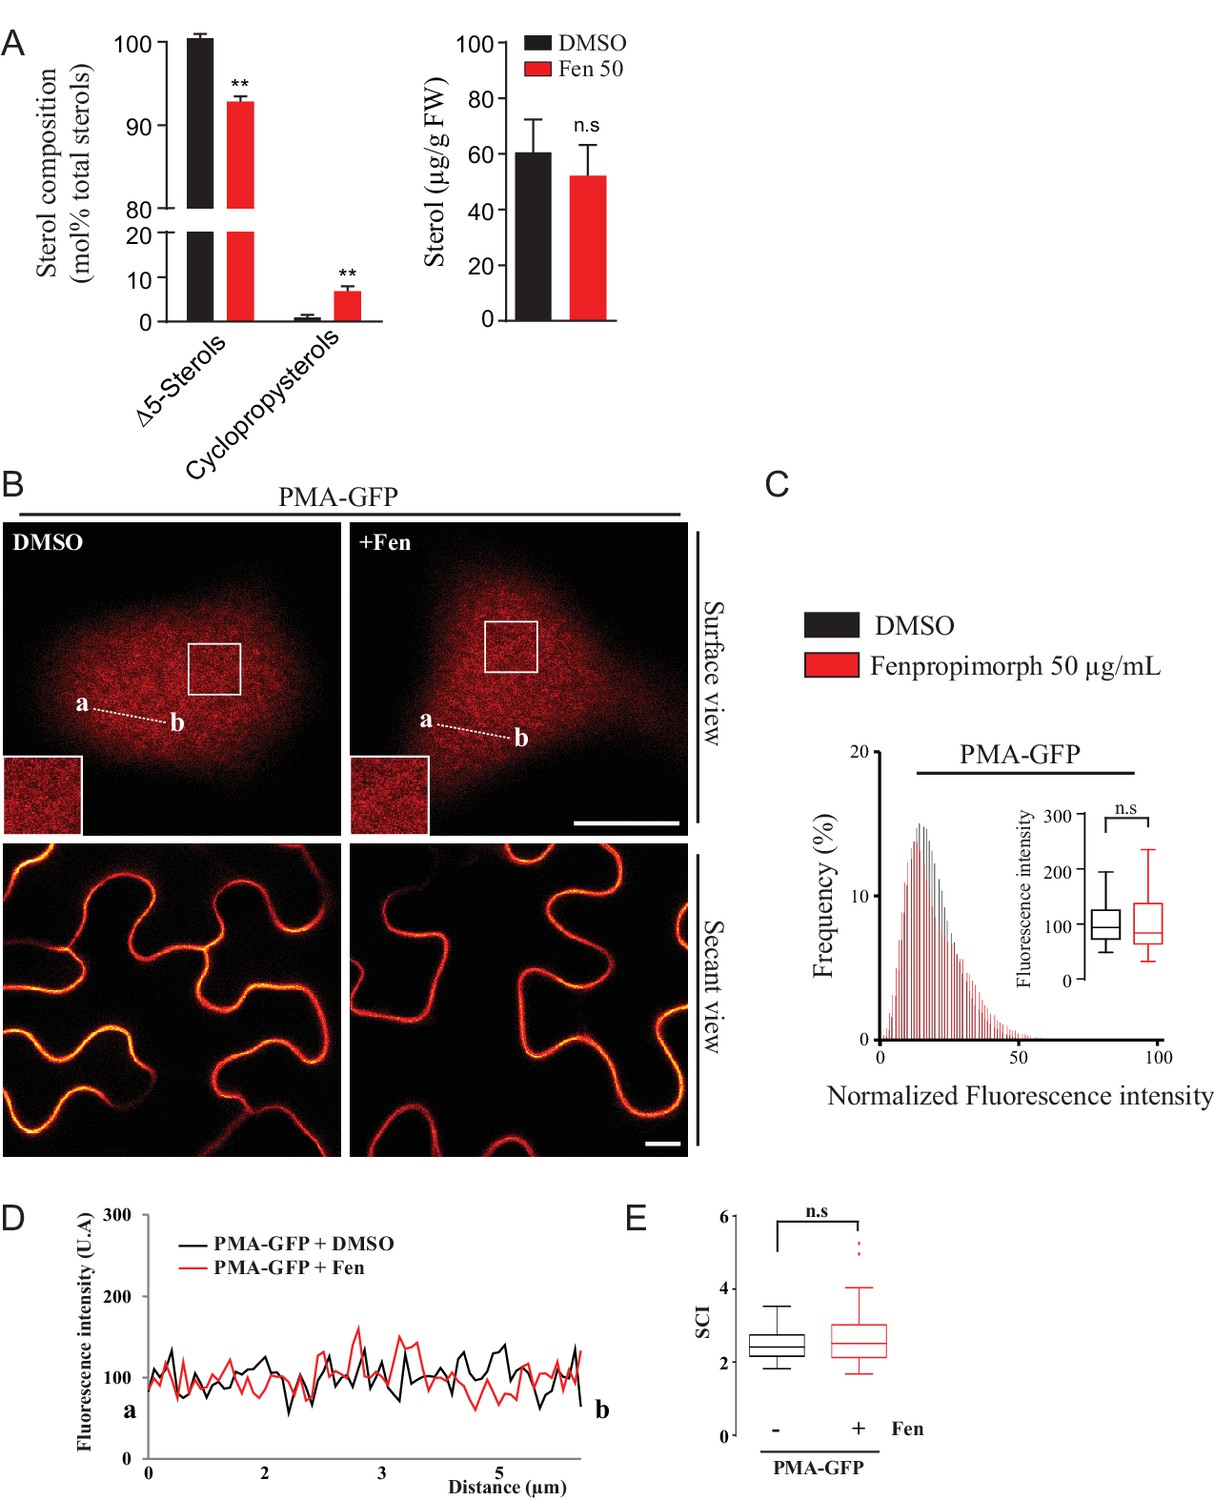
Modification of the sterol pool of N.benthamiana leaves by the drug Fenproprimorph (fen).
(A) Quantification by GC-MS of the Δ5 phytosterols and cycloartenol from control and fen-treated N. benthamiana leaves (n = 3, error bars indicate SEM). Cycloartenol accumulation is similar to what was decribed in (Grison et al., 2015). (B) Confocal images of surface or secant views of control and fen-treated N. benthamiana leaf epidermal cells expressing PMA4-GFP 48 hr after agroinfiltration. (C–E) Intensity plots and SCI of PMA4-GFP after fen treatment. Scale bars, 10 µm.
Figure 1—figure supplement 6
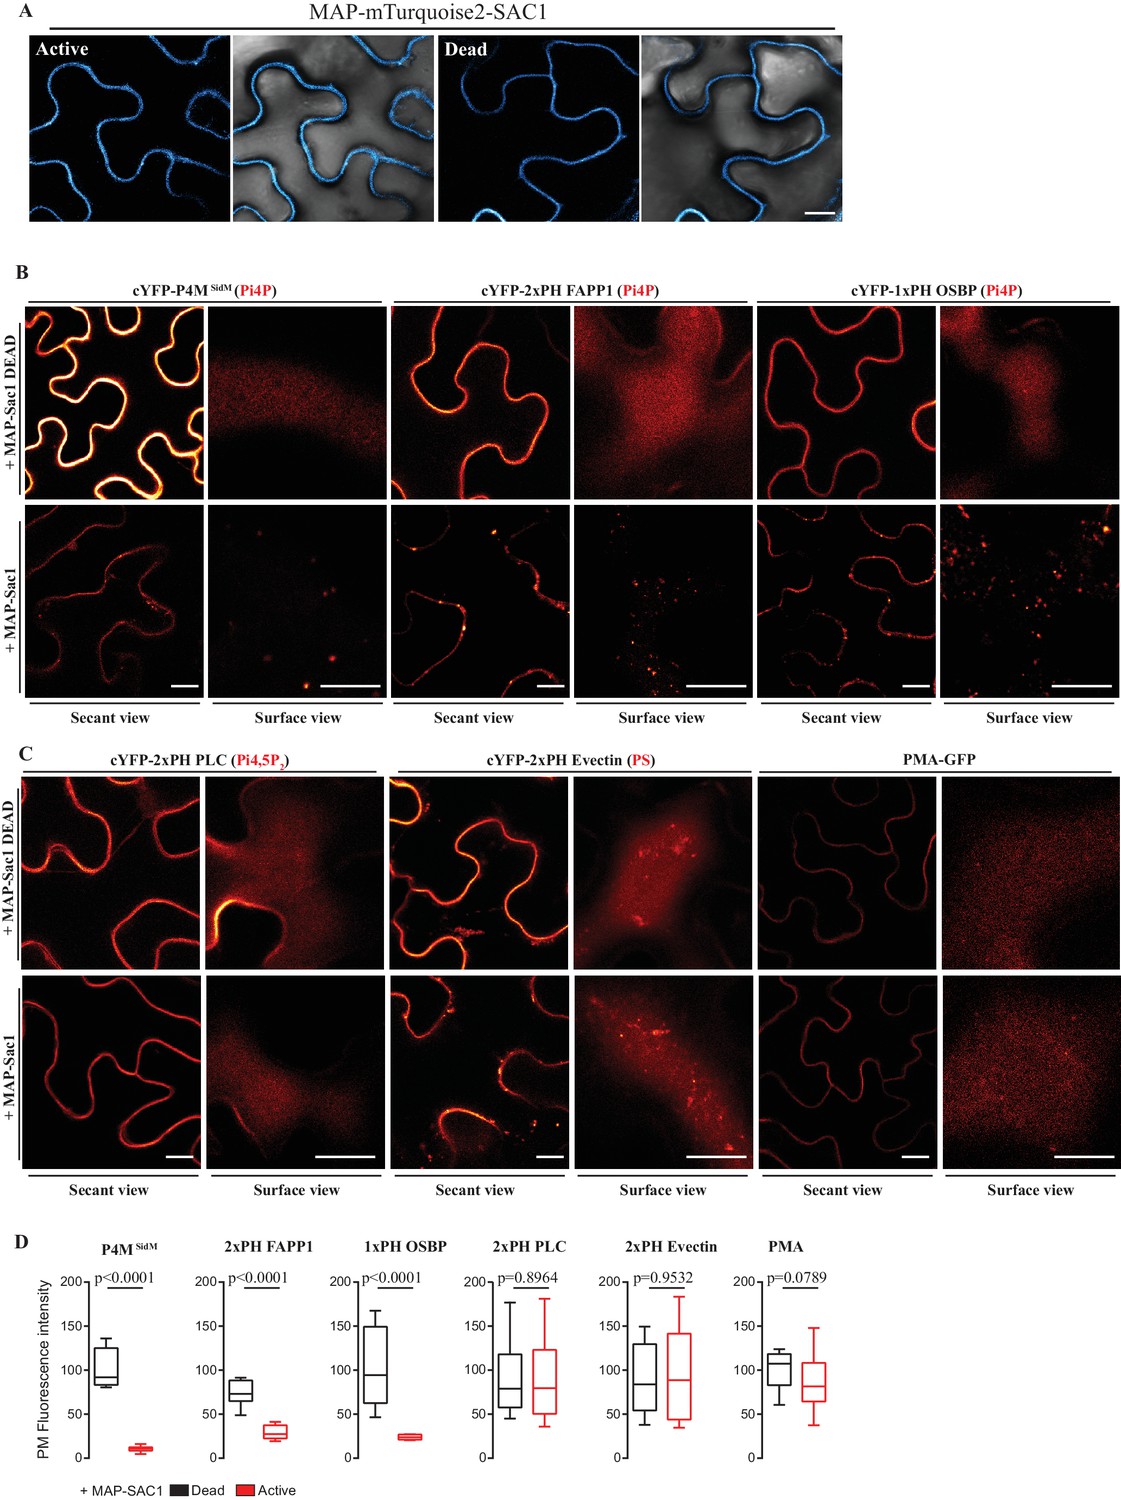
Myristoylation and Palmitoylation (MAP)-mTurquoise2-SAC1p localizes at PM of N.benthamiana leaf epidermal cells and specifically depletes PM PI4P but not PI(4,5)P2 or PS.
(A) Secant view confocal images of N. benthamiana leaf epidermal cells expressing either Dead or Active MAP-mTURQUOISE2-SAC1p from yeast constructs and P19 to increase expression (Baulcombe and Molnár, 2004). Observations were made 48 hr after agroinfiltration. Scale bar, 10 µm. (B) Secant view confocal images of N. benthamiana leaf epidermal cells expressing three independent PI4P binding domain biosensors: cYFP-P4MSidM, mCitrine-2xPH (FAPP1) and mCitrine-1xPH (OSBP1) (Simon et al., 2014) alone or co-expressed with either active or dead MAP-mTurquoise2-SAC1p (Simon et al., 2016). (C) Secant and surface view confocal images of N. benthamiana leaf epidermal cells expressing a sensor for PIP4,5P2 (cYFP-2xPH PLC), a sensor for PS (cYFP-2xPH Evectin) and the PM protein (PMA4-GFP) with either active or dead MAP-mTurquoise2-SAC1p. Scale bars for secant and surface views, 10 µm. (D) Quantification of PM fluorescence intensity for Pi4P, PS, PI(4,5)P2 biosensors and PMA4-GFP under co-expression with MAP-SAC1p and MAP-SAC1p dead.
Figure 2 with 4 supplements
| REMORIN C-terminal anchor peptide is an unconventional PM-binding domain embedded in the bilayer that folds upon specific lipid interaction.
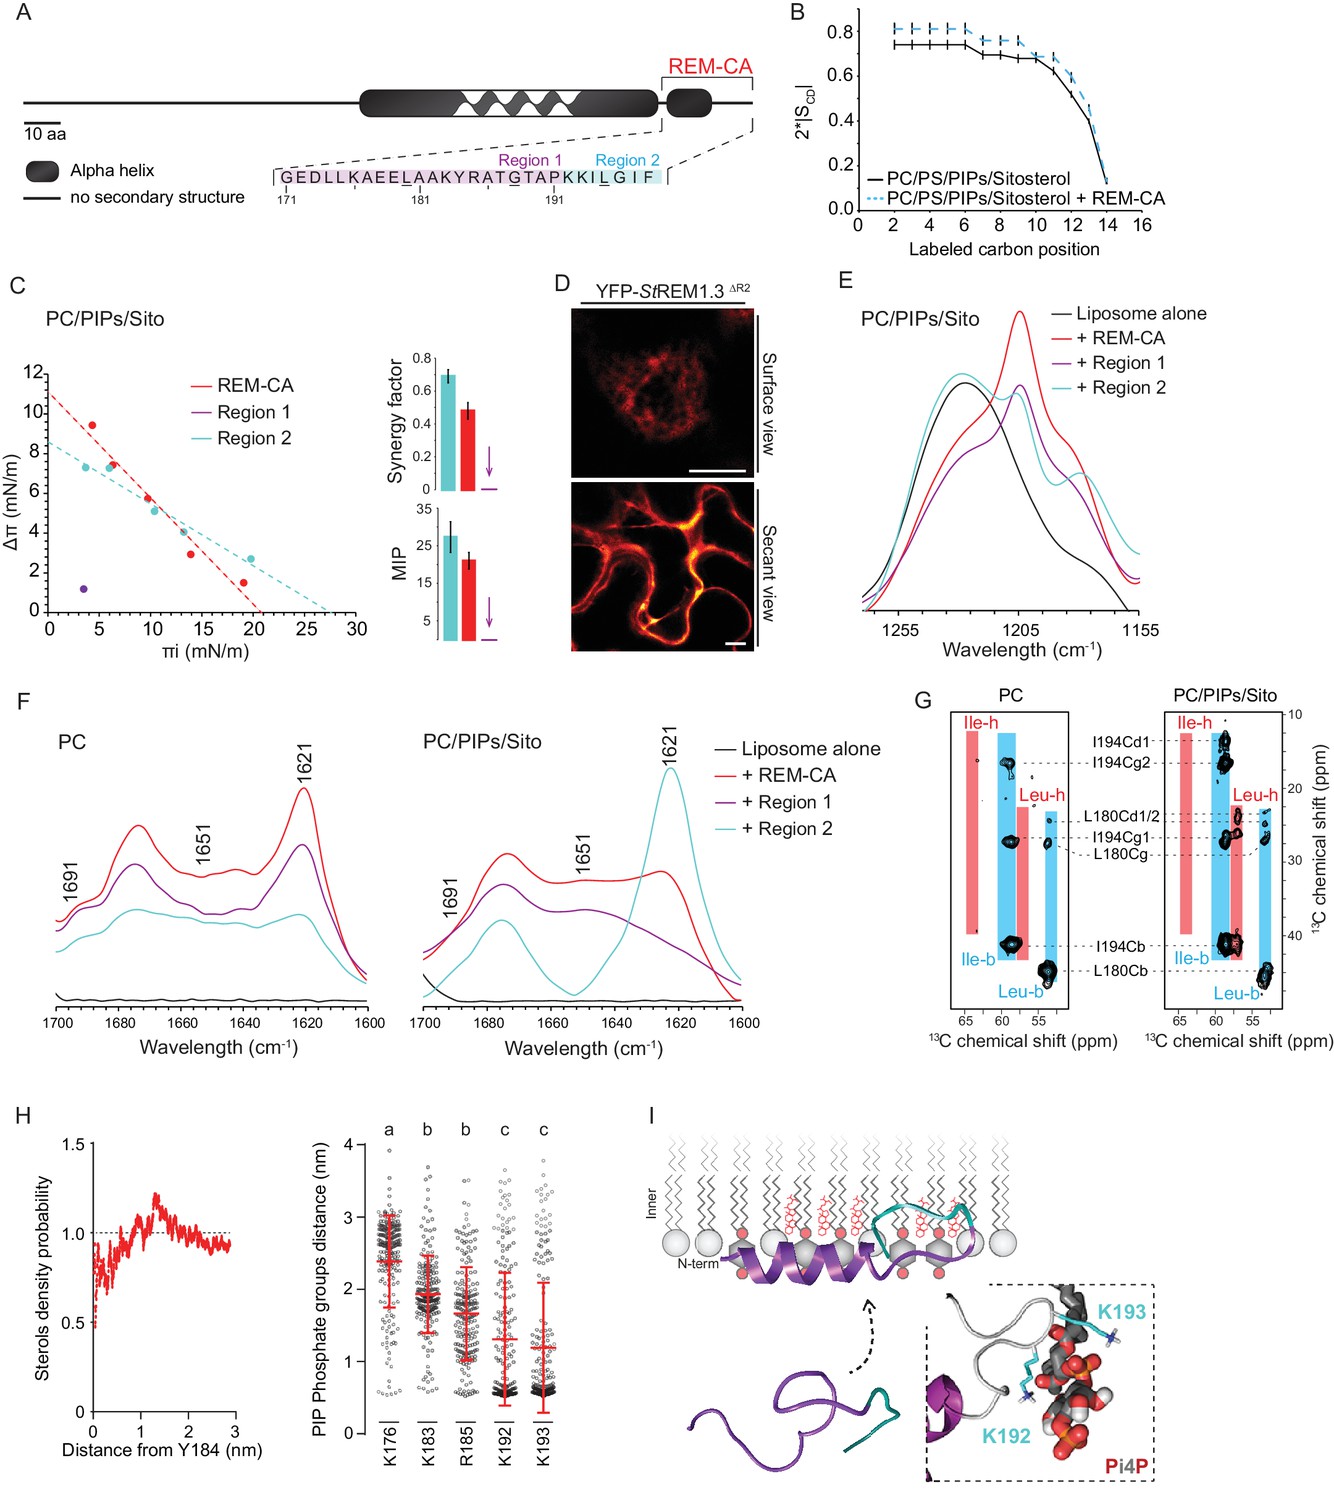
(A) Primary sequence of StREM1.3 showing the two putative regions 1 and 2 (R1 and R2) composing the REM-CA. Hatched domain represents the putative coiled-coil helix. (B) Order parameter of the carbon atoms of the fatty acid moiety of all-deuterated 1,2-dimyristoyl-D54-sn-3-phosphocholine (DMPC-d54) in PM inner leaflet-mimicking liposomes revealed by deuterium NMR. (C) Plots of the maximal surface pressure variation (ΔΠ) vs. the initial surface pressure (Πi) (left panel) and the corresponding maximal insertion pressure (MIP) and synergy factor (right panel) obtained from the adsorption experiments performed viaa Langmuir trough with a monolayer composed of phosphatidylcholine (PC), phosphoinositides (PIPs) and sitosterol (Sito) (see Figure 2—figure supplement 3A). The insignificant ΔΠ obtained for D1 indicates that D1 cannot penetrate into the monolayer. (D) Subcellular localization of YFP-StREM1.3 deleted for R2, transiently expressed in N. benthamiana leaf epidermal cells. Scale bars, 10 µm. (E) FT-IR spectra measured in the 1155–1255 cm−1 absorbance region for the REM-CA, R1 and R2 peptides inserted into MLVs composed of PC:PIPs:Sito (see Figure 2—figure supplement 3B). (F) FT-IR spectra in the 1600–1700 cm−1 absorbance region for the REM-CA, R1, R2 peptides and liposome alone with MLVs composed of PC alone and PC:PIPs:Sito (see Figure 2—figure supplement 3B). (G) Solid-state NMR spectra of REM-CA peptides co-solubilized with DMPC-d54 supplemented with PIPs and Sitosterol (see Figure 2—figure supplement 3C). Excerpts on the position of the Cα resonance frequencies of Leucines and Isoleucines on the abscissa are depicted. (H) Radial distribution functions (RDF) of Y184 and sterols, and average distances between the five lysine(K)/arginine(R) residues of REM-CA and the phosphate groups of PI4P during MD simulation, bar indicates mean ± s.d., letters indicate significant differences revealed by Dunn’s multiple comparisons test p<0.0001. (I) Model of the insertion of REM-CA in the PM inner-leaflet based on tensiometry, FTIR, MD and NMR studies. Inset displays Molecular Dynamics (MD) model of the two lysines, K192 and K193, likely in interaction with the phosphate groups of PIPs.
Figure 2—figure supplement 1
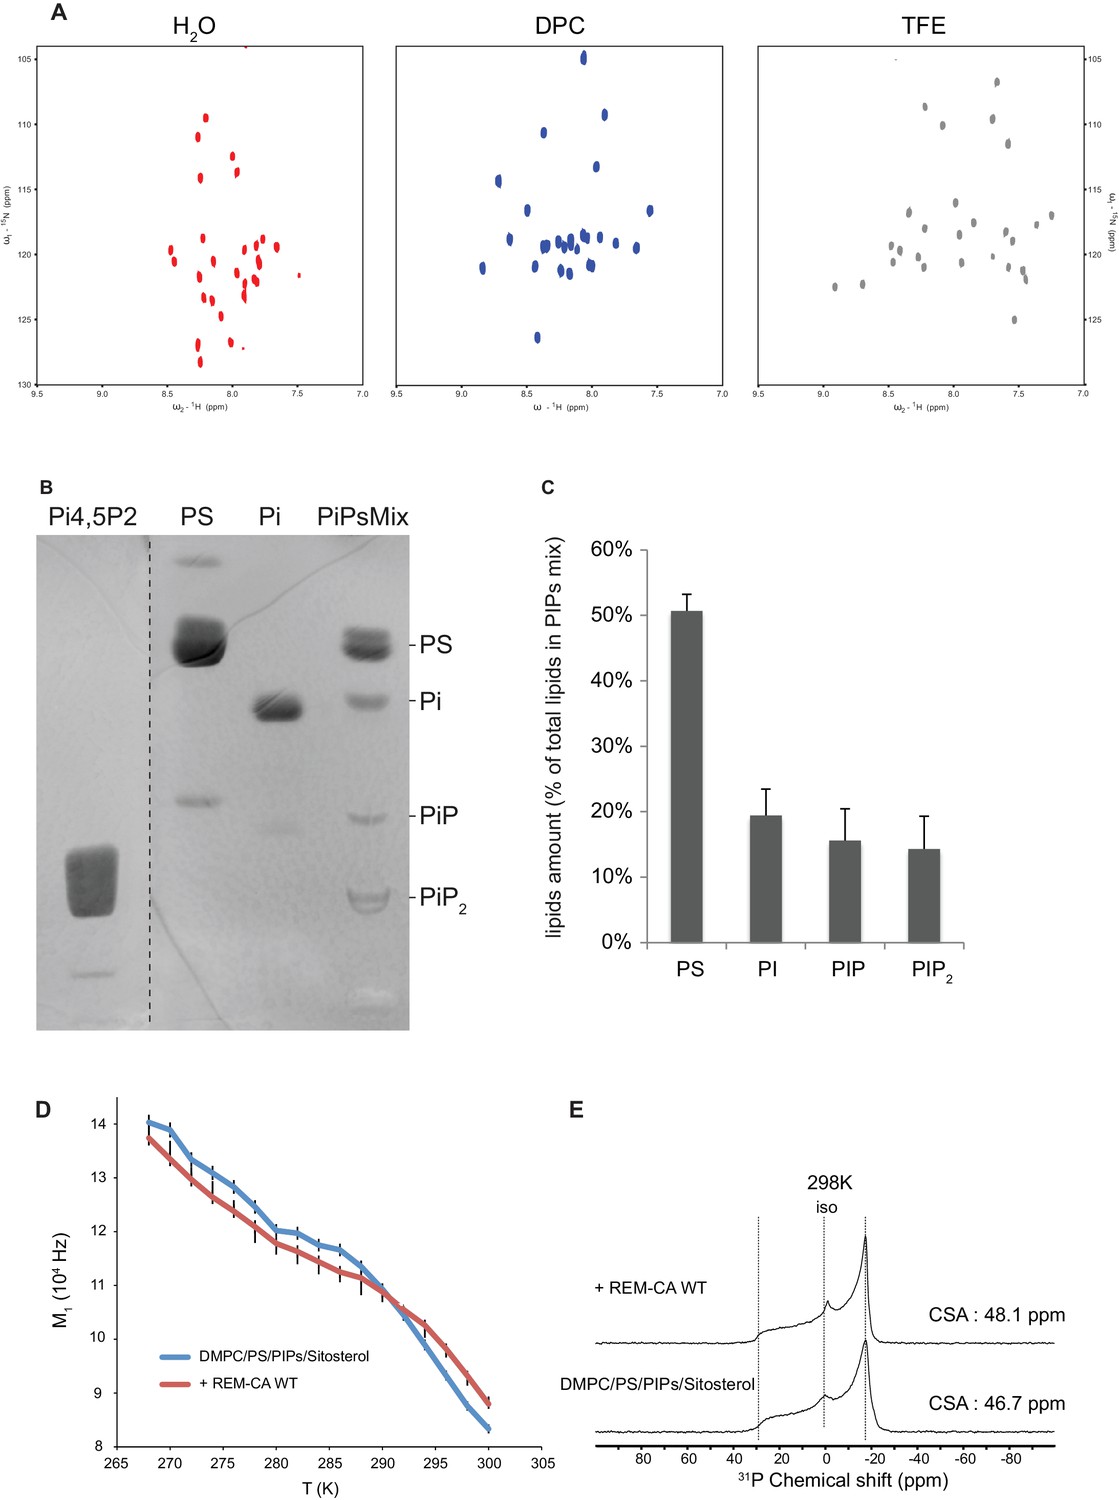
Solution NMR and 31P and 2H solid-state NMR analysis.
Thin-layer chromatography analysis of Phosphoinositides mix (PIPs). (A) REM-CA folds in alpha helix in hydrophobic environment. 2D 1H-15N correlation spectra of REM-CA recorded at 800MHz using the SOFAST-HMQC pulse sequence. All spectra were recorded at 25°C with 1 mM of REMCA-WT in H2O/D2O (90/10) (red), Dodecylphosphocholine-d38, DPC (blue) and trifluoroethanol-d2, TFE (grey). (B) Primulin-stained high-performance thin layer chromatography (HP-TLC) plate of the Phosphoinositides mix (PIPs), reference P6023 SIGMA, along with authentic standards: Phosphatidylserine (PS) Phosphatidylinositol (PI), Phosphatidylinositol-4-phosphate (PI4P) and Phosphatidylinositol-4,5-bisphosphate PI(4,5)P2). (C) Histogram representation of relative amounts of each lipid species present in the PIPs quantified by densitometry scanning. Bars indicate SEM, n = 3. (D) Temperature effect on REM-CA containing liposomes in the range −8°C to 31°C. Heating curves and corresponding NMR lineshape do not show significant changes. (E) 31P NMR spectra of deuterated 1,2-dimyristoyl-d54-sn-3-phosphocholine (DMPC-d54) membrane in the absence or presence of REM-CA.
Figure 2—figure supplement 2
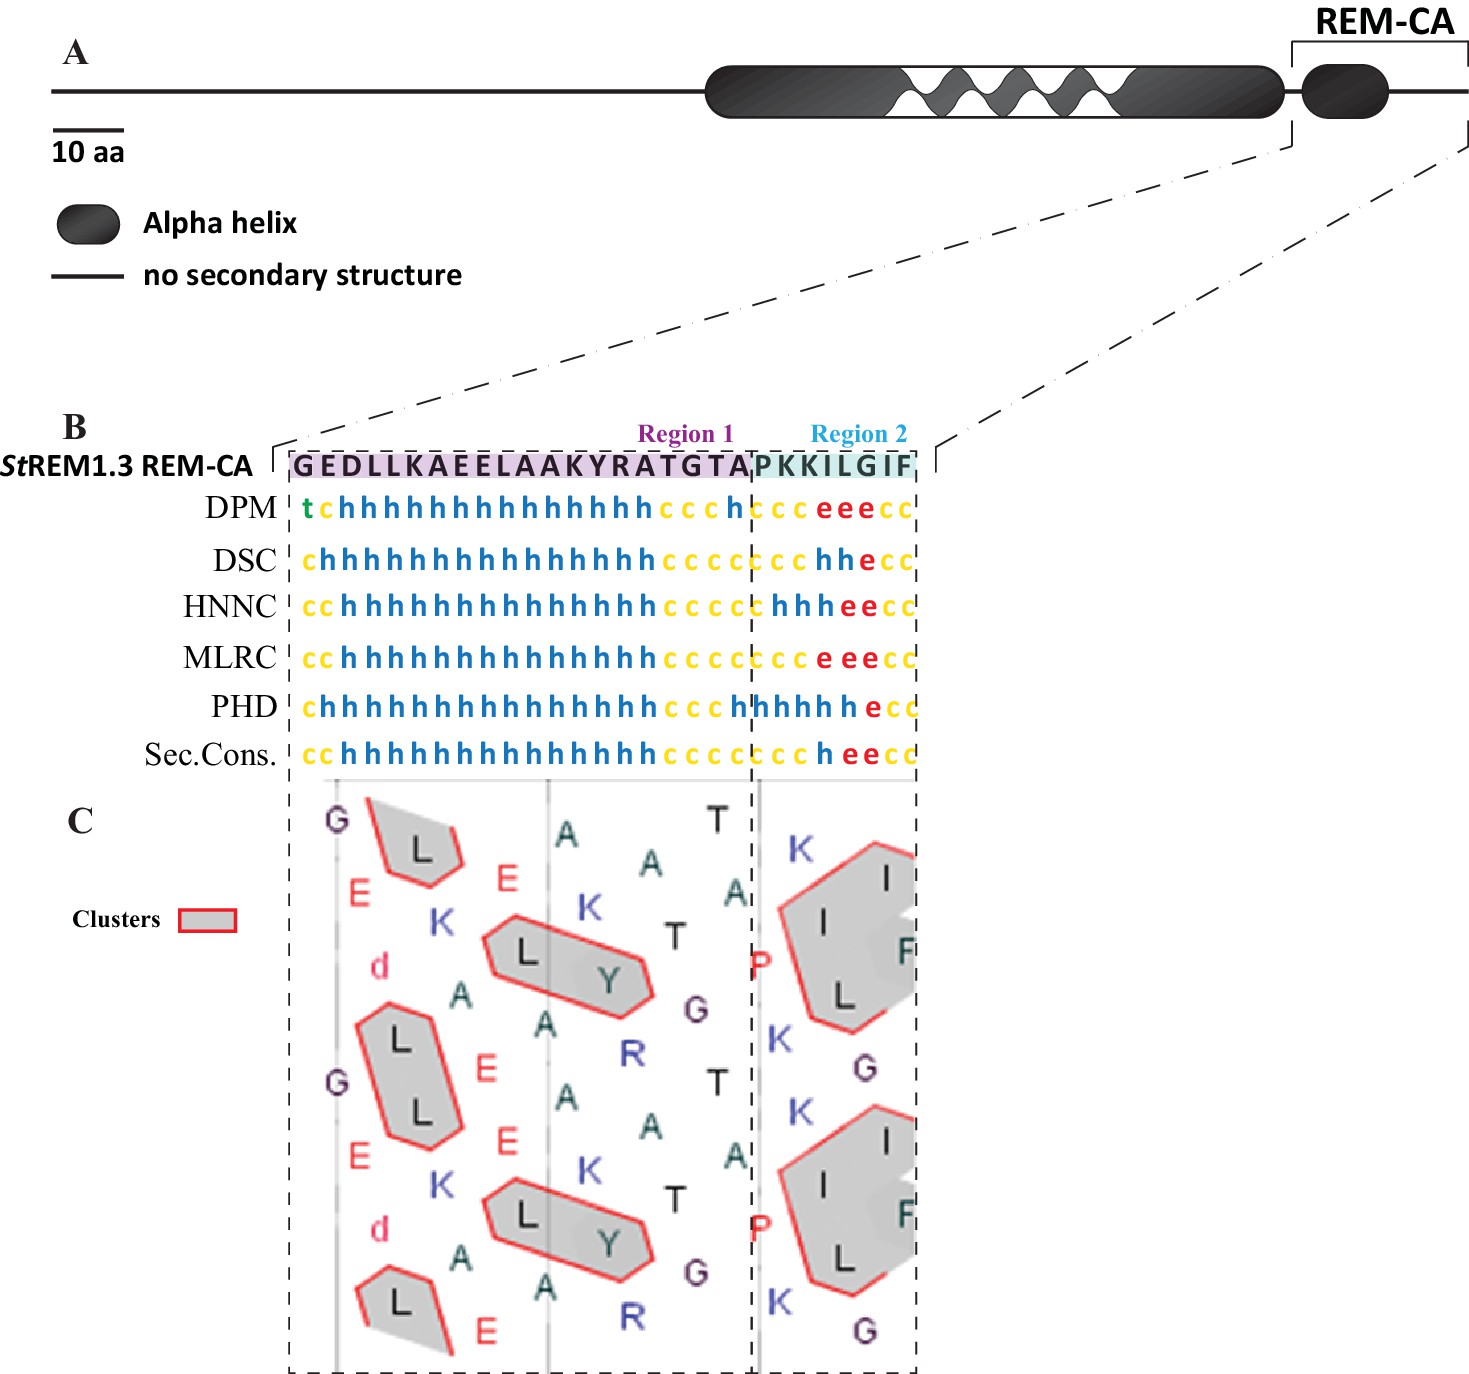
In silico analysis of REM-CA from StREM1.3 suggests the existence of two distinct structural regions.
(A) Primary sequence of StREM1.3. (B) Sequence and predicted structure of the StREM1.3 REM-CA peptide predicted by different methods, the consensus secondary structure prediction is indicated below; alpha helix (h), random coil (c), beta sheet (e). (C) HCA (hydrophobic cluster analysis) plot of the REM-CA sequence of StREM1.3. V, F, W, Y, M, L and I are hydrophobic residues. These amino acids are circled and hatched to form hydrophobic clusters, see online methods.
Figure 2—figure supplement 3
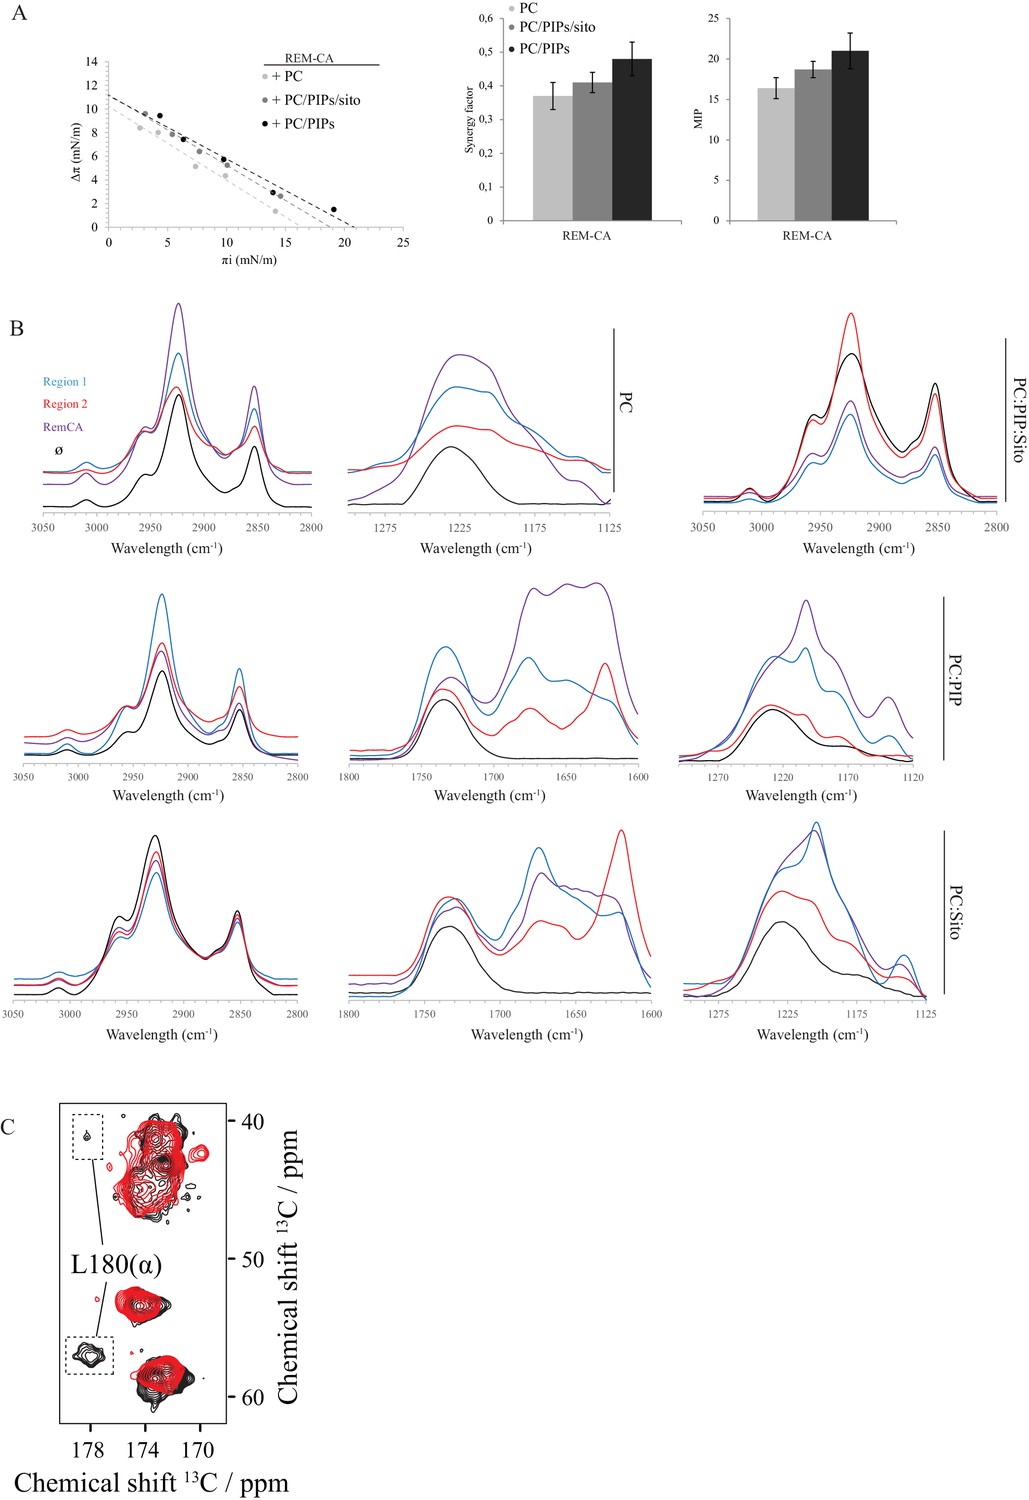
Biophysical studies evidence the interaction of REM-CA with lipids.
(A) Plots of the maximal surface pressure variation (ΔΠ) vs. the initial surface pressure (Πi) and of the corresponding maximal insertion pressure (MIP) obtained from the adsorption experiments with Langmuir through for REM-CA peptide, with different monolayer compositions i.e. PC alone, PC:PIPs (molar ratio 80:20) or PC:PIPs:Sito (molar ratio 70:20:10). (B) Fourier Transformed-InfraRed (FT-IR) spectra of REM-CA, R1 and R2 peptides in presence of different composition of MLV i.e. PLPC alone, PC:PIP (molar ratio 80:20), PC:Sito (molar ratio 90:10) or PC:PIP:Sito (molar ratio 70:20:10). Three regions of interest of the spectra are shown: the 3050–2800 cm−1 region corresponds to the absorbance of lipid alkyl chains, the 1295–1125 cm−1 region to the lipid phosphate groups and the 1800–1600 cm−1 region to the lipid C=O ester and peptide amide groups. (C) Solid-state NMR structure of REM-CA peptides 13C-labeled at the positions L180, G188 and I184. NMR spectra are shown for membranes containing REM-CA peptides, composed of deuterated 1,2-dimyristoyl-D54-sn-3-phosphocholine, (DMPC-d54), supplemented with sitosterol and Phosphoinositides mix (PIPs), see Figure 2—figure supplement 1B,C.
Figure 2—figure supplement 4

Molecular dynamics (MD) simulation reveals interactions between REM-CA residues and lipids in the ternary lipid mixture.
(A) Snapshots of MD simulations of REM-CA in the presence of a bilayer composed of 1-palmitoyl-2-linoleyl-sn-glycerol-3-phosphocholine (PLPC), sitosterol and PI4P (also see Video 1). (B) Atomistic structure of REM-CA in PLPC/PI4P/sitosterol matrix. MD atomistic simulations propose a model of the inserted structure of REM-CA in the lipid bilayer where peptide-lipid interaction would be mediated by the interaction of REM-CA with the phosphate groups of phosphoinositides and where the lateral ring of tyrosine 184 (Y184) is observed facing the inside of the membrane.
Figure 3
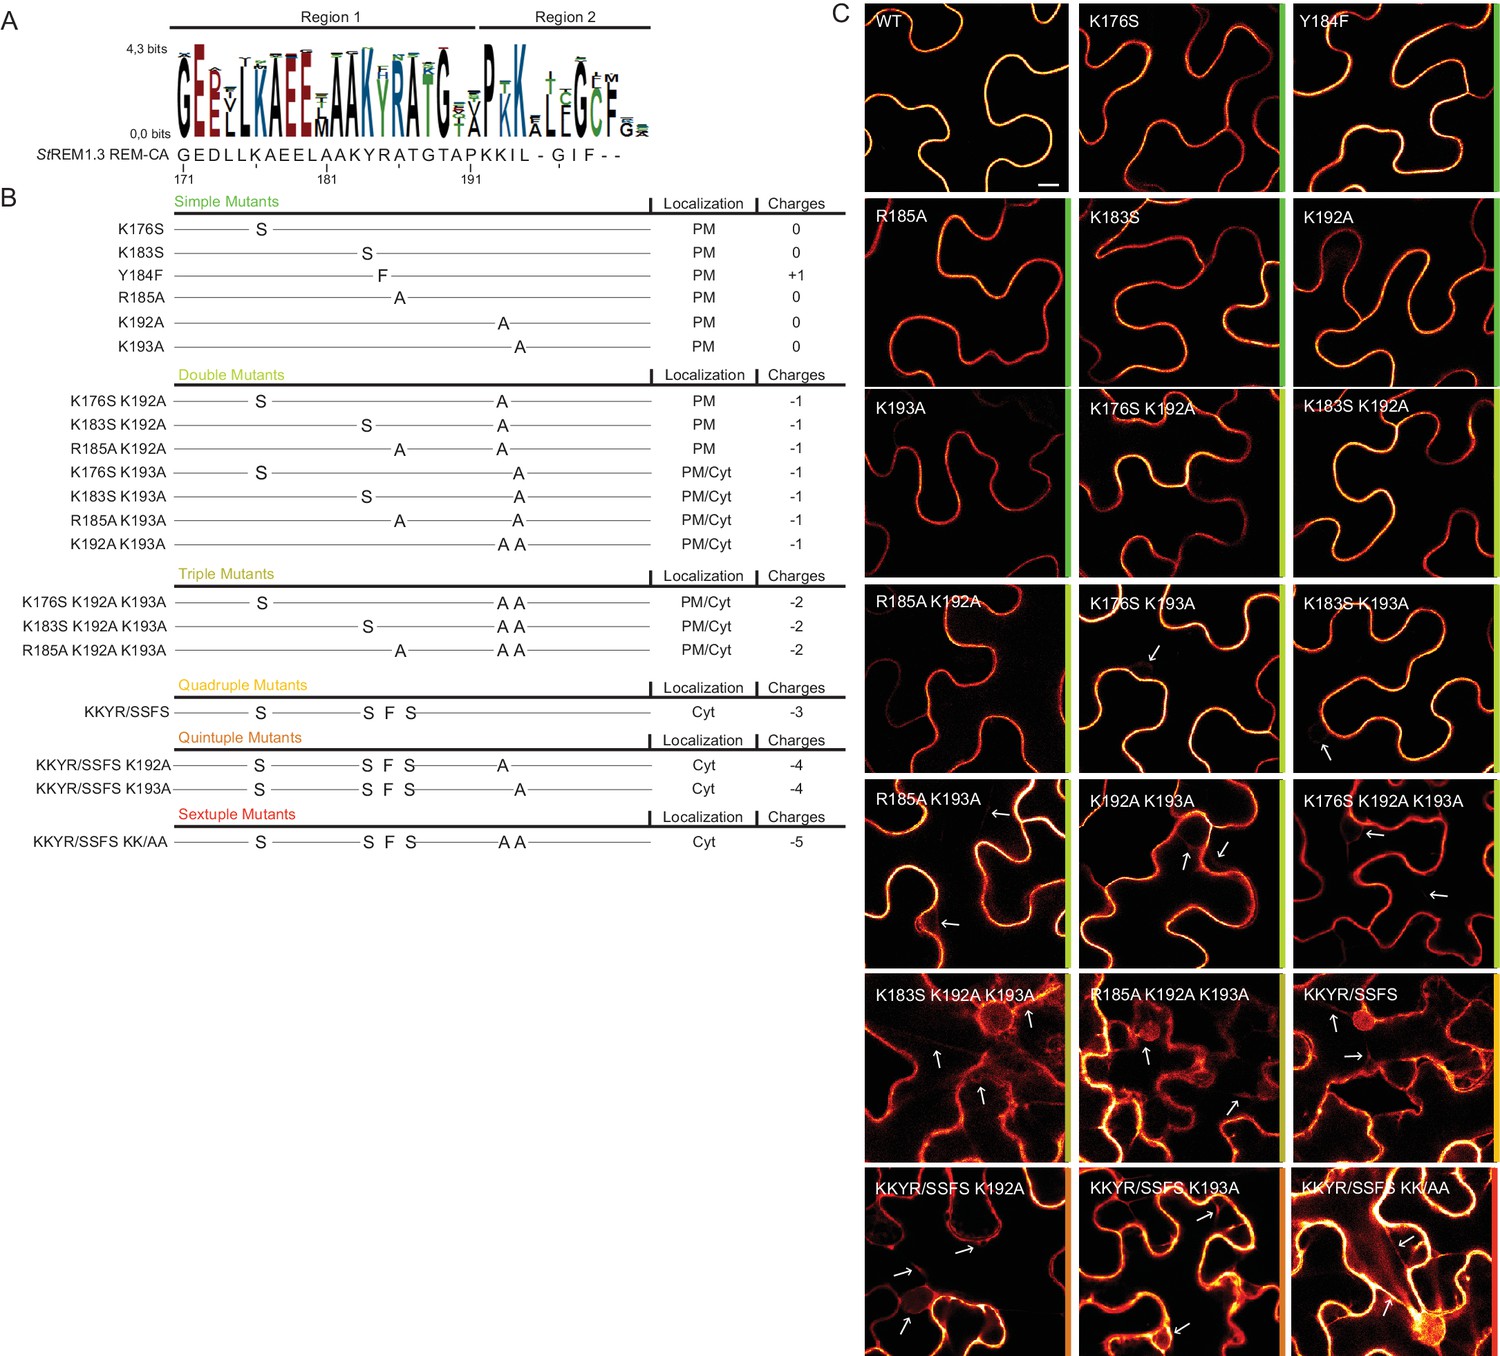
Positively charged residues of REMORIN C-terminal anchor are essential for PM targeting.
(A) Sequence Logo obtained from 51 Group 1 REM-CA sequences presented in Figure 1—figure supplement 1, and StREM1.3 REM-CA sequence. (B) Summary of the 20 REM-CA mutants of StREM1.3 generated in this study and their corresponding subcellular localizations. PM, Plasma Membrane; Cyt, Cytosol. The total electrostatic charge of each mutated REM-CA is indicated. (C) Confocal images presenting secant views of N. benthamiana epidermal cells expressing 20 YFP-StREM1.3 REM-CA mutants (single to sextuple mutations), 48 hr after agroinfiltration. Scale bar of 10 µm applies to all images.
Figure 4 with 1 supplement
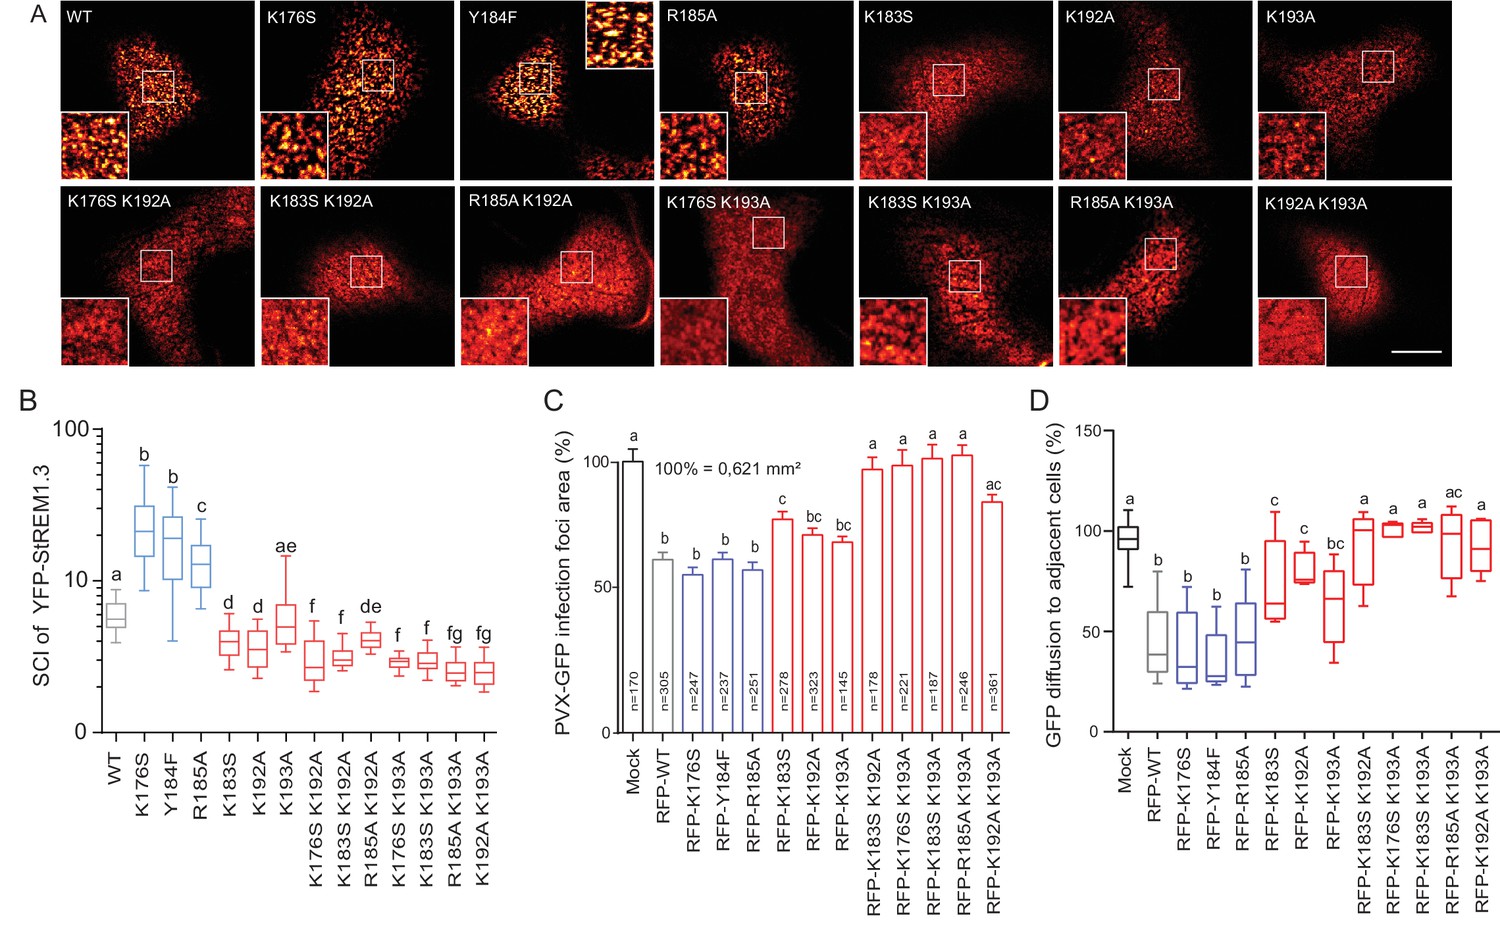
Positively charged residues of REMORIN C-terminal Anchor are essential for PM nanodomain localization and REMORIN function in cell-to-cell permeability.
(A) Surface view confocal images of the localization of REM-CA single and double mutants. Scale bar, 10 µm. (B) Tukey boxplot showing the Spatial Clustering Index of the REM-CA single and double mutants. Letters indicate significant differences revealed by Dunn’s multiple comparisons test p<0.05 (n = 3). (C) Quantification of Potato Virus X fused to GFP (PVX:GFP) cell-to-cell movement alone (Mock) or co-expressed with StREM1.3 WT or StREM1.3 REM-CA single and double mutants. Tukey boxplots represent the PVX:GFP infection foci area normalised to the mock condition. Letters indicate significant differences revealed by Dunn’s multiple comparisons test p<0.05 (n = 3). (D) Plasmodesmal permeability assessed in the presence of WT, single or double mutants of REM-CA, according to (Perraki et al., 2012). Tukey boxplots represent the percentage of cells presenting a free diffusion of the GFP (n = 3), letter indicate significant differences revealed by Dunn’s multiple comparisons test p<0.05 (Statistical analysis in Figure 4—figure supplement 1).
Figure 4—figure supplement 1
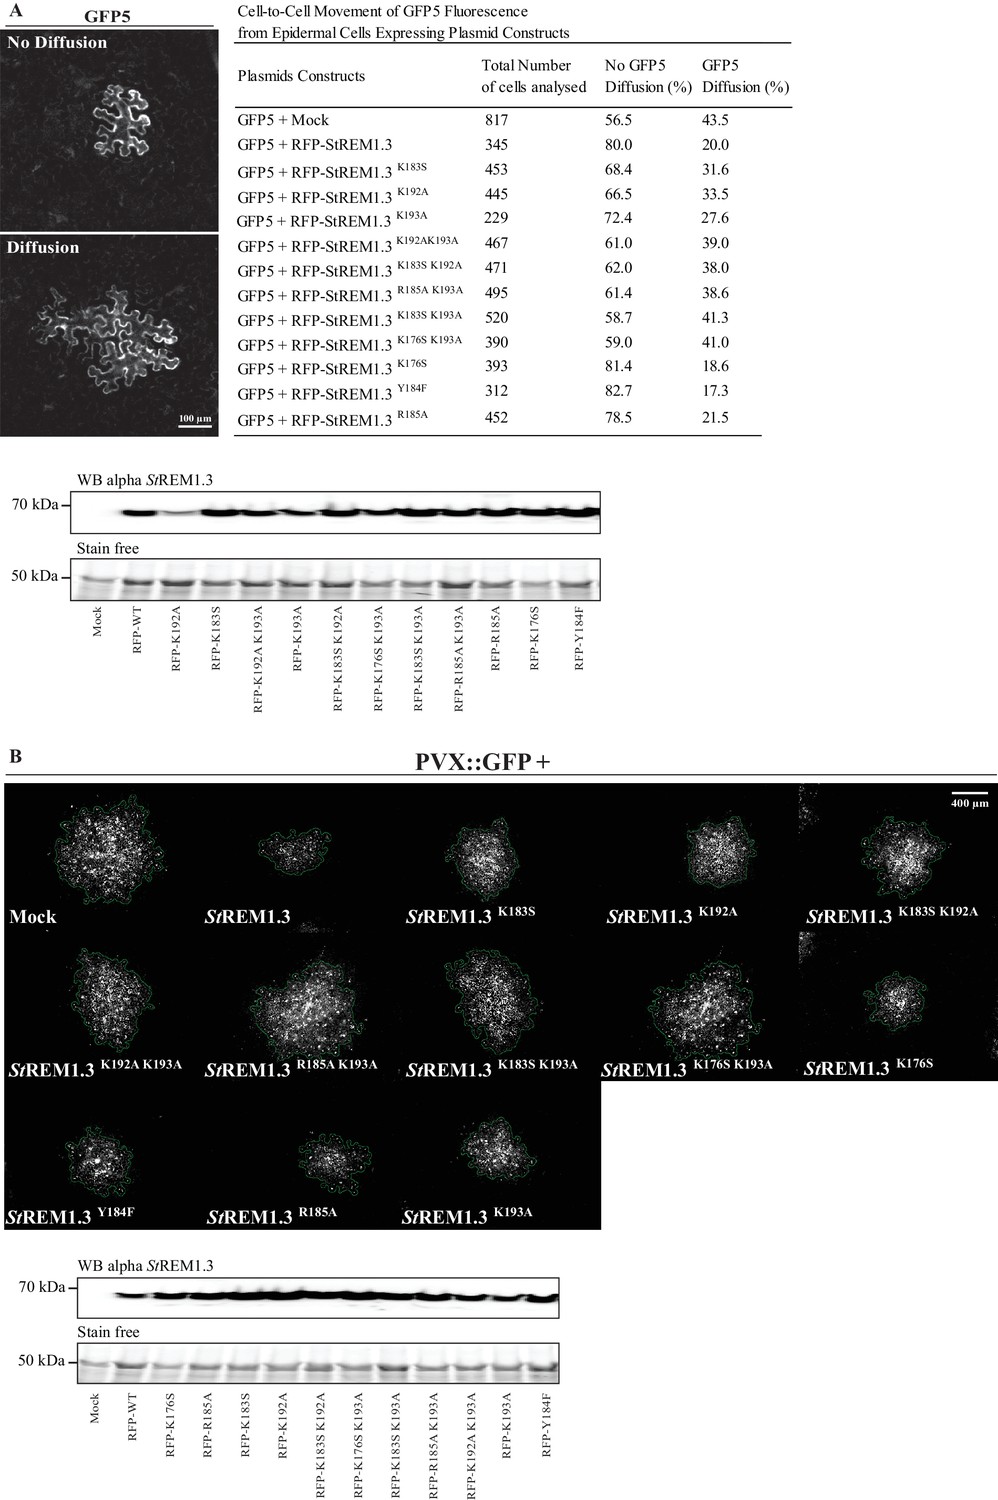
Effect of StREM1.3 REM-CA mutant over-expression on plasmodesmata permeability and PVX cell-to-cell movement.
(A) Plasmodesmata permeability test performed by visualizing cell-to-cell movement of GFP from a single-cell to its neighbors. Epifluorescence microscopy images represent a single-cell where GFP has not diffused to neighboring cells (no Diffusion) and another transformed single-cell where GFP has diffused to three neighboring cells (Diffusion) Scale bar, 100 µm. Plasmodesmal permeability was assessed with GFP alone, or in the presence of RFP-StREM1.3 mutants 5 days after infiltration, resume of results obtain from at least three independent experiments are provided in the table. Bottom panel, Total proteins extracted from leaf samples of the plasmodesmal permeability test and probed by anti-StREM1.3 antibodies (Raffaele et al., 2009) for each condition. (B) Representative epifluorescence microscopy pictures of PVX:GFP infection foci on N. benthamiana leaf epidermal cells for 12 RFP-StREM1.3 constructs 5 days after infection. Scale bar, 400 µm. Bottom panel, Total proteins extracted from leaf samples of the PVX:GFP infection assay and probed by anti-StREM1.3 antibodies (Raffaele et al., 2009) for each condition.
Figure 5
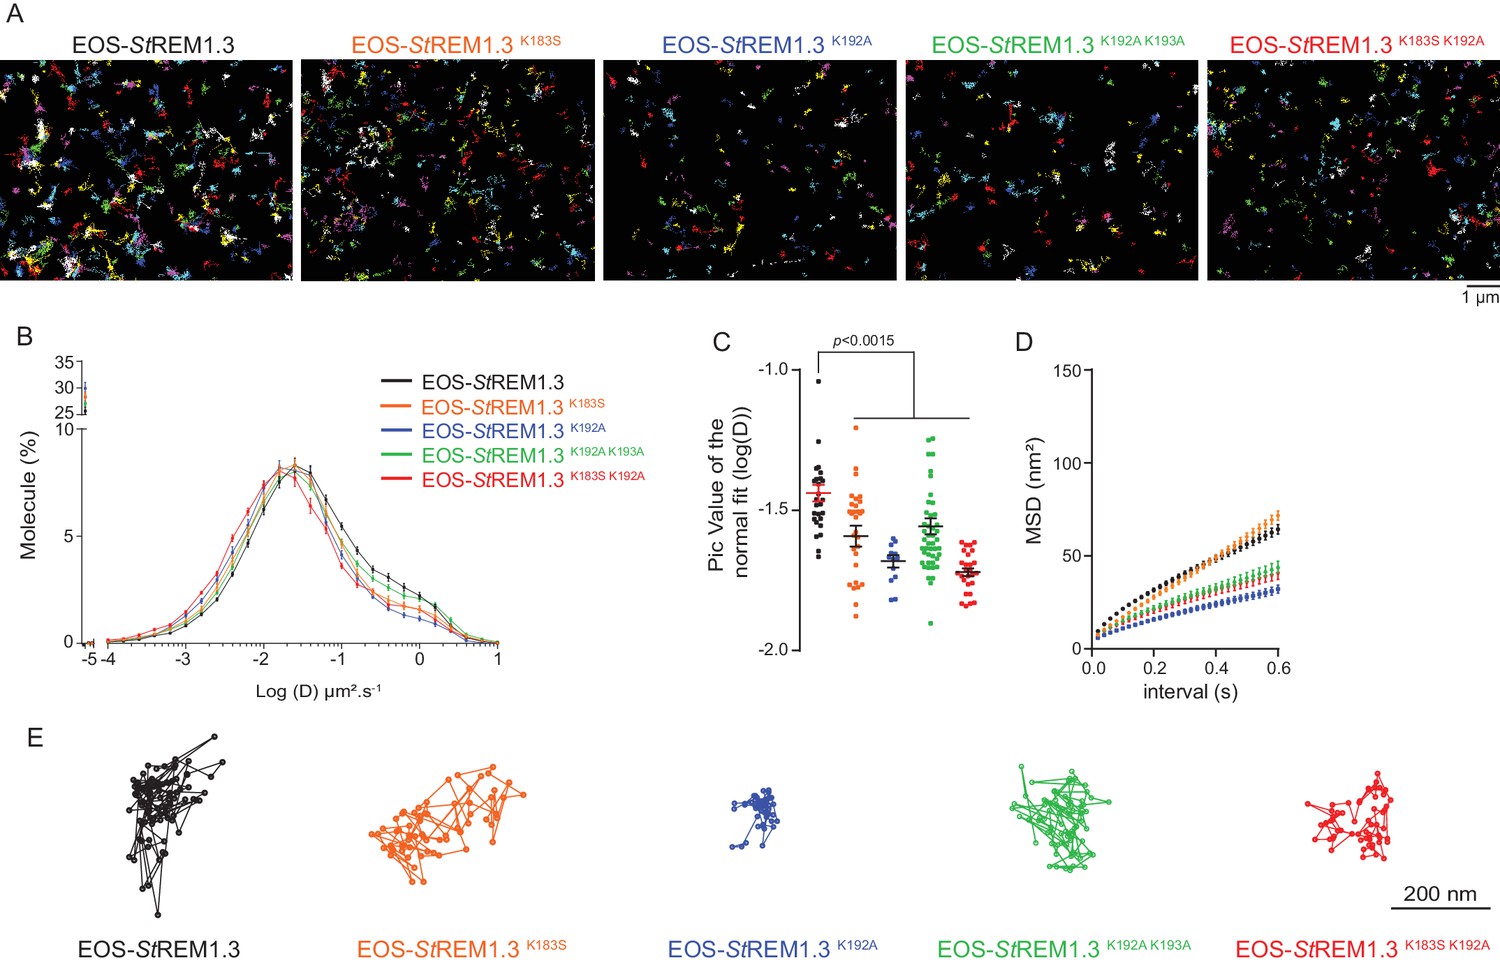
REMORIN C-terminal anchor defines protein mobility in the PM.
(A) Super-resolved trajectories (trajectories > 20 points;) of EOS-StREM1.3 WT and REM-CA mutants (K183S, K192A, K183S/K192A and K192A/K193A) visualized by high-resolution microscopy spt-PALM VAEM. 3. (B,C) Distribution of diffusion coefficients (D) represented as log(D) of the different fusion proteins and distributions of the peak D values of individual cells obtained by normal fits and were plotted as log(D), bar indicates mean ± s.e.m. (D) Mean Square Displacement (MSD) over time for the global trajectories > 15 points of each EOS-StREM1.3 construct (n = 13 to 51 cells over three independent experiments). (E) Representative trajectories of StREM1.3 WT and REM-CA mutants. Significant differences revealed by Dunn’s multiple comparisons.
Figure 6
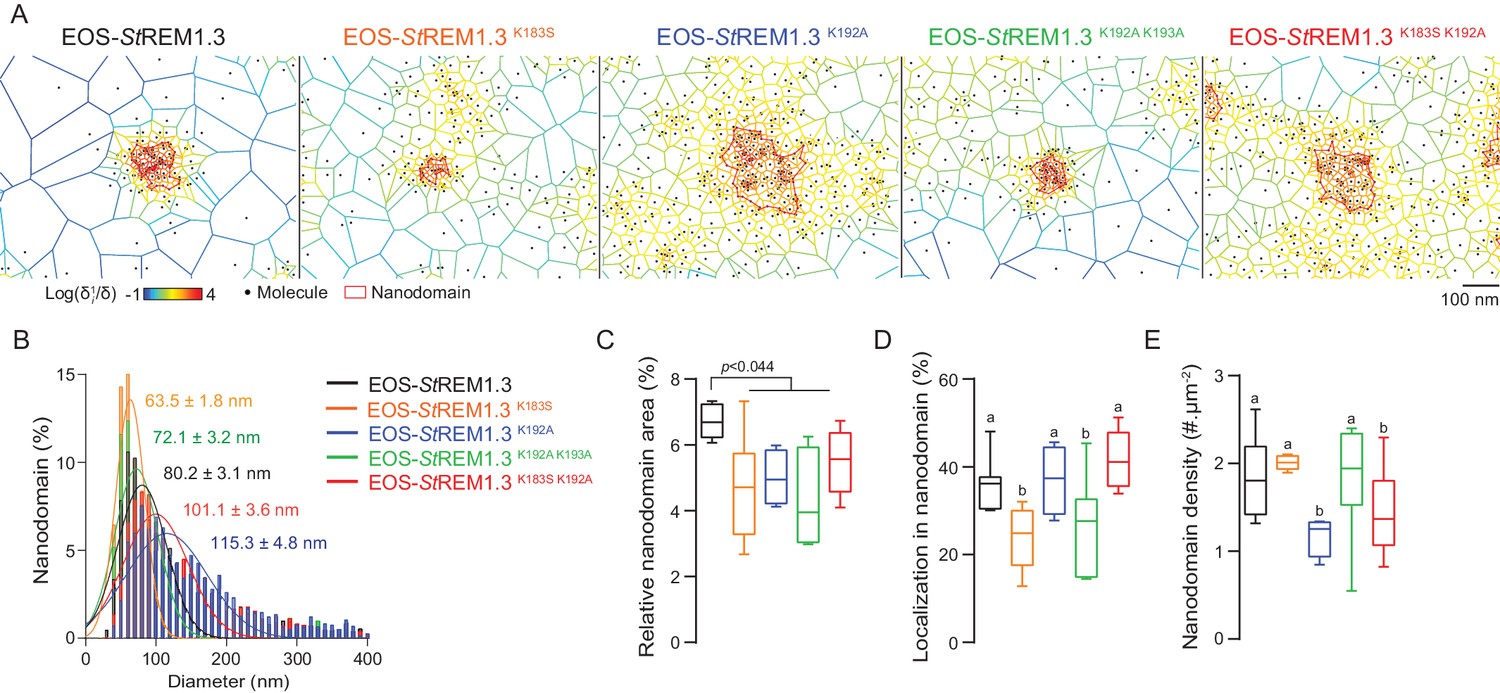
REMORIN C-terminal anchor defines protein segregation in nanodomains.
(A) Live PALM analysis of molecules localization by tessellation-based automatic segmentation of super-resolution images. (B) Diameter distributions of the cluster of EOS fusion proteins (line shows the Gaussian fit). (C) Nanodomains surface expressed in percentage of the total PM surface. (D) Percentage of molecule localizing in nanodomain. (E) Nanodomain density (number of nanodomain.µm−2) for the indicated proteins. Statistics were performed on at least six data sets per construction, see online methods for details. Letter indicate significant differences revealed by Dunn’s multiple comparisons test p<0.05.
Videos
Video 1
Molecular dynamics (MD) simulation reveals interactions between REM-CA residues and lipids in the ternary lipid mixture.
MD coarse-grained simulations propose a model of the insertion of REM-CA in the lipid bilayer (PLPC/PI4P/sitosterol), where peptide-lipid interaction would be mediated by the interaction of REM-CA with the phosphate groups of PI4P (in gold) and the embedment of the region 2 (in yellow) inside the lipid phase, see online methods.
Video 2
Live-cell single-particle tracking-photoactivable localization microscopy in variable angle epifluorescence microscopy mode.
RAW DATA spt-PALM VAEM was performed on N. benthamiana leaf epidermal cells expressing EOS-StREM1.3.
Download links
A two-part list of links to download the article, or parts of the article, in various formats.
Downloads (link to download the article as PDF)
Open citations (links to open the citations from this article in various online reference manager services)
Cite this article (links to download the citations from this article in formats compatible with various reference manager tools)
Structural basis for plant plasma membrane protein dynamics and organization into functional nanodomains
eLife 6:e26404.
https://doi.org/10.7554/eLife.26404


