Ubiquilin1 promotes antigen-receptor mediated proliferation by eliminating mislocalized mitochondrial proteins
- Genentech, United States
- Harvard Medical School, United States
Figures
Figure 1 with 1 supplement
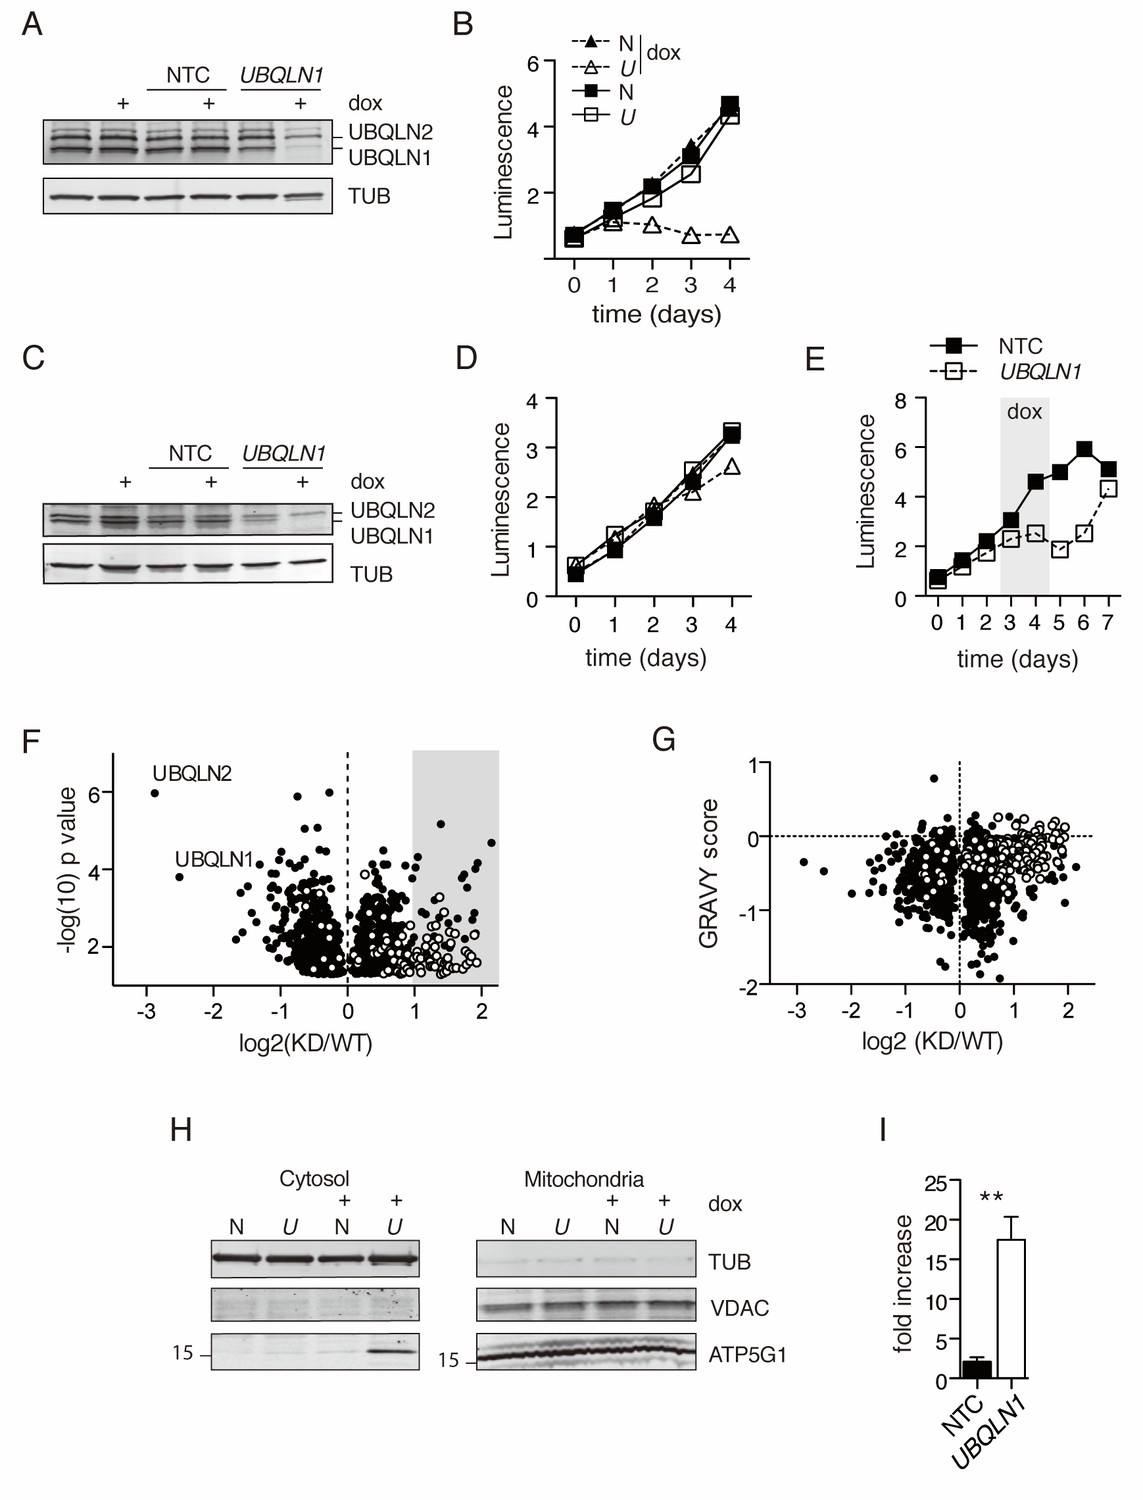
Mitochondrial proteins accumulate in the cytosol in the absence of UBQLN1.
(A) Uninfected BJABs, or cells infected with a lentiviral construct containing non-targeted control (NTC) or UBQLN1- shRNA (construct #1 from Figure 1—figure supplement 1) were incubated with 100 ng/mL doxycycline (+dox) or vehicle for 72 hr, following which UBQLN1 and Tubulin were detected by western blot. (B) BJAB cells stably transfected with UBQLN1- (U, open symbols) or an NTC-shRNA (N, filled symbols) were incubated with doxycycline (triangles) or vehicle (squares) for 4 days. Viable cells were measured with the Cell Titer Glo (Promega) assay in duplicate with mean ±SEM, and luminescence quantified as arbitrary units. One representative experiment of two is shown. (C) Untransfected HeLa cells, or cells stably transfected with NTC- or UBQLN1 shRNA were treated similarly to BJABs and western blotted as in Figure 1A. (D) Viable cells were measured as in (Figure 1B) for HeLa cells. (E) BJAB cells containing either an NTC- or UBQLN1 shRNA construct (#1) were cultured in the presence of 100 ng/mL doxycycline starting at day 2 and then washed to remove doxycycline (grey-shaded box). The number of viable cells was estimated by CellTiter Glo as arbitrary units of luminescence in duplicate wells. Each line represents the average of duplicate wells with mean ± SEM. (F) Isolated cytosolic protein from NTC- or UBQLN1- shRNA expressing BJABs was labeled in triplicate with TMT and analyzed by mass spectrometry. Shown are the roughly 1300 significantly altered (p<0.05) proteins and their relative enrichment in UBQLN1-depleted cytosol. Mitochondrial proteins, as listed in Mitocarta 2.0 (Calvo et al., 2016), are shown in white. Grey box highlights proteins that were at least twofold accumulated in KD cytosol (92 proteins), which were used for DAVID pathway analysis. (G) Proteins identified in (F) were plotted according to their GRAVY score against their relative enrichment in UBQLN1-depleted cytosol. As in (F), mitochondrial proteins are shown in white. (H) Cellular fractionation of BJAB cells after 48 hr with 100 ng/mL doxycycline. Cells were fractionated according to Materials and Methods. Samples were blotted for mitochondrial proteins VDAC and ATP5G1, as well as for Tubulin. ATP5G1 ran at 17 kDa and thus represents the precursor form of the protein before mitochondrial insertion. N: Non-targeting shRNA construct. U: UBQLN1 shRNA construct. Shown is one representative experiment of three. (I) Quantification of ATP5G1 in cytosolic fractions of BJABs from three independent experiments. ATP5G1 was normalized to Tubulin in each sample. Data shown are mean ±SEM, and significance was determined with an unpaired Student’s T test.
-
Figure 1—source data 1
TMT MS3 results for BJAB cytosol.
Protein identity is described with Uniprot ID, Gene symbol (where applicable), and Description. Number of peptides quantified by MS3 shown for all identified proteins. Numbers in the orange and yellow columns are the relative enrichment of proteins in each replicate sample, which is averaged to the right. Both the raw ratio and log2-transformed ratio of averages are also shown. p-Values were generated through an unpaired Student’s T test of replicates. Color codes for log2 ratio and p value are explained to the right of each table. To generate ‘Mitocarta 2.0’ and ‘GRAVY’ results, samples were matched to datasets of Mitocarta 2.0 (Calvo et al., 2016) and GRAVY was calculated using the values from Kyte and Doolittle (1982). Proteins found in the Mitocarta 2.0 dataset return a ‘YES’ result.
- https://doi.org/10.7554/eLife.26435.004
Figure 1—figure supplement 1
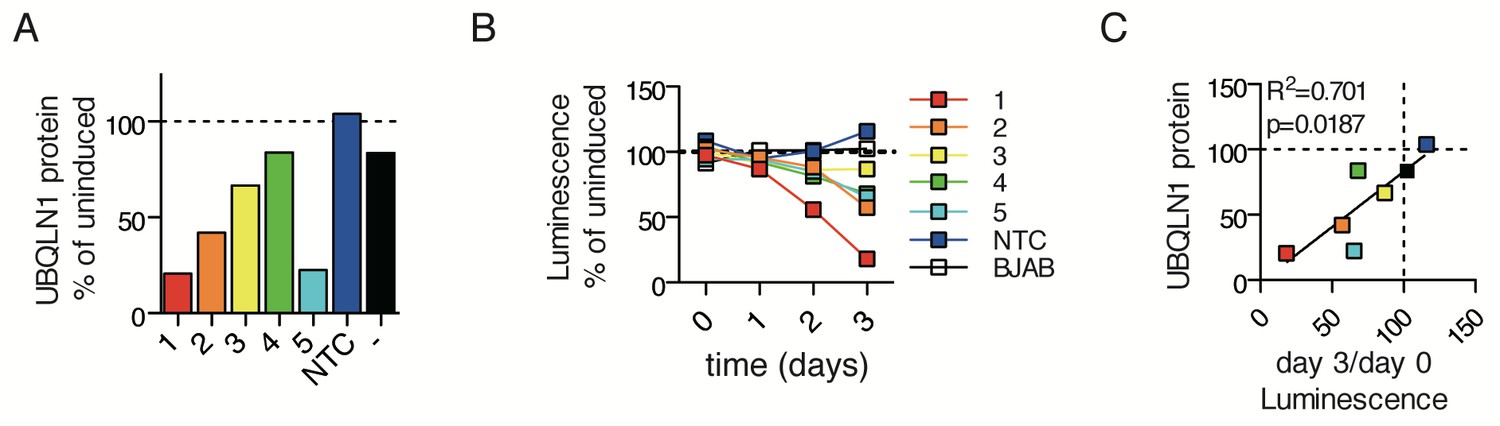
Selection of UBQLN1 shRNAs.
(A) Ubqln1 protein levels following 48 hr of doxycycline induction of UBQLN1 shRNAs stably transfected into BJABs. For each shRNA line, dox-induced UBQLN1 protein levels are compared to uninduced. BJAB control (-) is untransfected cells. (B) Cell proliferation of BJABs containing different UBQLN1 shRNAs following dox induction. For each shRNA line, dox-induced cell titer glo levels were compared to uninduced wells. (C) Correlation of (A) and (B).
Figure 2 with 1 supplement
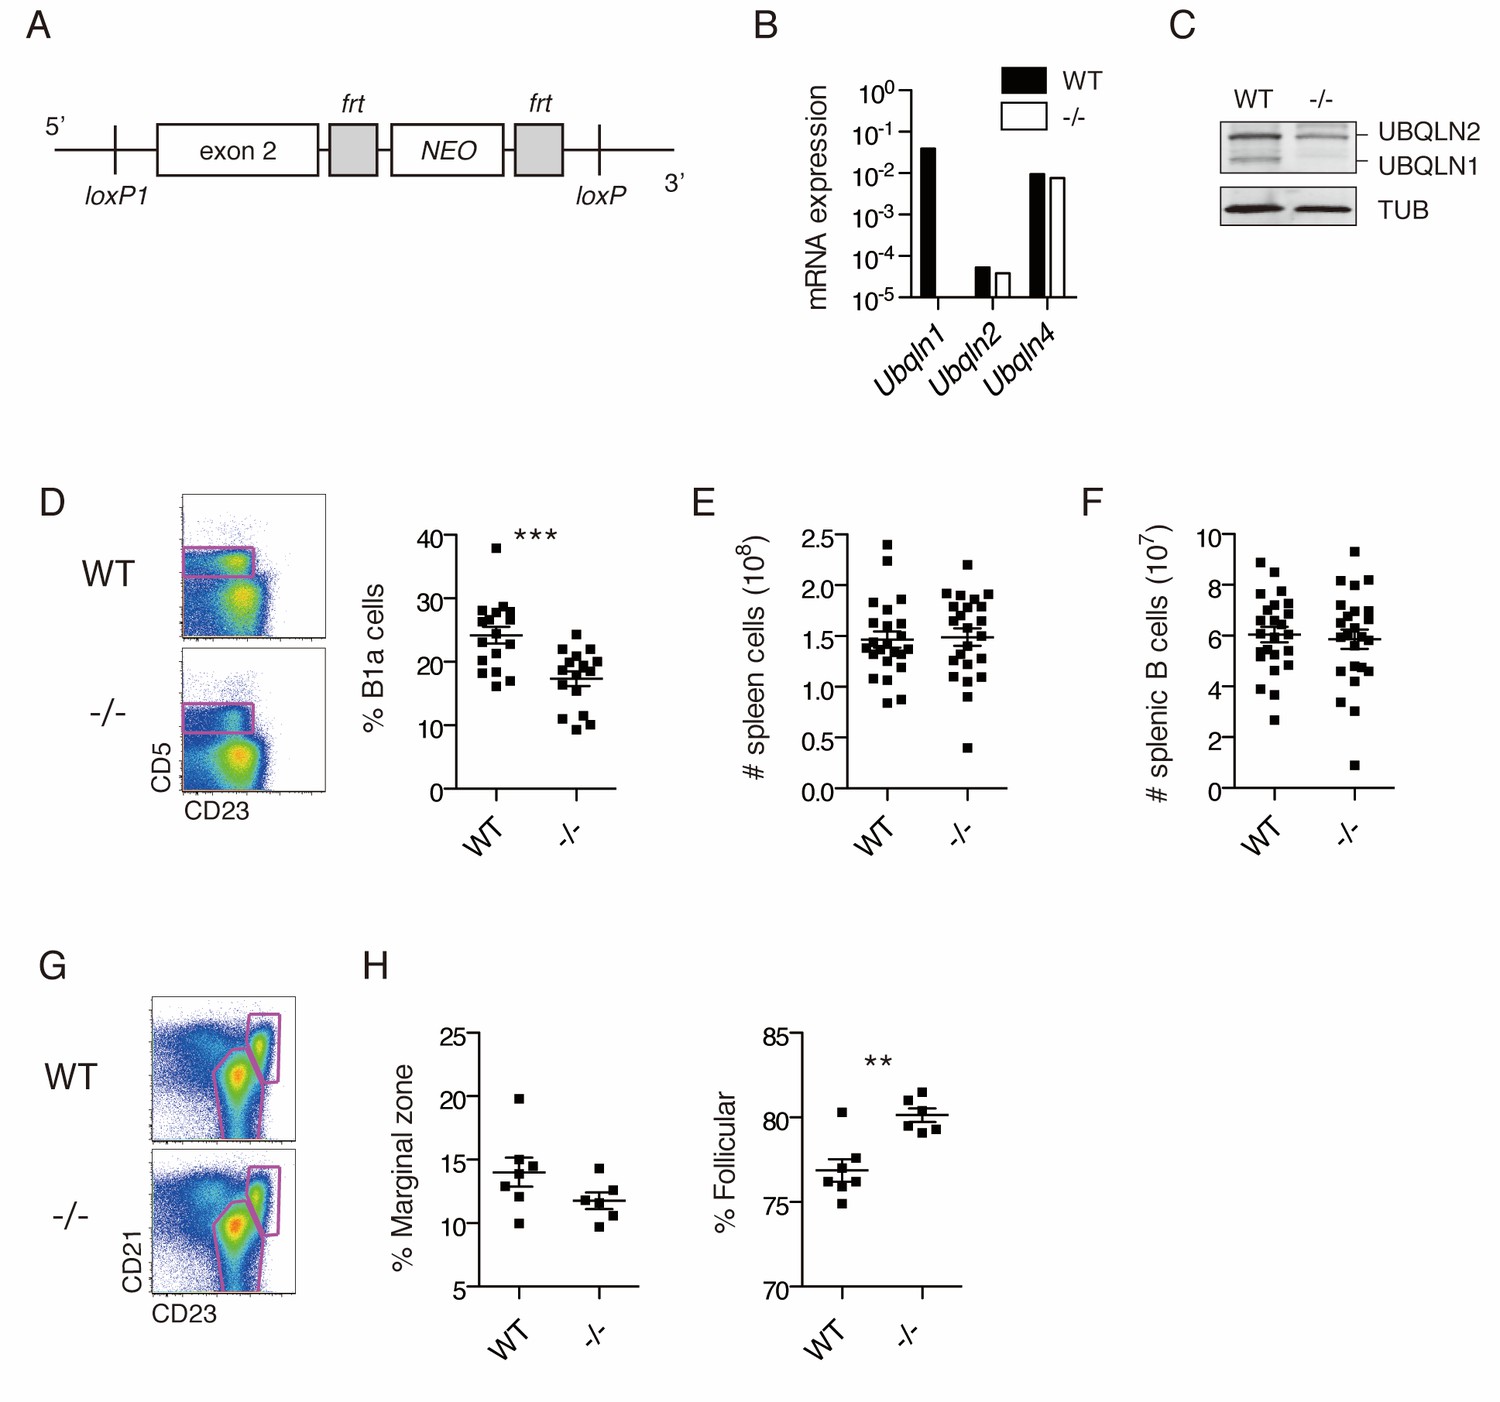
Ubqln1−/− mice have a specific defect in peritoneal B cells.
(A) Ubqln1 knockout strategy. Exon 2 of Ubqln1 was floxed and the Neo gene deleted in vitro by using Flp recombinase. Exon 2 was deleted by expression of CRE in ES cells. (B) mRNA expression of Ubqlns1, 2, and 4 in isolated splenic B cells. Each Ubqln mRNA was normalized to Gapdh. Ubqln1 appears negative due to deletion of the genomic region containing QPCR primer. (C) Protein levels of UBQLNs 1 and 2 in primary B cells by western blot. No truncated UBQLN1 protein product could be detected by polyclonal antibody. (D) Peritoneal B1a cells are decreased as a proportion of total peritoneal B cells in Ubqln1−/− mice. B1a cells were identified as a proportion of total B cells in the peritoneum from mice ≥ 8 weeks of age. On the left are representative dot plots of B cells (CD19+ FSClo cells) showing B1a cell gating strategy. Graph on the right depicts % of peritoneal B cells that are B1a. Each point represents one mouse. (E) Total spleen cells in WT or Ubqln1−/− littermate mice at least 8 weeks of age. (F) Total number of splenic B cells in WT or Ubqln1-/- littermate mice at least 8 weeks of age. (G) Representative gating strategy for identification of Marginal zone (top right gate) and Follicular B cells (bottom gate) of the spleen. Shown are live B cells (CD19+, FSClo). (H) Quantification of Marginal zone (CD21+, CD23int) and Follicular B cells (CD21int, CD23+) as a proportion of total splenic B cells. For (D, E, F, and H), data shown are mean ±SEM and significance was determined with a paired T-test.
Figure 2—figure supplement 1
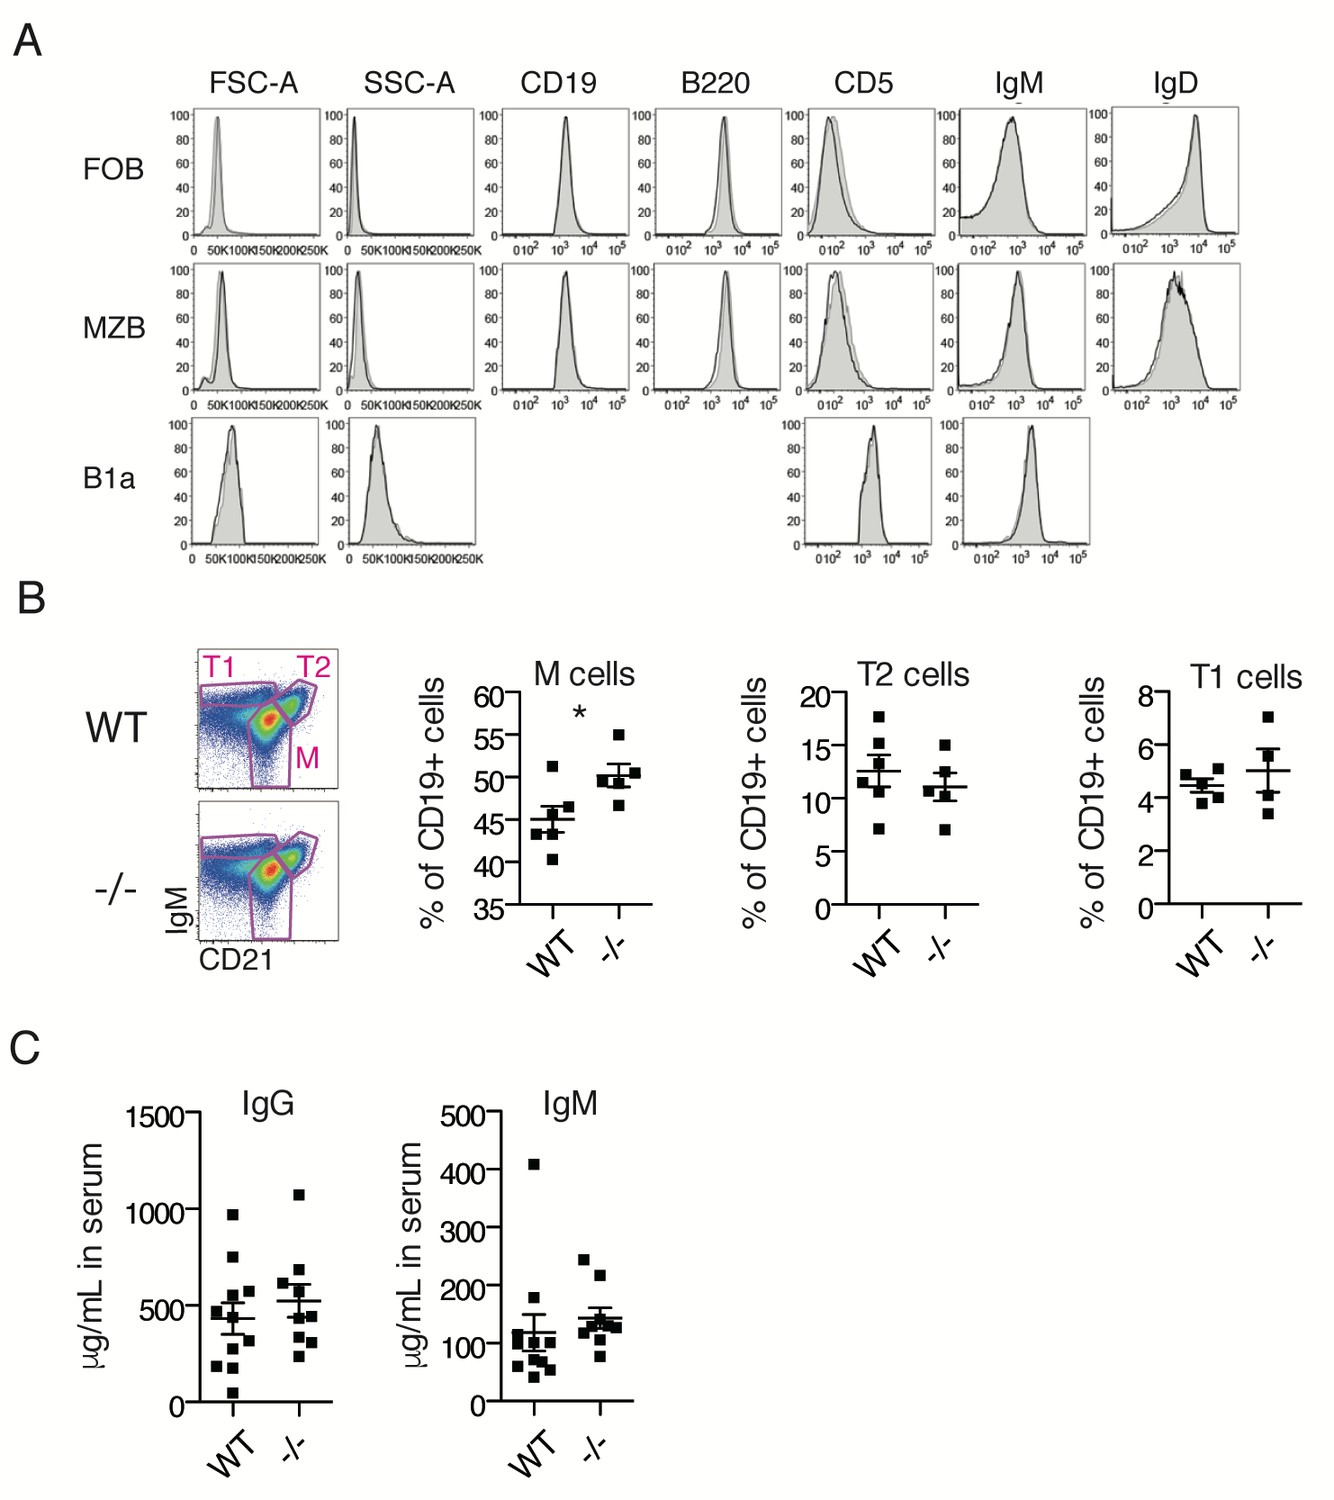
Additional phenotyping of Ubqln1−/− mice.
(A) Splenic Follicular and Marginal zone B cells, and peritoneal B1a cells from WT (black line) or Ubqln1−/− (grey shaded) mice express similar levels of typical surface markers, including IgM. (B) Proportions of immature T1, T2, and mature B cells in spleens of WT and Ubqln1−/− mice. T1 cells were defined as IgMhi and CD21lo; T2 cells were defined as IgMint, CD21hi, and M cells were defined by IgMint/- and CD21+. (C) Serum IgM (left) and IgG (right) concentrations in naive adult WT and Ubqln1−/− mice as measured by ELISA. Each point represents one mouse; mean ±SEM of 11 WT and 9 Ubqln1−/− mice are shown.
Figure 3 with 2 supplements
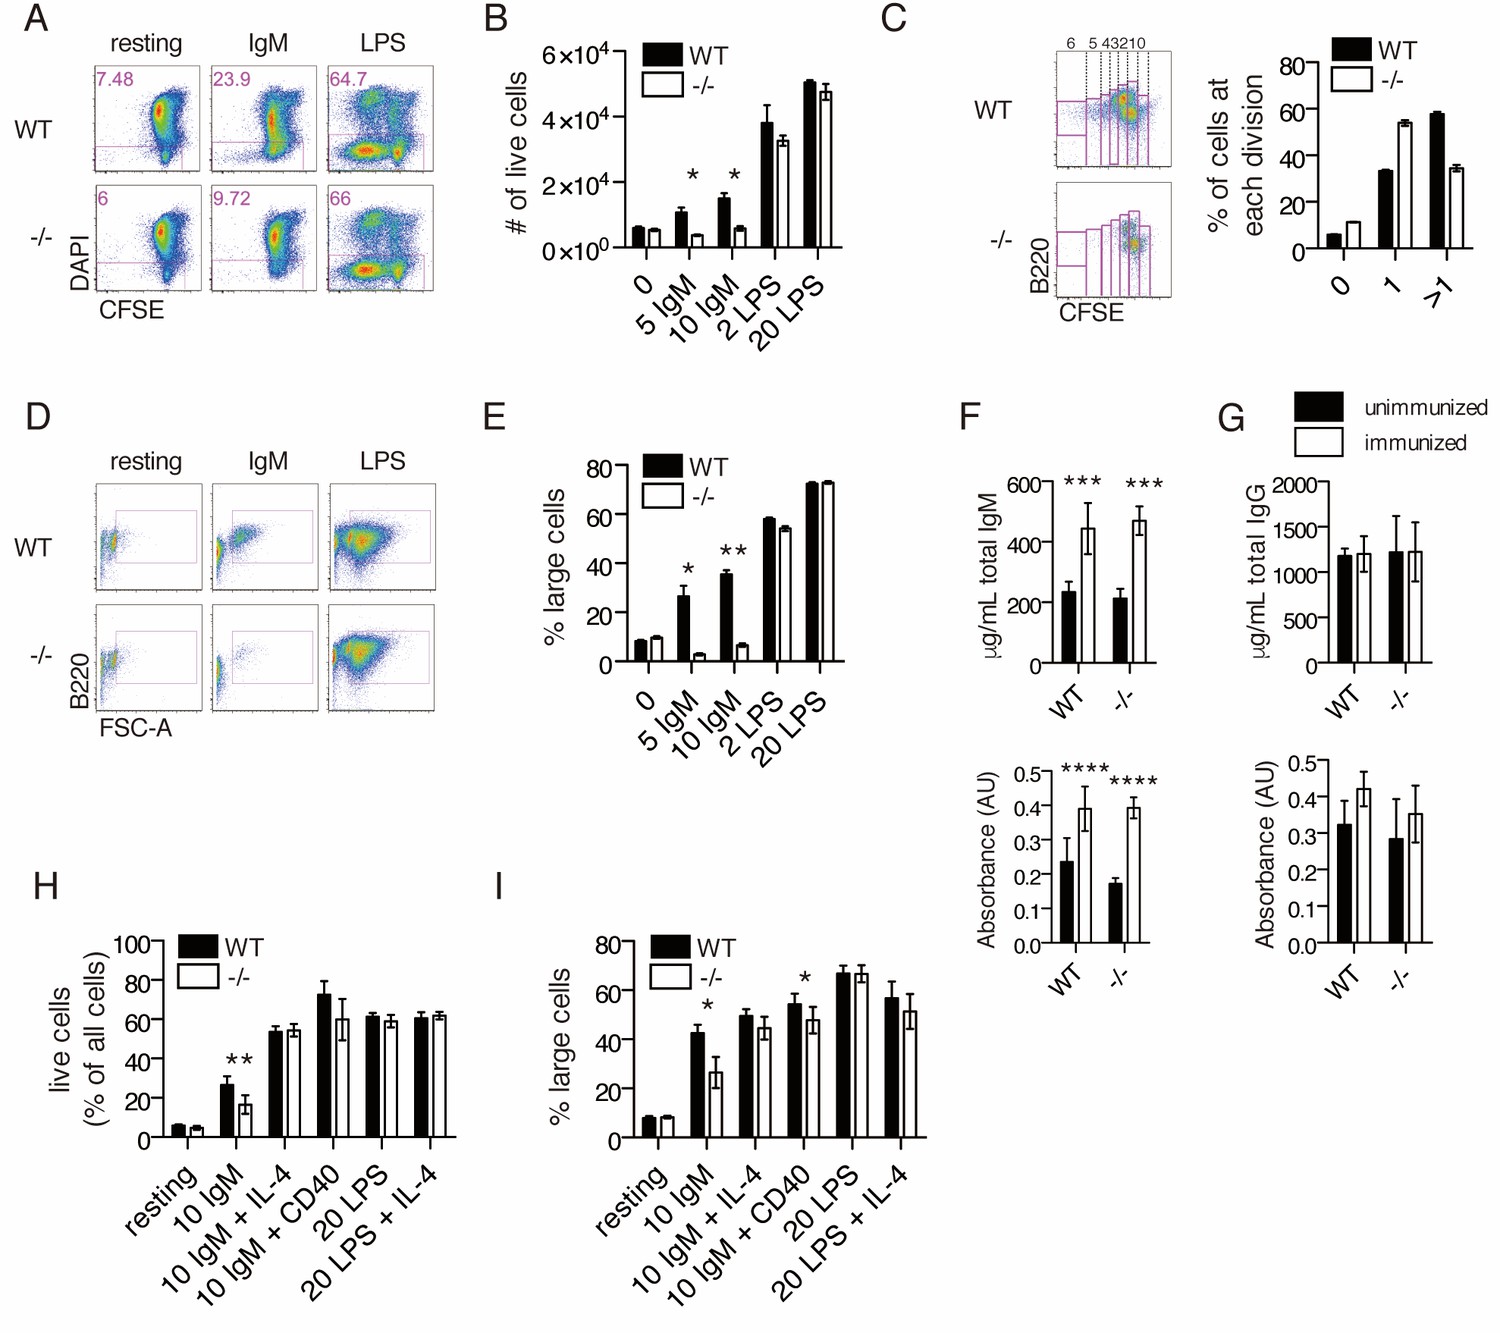
Ubqln1−/− B cells are defective in response to BCR stimulation.
(A) Isolated splenic B cells from WT or Ubqln1−/− mice ≥8 weeks old were CFSE-stained and incubated with mitogen for 3 days. Shown are representative dot plots with live cells gated in pink. (B) Quantification of live cells in each well after 3 days of stimulation from one representative experiment of 6. Significance was determined with unpaired T tests. (C) CFSE dilution of IgM-stimulated WT and Ubqln1−/− cells treated as in (A) was analyzed by FACS, and fluorescence dilution converted to number of cell divisions. On the left are representative dot plots showing quantification of CFSE dilution. Number of cell divisions is demonstrated at top. Quantification of triplicate samples from the same experiment are shown at the right, by summing the populations within gates of cells that had divided at least once. (D) Live cells from (A) were plotted based on their size and B220 expression. (E) Quantification from triplicate samples in (D). One representative experiment of 6 is shown. Significance was determined with unpaired T tests. (F) Serum IgM antibody titers from WT or Ubqln1−/− mice immunized intraperitoneally with TNP-ficoll. Top: total IgM. Bottom: TNP-specific IgM. (G) Serum IgG antibody titers as in (H). Top: total IgG. Bottom: TNP-specific IgG. For (F–G), experiment was performed three times with at least six mice per genotype. (H–I) WT and Ubqln1−/− B cells were incubated in vitro with anti-IgM with or without addition of costimulation with either 10 μg/mL CD40 antibody or 40 ng/mL IL-4 for 3 days, following which the percentage of live cells (H) or the percentage of large live cells (I) were enumerated. Shown in (H–I) is summary data from N = 6 paired littermates. Significance was determined by paired T-test.
Figure 3—figure supplement 1

No in vitro B cell defects in the absence of other Ubqlns.
Ubqln2−/− (A) and Ubqln4−/− (B) B cells were incubated with anti-IgM or LPS and live cells enumerated after three days incubation as in Figure 1. Western blot of isolated B cells was also included to confirm UBQLN2 (A) or UBQLN4 (B) loss.
Figure 3—figure supplement 2
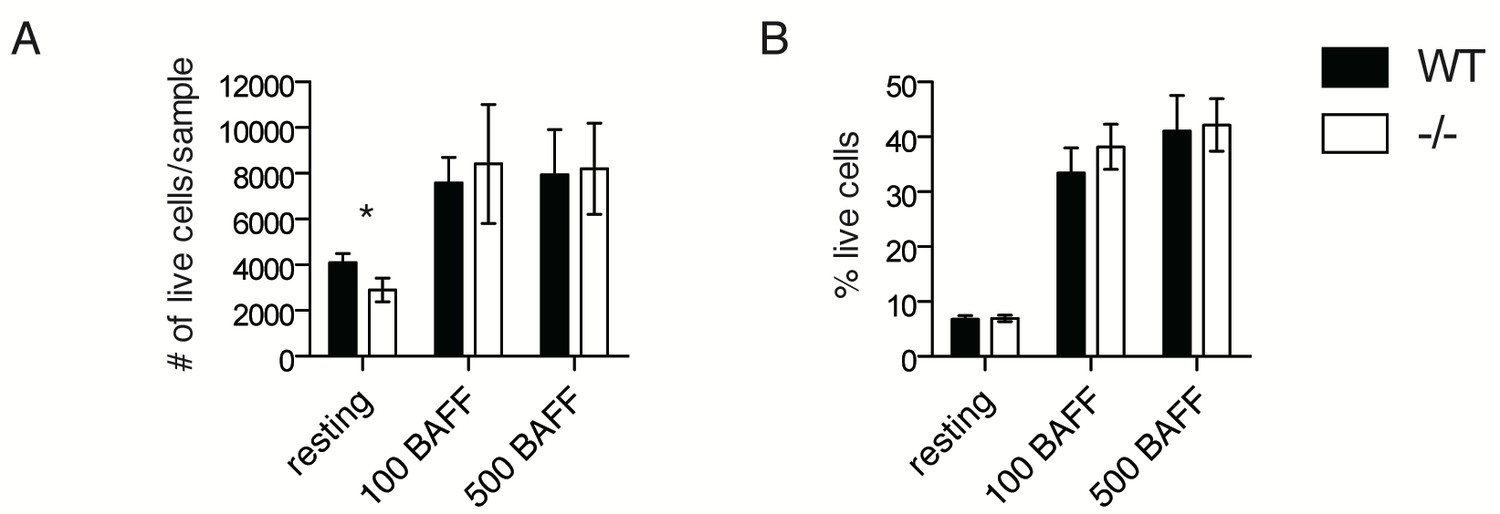
BAFFR signaling is not affected in Ubqln1−/− B cells.
(A,B) Primary B cells were isolated from WT and Ubqln1−/− mice as in Figure 3 and stimulated with 100 or 500 ng/mL recombinant human BAFF for 3 days, then analyzed by flow cytometry. In (A), total live cell # was quantified, and in (B), the proportion of live cells as a percentage of all cells was quantified. Experiments were performed six independent times with littermate mice. Shown is mean ± SEM of the averages from all experiments. Significance was determined with a paired Student’s T test.
Figure 4 with 2 supplements
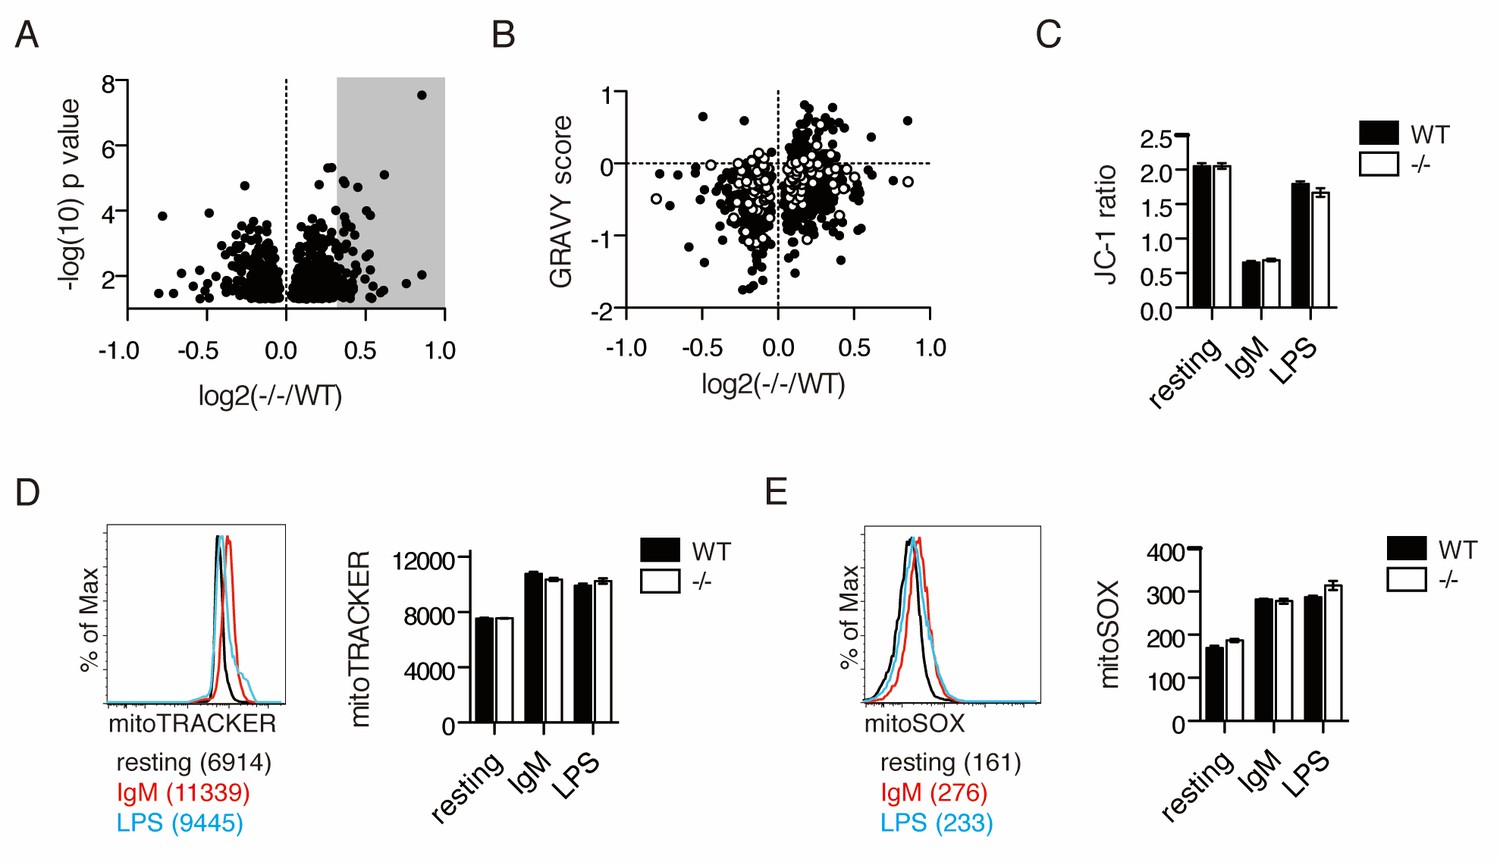
IgM stimulation causes Ubqln1-dependent changes in the proteome and depolarization of mitochondria.
(A) Cell lysates from five samples each of WT or Ubqln1−/− splenic B cells at 24 hr post-stimulation with 10 μg/mL anti-IgM were labeled with TMT 10-plex and analyzed by mass spectrometry. Shown are the roughly 800 annotated proteins that were significantly altered in Ubqln1−/− cells compared to WT cells. Not shown is UBQLN1 at log2(-/-/WT)=−2.720. Grey shadow represents hits that were at least 1.25-fold enriched in Ubqln1−/− lysate and used for DAVID pathway analysis. (B) As in Figure 1, GRAVY scores were calculated for proteins that were significantly altered between WT and Ubqln1−/− samples and plotted against their relative enrichment in Ubqln1−/− cells. As in Figure 1, mitochondrial proteins are shown in white. (C) Mitochondrial polarity of cells following stimulation was assessed with JC-1 dye. B cells cultured in triplicate in complete media or stimulated with anti-IgM or LPS for 24 hr were stained with JC-1 and the ratio of FITC to PE fluorescence o JC-1 dye was measured by flow cytometry. (D) Mitochondrial content of stimulated WT and Ubqln1−/− cells as measured with Mitotracker dye as in (C). On the left is a representative histogram showing Mitotracker staining, with Mean Fluorescence Intensity of one representative sample from each stimulation condition of WT cells shown in parentheses. (E) Mitochondrial ROX content as measured by Mitosox dye with cells as in (C–D). On the left is a representative histogram showing Mitosox staining, with Mean Fluorescence Intensity of one representative sample from each stimulation condition of WT cells shown in parentheses. For (C–E), data shown are mean ± SEM of biological triplicates from one of three independent experiments each. Significance was determined with an unpaired T test.
-
Figure 4—source data 1
TMT MS3 results for mouse B cell lysate.
Shown are MS3 results, along with Mitocarta and hydropathy data, for mouse B cell lysate as in Figure 1—source data 1.
- https://doi.org/10.7554/eLife.26435.014
Figure 4—figure supplement 1

Mitocarta visualization of B-cell proteome.
Proteomics results of stimulated WT and Ubqln1−/− B cells as in Figure 4A, with mitochondrial proteins as annotated by Mitocarta 2.0 highlighted in white.
Figure 4—figure supplement 2
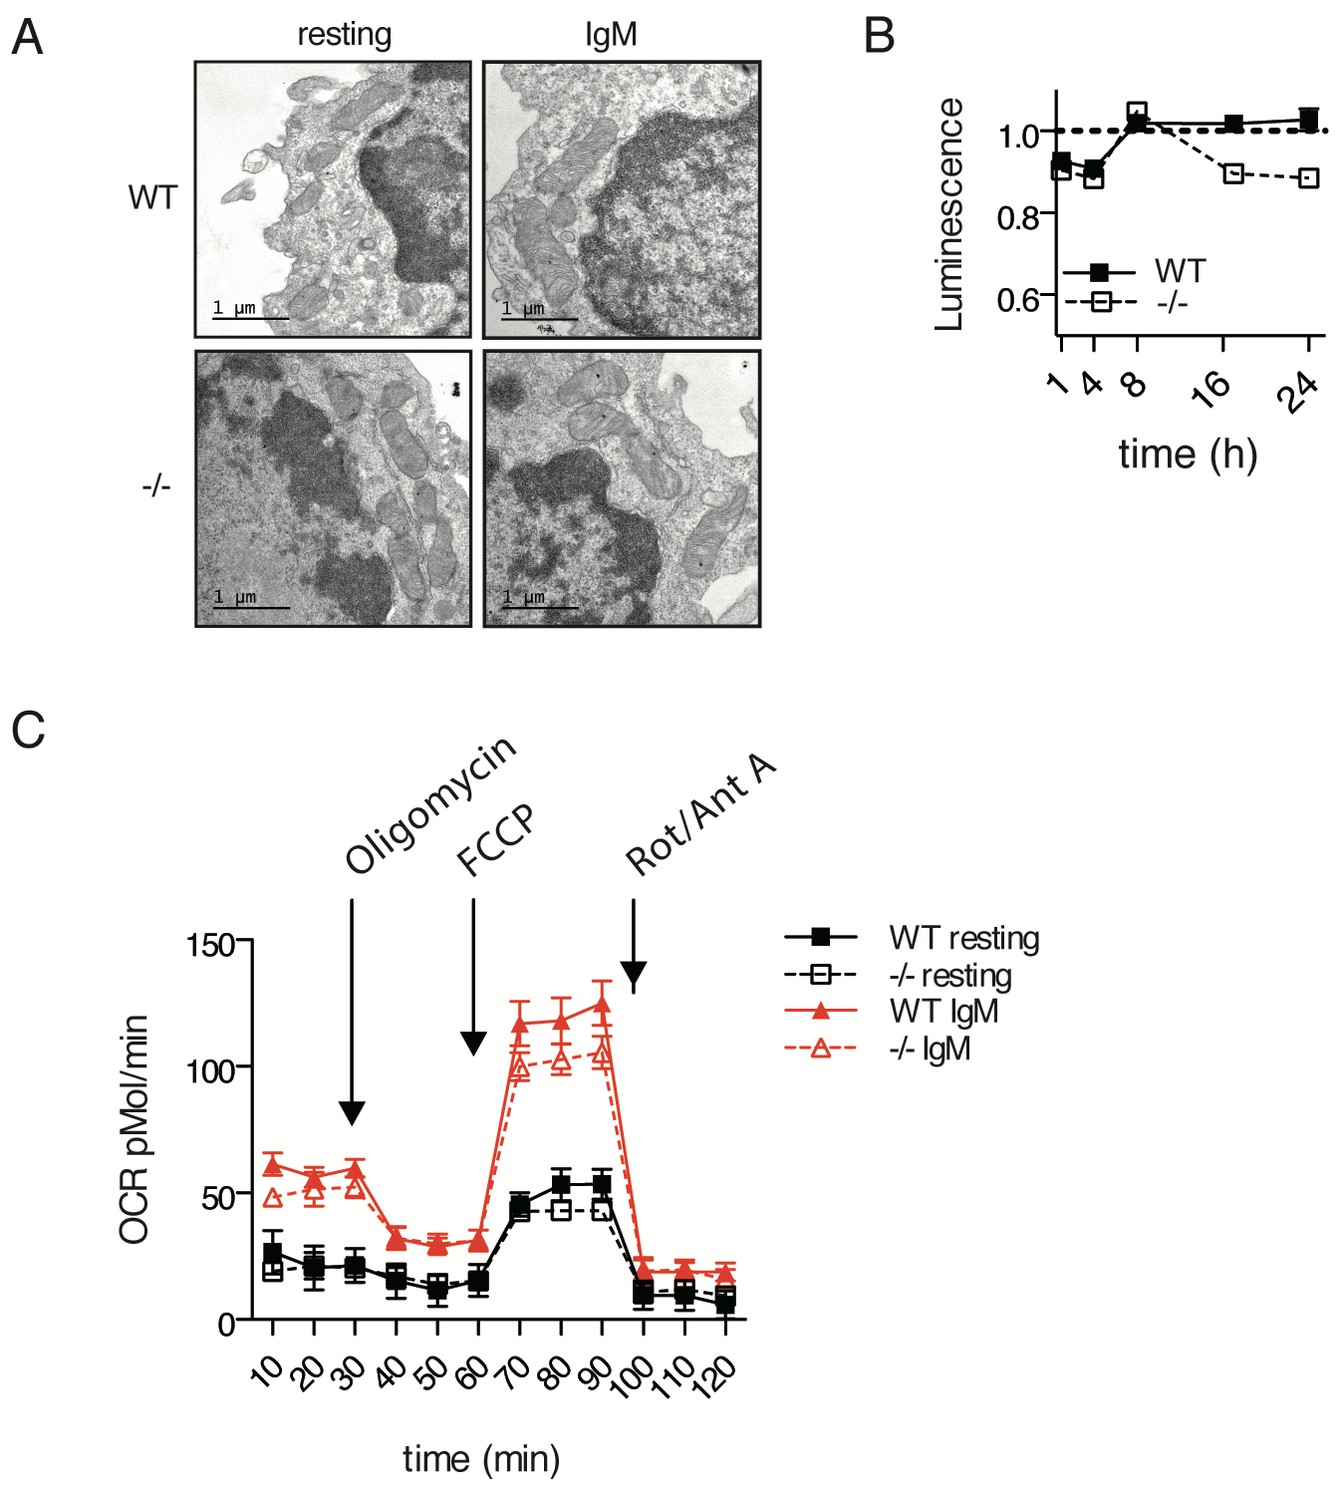
Additional mitochondrial tests show no effect of Ubqln1 loss.
(A) TEM images of resting or IgM-stimulated B cells of WT or Ubqln1−/− mice 24 hr post-stimulation showing normal mitochondrial morphology. (B) Ubqln1−/− cells display a modest defect in available ATP > 8 hr following stimulation with anti-IgM. Cells were plated in triplicate and maintained in complete medium or stimulated with 10 μg/mL anti-IgM. Available ATP was assayed with cell titer Glo and normalized to unstimulated cells to control for plating density. Shown is mean ± SEM. (C) Metabolic OXPHOS profiling of WT and Ubqln1−/− B cells. Stimulated (anti-IgM) or unstimulated WT and Ubqln1−/− B cells were harvested 24 hr after stimulation, counted, and replated in Seahorse culture plates coated with Cell-Tak. After equilibration, a standard Seahorse mitochondrial stress test (See Materials and methods) was performed with 1 μM Oligomycin, 1 μM FCCP, and 1 μM of rotenone and antimycin A injected sequentially. Shown is mean ± SEM of quintuplicate wells from a representative of three experiments.
Figure 5
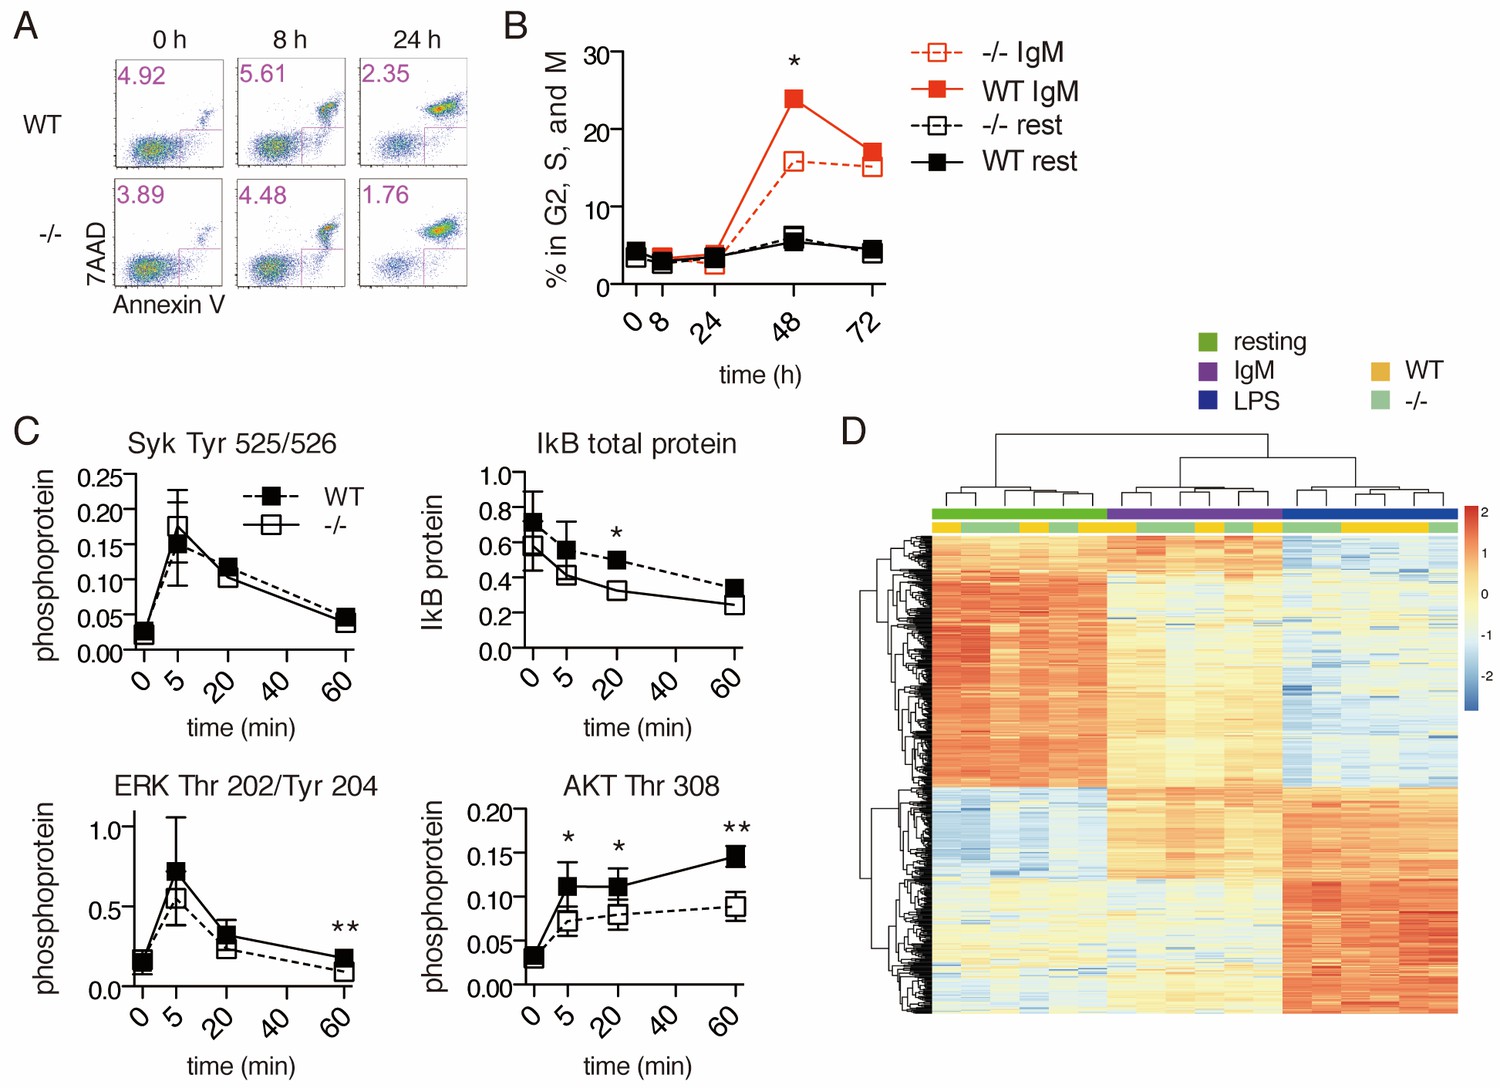
Signal transduction following BCR stimulation is normal in Ubqln1−/− cells.
(A) Apoptosis assay using Annexin V and 7AAD staining at 8 and 24 hr following BCR stimulation. Shown are one representative dot plot each from triplicate wells, from one representative experiment of three. Apoptotic cells are gated in pink and quantified in the top left corner of each dot plot. (B) Cell cycle assay using DNA content. One representative of three experiments is shown with mean ± SEM of live cells containing > 1 n DNA as measured by Ruby Dyecycle signal. (C) Kinase activation following BCR stimulation. Anti-IgM was added to WT and Ubqln1−/− B cells for the indicated times, and phospho-SYK, total IkB, phospho-ERK, and phospho-AKT were quantified by western blot. Graphs represent mean ± SEM of two independent experiments for SYK, and four experiments for IkB, ERK, and AKT. (D) RNASeq was performed on RNA isolated from B-cells 4 hr after incubation with buffer, 10 μg/mL anti-IgM, or 20 μg/mL LPS. After estimation of mRNA levels, unsupervised clustering was performed according to Materials and methods. Significance was determined using paired T tests.
Figure 6
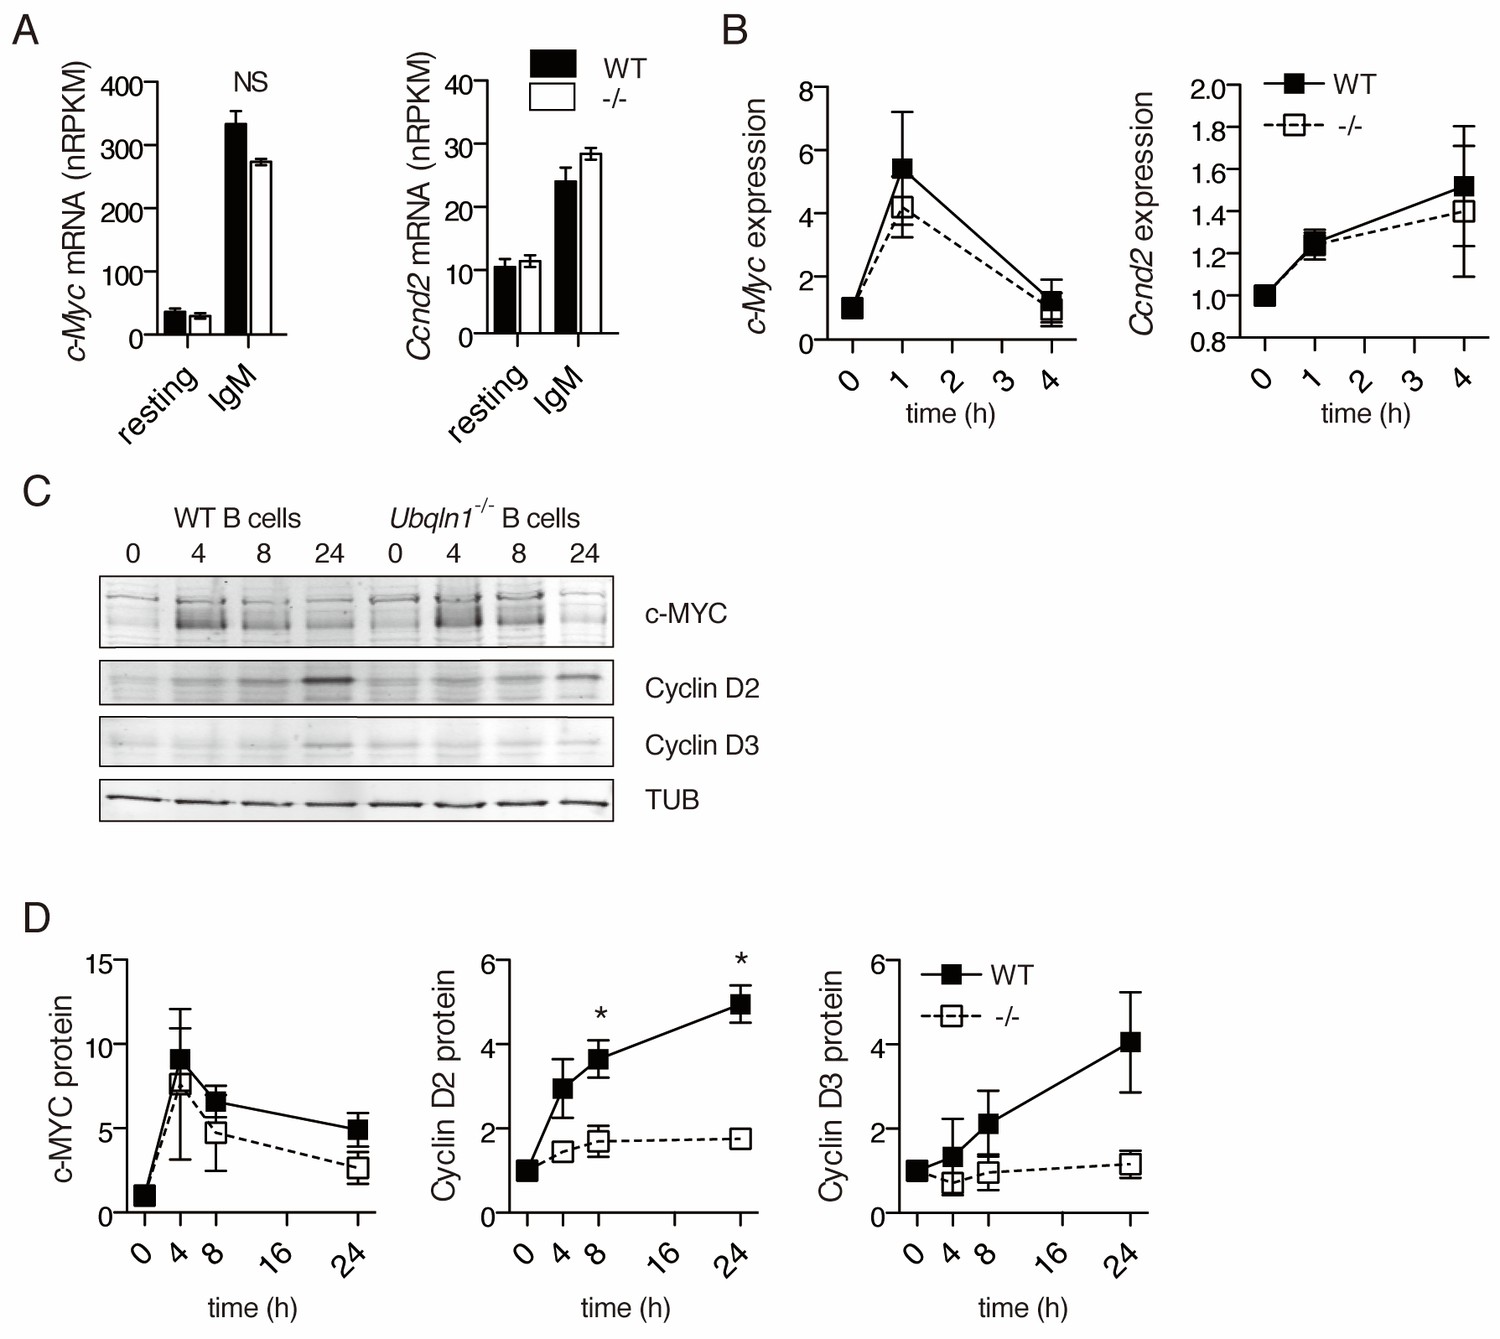
Ubqln1−/− B cells fail to accumulate Cyclin D proteins in response to BCR stimulation.
(A) Expression of c-Myc and Ccnd2 mRNA determined by RNASeq performed as in (Figure 5) (N = 3 independent experiments). (B) mRNA expression of c-Myc and Ccnd2 determined by QPCR at multiple timepoints following BCR stimulation. Shown is mean ± SEM of three independent experiments. (C) Representative western blot showing timecourse of c-MYC and Cyclin D2 and D3 protein accumulation following BCR crosslinking. Tubulin is used as a loading control. (D) Quantification of protein accumulation as a function of time for c-MYC and Cyclin D2. Shown is mean ± SEM of four independent experiments. For (A–D) significance was determined by a paired Student’s T test.
Figure 7
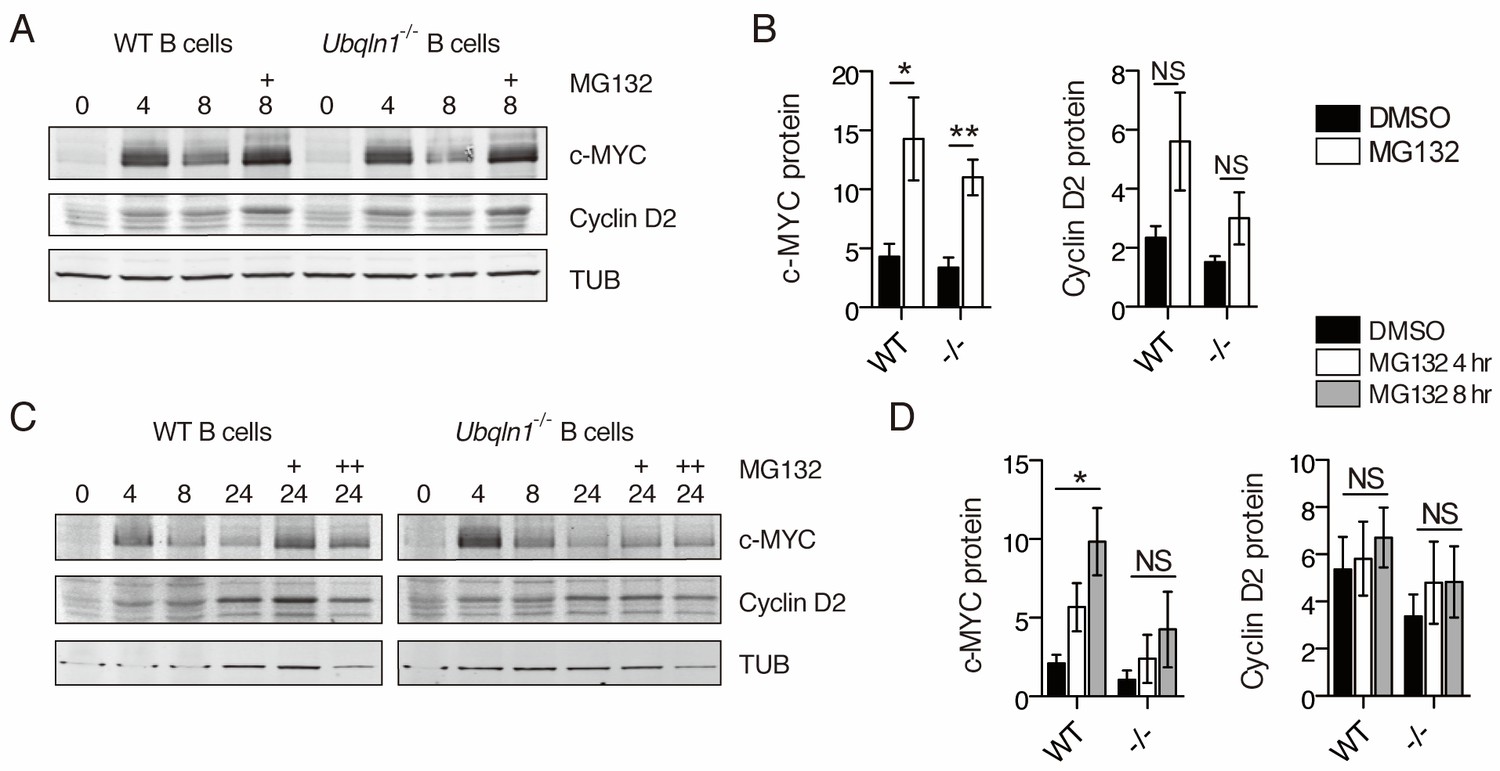
Proteasome inhibition does not rescue Cyclin D2 protein levels in Ubqln1−/− cells.
(A–B) Anti-IgM stimulated cells were incubated with 5 μM MG132 between hours 4 and 8 post-stimulation. (C–D) Cells were incubated with MG132 as in (A–B) between 20 and 24 hr post stimulation (C, single + and D, open bars) or between 16 and 24 hr post-stimulation (C, double ++, and D, gray bars). Bar graphs in (B, D) are summaries of three to five independent experiments with mean ± SEM. Statistics were determined by paired T test.
Figure 8
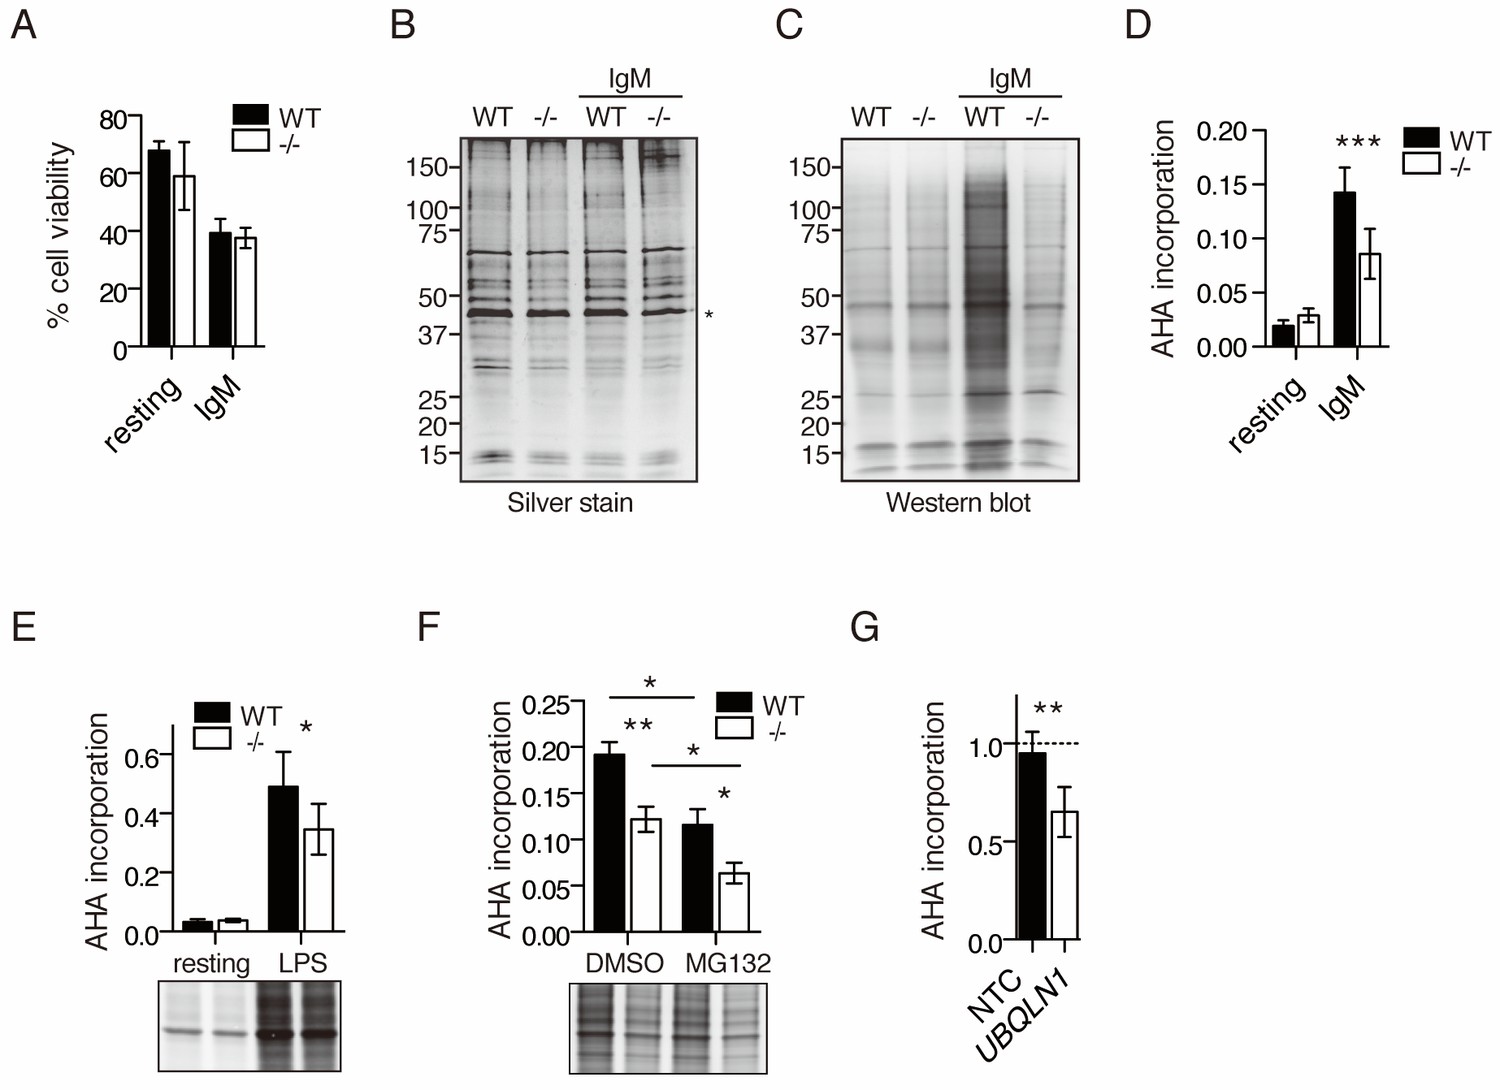
Decreased protein synthesis following BCR stimulation in Ubqln1−/− B cells.
(A) Viability of cells in AHA translation assay. Stimulated (IgM) or unstimulated (resting) cells were starved of methionine for 45 min at 19 hr post-stimulation, then incubated with 2 μM AHA for 4 hr. Cell viability was determined by exclusion of trypan blue after 4 hr of incubation with AHA. Shown is mean ± SEM of three independent experiments. (B–C) After incubation with AHA, click chemistry was performed on cell lysates to add biotin-alkyne to incorporated AHA, and lysates were separated by SDS-PAGE. (B) silver stain; (C) western blot with streptavidin from one representative experiment. * denotes the Actin band used as a loading control for quantification of total protein and AHA incorporation. (D) Quantification of AHA incorporation. Shown is mean ± SEM for three to five independent experiments. (E) Quantification of AHA incorporation in resting and LPS-stimulated WT and Ubqln1−/− cells. Shown is mean ± SEM from four independent experiments with a representative western blot at bottom, as in (C). (F) Effect of MG132 on AHA incorporation. Cells were incubated with 5 μM MG132 during methionine starvation and AHA incorporation. Shown is mean ± SEM for four independent experiments with a representative western blot shown. Significance was determined with paired T test. (G) BJABs were incubated with doxycycline for 48 hr, live cells separated, and newly synthesized protein labeled with AHA. Shown is mean ± SEM of three experiments. Significance was determined via paired T-test.
Author response image 1
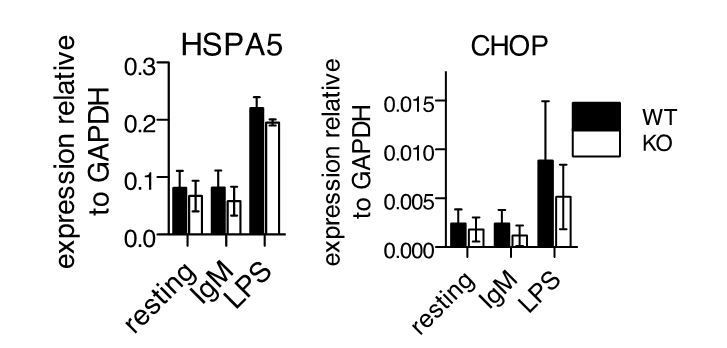
UPR gene expression following stimulation of primary B cells.
Splenic B cells from WT or -/- mice were isolated and stimulated as in Figure 3 of manuscript. 24 hours after stimulation, cDNA samples were isolated for QPCR against HSPA5 and CHOP. Shown are mean ± SEM of biological triplicates.
Tables
Table 1
GO-term CC cluster analysis of proteins increased by UBQLN1 loss in isolated BJAB cytosol.
DAVID pathway analysis was used on a dataset of proteins enriched at least 2-fold with p value >< 0.05 (92 proteins) in isolated BJAB cytosol upon loss of UBQLN1 via shRNA induction using the background of all identified peptides from the MS run (approx. 5000 proteins). GO-term Cellular Compartments were used for a cluster analysis; clusters with Enrichment Scores of > 1.3 (p=0.05 equivalent) were listed with their common term.
| Term | Enrichment Score |
|---|---|
| Mitochondria | 19.66 |
| Mitochondrial Membrane | 9.05 |
| Extracellular Vesicle | 3.34 |
| Membrane-bound organelle | 2.66 |
Table 2
GO-term CC cluster analysis of proteins increased by Ubqln1 knockout in murine B cell lysate.
DAVID pathway analysis was used on a dataset of proteins enriched at least 1.25-fold with p value < 0.05 (33 proteins) in anti-IgM stimulated, Ubqln1−/− murine B-cell lysate, using the background of all identified peptides from the MS run (approx. 8000 proteins). GO-term Cellular Compartments were used for a cluster analysis; clusters with Enrichment Scores of > 1.3 (p=0.05 equivalent) were listed with their common term.
| Term | Enrichment Score |
|---|---|
| Endoplasmic Reticulum | 1.63 |
| Mitochondrial Membrane | 1.33 |
Additional files
-
Transparent reporting form
- https://doi.org/10.7554/eLife.26435.020
Download links
A two-part list of links to download the article, or parts of the article, in various formats.
Downloads (link to download the article as PDF)
Open citations (links to open the citations from this article in various online reference manager services)
Cite this article (links to download the citations from this article in formats compatible with various reference manager tools)
Ubiquilin1 promotes antigen-receptor mediated proliferation by eliminating mislocalized mitochondrial proteins
eLife 6:e26435.
https://doi.org/10.7554/eLife.26435


