Increasing evidence of mechanical force as a functional regulator in smooth muscle myosin light chain kinase
- Ludwig-Maximilians-Universität München, Germany
- King's College London BHF Centre of Research Excellence, United Kingdom
Figures
Figure 1
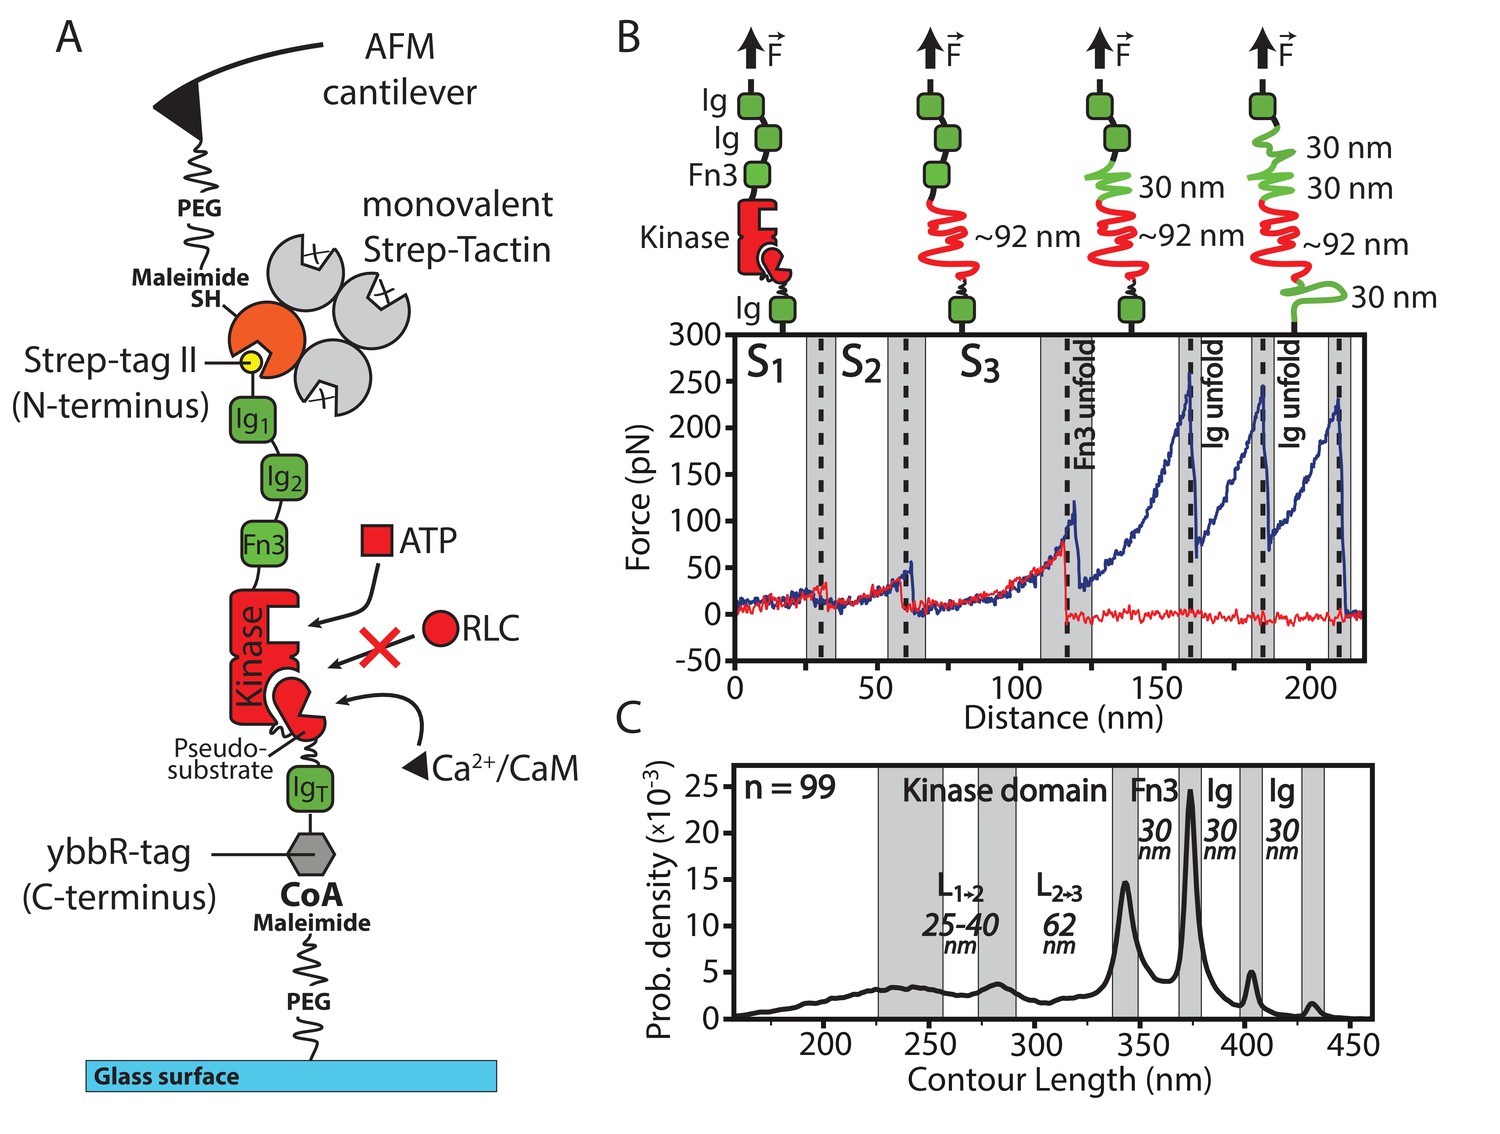
Overview of the experimental configuration for applying controlled mechanical stress to smMLCK.
(A) Schematic illustration of the investigated smMLCK construct. It consists of the kinase domain surrounded by several Ig-like domains (Ig) and a fibronectin-like domain (Fn3). Possible substrate interactions are indicated (ATP, Ca2+/CaM and RLC). RLC interaction is prevented by the auto-inhibitory pseudosubstrate sequence that is released upon Ca2+/CaM binding. For covalent attachment onto the surface, the construct harbors a C-terminal ybbR-tag. (B) Representative force-distance curves (red, blue) depicting the characteristic transitions of the kinase through different conformational states (S, S, S) and subsequent unfolding of the adjacent Fn3 and Ig-like domains. Whereas most force-distance curves rupture before or after Fn3 unfolding (as shown in red) due to comparable rupture forces of Fn3 and the employed handle system, the blue curve illustrates a descriptive example with additional unfolding of Fn3 and Ig-like domains depicting the further force-distance pattern given by the construct. Structural interpretation and assignment of the detected force-distance pattern is schematically depicted above the curve. (C) Contour length transformation of 99 unfolding events with respective contour length increments. L and L are released at the transition of the kinase domain from conformational state S to S and S to S respectively. The contour lengths of Fn3 and Ig-like domains are additionally depicted.
-
Figure 1—source data 1
Contour length plot of 99 unfolding events of MLCK with 0 mM ATP present, aligned as described in the data analysis section.
- https://doi.org/10.7554/eLife.26473.003
Figure 2 with 2 supplements
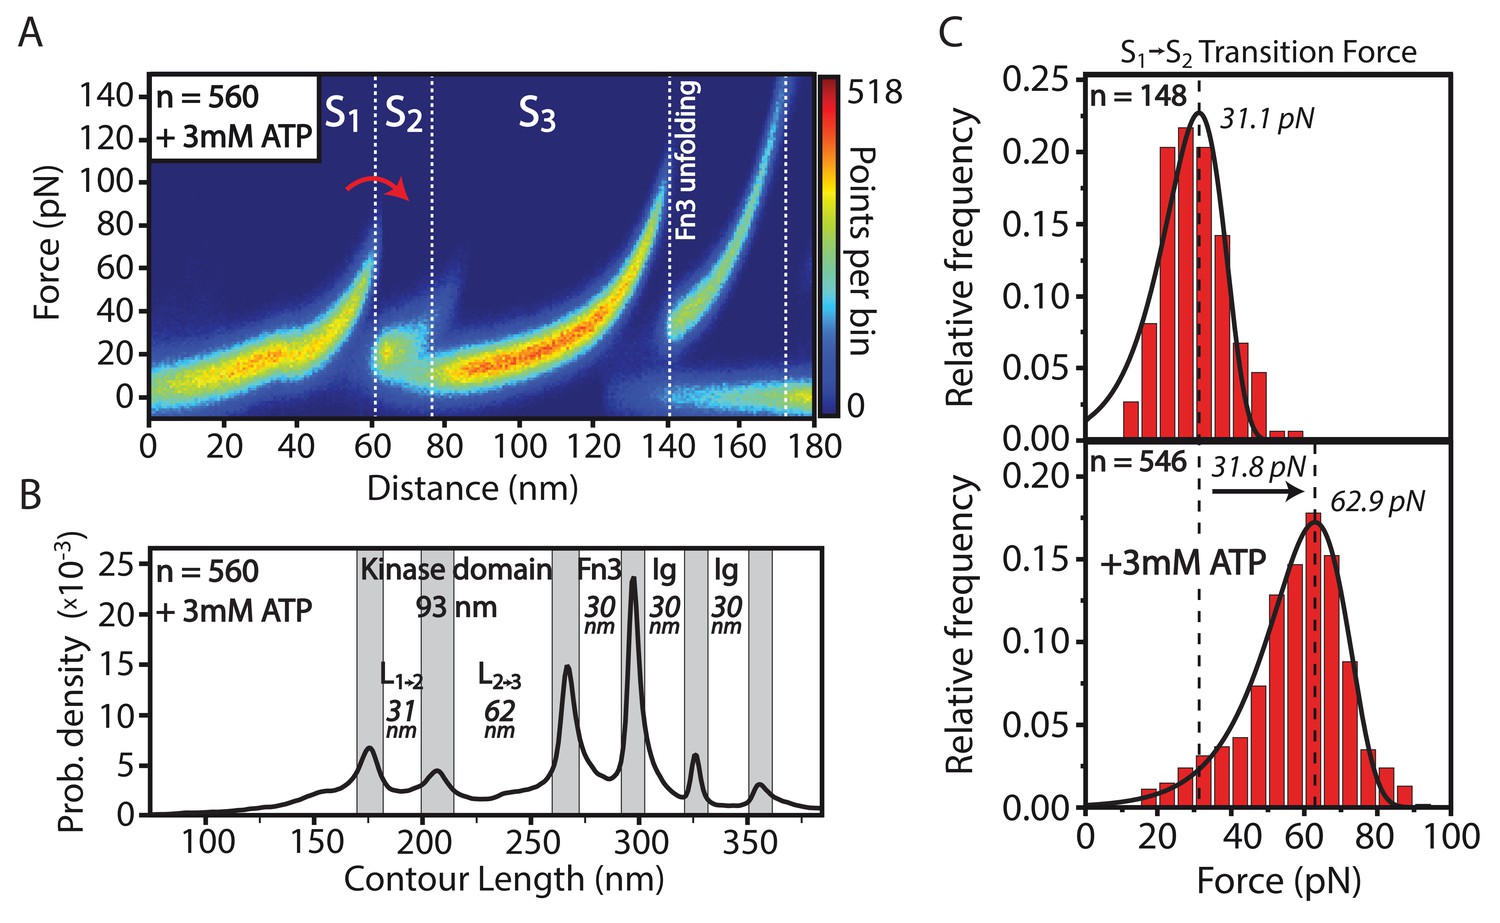
Structural effects of ATP binding on smMLCK’s characteristic sequence of conformational states.
(A) Stabilization of the S→S transition upon ligand binding. For better illustration, a heatmap of 560 aligned curves is depicted. (B) Contour-length transformation of the respective events in the presence of ATP. L is associated to the contour length released at the transition from state S to S. (C) Statistical evaluation of S→S stabilization via force histograms fitted with the Bell-Evans model. An increase in the most probable transition force of about 30 pN is observed upon ATP addition. Both data sets were recorded within one experiment with the same cantilever.
-
Figure 2—source data 1
Contour length plot of 560 unfolding events of MLCK in the presence of 3 mM ATP, aligned as described in the data analysis section.
- https://doi.org/10.7554/eLife.26473.005
-
Figure 2—source data 2
Force histogram of S→S transition in the presence of 0 mM ATP.
- https://doi.org/10.7554/eLife.26473.006
-
Figure 2—source data 3
Force histogram of S→S transition in the presence of 3 mM ATP.
- https://doi.org/10.7554/eLife.26473.007
Figure 2—figure supplement 1
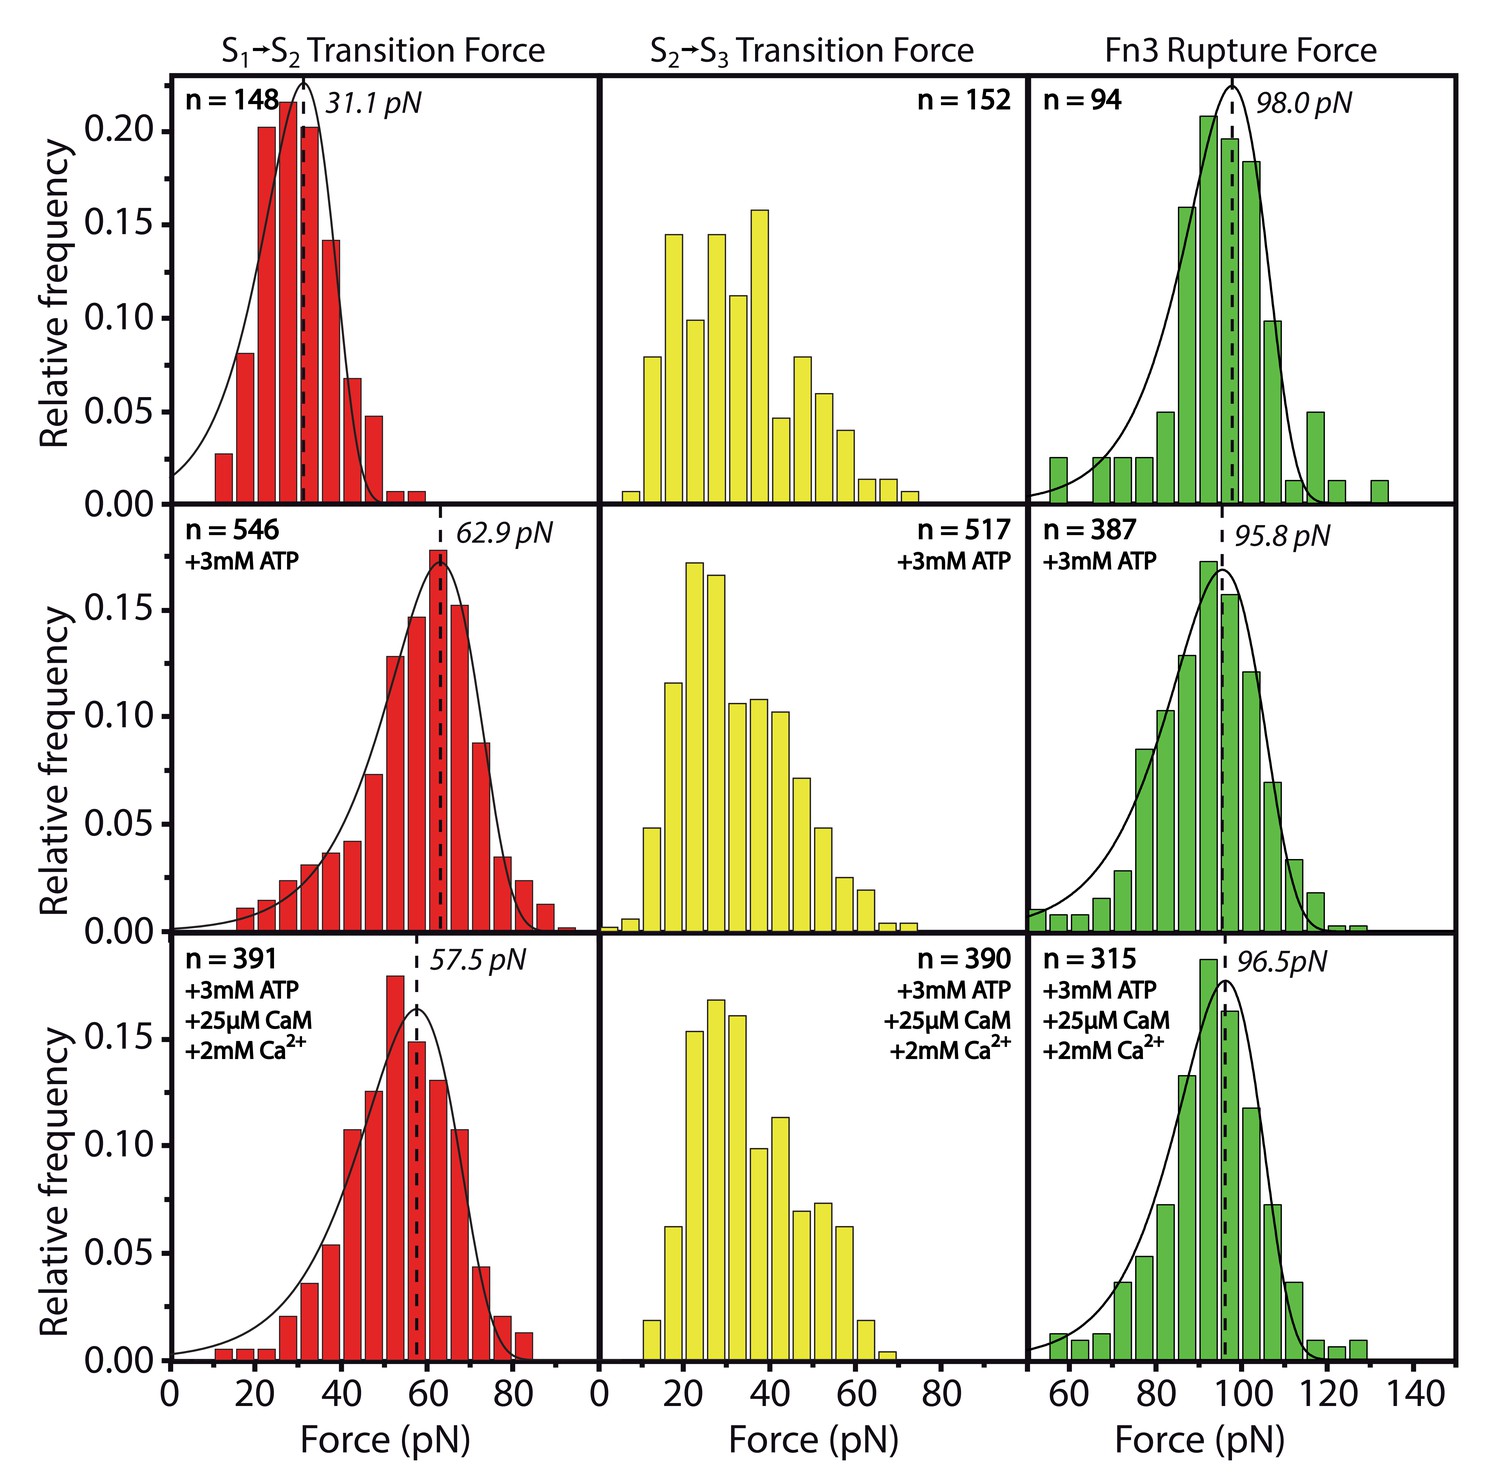
Effects of ATP or Ca2+/CaM addition on the peak forces for the respective transitions S→S and S→S and for the Fn3 unfolding force.
All data was collected within one experiment and absolute force values can directly be compared. Whereas S→S is stabilized by ATP as described in the main part of the manuscript, S→S and Fn3 appear not to be significantly changed by substrate interaction. The force histograms of the Fn3 domain are used in other experiments for normalizing forces to the same value.
-
Figure 2—figure supplement 1—source data 1
Force histogram of S→S transition in the presence of 0 mM ATP.
Same as Figure 2—source data 2.
- https://doi.org/10.7554/eLife.26473.009
-
Figure 2—figure supplement 1—source data 2
Force histogram of S→S transition in the presence of 3 mM ATP.
Same as Figure 2—source data 2.
- https://doi.org/10.7554/eLife.26473.010
-
Figure 2—figure supplement 1—source data 3
Force histogram of S→S transition in the presence of 3 mM ATP, 25 µM CaM, 2 mM Ca2+.
- https://doi.org/10.7554/eLife.26473.011
-
Figure 2—figure supplement 1—source data 4
Force histogram of S→S transition in the presence of 0 mM ATP.
- https://doi.org/10.7554/eLife.26473.012
-
Figure 2—figure supplement 1—source data 5
Force histogram of S→S transition in the presence of 3 mM ATP.
- https://doi.org/10.7554/eLife.26473.013
-
Figure 2—figure supplement 1—source data 6
Force histogram of S→S transition in the presence of 3 mM ATP, 25 µM CaM, 2 mM Ca2+.
- https://doi.org/10.7554/eLife.26473.014
-
Figure 2—figure supplement 1—source data 7
Force histogram of Fn3 unfolding in the presence of 0 mM ATP.
- https://doi.org/10.7554/eLife.26473.015
-
Figure 2—figure supplement 1—source data 8
Force histogram of Fn3 unfolding in the presence of 3 mM ATP.
- https://doi.org/10.7554/eLife.26473.016
-
Figure 2—figure supplement 1—source data 9
Force histogram of Fn3 unfolding in the presence of 3 mM ATP, 25 µM CaM, 2 mM Ca2+.
- https://doi.org/10.7554/eLife.26473.017
Figure 2—figure supplement 2

Stabilization of the S→S transition upon ADP or AMP-PNP binding.
https://doi.org/10.7554/eLife.26473.018-
Figure 2—figure supplement 2—source data 1
Force histogram of S→S transition in the presence of 3 mM AMP-PNP, 30 µM CaM, 3 mM Ca2+, 280 µM RLC.
- https://doi.org/10.7554/eLife.26473.019
-
Figure 2—figure supplement 2—source data 2
Force histogram of Fn3 unfolding in the presence of 3 mM AMP-PNP, 30 µM CaM, 3 mM Ca2+, 280 µM RLC is used for normalizing forces to the same value.
Actual histogram of Fn3 forces is not shown here and is just used for normalization.
- https://doi.org/10.7554/eLife.26473.020
-
Figure 2—figure supplement 2—source data 3
Force histogram data of S→S transition in the presence of 4 mM ADP.
- https://doi.org/10.7554/eLife.26473.021
-
Figure 2—figure supplement 2—source data 4
Force histogram of the Fn3 unfolding in the presence of 4 mM ADP is used for normalizing forces to the same value.
Actual histogram of Fn3 forces is not shown here and is just used for normalization.
- https://doi.org/10.7554/eLife.26473.022
Figure 3 with 1 supplement

Structural effects of Ca2+/CaM binding on smMLCK’s characteristic sequence of conformational states.
(A) Attenuated S→S transition in the characteristic force-distance pattern of the smMLCK construct due to conformational changes upon Ca2+/CaM binding. This effect is emphasized by a heatmap comparison of several hundred overlaid force-distance curves. Both data sets were collected within one measurement. (B) Structural model interpretation. The S→S transition is assigned to a force-induced rearrangement in the kinase domain that correlates with the conformational changes induced by Ca2+/CaM binding – the release of the inhibitory pseudosubstrate.
Figure 3—figure supplement 1

Missing effects by addition of Ca2+ without CaM.
The atypical stretching behavior indicating a transition from state S to S is still observable in the presence of Ca2+: only in combination with CaM is the barrier not detected in the unfolding pattern.
Figure 4 with 1 supplement
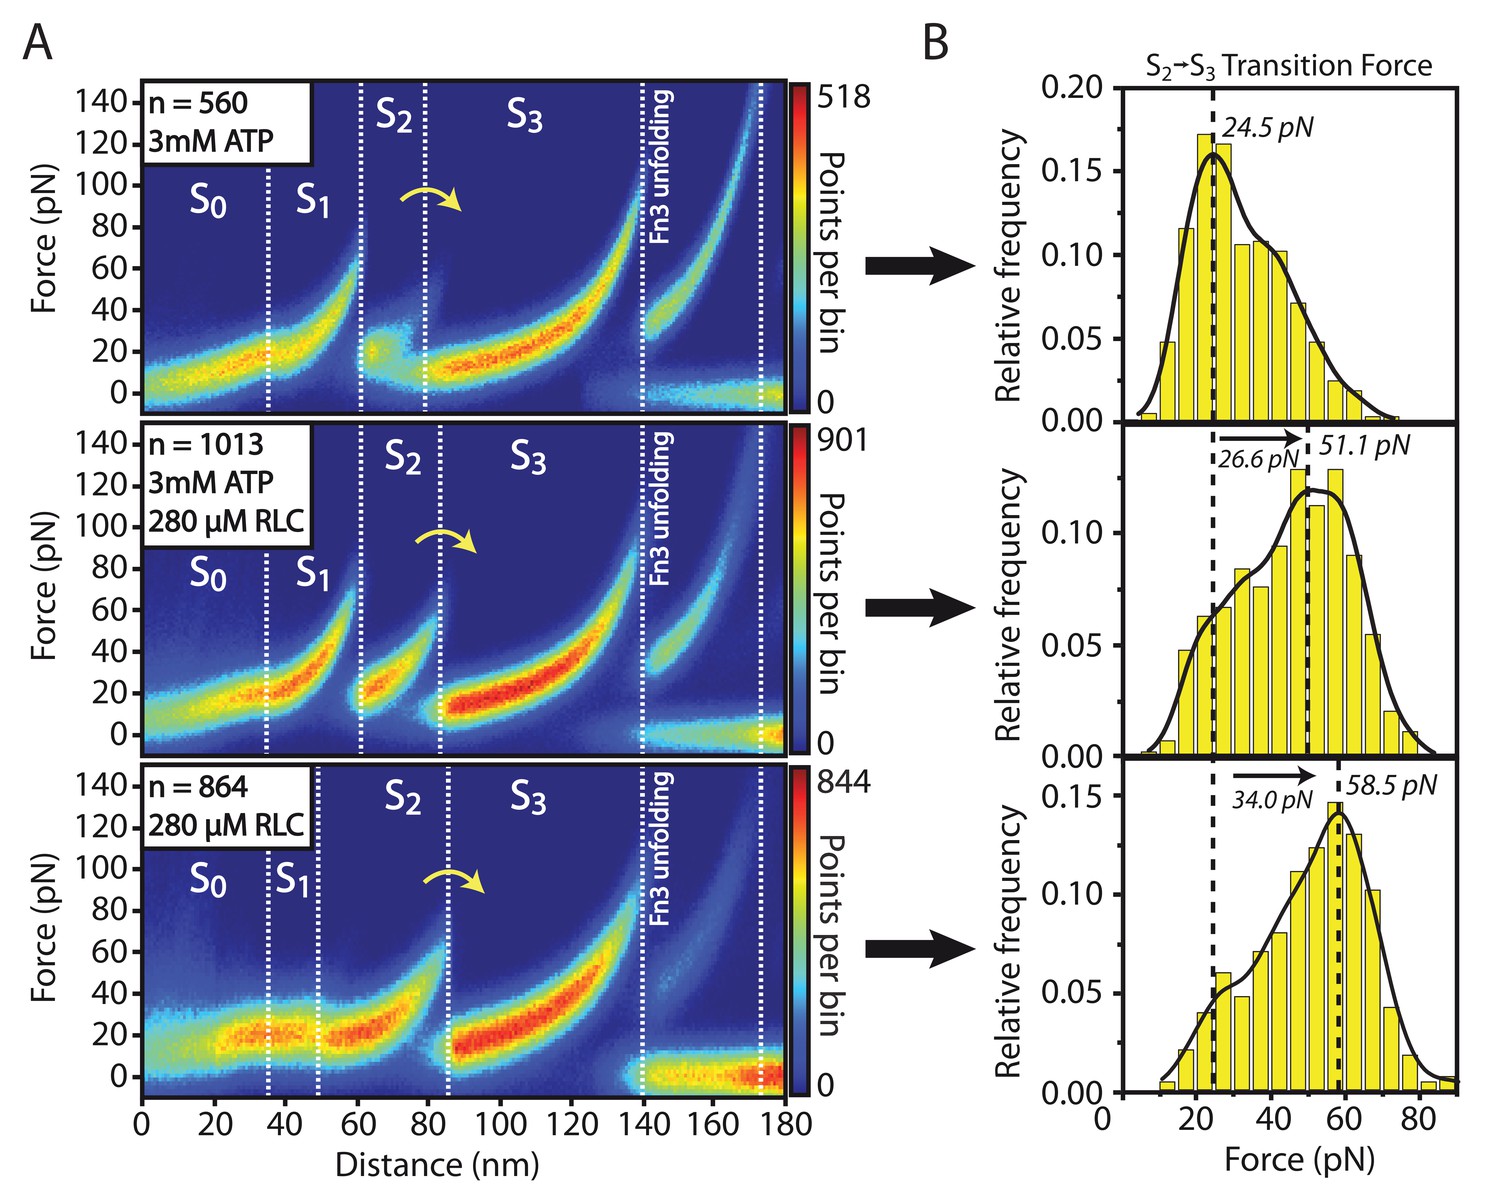
Structural effects of RLC peptide binding on smMLCK’s characteristic sequence of conformational states.
(A) Qualitative observation of an increased mechanical stability in the large kinase lobe illustrated by the higher forces in the S→S transition. The effect is emphasized by heatmaps of aligned force-distance curves obtained under different substrate conditions. The stabilizing effect is detected independently of the presence of ATP. (B) Quantitative evaluation of the increased S→S transition force. The force histograms were approximated with a kernel-density function for extracting the most probable rupture force. It reveals a significant shift of about 30 pN due to the stable interaction of the RLC peptide with the catalytic core. Since this binding is stated to be prevented by an auto-inhibition process according to the conventional view of smMLCK activation, the experimental observation hints at an additional path of kinase regulation modulated by force.
-
Figure 4—source data 1
Force histogram of S→S transition in the presence of 3 mM ATP.
- https://doi.org/10.7554/eLife.26473.026
-
Figure 4—source data 2
Force histogram of S→S transition in the presence of 3 mM ATP and 280 µM RLC.
- https://doi.org/10.7554/eLife.26473.027
-
Figure 4—source data 3
Force histogram of S→S transition in the presence of 280 µM RLC.
- https://doi.org/10.7554/eLife.26473.028
Figure 4—figure supplement 1

Ca2+/CaM-dependent RLC phosphorylation of the investigated smMLCK construct.
Western blot probing RLC phospho-serine 19 following smMLCK in vitro kinase assay time-course shows only phosphorylation in presence of Ca2+/CaM.
Figure 5

Structural interpretation of the stabilized S state upon RLC interaction.
Mechnical stress forces the construct into a conformational state S equivalent to the state reached by Ca2+/CaM binding. By release of the pseudosubstrate sequence the conformational state is capable of RLC binding which is detected by a significant stabilization of the S state. Both initially different activation pathways eventually result in the same sequence of conformational states, with the only difference being the presence or absence of bound Ca2+/CaM, depicted in light grey in the S state.
Download links
A two-part list of links to download the article, or parts of the article, in various formats.
Downloads (link to download the article as PDF)
Open citations (links to open the citations from this article in various online reference manager services)
Cite this article (links to download the citations from this article in formats compatible with various reference manager tools)
Increasing evidence of mechanical force as a functional regulator in smooth muscle myosin light chain kinase
eLife 6:e26473.
https://doi.org/10.7554/eLife.26473


