A predictive focus of gain modulation encodes target trajectories in insect vision
- Adelaide Medical School, The University of Adelaide, Australia
- Lund University, Sweden
Figures
Figure 1

CSTMD1’s receptive field mapped with drifting targets.
(A) Small targets (black squares, 1.5°x1.5°) move along short trajectories (200 ms) that are both vertically and horizontally offset on a 10 × 10 grid. Pictograms are illustrative and not to scale. The colormap reveals CSTMD1 responses to these stimuli producing an ‘unfacilitated’ receptive field (50–150 ms analysis window). (B) Horizontally offset targets are drifted vertically up the monitor display along long, continuous trajectories eliciting strong, facilitated responses (100 ms bins to corresponding spatial locations in A). (C) Separating long paths into two components (primer followed by probe), allows us to examine the facilitatory effects within a short analysis window (before the probe self-primes, green region). In a single neuron, we examined response time courses (mean of 140 replicates over two hours) to repeated probe alone (blue line) and primer & probe (black line) conditions (D) We have previously described facilitated receptive fields in response to targets drifted across the entire visual display. Targets moving rightwards (vertically offset) reveal inhibition in one eye’s visual field (in response to motion from the periphery towards the frontal area) and excitation in the other (from frontal to periphery). (E) The facilitated receptive field mapped with upwards moving targets (hot colors) is stronger than the weaker, though similarly shaped, unfacilitated receptive field in A. Targets moved upward in the other visual hemifield inhibit responses to below spontaneous levels (data trace).
Figure 2
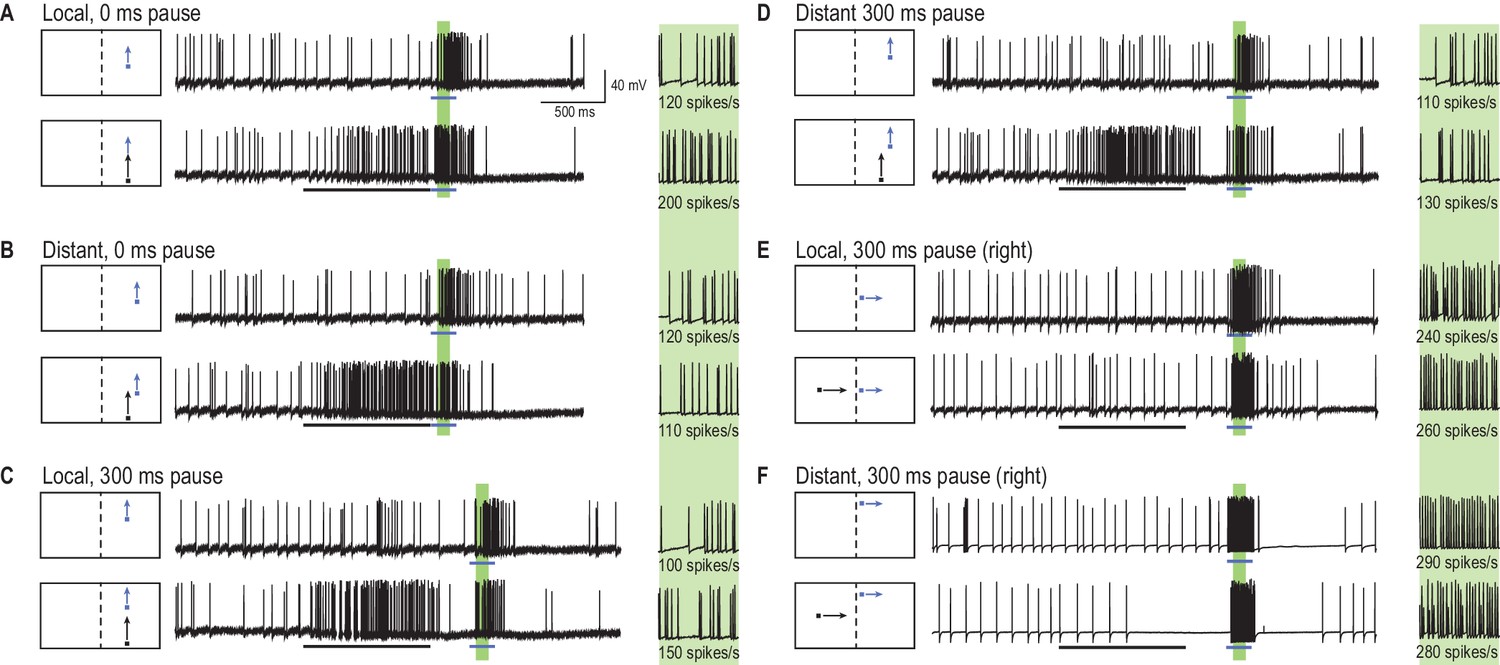
A primer target changes probe responses.
(A) Example traces of CSTMD1’s response to a probe target alone (blue arrow) or following a primer target (black arrow). The effect of the primer is measured as the difference (∆ spike rate) in response activity (primer & probe – probe alone) in the corresponding 100 ms window (green shaded region, with enlarged view on right). (B) With the primer spatially constrained, we repeat primer & probe and probe alone trials in a gridded array of 100 locations (200 trials in total, randomly interleaved). (C, D) A pause of 300 ms is inserted between the conditions where the primer disappears before probe onset (i.e. simulating a target occlusion). (E, F) A primer placed in the visual field of the other eye and moved toward the visual midline tests for information traversing the brain hemispheres.
Figure 3

A predictive focus facilitates responses to a moving target.
(A) The probe receptive field in response to short, vertical trajectories is indicated by contour lines (mean, n = 9 dragonflies). The color map shows change in spike rate (for each location) due to the immediately preceding primer trajectory that is presented within the white outlined box. The change in spiking activity in the corresponding analysis window reveals >50% enhancement in front of the moving target (red), but suppression in the surround (blue). (B) With a 300 ms delay introduced after the primer, the focus spreads forward (color map, n = 7 dragonflies), estimating the theoretical future target location (white crosshairs). (C) The primer moves toward the midline in the other eye’s visual field, whilst avoiding binocular overlap. The focus transfers between brain hemispheres, with a spatially-localized enhancement in front of the target and suppression at higher elevations (color map, n = 7 dragonflies). (D) We examined the statistical significance of all three mappings (Figure A-C) by calculating the effect size at each spatial location (Cohen’s d). We see values within the range ±1.8, well above those considered as large effect sizes (>0.5). For spatial points of interest (+), we calculate the corresponding statistical significance (P value) between the primer & probe and probe alone versions (E) There is a forward shift in the focus region (mean ± SEM, p=0.03, n = 12 dragonflies) following an occlusion (cf. 100 ms pause, yellow line with 300 ms pause, green line). The expected target locations following occlusions are indicated with color crosshairs (3° for 100 ms and 9° for 300 ms).
Figure 4
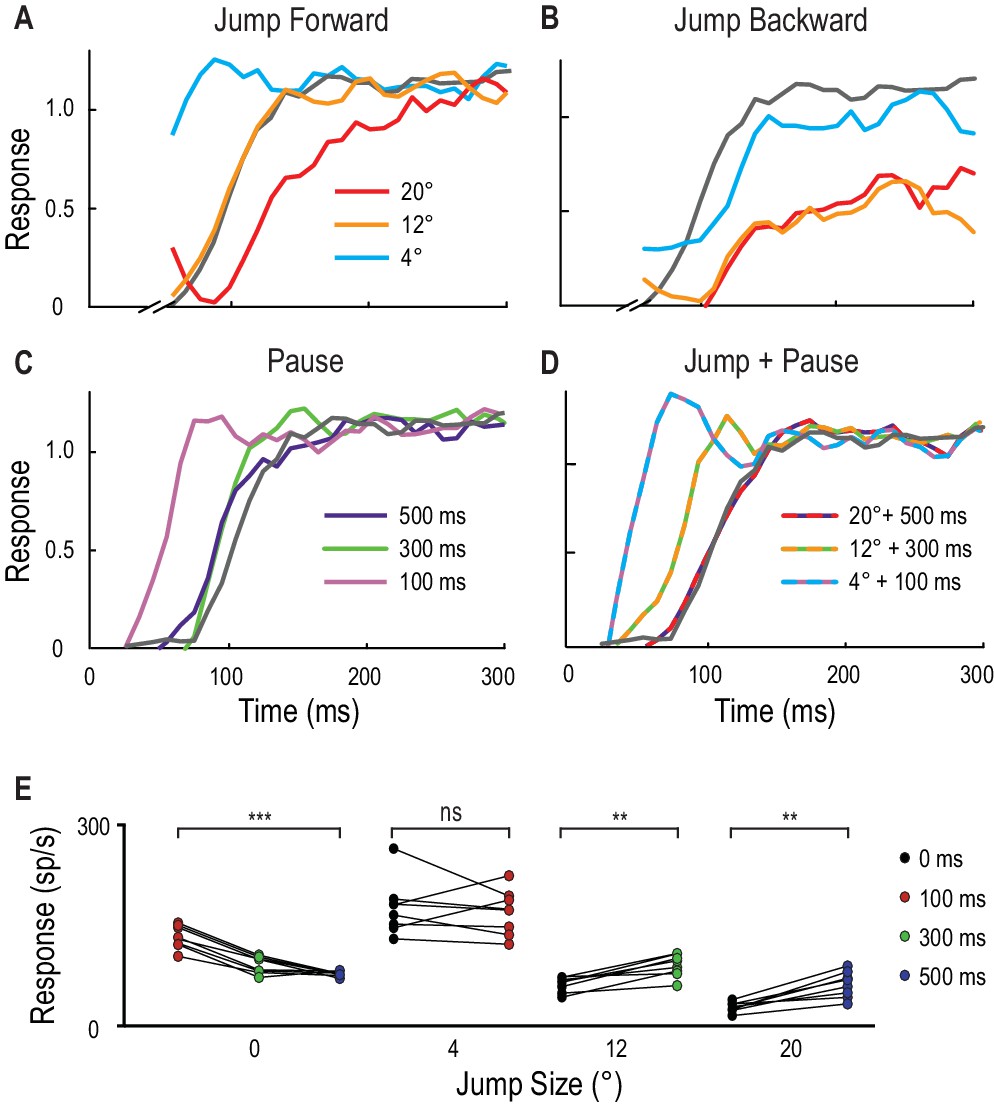
Spatial jumps and temporal pauses in target trajectories.
(A) CSTMD1’s normalized response to a short probe trajectory builds over several hundred milliseconds (grey line) and is changed by the position and timing of a 500 ms priming target. Probes jumped forward immediately following the primer, reveal kfacilitated responses (4° ahead), unfacilitated responses (12° ahead) and suppression (20° ahead), indicative of the focus-region in Figure 3. (B) A jump immediately back over the primer path exhibits unfacilitated (4° behind) or strongly inhibited (12° or 20° behind) responses. (C) Inserting a temporal pause between primer and probe shows that weaker facilitation persists at the primed location for over 500 ms, diminishing as the pause duration increases. (D) Combining a short pause with a jump reveals a forward spread of facilitation that could account for an occlusion. (A-D, n = 9 technical replicates from one dragonfly) (E) At the target’s last seen position (jump size 0°), probe responses decrease at times following the primer’s disappearance (p=0.0005). In comparison, responses to probes jumped 12° and 20° ahead increase when matched to their corresponding occlusion durations of 300 ms (p=0.008) and 500 ms (p=0.008). Asterisks indicate significance, n = 8 dragonflies.
Figure 5
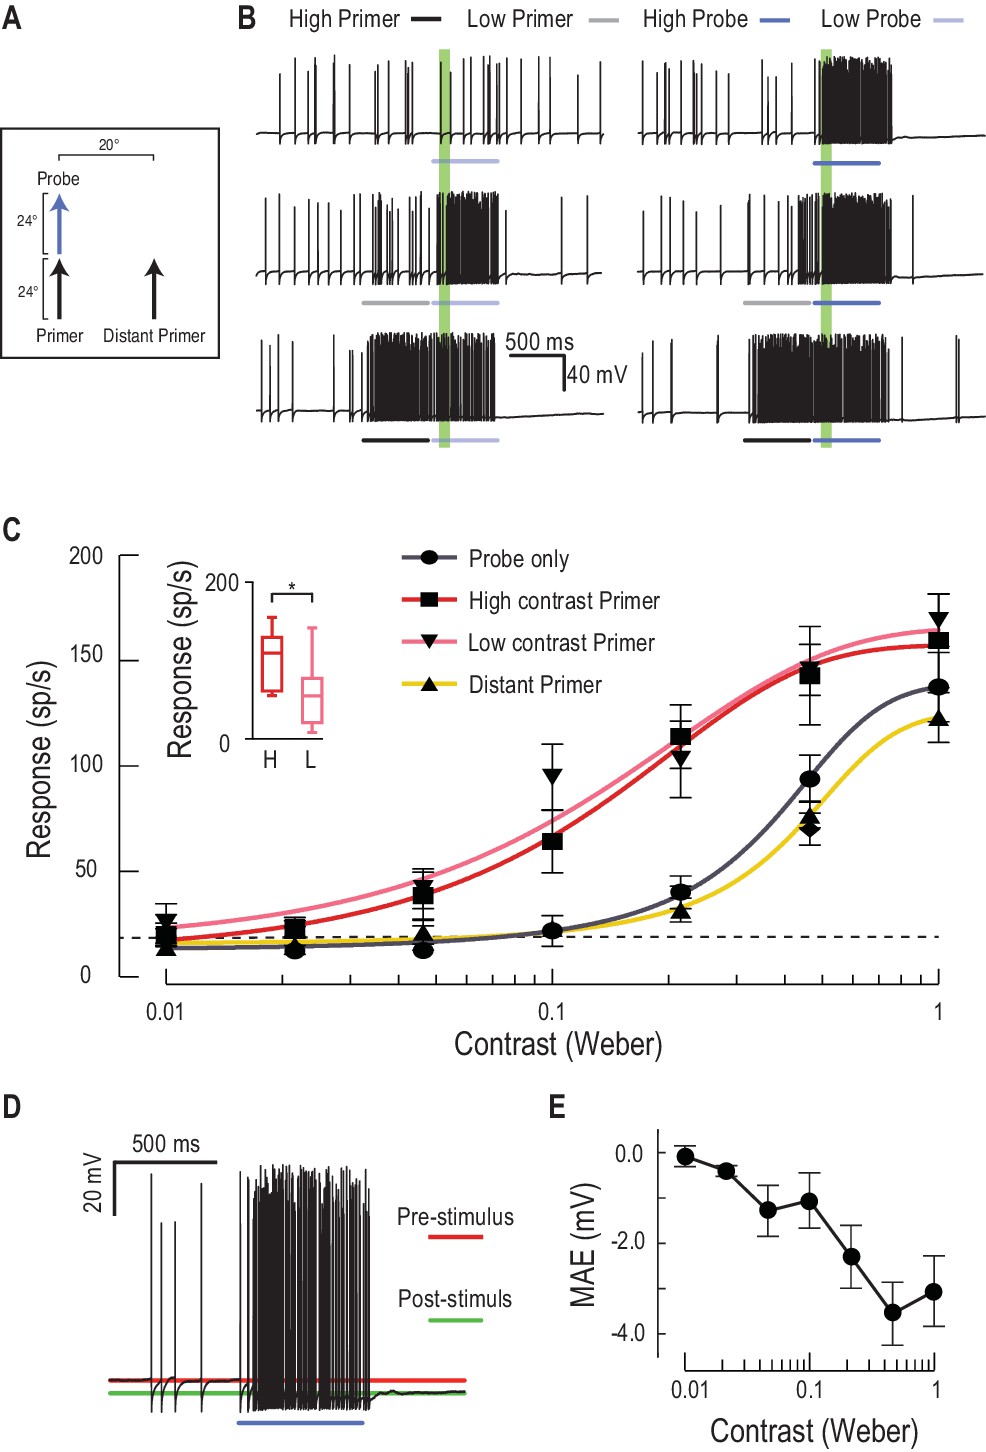
Low or high contrast primers increase probe contrast sensitivity.
(A) Either a low or high contrast primer is presented before varying contrast probes (contrast sensitivity function). These either continue the path trajectory or jump to a distant location. (B) Example data traces of responses to either low (grey) or high (black) contrast primers that are presented before a series of varying contrast probes (light, medium and dark blue) (C) CSTMD1’s sensitivity to varying contrast probes exhibits a sigmoidal function (grey), with the dashed line indicating a detection threshold above spontaneous levels. Following either a nearby low contrast (pink) or high contrast (red) primer, contrast sensitivity is substantially increased (n = 9 dragonflies, p<0.0001). A distant primer (yellow) does not elicit facilitation, even though spiking activity during low and high contrast primers (final 100 ms) is significantly different (inset, n = 9 dragonflies, p=0.02). (D) In response to an excitatory stimulus (e.g. high contrast stimulation), the underlying membrane potential is hyperpolarized, a form of motion-after-effect (MAE). (E) The hyperpolarizing motion-after-effect is related to the strength (e.g. target contrast) of the stimulus.
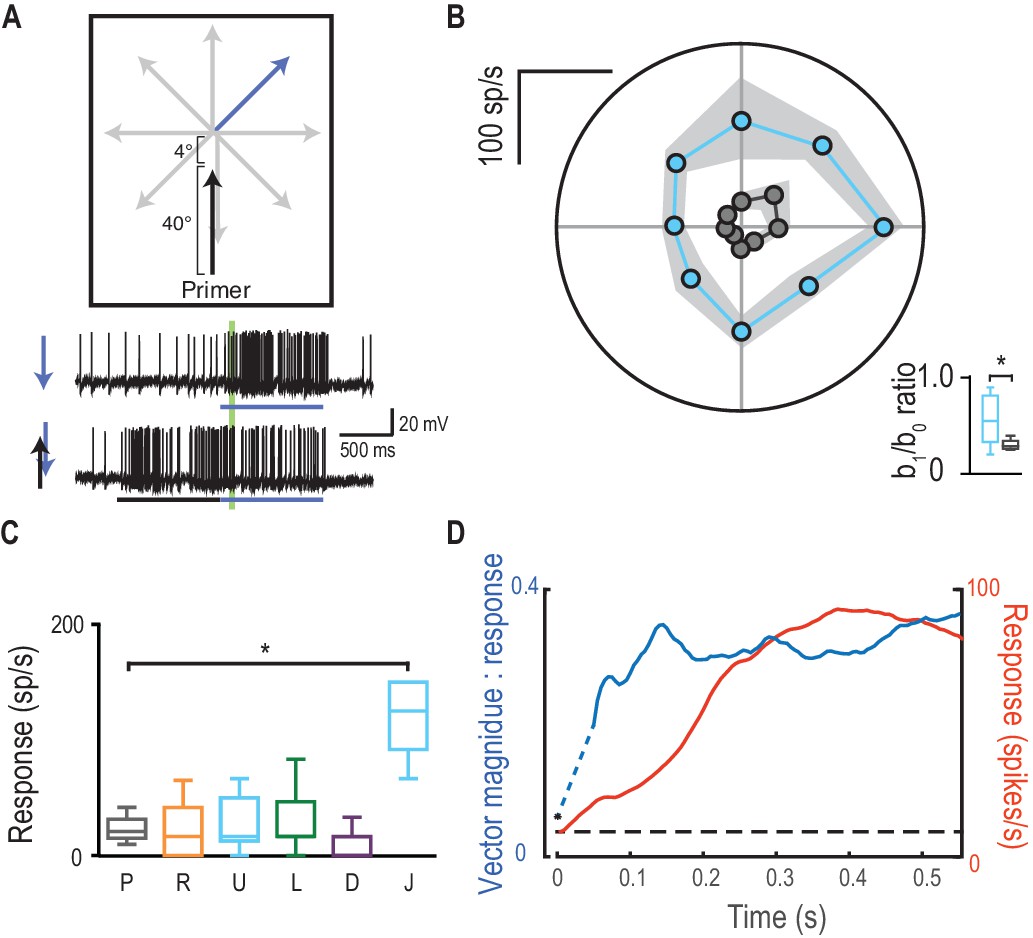
Figure 6

Primer direction establishes probe direction selectivity.
(A) Primers of four possible directions (right, upward, left, downward) preceded probe responses in each of eight possible directions. (B) Examples of individual traces to a subset of the experiment conditions. The analysis period is indicated in green. (C) Probe responses are weak (grey points) until following a primer (in one of four cardinal directions) and are most facilitated in the primer’s direction (mean ± SEM, n = 9 dragonflies). (D) The b1/b0 is an index showing the strength of directionality. (E) Polar plot vector magnitude and direction (mean ±95% CI), shows that probe direction selectivity generally aligns with the primer direction. (F) Either upward or downward probe alone (grey lines) evoke robust responses. However, ‘reversals’ (probes opposite in direction to a preceding primer) generate strong and long-lasting inhibition (mean time course, n = 9 dragonflies).
Figure 7
Direction selectivity is a result of spatial facilitation.
(A) The direction experiment is repeated, now with a 4° jump forward into the spotlight. (B) Responses are facilitated for all directions (mean ± SEM, n = 5 dragonflies) with decreased direction selectivity (b1/b0). (C) Probes in the opposite direction to their corresponding primer reveal no facilitation or inhibition, except when jumped [J] into the spotlight (p=0.03). (D) The magnitude of direction selectivity builds on a faster timescale than the response onset.
Figure 8
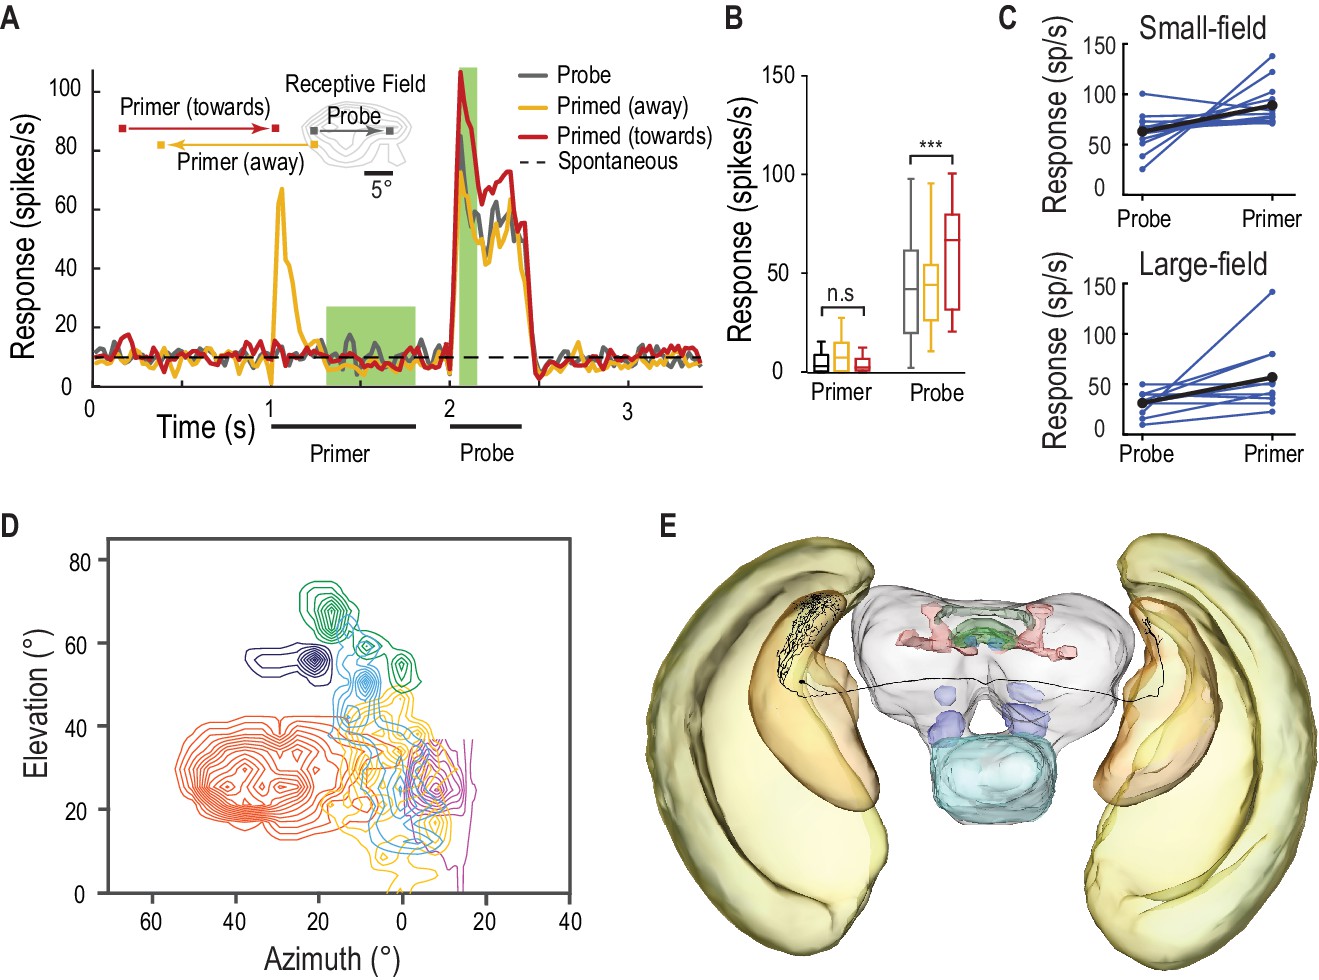
SF-STMDs are facilitated by a primer that moves toward the receptive field.
(A) Primers move either toward (red) or away (yellow) from the classical receptive field (RF), preceding a probe target within the RF (mean, n = 13 dragonflies). (B) Outside the receptive field, primer responses do not significantly differ from spontaneous activity. Primers that move towards the receptive field increase probe responses by over 40% (p=0.0004, n = 13 dragonflies). (C) Individual STMDs, with either small or large receptive fields, exhibit varying degrees of facilitation (blue). Mean facilitation (black) increase responses by over 40% in small-field (n = 13 dragonflies), 80% in large-field STMDs (n = 11 dragonflies) and 50% in CSTMD1 (data not shown). (D) Six small-field STMD receptive fields (RF) are predominantly fronto-dorsal and exhibit variation in overall size and spatial locations. Contour lines represent 25 spikes/s. The SF-STMD with light purple contours is the same neuron in E, with inputs in the binocular region of the dragonfly’s right visual field, whilst input dendrites are in the left hemisphere (E) An SF-STMD’s axon traverses the brain, potentially underlying transfer of local predictive gain modulation.
Videos
Video 1
Visual stimulus for Figure 1.
The receptive field of CSTMD1 is mapped with a series of targets drifted on short paths (Figure 1A), or a single target drifting across the same location on a long path (Figure 1B). Separating a long target path into two components (a primer and a probe) allows us to quantify the facilitation induced by a primer (Figure 1C). All trials were presented in a randomised order. In this video trials are presented without rest periods, whilst in experiments trials were separated by at least 7 s to minimize habituation.
Video 2
Visual stimulus for Figure 3.
The unfacilitated receptive field is mapped by a 10 × 10 grid of probes moving on short paths (Figure 3A, contour lines, only five trials shown in this video). A primer drifts on a long trajectory towards the center of the screen, before repeating presentation of each probe. Identical trials are replicated with a 300 ms pause separating the primer and probe (Figure 3B). All trials were presented in a randomised order, separated by rest periods of at least 7 s.
Video 3
Visual stimulus for Figure 5.
Probes of varying contrast drift on short paths to determine unfacilitated contrast sensitivity (Figure 5C, only 1 contrast shown in video). Probes are then preceded by a high contrast primer that drifts at the same horizontal path as the probe - High Contrast Primed (local), or on a different horizontal path - High Contrast Primed (distant). Primed trials are also repeated with lower contrast primers (Low Contrast Primed). All trials were presented in a randomised order, separated by rest periods of at least 7 s.
Video 4
Visual stimulus for Figure 6.
Probes drift in 8 unique directions to determine the unfacilitated direction tuning of CSTMD1 (Figure 6C, only 4 directions shown in the video). The same 8 probes are preceded by primers moving in each of 4 cardinal directions (only upwards primer shown). All trials were presented in a randomised order, separated by rest periods of at least 7 s.
Video 5
Visual stimulus for Figure 7.
Probes are presented in an identical manner to Figure 6C. However, here probes are preceded by a vertical primer that terminates 4° below the probe start location (Figure 7B). All trials were presented in a randomised order, separated by rest periods of at least 7 s.
Video 6
Visual stimulus for Figure 8.
Probes are presented within the receptive field of a Small-Field STMD neuron. Probes are preceded by primers that either drift towards the receptive field, or away from the receptive field (Figure 8A). All trials were presented in a randomised order, separated by rest periods of at least 7 s.
Download links
A two-part list of links to download the article, or parts of the article, in various formats.
Downloads (link to download the article as PDF)
Open citations (links to open the citations from this article in various online reference manager services)
Cite this article (links to download the citations from this article in formats compatible with various reference manager tools)
A predictive focus of gain modulation encodes target trajectories in insect vision
eLife 6:e26478.
https://doi.org/10.7554/eLife.26478


