Kinesin superfamily protein Kif26b links Wnt5a-Ror signaling to the control of cell and tissue behaviors in vertebrates
- Harvard Medical School, United States
- University of California, Davis School of Medicine, United States
- Fred Hutchinson Cancer Research Center, United States
- Center for Reproductive Sciences, Eli and Edythe Broad Center of Regeneration Medicine and Stem Cell Research, University of California, United States
- Institute of Molecular Embryology and Genetics, Kumamoto University, Japan
- University of California, United States
Figures
Figure 1 with 2 supplements
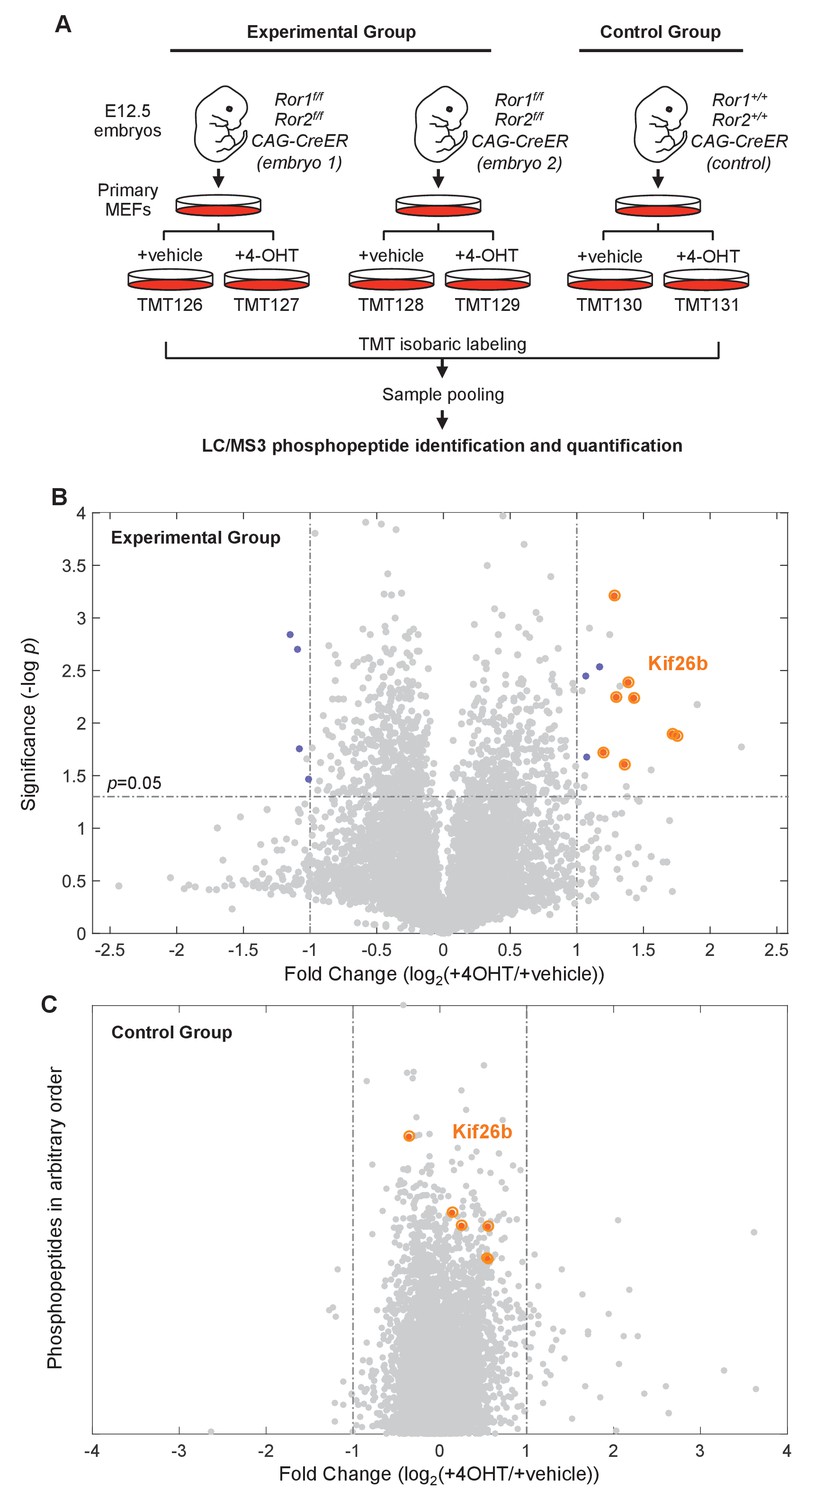
Phosphoproteomic screen identifies putative targets of the Wnt5a-Ror pathway.
(A) Experimental design of the six-plex mass spectrometry analysis to screen for Ror-dependent biochemical cellular changes (see the main text for details of the experimental design). (B) Volcano plot of all phosphopeptides identified and quantified in the experimental group. Significance (y-axis) is plotted against the average fold change (4-OHT/vehicle treated samples) of the two biological replicates (x-axis). Significance values were generated with a two-sample t-test comparing values from the biological replicates. 6498 phosphopeptides were screened in each experiment. ‘Hit’ phosphopeptides, as defined in the text, are marked in blue. All Kif26b phosphopeptides are circled in orange. (C) Volcano plot of all phosphopeptides identified and quantified in the control group. The fold change (4-OHT/vehicle treated samples) is plotted along the x-axis. The position of the phosphopeptides along the y-axis is arbitrary, since there is only one replicate of the control group and no significance value is calculated. Kif26b phosphopeptides are circled in orange.
Figure 1—figure supplement 1
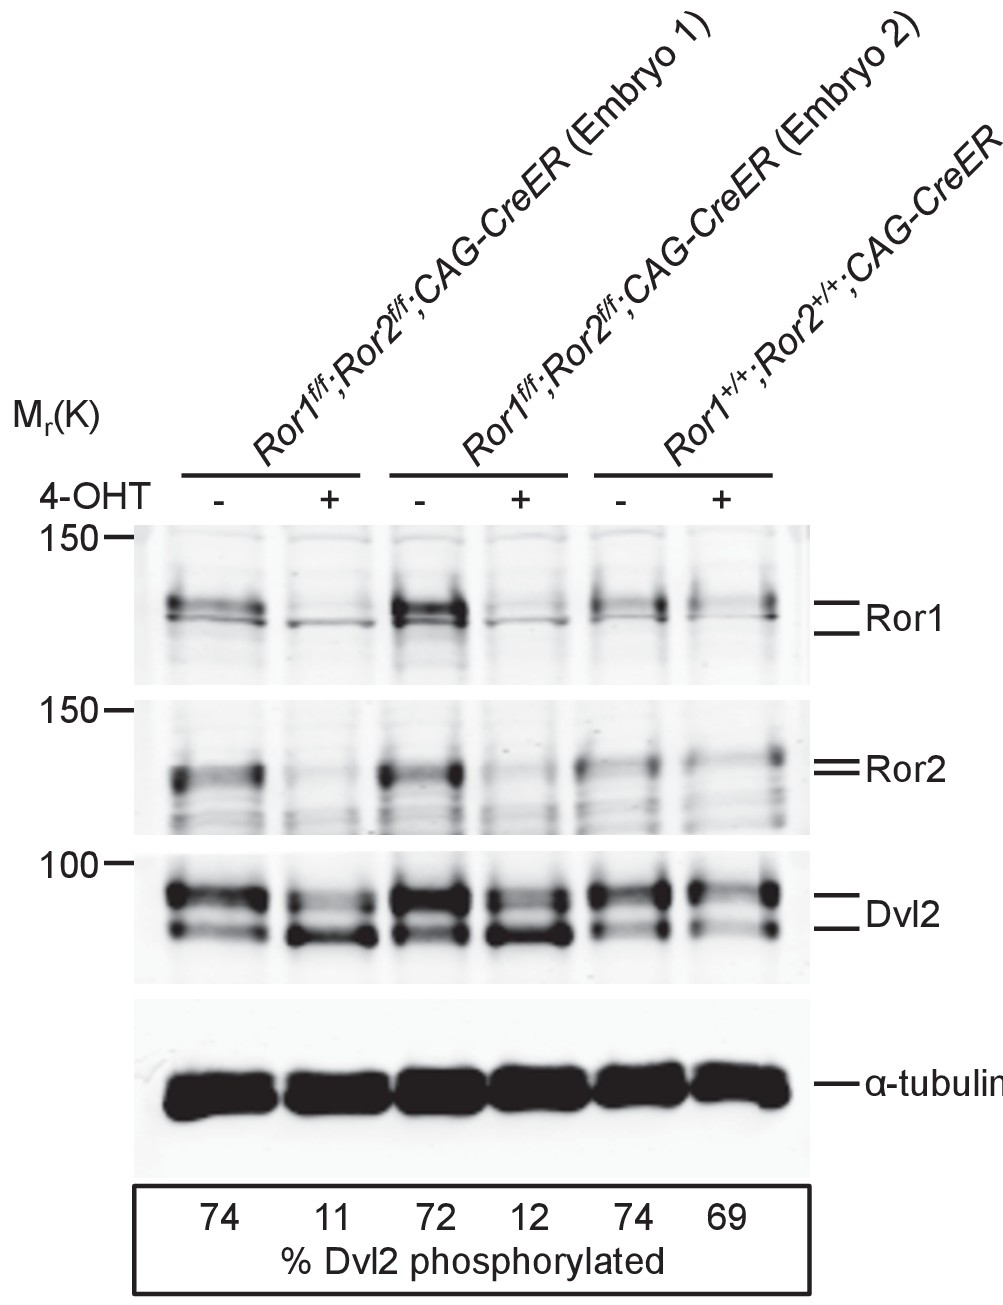
Conditional depletion of Ror1 and Ror2 protein in MEFs.
Immunoblots of Ror1 protein, Ror2 protein and Dvl2 protein in primary MEFs derived from the two separate E12.5 Ror1f/f; Ror2f/f; CAG-CreER mice and one E12.5 Ror1+/+; Ror2+/+; CAG-CreER mouse used in the phosphoproteomic screen. Samples were lysed in 8 M urea (see Materials and methods) rather than standard Laemmli sample buffer. 4-OHT or vehicle control was added for 72 hr prior to lysis. α-tubulin was used for loading controls. The asterisk denotes a protein unrelated to Ror1 that cross-reacts with the anti-Ror1 antibody.
Figure 1—figure supplement 2
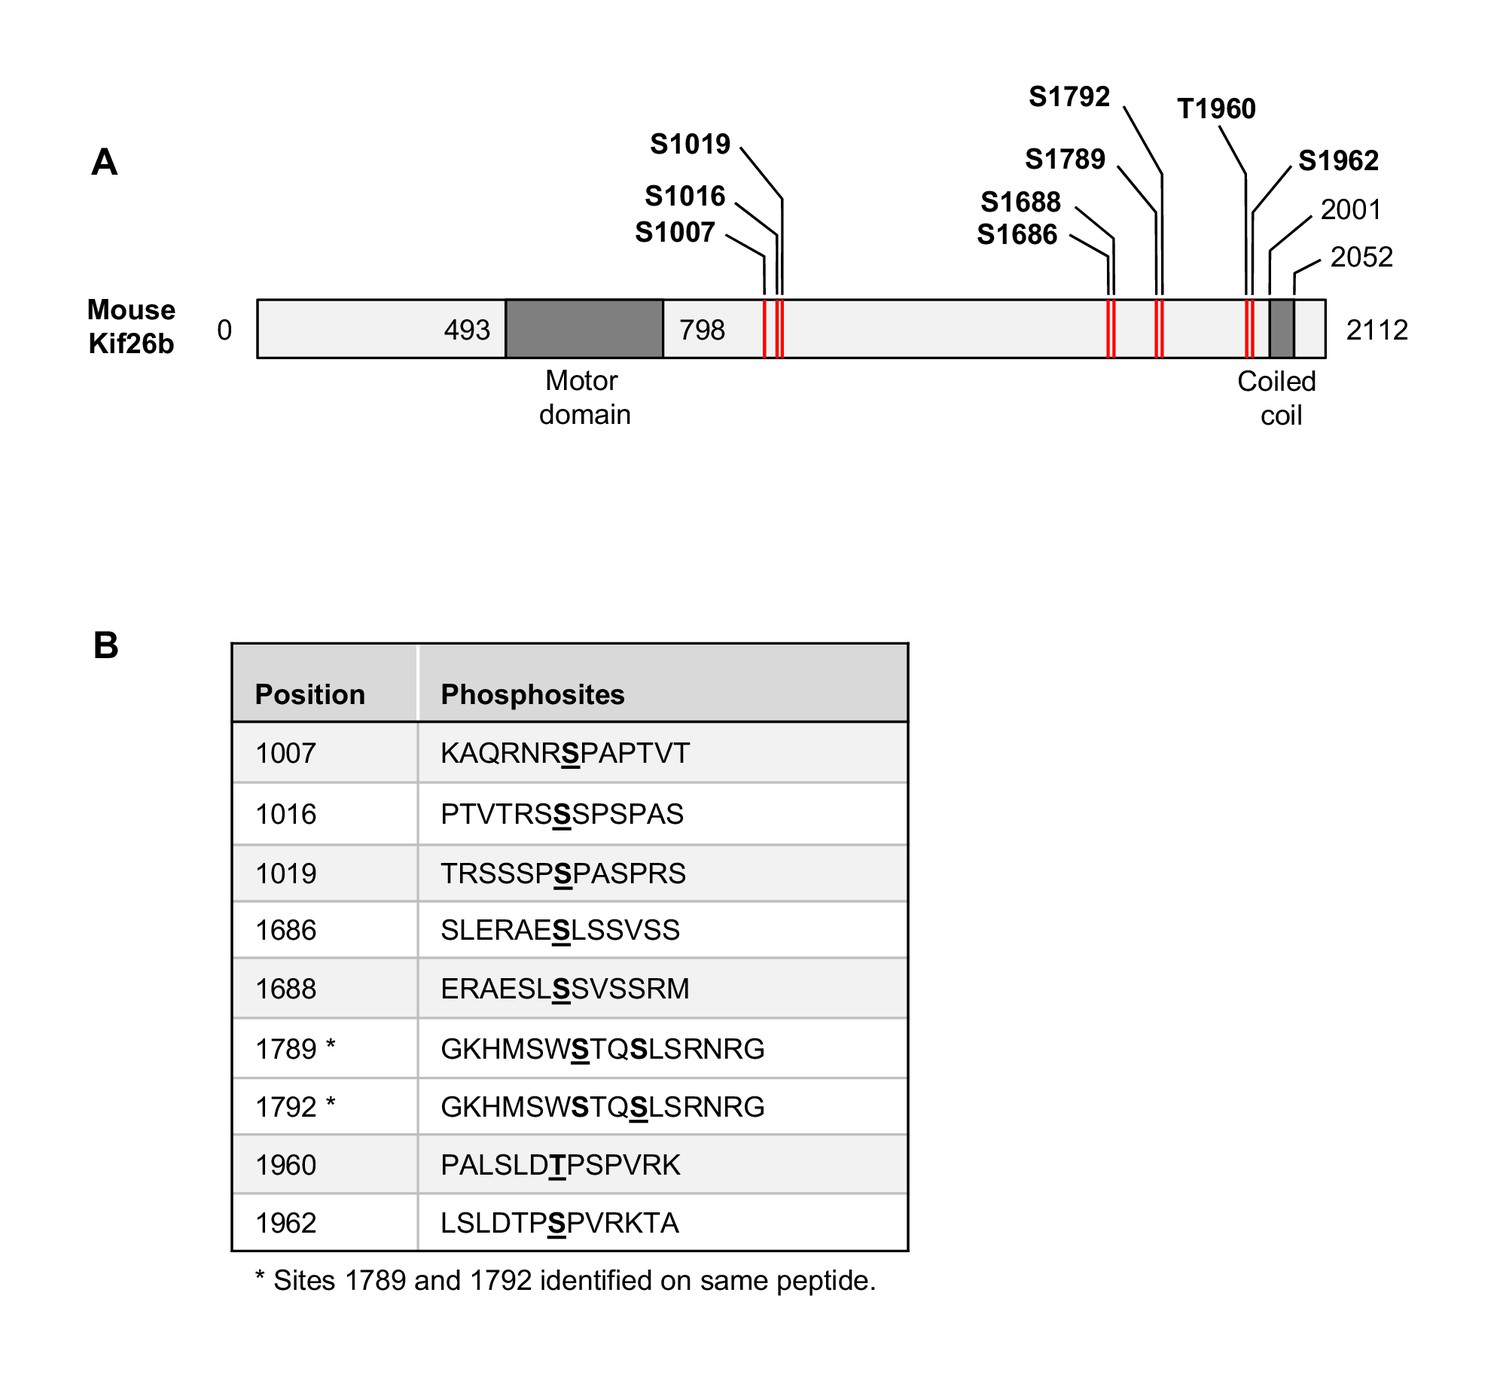
Kif26b phosphorylation sites identified in the phosphoproteomic screen.
(A) A schematic illustration of mouse Kif26b showing the amino acid boundaries of the motor and coiled coil domains. The motor and coiled coil domains were identified using the following web resources: http://scansite3.mit.edu/; http://www.ch.embnet.org/cgi-bin/COILS_form_parser. The relative positions of the Kif26b phosphorylation sites are marked with the red lines. (B) List of the Kif26b phosphorylation sites identified in the phosphoproteomic screen. The phosphorylated amino acids are underlined in bold.
Figure 2 with 1 supplement
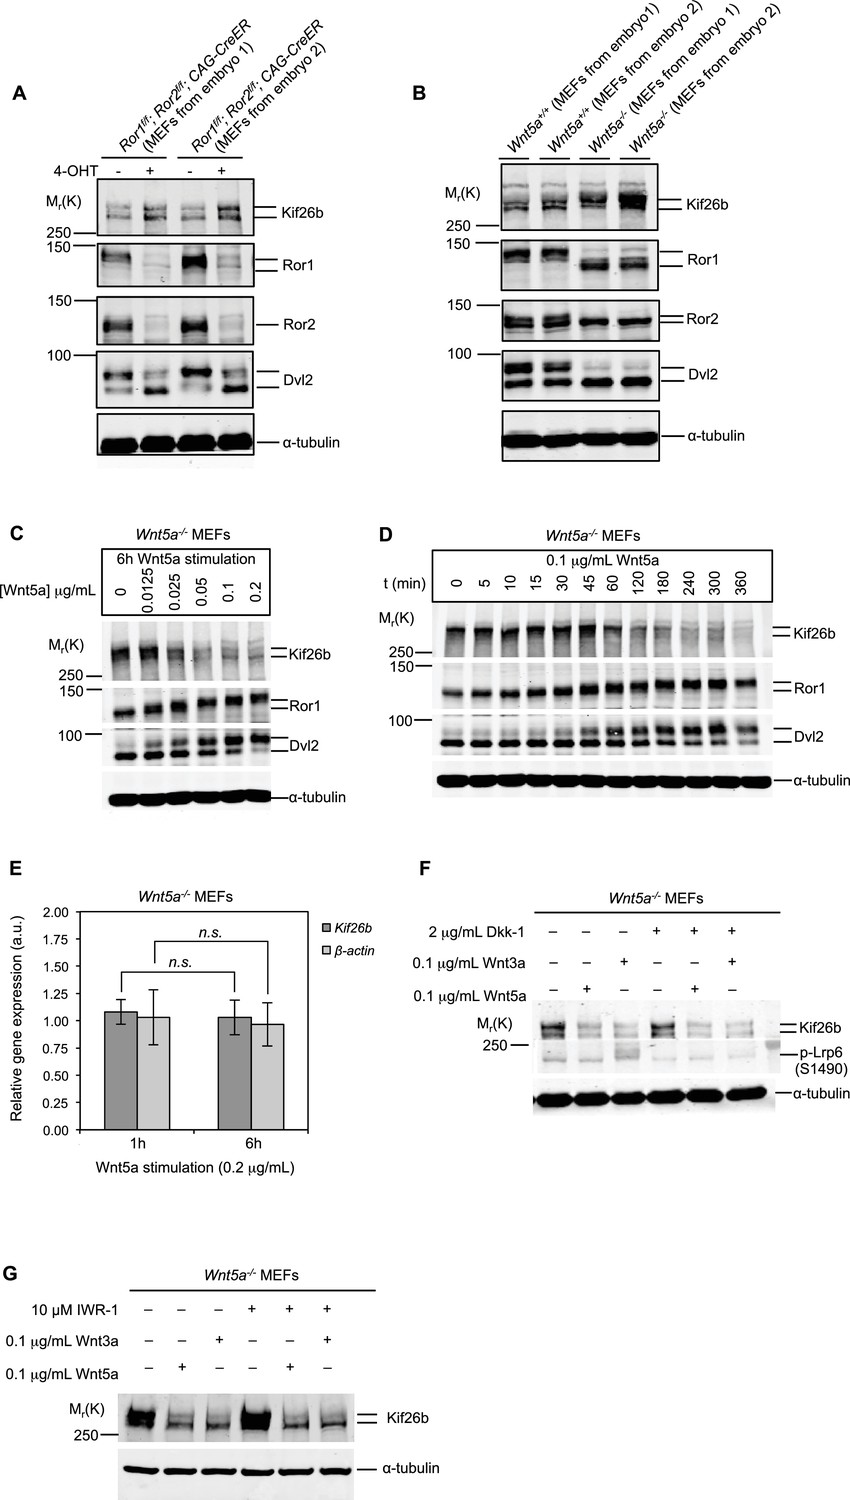
Kif26b protein levels are regulated by the expression of Wnt5a and Ror proteins in primary mouse embryonic fibroblasts.
(A) Immunoblots of Kif26b protein, Ror1 protein, Ror2 protein and Dvl2 protein in primary MEFs derived from two E12.5 Ror1f/f; Ror2f/f; CAG-CreER mice. 4-OHT or vehicle control was added for 72 hr prior to lysis. Results of two independent biological replicates are shown. (B) Immunoblots of Kif26b protein, Ror1 protein, Ror2 protein and Dvl2 protein in primary MEFs derived from littermate E12.5 Wnt5a+/+ and Wnt5a-/- mice. Results of two independent biological replicates are shown. (C) Immunoblots of Kif26b protein, Ror1 protein and Dvl2 protein in primary MEFs derived from E12.5 Wnt5a-/- mice. Recombinant Wnt5a protein was added for 6 hr prior to lysis at the indicated dose. (D) Immunoblots of Kif26b protein, Ror1 protein and Dvl2 protein in primary MEFs derived from E12.5 Wnt5a-/- mice. 0.1 μg/ml recombinant Wnt5a protein was added for the indicated amount of time prior to lysis. (E) Plot showing relative mRNA expression of Kif26b and β-actin as measured by RT-qPCR in primary MEFs derived from E12.5 Wnt5a-/- mice, with 1 hr or 6 hr of Wnt5a stimulation. The y-axis represents fold change relative to expression levels in unstimulated cells. Error bars represent ± SEM calculated from three technical replicates. t-test (unpaired) was determined for the following comparisons: Kif26b 1 hr vs. 6 hr, p=0.249, not significant; β-actin 1 hr vs. 6 hr, p=0.320, not significant. (F) Immunoblots of Kif26b protein and phospho-Lrp6 (serine 1490) protein in primary MEFs derived from E12.5 Wnt5a-/- mice. Recombinant Dkk-1 (0.1 μg/ml) or vehicle control was added 8 hr prior to lysis. Recombinant Wnt3a protein, Wnt5a protein or vehicle control was added for 6 hr prior to lysis. (G) Immunoblots of Kif26b protein in primary MEFs derived from E12.5 Wnt5a-/- mice. IWR-1 or vehicle control was added 7 hr prior to lysis. Recombinant Wnt3a protein, Wnt5a protein or vehicle control was added for 6 hr prior to lysis. α-tubulin was used for loading controls in all experiments. All immunoblot samples were normalized by BCA assays for total protein.
-
Figure 2—source data 1
(Related to panel E) Relative mRNA expression of Kif26b and β-actin as measured by RT-qPCR in primary MEFs derived from E12.5 Wnt5a-/- mice, after 1 hr or 6 hr of Wnt5a stimulation.
- https://doi.org/10.7554/eLife.26509.007
Figure 2—figure supplement 1
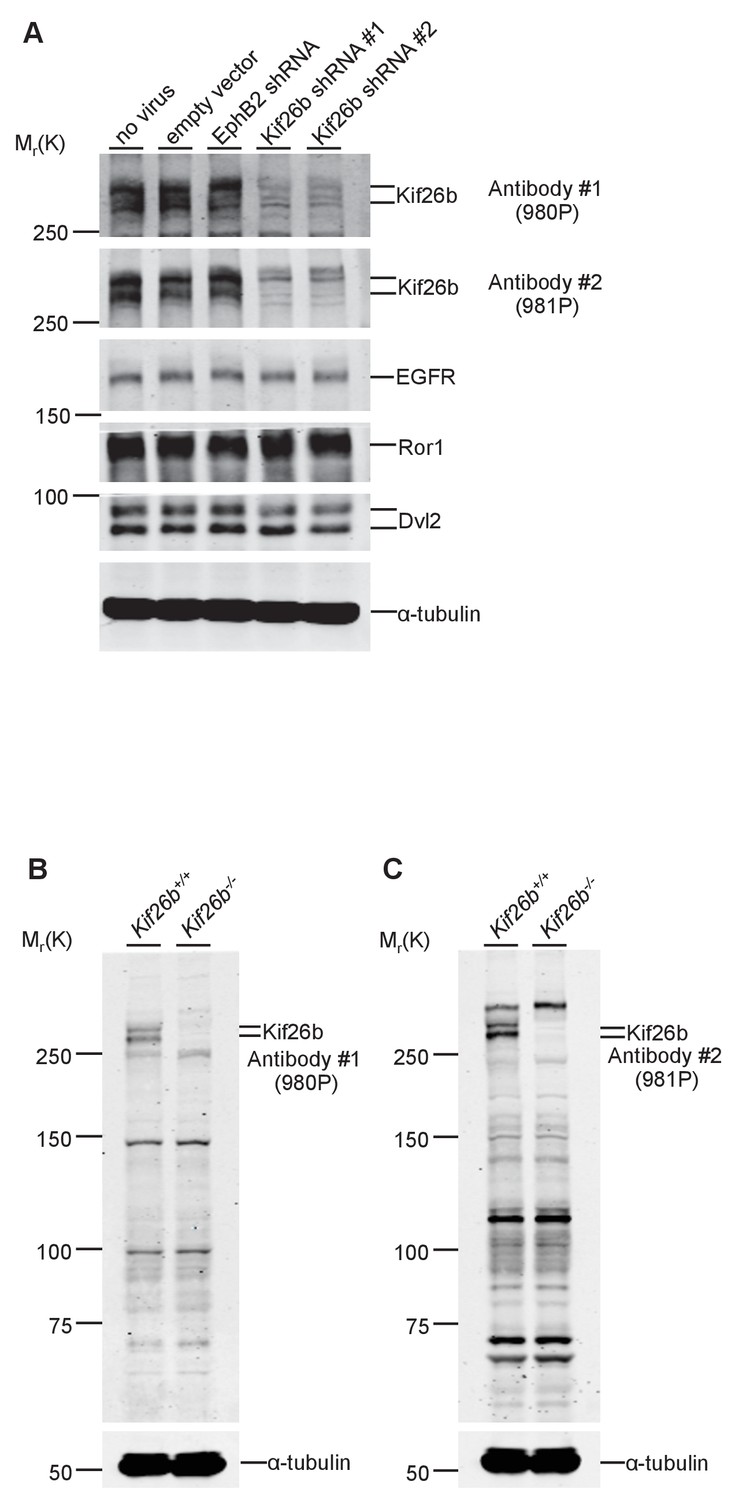
Validation of anti-Kif26b antibodies.
(A) Immunoblots of Kif26b protein, EGFR protein, Ror1 protein and Dvl2 protein in primary MEFs derived from E12.5 WT mice. Indicated shRNAs were transduced via lentiviral transduction. An empty vector and an shRNA directed at EphB2 were used as negative controls. (B) Immunoblot of Kif26b protein in primary MEFs derived from littermate E12.5 Kif26b+/+ and Kif26b-/- mice using the anti-Kif26b antibody 980P. (C) Immunoblot of Kif26b protein in primary MEFs derived from littermate E12.5 Kif26b+/+ and Kif26b-/- mice using the anti-Kif26b antibody 981P. α-tubulin was used for loading controls in all experiments.
Figure 3 with 2 supplements
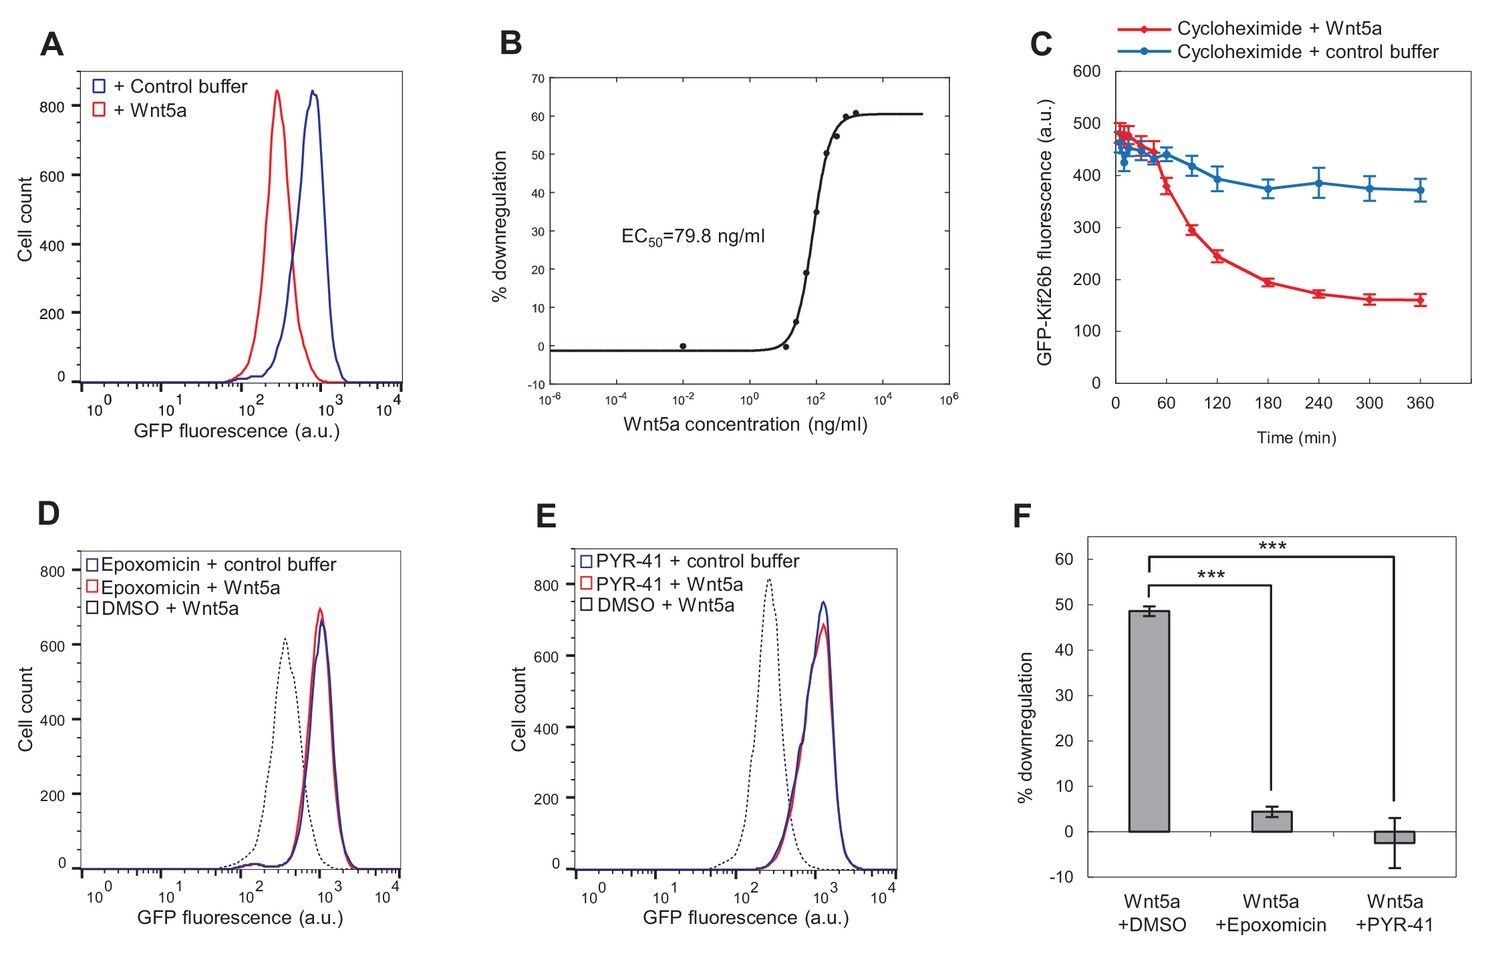
Wnt5a downregulates Kif26b levels via a ubiquitin/proteasome-dependent mechanism.
(A) Flow cytometry histograms depicting the downregulation of GFP-Kif26b fluorescence in the WRK reporter cell line after Wnt5a stimulation (0.2 μg/ml Wnt5a) for 6 hr. (B) Dose-response curve showing GFP-Kif26b downregulation as a function of Wnt5a concentration, as measured in the WRK reporter assay. (C) The kinetics of GFP-Kif26b turnover in the absence or presence of Wnt5a stimulation, as measured in the WRK reporter assay. Cycloheximide was used to block new protein synthesis in the reporter cells. (D) Flow cytometry histograms depicting the effect of epoxomicin treatment (1 μM) on the ability of Wnt5a (0.2 μg/ml) to downregulate GFP-Kif26b fluorescence in the WRK reporter assay. DMSO was used as the drug vehicle control. (E) Flow cytometry histograms depicting the effect of PYR-41 treatment (50 μM) on the ability of Wnt5a (0.2 μg/ml) to downregulate GFP-Kif26b fluorescence in the WRK reporter assay. DMSO was used as the drug vehicle control. (F) Quantification of the effects of DMSO, epoxomicin and PYR-41 on the ability of Wnt5a to downreagulate GFP-Kif26b fluorescence in the WRK reporter assay, as shown in (D) and (E). Error bars represent ± SEM calculated from three technical replicates. t-tests were determined for the following comparisons: DMSO vs. epoxomicin, p<0.001; DMSO vs. PYR-41, p<0.001.
-
Figure 3—source data 1
(Related to panel C) The kinetics of GFP-Kif26b turnover in the absence or presence of Wnt5a stimulation.
- https://doi.org/10.7554/eLife.26509.011
-
Figure 3—source data 2
(Related to panel F) The effects of DMSO, epoxomicin and PYR-41 on the ability of Wnt5a to downregulate GFP-Kif26b fluorescence in the WRK reporter assay.
- https://doi.org/10.7554/eLife.26509.012
Figure 3—figure supplement 1
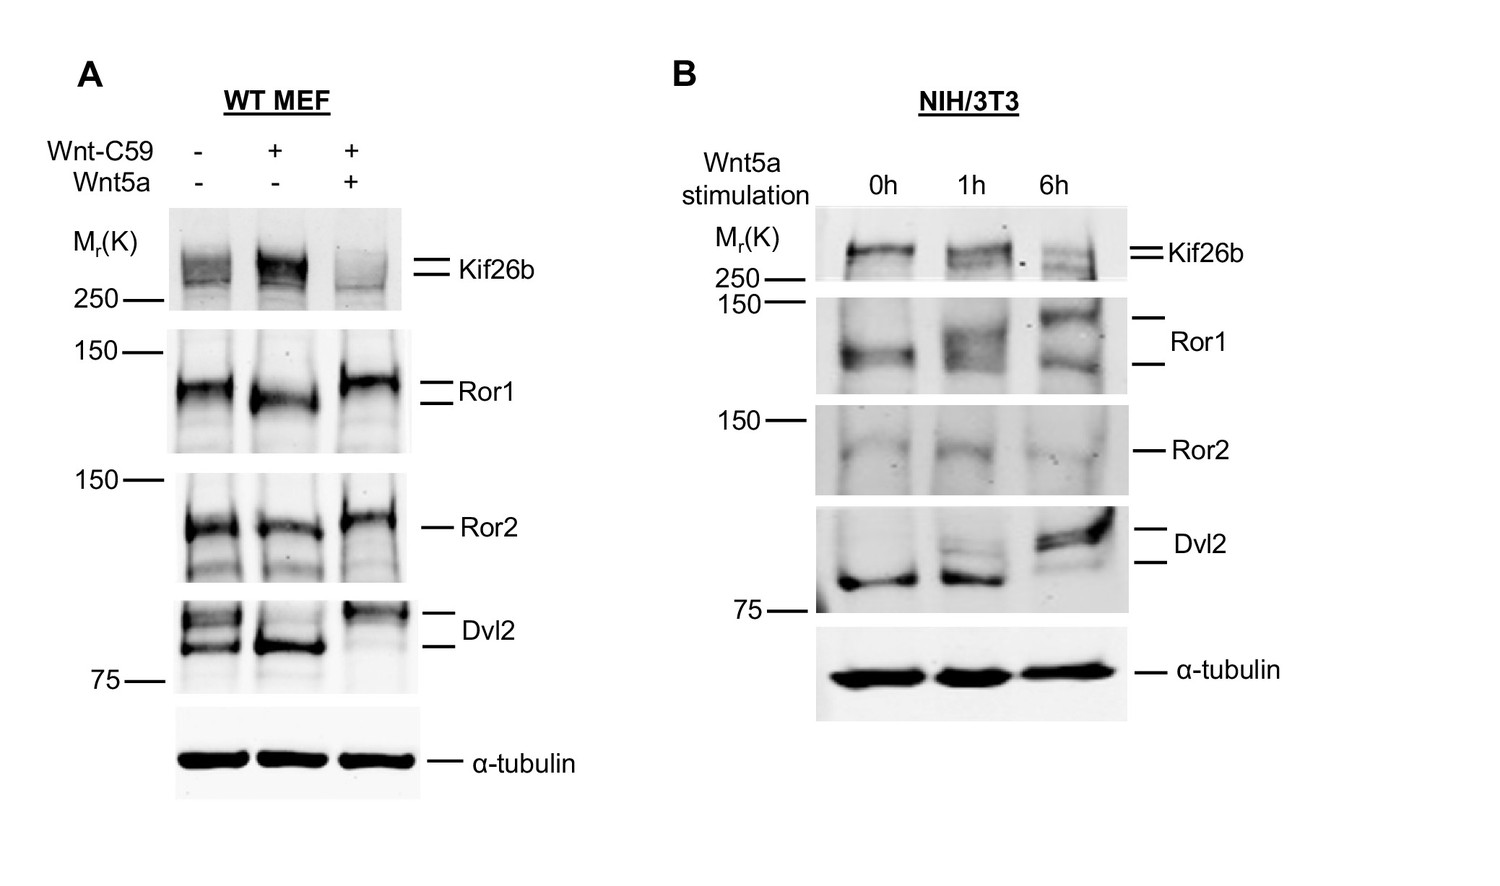
Expression of Wnt5a-Ror signaling components in MEFs and NIH/3T3 cells.
(A) Immunoblots of Kif26b protein, Ror1 protein, Ror2 protein and Dvl2 protein in primary MEFs derived from E12.5 WT mice. WT MEFs have a high basal level of Wnt5a-Ror signaling activity, as indicated by hyperphosphorylation of Ror1, Ror2 and Dvl2. Wnt-C59 was added to inhibit this basal activity. The effects of Wnt-C59 on Kif26b levels and the phosphorylation of Ror1, Ror2 and Dvl2 can be rescued by treatment with recombinant Wnt5a (0.2 μg/ml Wnt5a for 6 hr). (B) Immunoblots of Kif26b protein, Ror1 protein, Ror2 protein and Dvl2 protein in NIH/3T3 cells. NIH/3T3 cells have a low basal level of Wnt5a-Ror signaling. Wnt5a was added to stimulate this activity. α-tubulin was used for loading controls in all experiments.
Figure 3—figure supplement 2
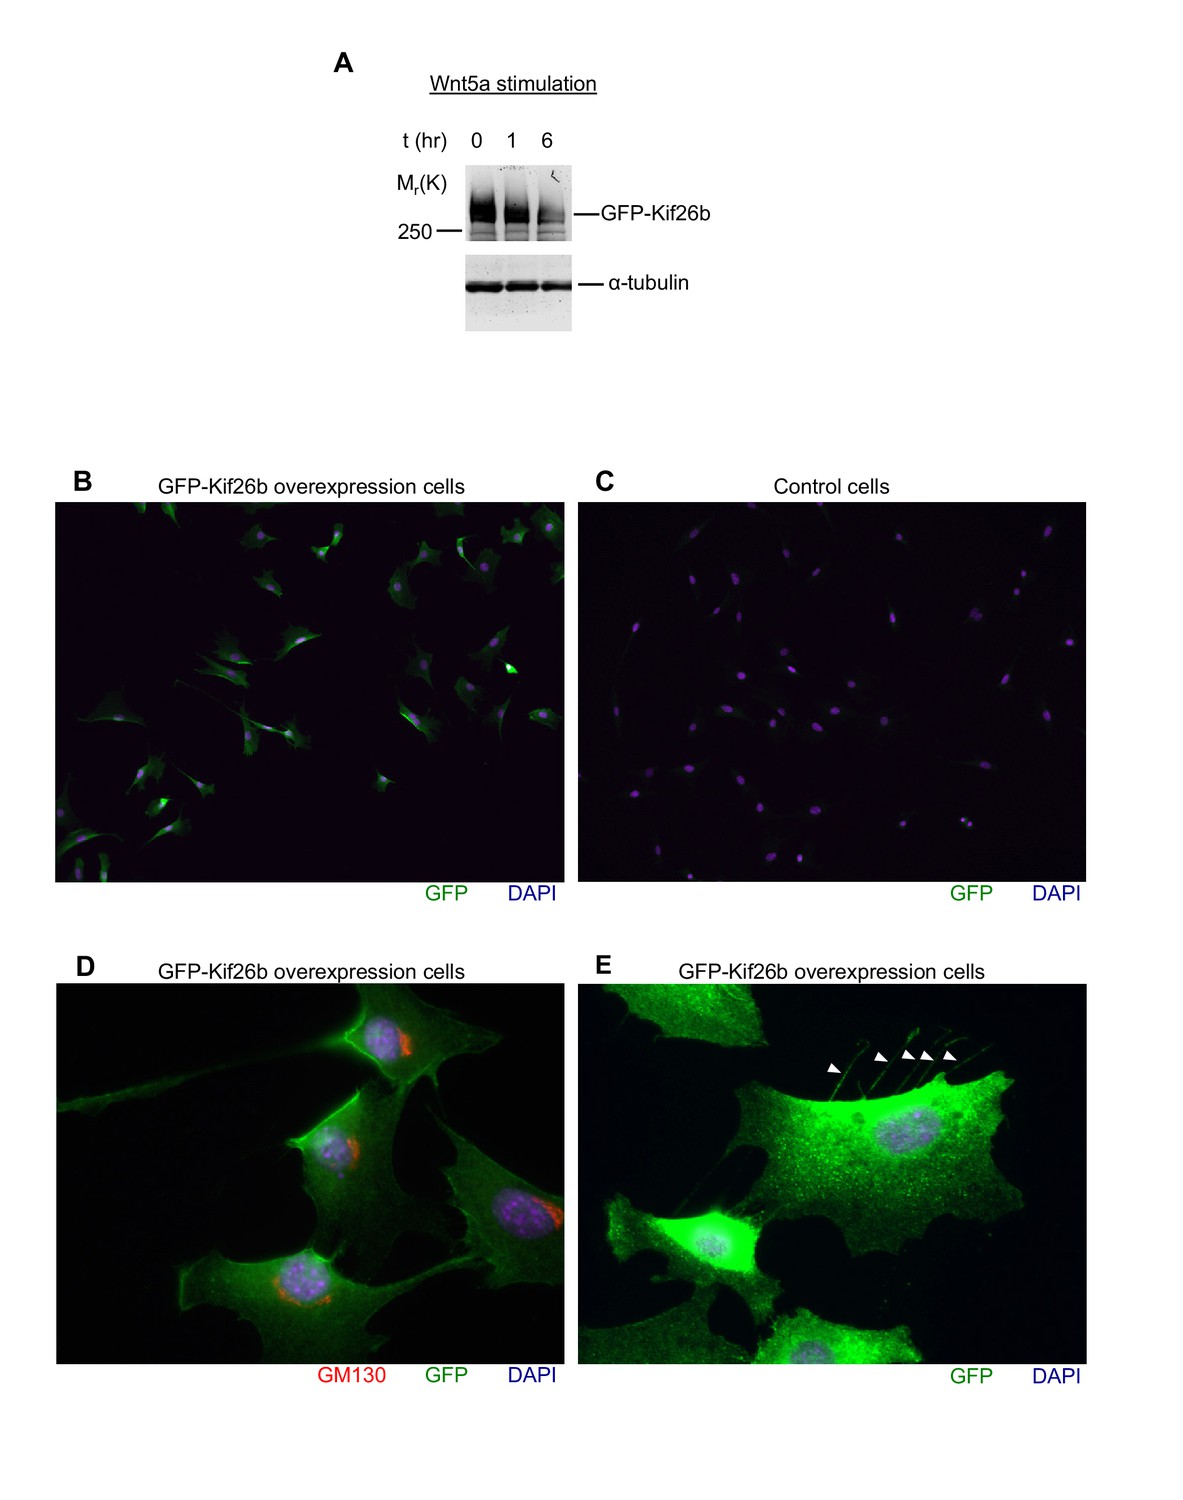
Characterization of the GFP-Kif26b (WRK) reporter line.
(A) Anti-Kif26b immunoblot of the GFP-Kif26b protein expressed under the control of an EF1 promoter in the WRK reporter cell line. The reporter cells were stimulated with 0.2 μg/ml Wnt5a for 0 hr, 1 hr or 6 hr. α-tubulin was used for loading controls. (B and C) Immunostaining of the GFP-Kif26b expressing NIH/3T3 cell line (B) and a control NIH/3T3 cell line for GFP (C). Images were acquired with a 10x objective at equal exposures. (D) Co-immunostaining of a GFP-Kif26b expressing NIH/3T3 cell line for GFP and the cis Golgi network marker GM130, which typically localizes to the leading side of the nucleus of polarized mesenchymal cells. Image was acquired with a 63x objective. (E) Immunostaining of a GFP-Kif26b expressing NIH/3T3 cell line for GFP. Image was acquired with a 63x objective. Exposure is increased to highlight GFP staining in retraction fibers (arrowheads).
Figure 4 with 1 supplement
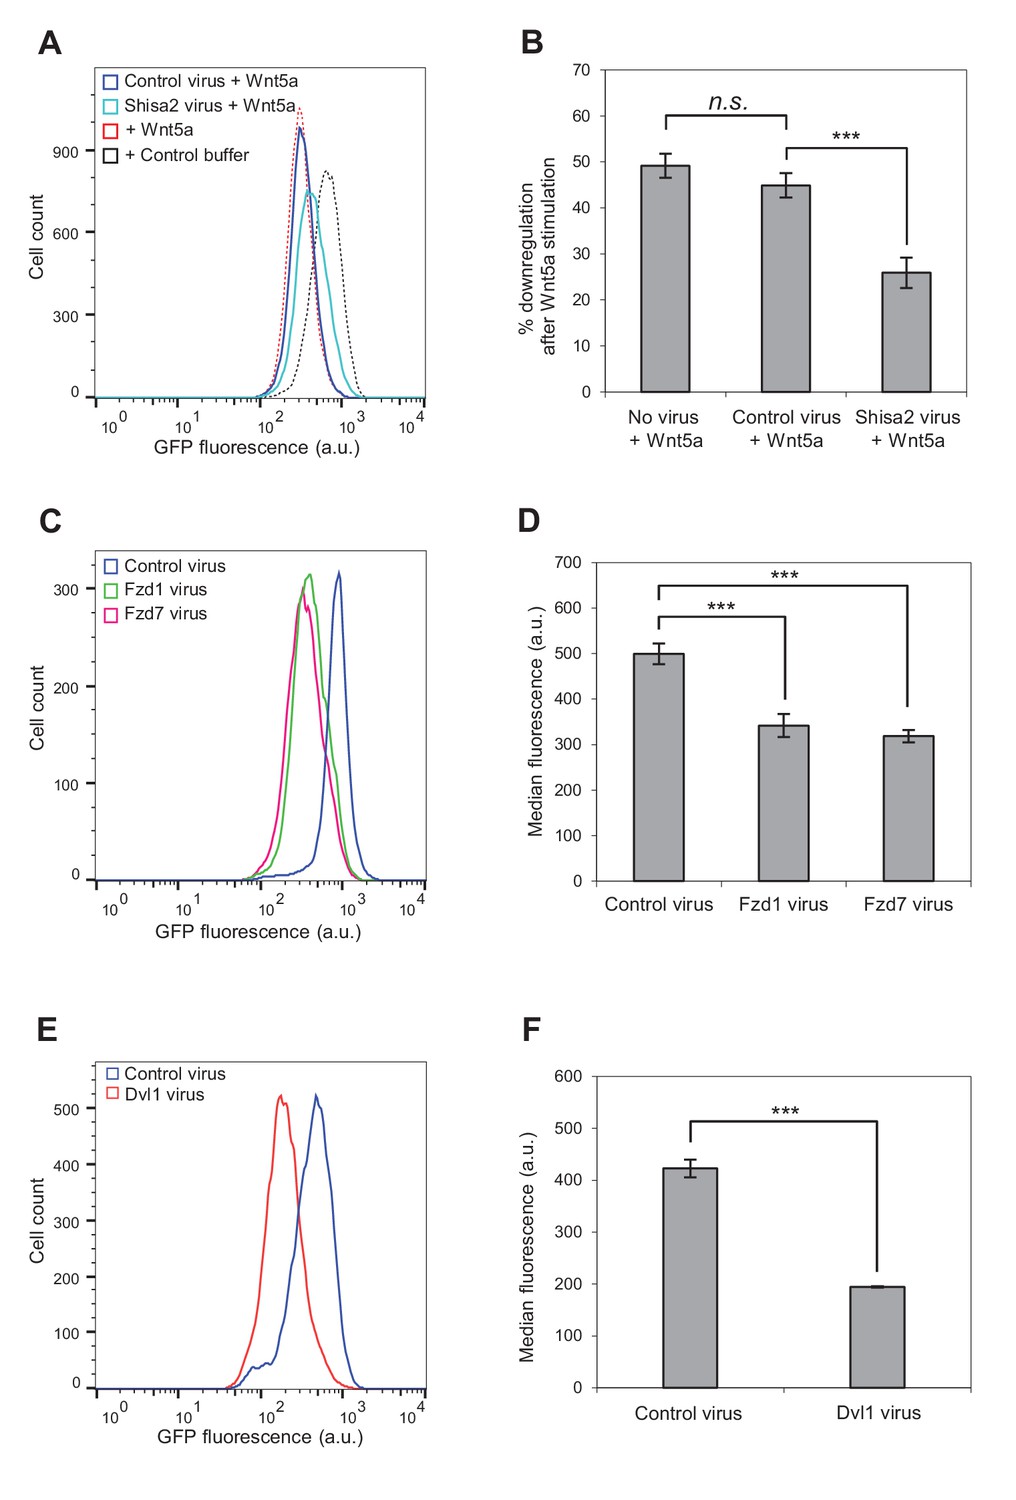
Involvement of Fzd and Dvl proteins in Kif26b degradation.
(A) Flow cytometry histograms depicting the effect of ectopic Shisa2 expression on the ability of Wnt5a to induce GFP-Kif26b degradation in the WRK reporter assay. Mouse Shisa2 was expressed via lentiviral transduction. A lentivirus expressing Cas9 was used as the control. The effect of Wnt5a or control buffer treatment on the WRK reporter line without virus infection is shown as a reference. (B) Quantification of effects of the control virus (Cas9) and the Shisa2 virus on the ability of Wnt5a to downregulate the GFP-Kif26b fluorescence in the WRK reporter assay, as shown in (A). Error bars represent ± SEM calculated from three technical replicates. t-tests were determined for the following comparisons: control virus vs. Shisa2 virus, p<0.001; control virus vs. no virus, p=0.0957 (not significant). (C) Flow cytometry histograms depicting the effect of ectopic Fzd1 or Fzd7 expression on GFP-Kif26b levels in the WRK reporter assay. Mouse Fzd1 and Fzd7 were expressed via lentiviral transduction. A lentivirus expressing Cas9 was used as the control. (D) Quantification of the median GFP-Kif26b fluorescence in the WRK reporter cell line infected with a Fzd1 virus, a Fzd7 virus, or a Cas9 control virus. Error bars represent ± SEM calculated from six technical replicates. t-tests were determined for the following comparisons: control virus vs. Fzd1 virus, p<0.001; control virus vs. Fzd7 virus, p<0.001. (E) Flow cytometry histograms depicting the effect of ectopic Dvl1 expression on GFP-Kif26b levels in the WRK reporter assay. Dvl1 was expressed via lentiviral transduction. A lentivirus expressing Cas9 was used as the control. (F) Quantification of the median GFP-Kif26b fluorescence in the WRK reporter cell line infected with a Dvl1-expressing virus, or a Cas9-expressing control virus. Error bars represent ± SEM calculated from three technical replicates. t-test was determined for control virus vs. Dvl1 virus, p<0.001.
-
Figure 4—source data 1
(Related to panel B) The effects of the control virus and the Shisa2 virus on the ability of Wnt5a to downregulate GFP-Kif26b fluorescence in the WRK reporter assay.
- https://doi.org/10.7554/eLife.26509.016
-
Figure 4—source data 2
(Related to panel D) The median GFP-Kif26b fluorescence in the WRK reporter cell line infected with a Fzd1 virus, a Fzd7 virus, or a Cas9 control virus.
- https://doi.org/10.7554/eLife.26509.017
-
Figure 4—source data 3
(Related to panel F) Quantification of the median GFP-Kif26b fluorescence in the WRK reporter cell line infected with a Dvl1 virus or a Cas9 control virus.
- https://doi.org/10.7554/eLife.26509.018
Figure 4—figure supplement 1
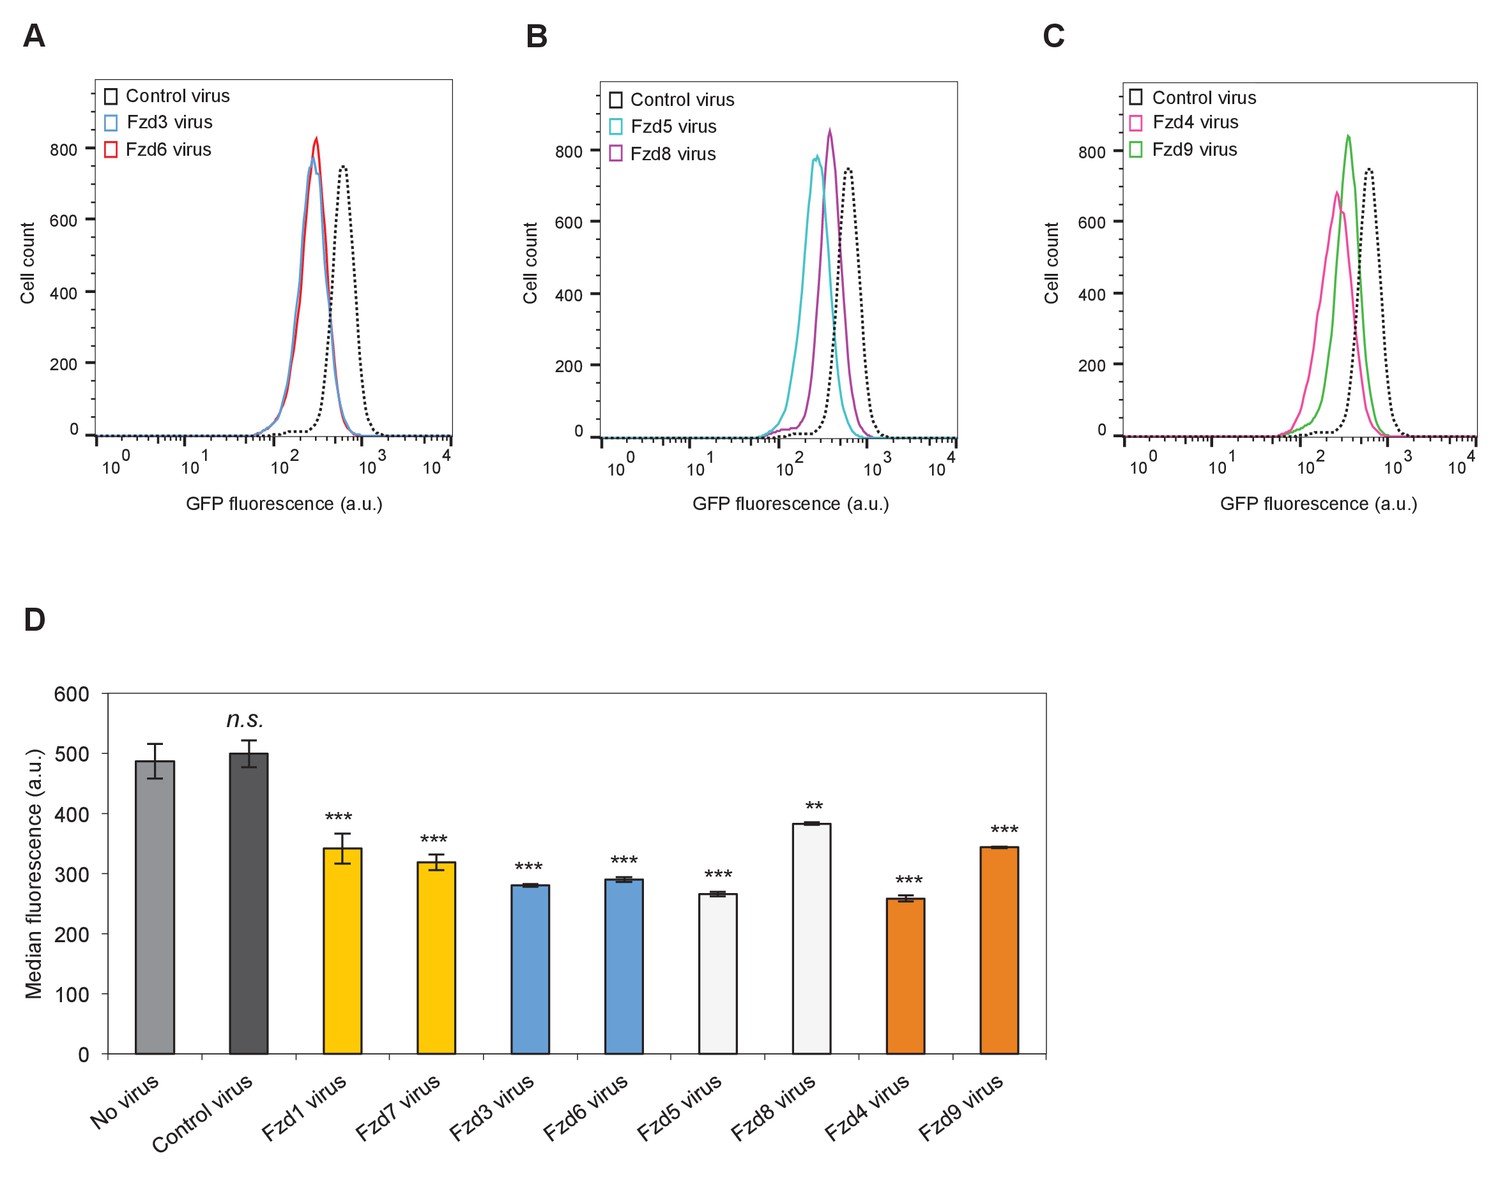
Comparison of the abilities of distinct Fzd subfamily members to induce Kif26b degradation.
(A) Flow cytometry histograms depicting the effect of ectopic Fzd3 or Fzd6 expression on GFP-Kif26b levels in the WRK reporter assay. Mouse Fzd3 and Fzd6 were expressed via lentiviral transduction. Histogram from an uninfected WRK reporter cell line is shown as a reference. (B) Flow cytometry histograms depicting the effect of ectopic Fzd5 or Fzd8 expression on GFP-Kif26b levels in the WRK reporter assay. Mouse Fzd5 and Fzd8 were expressed via lentiviral transduction. Histogram from an uninfected WRK reporter cell line is shown as a reference. (C) Flow cytometry histograms depicting the effect of ectopic Fzd4 or Fzd9 expression on GFP-Kif26b levels in the WRK reporter assay. Mouse Fzd4 and Fzd9 were expressed via lentiviral transduction. Histogram from an uninfected WRK reporter cell line is shown as a reference. (D) Quantification of the median GFP-Kif26b fluorescence in the WRK reporter cell line infected with various Fzd viruses shown in (A) – (C). Fzds with the same color bars are part of the same sub-families. WRK reporter lines uninfected or infected with a Cas9 virus are shown as controls. Error bars represent ± SEM calculated from technical replicates. n = 9 for no virus and control viurs. n = 6 for Fzd1 and Fzd7 viruses. n = 3 for all other Fzd viruses. t-tests were determined for the following comparisons: control virus vs. Fzd1 virus, p<0.001; control virus vs. Fzd7 virus, p<0.001; control virus vs. Fzd3 virus, p<0.001; control virus vs. Fzd6 virus, p<0.001; control virus vs. Fzd5 virus, p<0.001; control virus vs. Fzd8 virus, p<0.01; control virus vs. Fzd4 virus, p<0.001; control virus vs. Fzd9 virus, p<0.001; control virus vs. no virus, p=0.3683 (not significant).
Figure 5 with 3 supplements
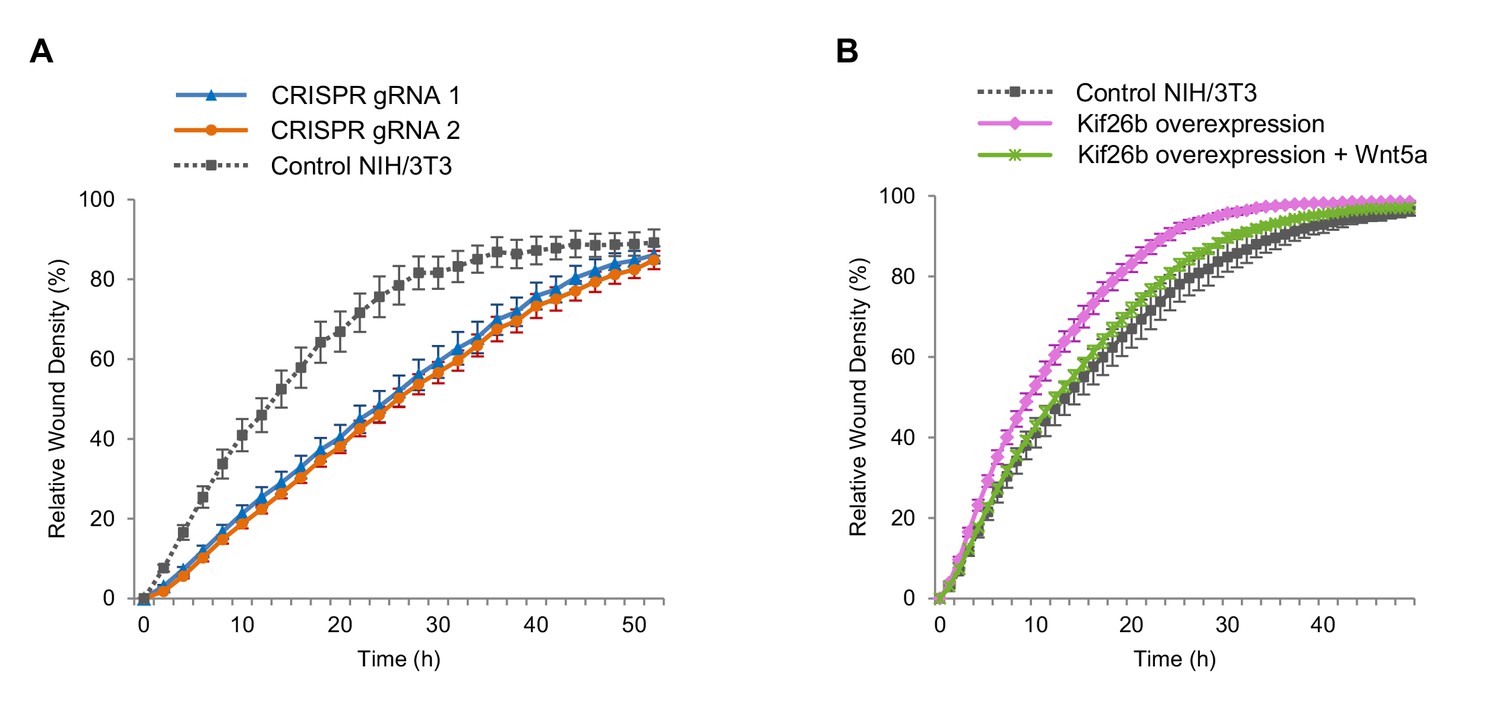
Wnt5a-Kif26b signaling modulates the migratory behavior of NIH/3T3 cells.
(A) Relative wound density of two separate NIH/3T3 cell lines in which Kif26b expression is knocked out using CRISPR/Cas9 genome editing, and one control Cas9-expressing NIH/3T3 cell line in a kinetic wound-healing assay. Data are the mean of five independent samples and error bars indicate SEM. t-tests (unpaired) were determined for the following comparisons: control NIH/3T3 vs. gRNA1, p<0.05; control NIH/3T3 vs. gRNA2, p<0.05. (B) Relative wound density of a GFP-Kif26b expressing NIH/3T3 cell line, treated with or without Wnt5a (0.2 μg/ml, added at the 0 hr time point) and a control NIH/3T3 cell line in a kinetic wound-healing assay. Data are the mean of five independent samples and error bars indicate SEM. t-tests (unpaired) were determined for the following comparisons: control NIH/3T3 vs. Kif26b overexpression, p<0.05 (at every time point except the last time point); Kif26b overexpression vs. Kif26b overexpression +Wnt5a, p<0.05 (from 3 to 38 hr time points).
-
Figure 5—source data 1
(Related to panel A) Relative wound density of two separate NIH/3T3 cell lines in which Kif26b expression is knocked out using CRISPR/Cas9 genome editing, and one control Cas9-expressing NIH/3T3 cell line in a kinetic wound-healing assay.
- https://doi.org/10.7554/eLife.26509.023
-
Figure 5—source data 2
(Related to panel B) Relative wound density of a GFP-Kif26b expressing NIH/3T3 cell line, treated with or without Wnt5a and a control NIH/3T3 cell line in a kinetic wound-healing assay.
- https://doi.org/10.7554/eLife.26509.024
Figure 5—figure supplement 1
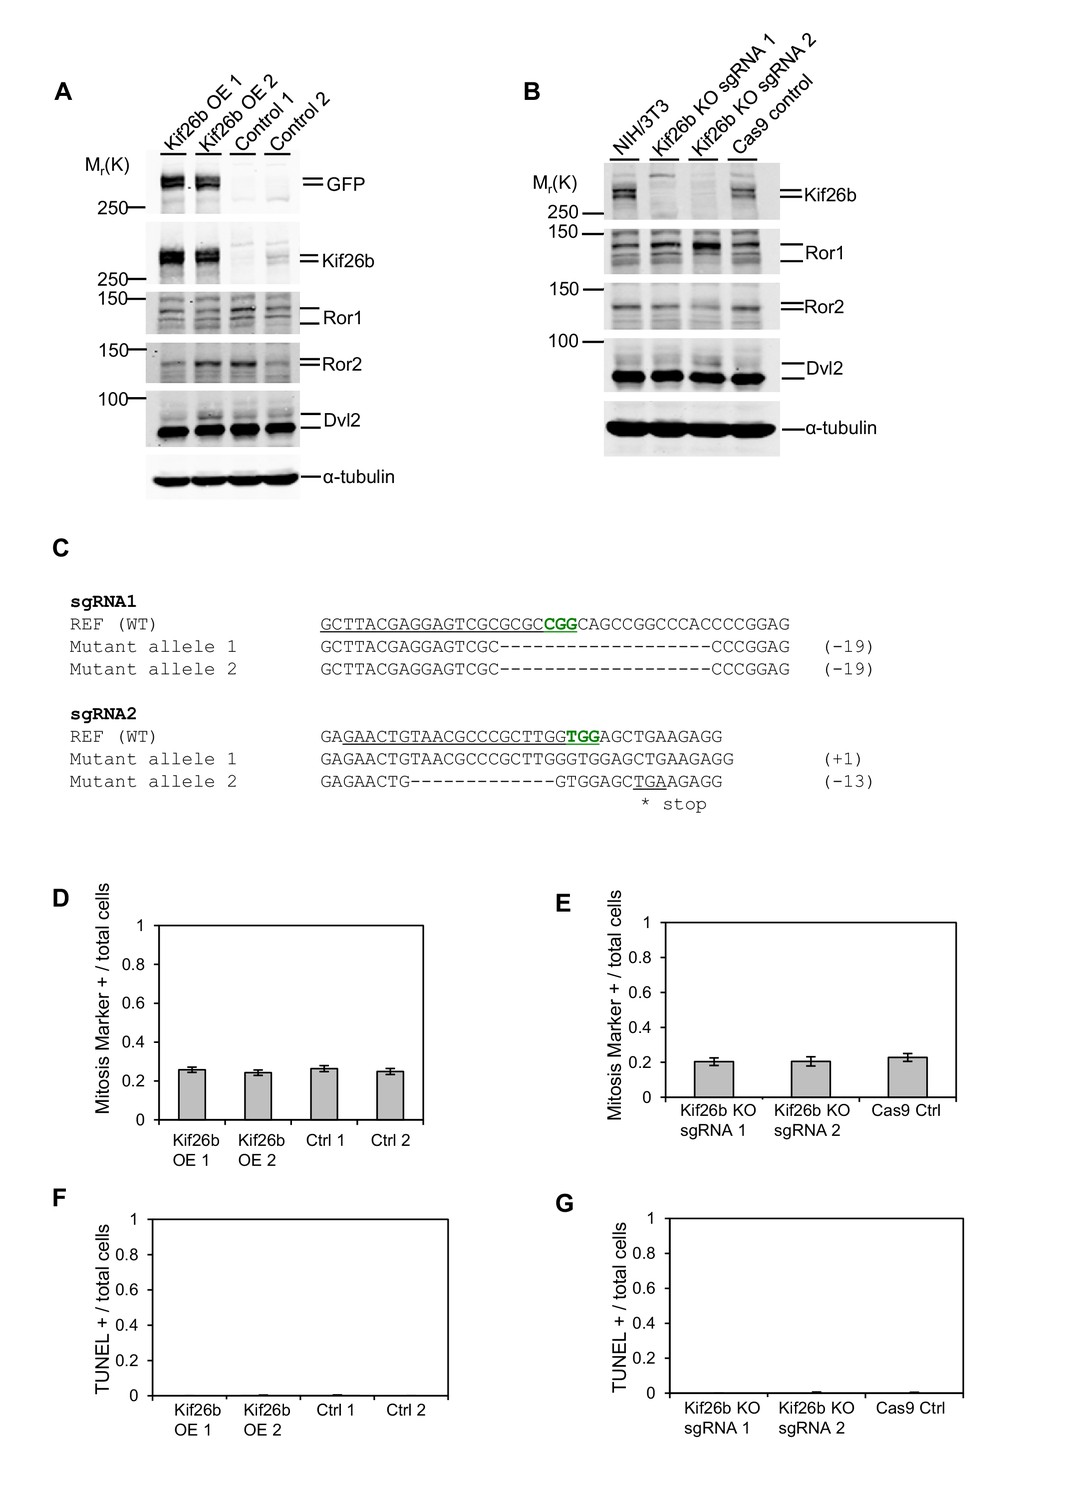
Overexpression of GFP-Kif26b or knockout of Kif26b expression does not affect the proliferation rate or survival of NIH/3T3 cells.
(A) Immunoblots of Kif26b protein, Ror1 protein, Ror2 protein and Dvl2 protein in NIH/3T3 cell lines overexpressing (OE) GFP-tagged Kif26b protein using the Flp-In system or control NIH/3T3 cell lines that were transfected with an empty vector and selected in parallel. (B) Immunoblots of Kif26b protein, Ror1 protein, Ror2 protein and Dvl2 protein in NIH/3T3 cells, two separate NIH/3T3 cell lines in which Kif26b expression is knocked out using CRISPR/Cas9 genome editing, and one control Cas9-expressing NIH/3T3 cell line. (C) Sequences of the CRISPR/Cas9-generated mutated Kif26b alleles. The PAM site for each target sequence is marked in green. (D) Fraction of cells exhibiting nuclear staining of phosphorylated Serine 10 of Histone H3 relative to total DAPI-positive nuclei of NIH/3T3 cell lines expressing GFP-tagged Kif26b protein and control NIH/3T3 cell lines. (E) Fraction of cells exhibiting nuclear staining of phosphorylated Serine 10 of Histone H3 relative to total DAPI-positive nuclei of NIH/3T3 cell lines in which Kif26b expression is knocked out using CRISPR/Cas9 genome editing and a control Cas9-expressing. NIH/3T3 cell line. (F) Fraction of cells exhibiting nuclear TUNEL staining relative to total DAPI-positive nuclei of NIH/3T3 cell lines expressing GFP-tagged Kif26b protein and control NIH/3T3 cell lines. (G) Fraction of cells exhibiting nuclear TUNEL staining relative to total DAPI-positive nuclei of NIH/3T3 cell lines in which Kif26b expression is knocked out using CRISPR/Cas9 genome editing and a control Cas9-expressing NIH/3T3 cell line. Error bars represent ± SEM for each condition.
Figure 5—figure supplement 2
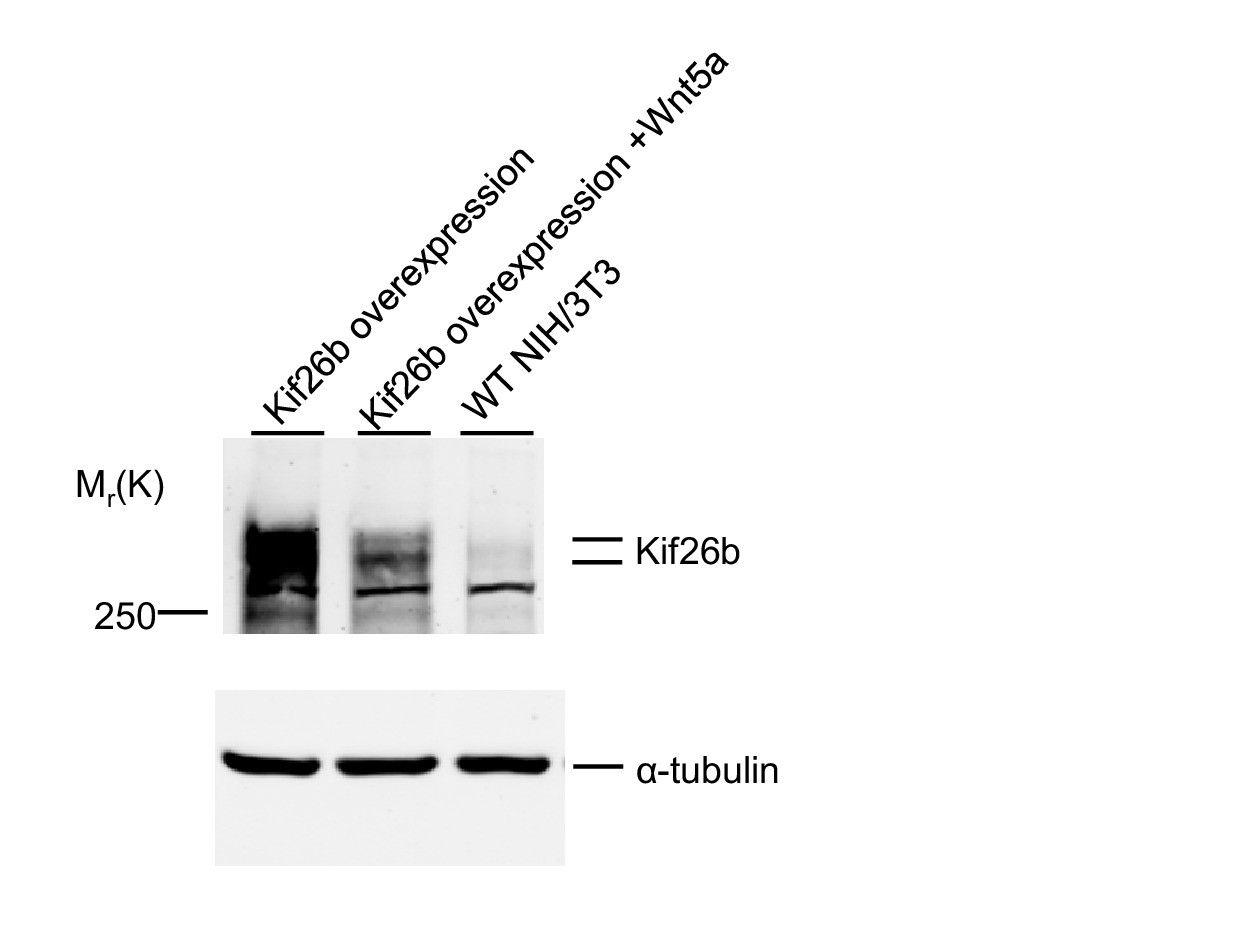
Wnt5a downregulates the cellular levels of GFP-Kif26b.
Immunoblots showing levels of Kif26b in GFP-Kif26b-overexpressing NIH/3T3 cells, without or with Wnt5a stimulation (0.1 μg/ml Wnt5a for 24 hr). The level of Kif26b endogenously expressed in WT NIH/3T3 cells is also shown. α-tubulin was used as a protein loading control.
Figure 5—figure supplement 3
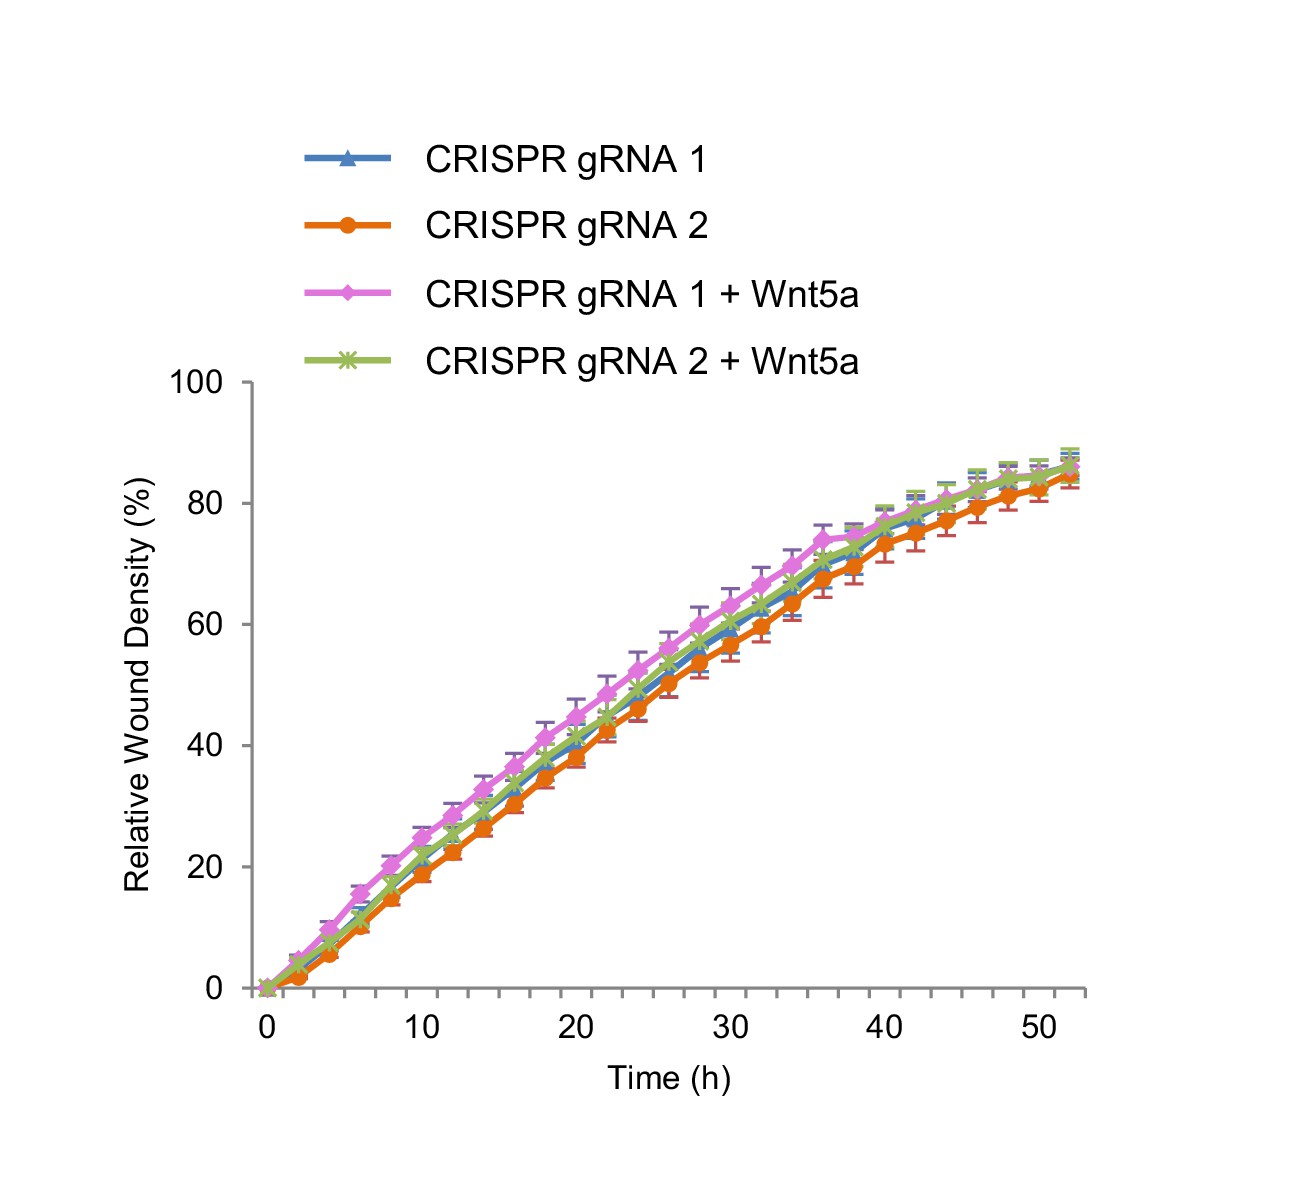
Wnt5a treatment has no effect on the wound closure efficiency of Kif26b knockout NIH/3T3 cells.
Relative wound density of two separate NIH/3T3 cell lines in which Kif26b expression is knocked out using CRISPR/Cas9 genome editing, without or with Wnt5a treatment. Traces of Kif26b knockout cell lines without Wnt5a treatment shown in this figure are the same traces as shown in Figure 5A.
Figure 6

In vivo perturbation of Kif26b expression in zebrafish and mouse embryos induces phenotypes characteristic of Wnt5a-Ror signaling defects.
(A) Representative images showing the effects of Wnt5a and Kif26b mis-expression on zebrafish embryonic tissue morphogenesis. Microinjection of Wnt5a mRNA did not produce any embryos that were scored as ‘normal’, so the image of an uninjected embryo is shown to represent normal embryos. (B) Quantification of the effects of Wnt5a and Kif26b mis-expression on zebrafish embryonic tissue morphogenesis. Images were taken from embryos at 50 hr post fertilization (50 hpf). Data for each experimental condition are pooled from at least three independent injection experiments. (C) Representative images showing immunofluorescence staining of SEAA1 to mark PGCs that have successfully entered the gonads of E11.5 Kif26b+/+ or Kif26b-/- mouse embryos. Scale bar represents 100 μm. (D) Quantification of the numbers of PGCs per gonad in E11.5 Kif26b+/+ or Kif26b-/- mouse embryos. Error bars represent ± SD calculated from independent biological samples (Kif26b+/+, n = 2; Kif26b-/-, n = 4). t-test (unpaired) was determined for Kif26b+/+ vs. Kif26b-/- (p<0.01).
-
Figure 6—source data 1
(Related to panel B) The effects of Wnt5a and Kif26b mis-expression on zebrafish embryonic tissue morphogenesis.
- https://doi.org/10.7554/eLife.26509.026
-
Figure 6—source data 2
(Related to panel D) Quantification of the numbers of PGCs per gonad in E11.5 Kif26b+/+ or Kif26b-/- mouse embryos.
- https://doi.org/10.7554/eLife.26509.027
Figure 7

Model of Wnt5a-Ror-Kif26b signaling.
Schematic of canonical Wnt/β-catenin signaling (A) vs. noncanonical Wnt5a-Ror-Kif26b signaling (B). See the main text for details.
Videos
Video 1
Time-lapse fluorescent confocal microscopy reveals rapid Wnt5a-dependent downregulation of the GFP-Kif26b signal in the NIH/3T3 reporter cell line.
Bright signal reflects GFP-Kif26b fluorescence. Buffer or 0.2 μg/mL recombinant Wnt5a was added at the start of the imaging session. Cells were imaged every 10 min for 16 hr at 40x magnification.
Additional files
-
Supplementary file 1
Phosphopeptides identified and quantified in the TMT/MS3 phosphoproteomic screen.
Columns include: Uniprot protein identification number, gene symbol, protein description/name, phosphosite position, phosphosite motif, localization score, spectral counts, the normalized summed signal to noise for each of the six TMT (126 to 131) channels.
- https://doi.org/10.7554/eLife.26509.029
-
Supplementary file 2
Hits from the TMT/MS3 phosphoproteomic screen.
(A) Upregulated phosphopeptides that scored as ‘hits’ as defined in the text. Phosphopeptides above the bold line are ‘hits’ scored using the 2-fold cutoff filter. Phosphopeptides below the bold line are those scored between the 1.5- and 2-fold cutoffs. Columns include: gene name, protein description, fold change (4-OHT/vehicle treated samples), the p value. (B) Downregulated phosphopeptides that scored as ‘hits’ as defined in the text. Phosphopeptides above the bold line are ‘hits’ scored using the 2-fold cutoff filter. Phosphopeptides below the bold line are those scored between the 1.5- and 2-fold cutoffs. Columns include: gene name, protein description, fold change (4-OHT/vehicle treated samples), the p value.
- https://doi.org/10.7554/eLife.26509.030
-
Transparent reporting form
- https://doi.org/10.7554/eLife.26509.031
Download links
A two-part list of links to download the article, or parts of the article, in various formats.
Downloads (link to download the article as PDF)
Open citations (links to open the citations from this article in various online reference manager services)
Cite this article (links to download the citations from this article in formats compatible with various reference manager tools)
Kinesin superfamily protein Kif26b links Wnt5a-Ror signaling to the control of cell and tissue behaviors in vertebrates
eLife 6:e26509.
https://doi.org/10.7554/eLife.26509


