Bmal1 function in skeletal muscle regulates sleep
- Morehouse School of Medicine, United States
- Walter Reed Army Institute of Research, United States
- University of Florida, United States
- Howard Hughes Medical Institute, University of Texas Southwestern Medical Center, United States
- University of California, Los Angeles, United States
Figures
Figure 1 with 1 supplement

Rescuing Bmal1 in skeletal muscle restores daily non-rapid eye movement (NREM) sleep amount.
24 hr electroencephalographic recordings were conducted in undisturbed mice listed in the legend. The 24 hr pattern of NREM and REM sleep are shown in A. Whole-body knockout of Bmal1 significantly increased NREM sleep when compared to WT controls (B, ANOVA F(2,27)=11.3, p=0.005; p<0.001, posthoc Tukey’s test). Rescuing Bmal1in the brain of knockouts did not restore NREM sleep to WT levels (B, p=0.001 vs. WT; Tukey’s test); however, the effect of Bmal1 knockout was reversed when Bmal1 was rescued in the skeletal muscle (C, ANOVA F(2,31)=9.9, p<0.001; p=0.88 vs. WT, p<0.001 vs. KO, Tukey’s test). No differences were found in REM sleep or NREM slow-wave activity. Knockout animals are replotted in B and C to aid in comparison. KO mice were offspring from independent crosses of heterozygous Bmal1 KO’s. Representative electroencephalographic recordings are displayed in D. Grey boxes indicate the active/dark period. Bars and points represent mean ± s.e.m. *, p<0.05. WT (brain) n = 11, knockout n = 12, muscle rescue n = 5, brain rescue n = 4, WT (muscle) n = 16.
Figure 1—figure supplement 1
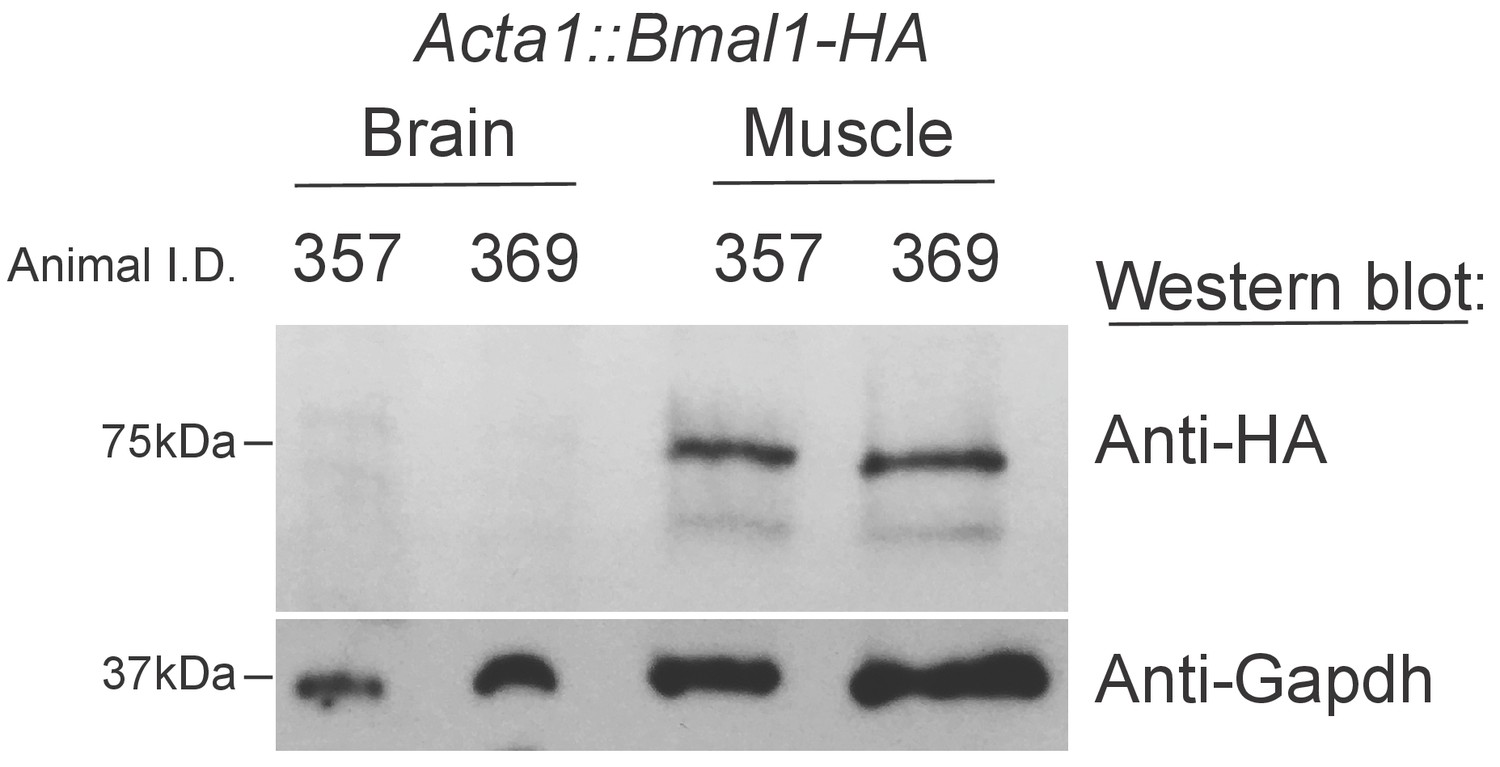
Bmal1-HA is not detectable in the Brains of Acta1::Bmal1-HA mice.
Fifty micrograms of proteins extracted from either an entire brain hemisphere or skeletal muscle (gastrocnemius) were subjected to western blotting with the indicated antibodies.
Figure 2 with 1 supplement
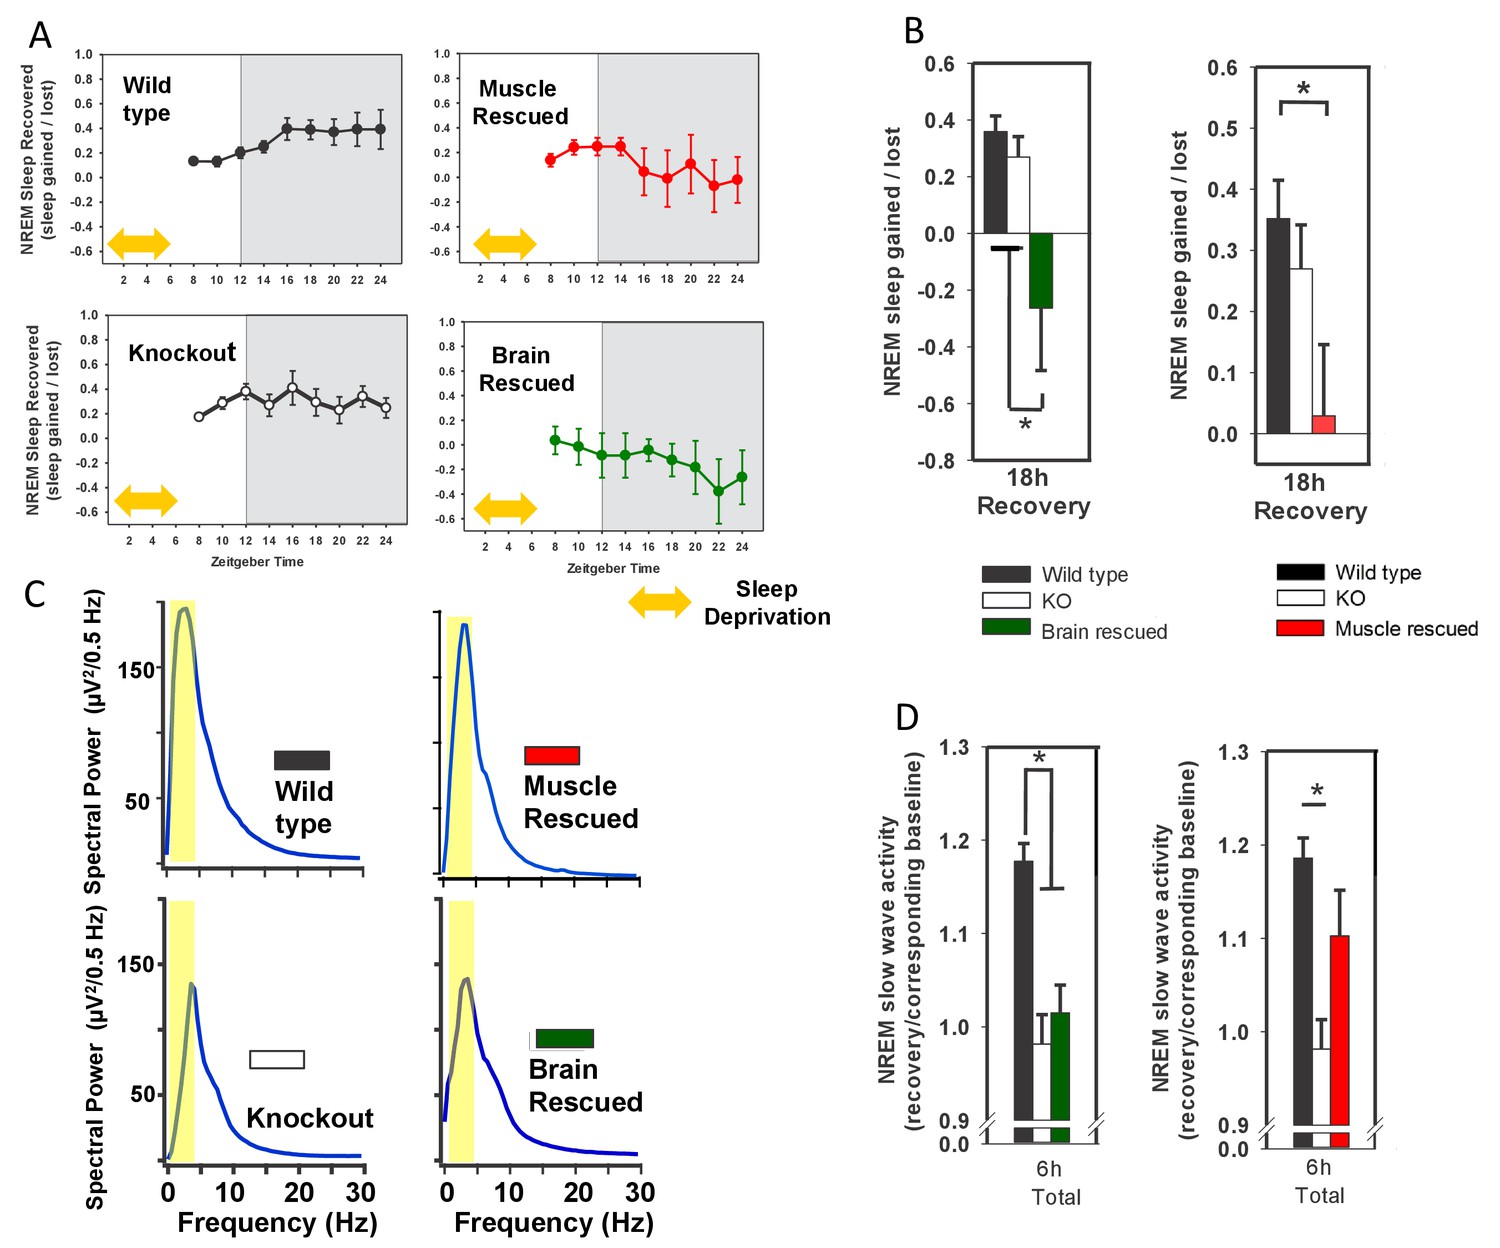
Rescuing Bmal1 in skeletal muscle or brain reduces the amount of NREM sleep recovered after forced wakefulness.
Continuous sleep recordings during 18 hr of recovery sleep were obtained from the mice in Figure 1 after 6 hr of forced wakefulness (A; yellow double arrow = forced wakefulness). The total NREM recovery sleep during this 18 hr period in brain-rescued and muscle-rescued mice was reduced when compared to WT mice (B, ANOVA brain rescued, F(2,28)=6.47, p=0.005, p=0.004 Tukey’s; ANOVA muscle rescued, F(2,30)=5.45, p=0.01 Tukey’s). Values in A and B represent sleep time gained after forced wakefulness (calculated using the corresponding interval during undisturbed sleep) as a percentage of total sleep lost (mean ± s.e.m.). The distribution of EEG power during NREM sleep for representative animals from each genotype is shown in (panel C). Slow wave activity (highlighted area) represents power in the 0.5 to 4 Hz frequency band. NREM slow wave activity was reduced in knockout mice following forced wakefulness—compared to WT mice (D, % change over corresponding baseline; p<0.01, Tukey’s test). This reduction in slow wave activity was absent when Bmal1 was rescued in the skeletal muscle (D). Knockout animals in B and D are replicated between graphs to aid in comparison. *p<0.05.
Figure 2—figure supplement 1
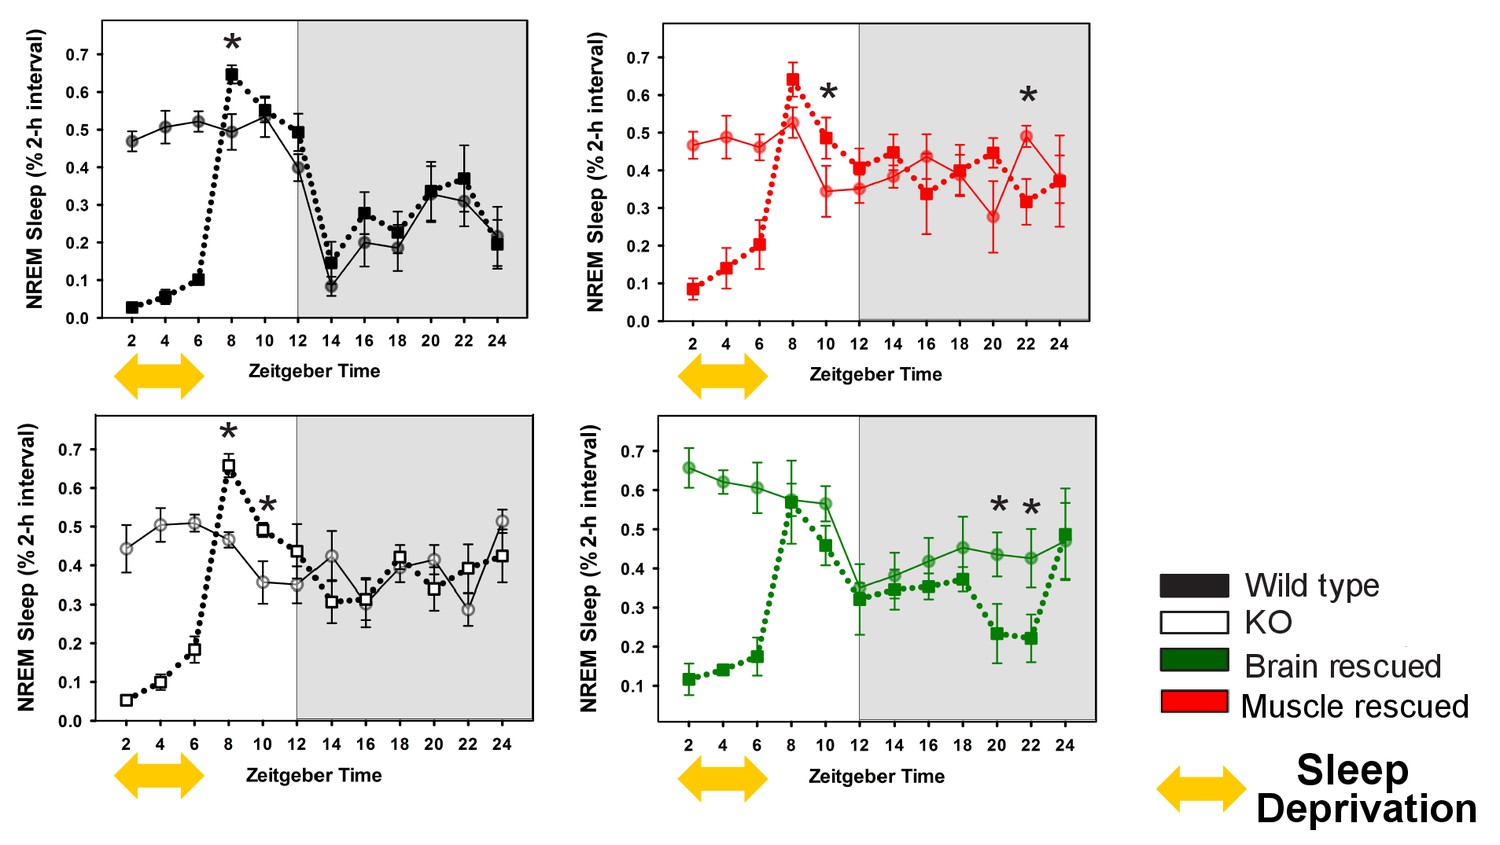
Rescuing Bmal1 in skeletal muscle or brain reduces the amount of NREM sleep recovered after forced wakefulness.
Continuous sleep recordings during 18 hr of recovery sleep were obtained from the mice in Figure 1 after 6 hr of forced wakefulness (squares, dotted line). NREM sleep amount is plotted as a percentage of total sleep for 2 hr bins across 24 h days. Each plot includes baseline sleep (circles, solid line) on the preceding day for comparison. (yellow double arrow = forced wakefulness). Points represent mean ± s.e.m. *p<0.05 Tukey’s. Statistics are not reported for the first 6 hr (sleep deprivation period).
Figure 3 with 1 supplement

Knockout of Bmal1 in skeletal muscle increases NREM sleep amount and confers resistance to sleep loss.
Selective knockout of Bmal1 in skeletal muscle significantly increased NREM sleep, but not REM sleep, when compared to the same animals prior to tamoxifen treatment (A, B; t(10)=2.52, p=0.036). Treatment of floxed mutant control animals with tamoxifen did not significantly alter NREM sleep or REM sleep (C). Following tamoxifen treatment, mice underwent 6 hr of sleep deprivation. Muscle knockout mice also had a significantly altered recovery response to this treatment. Significantly less NREM recovery sleep (t(11)=2.44, p=0.033) and increased NREM slow wave activity (t(11)=2.2, p=0.05) was observed in muscle knockout mice when compared to tamoxifen-treated floxed mutants (D). n = 6 per group; *p<0.05.
Figure 3—figure supplement 1
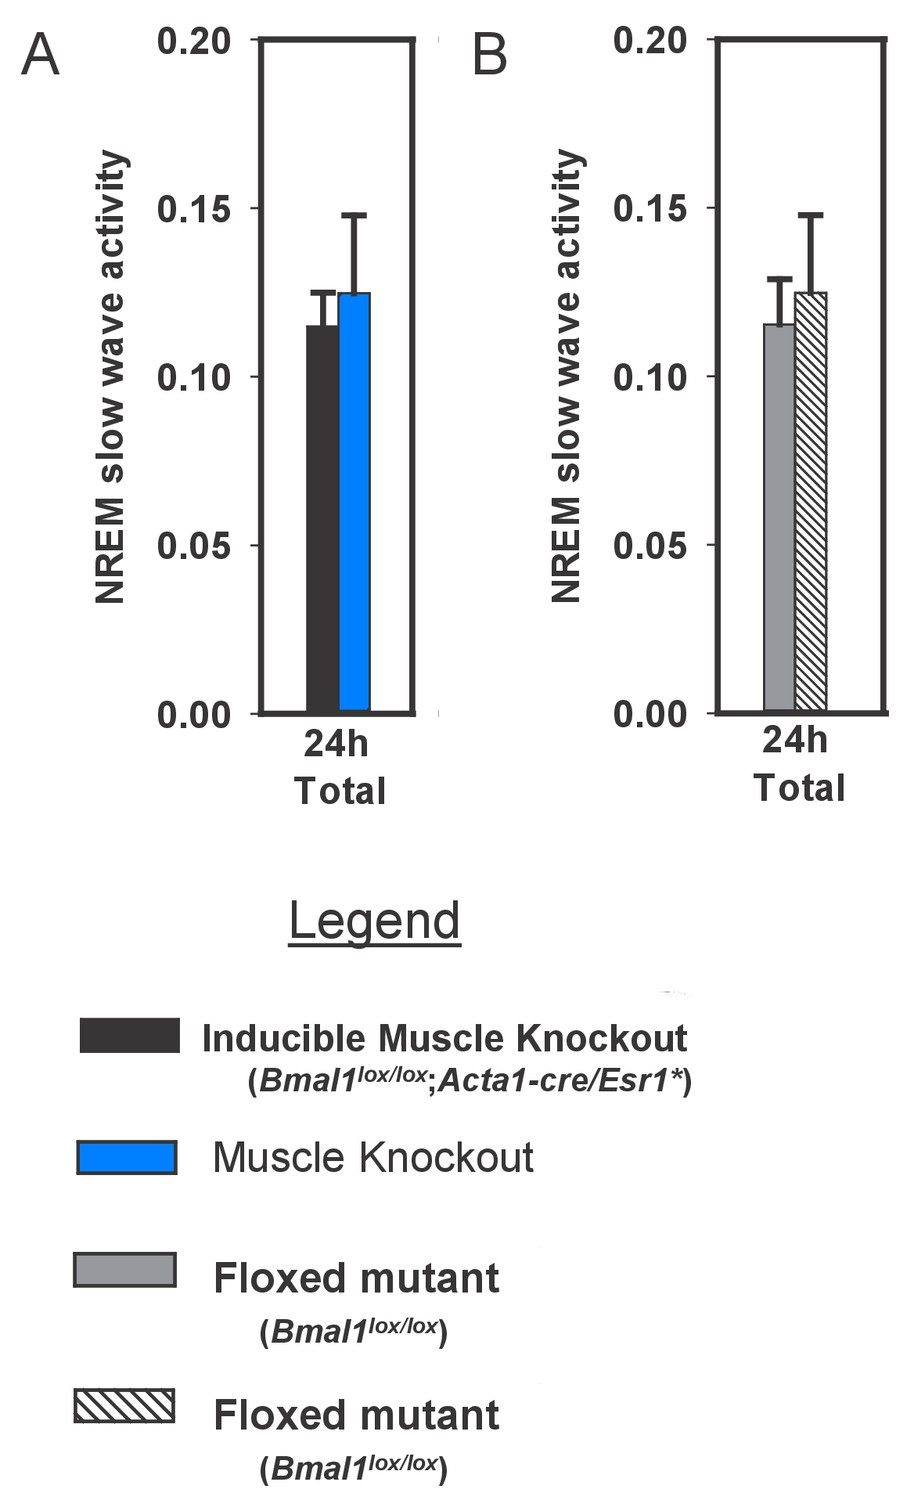
Slow wave activity in inducible muscle knockout mice and controls during undisturbed baseline sleep.
https://doi.org/10.7554/eLife.26557.008
Figure 4 with 3 supplements
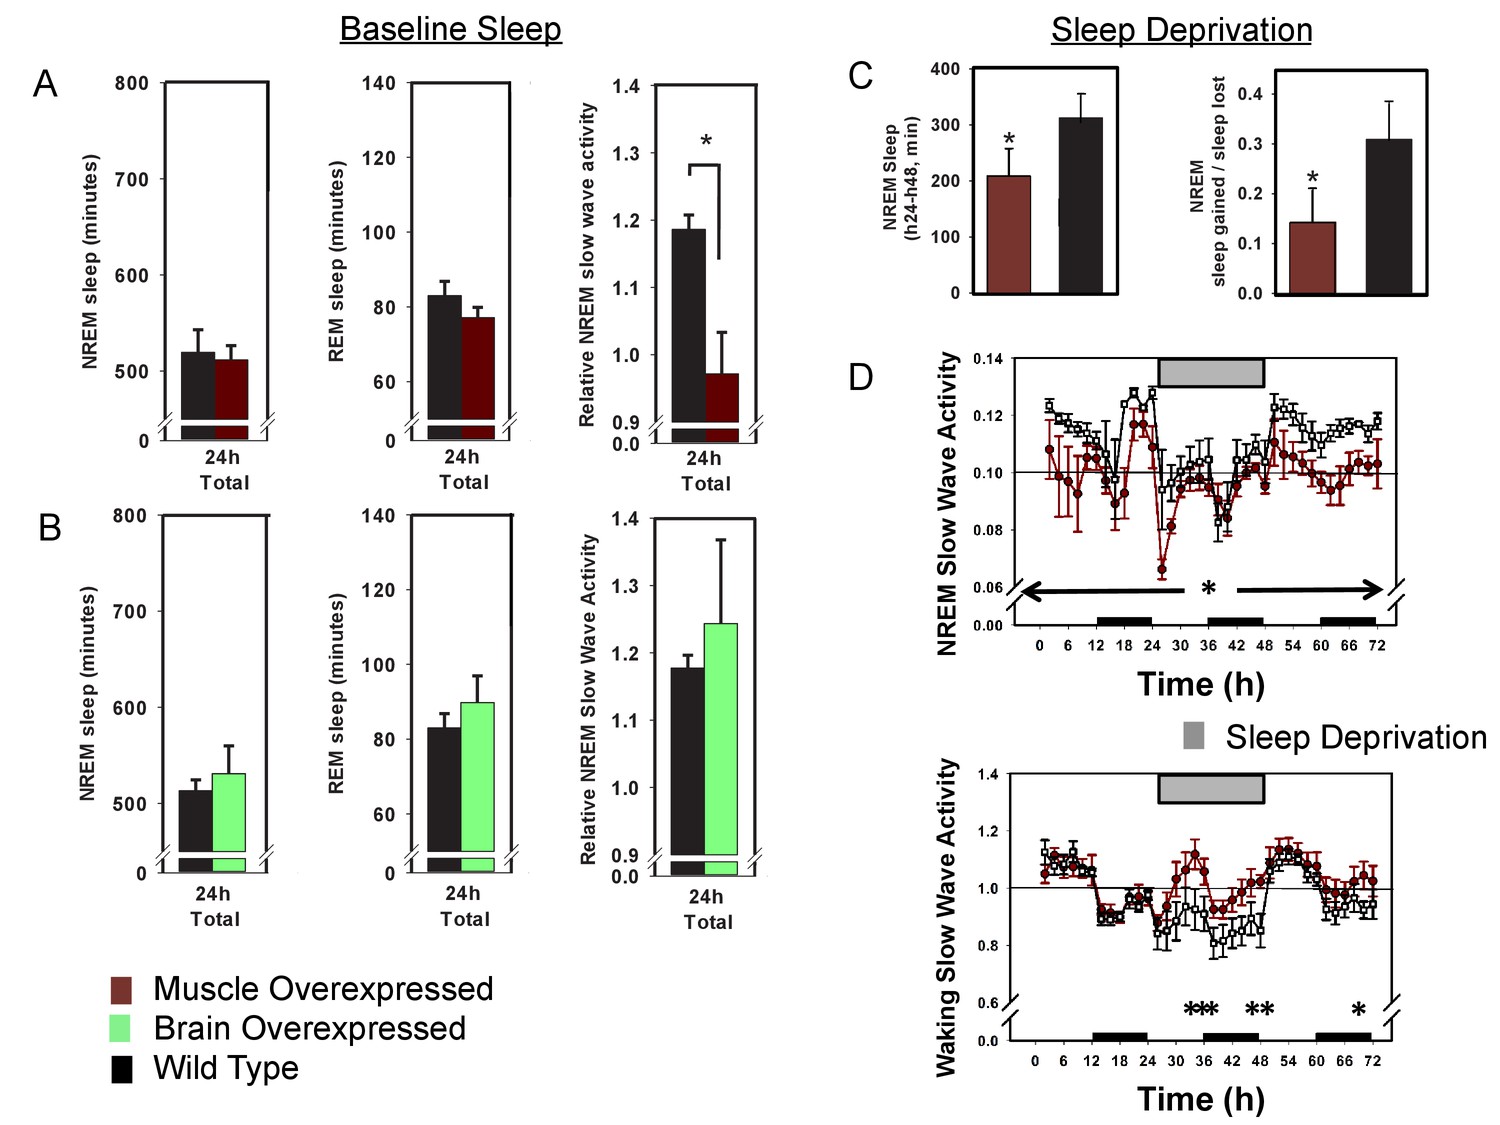
Overexpression of Bmal1 in skeletal muscle confers resistance to sleep loss.
24 hr electroencephalographic recordings were conducted in undisturbed mice overexpressing Bmal1 in skeletal muscle (A) or brain (B). No differences in baseline sleep amount were found, however, NREM slow wave activity was significantly reduced in mice overexpressing Bmal1 in skeletal muscle (A). Overexpression of Bmal1 in skeletal muscle also significantly decreased the NREM-recovery response to one (24 hr) day of forced wakefulness by means of a slowly rotating wheel (C, D). It is not unusual for mice to obtain brief amounts of sleep (i.e. micro-sleep) during such an extended regimen of forced wakefulness. This sleep obtained during forced wakefulness was also significantly lower in mice overexpressing Bmal1 (A, ANOVA main effect of genotype F(1, 96)=10.12, p=0.002, main effect of time F(11, 96)=4.1, p<0.001; B, NREM sleep amount t(8)=1.85, p=0.047, NREM recovery sleep t(8)=1.9, p=0.039). NREM slow wave activity (a standard marker of sleep intensity) was consistently lower in Bmal1 muscle-overexpressed mice throughout the 72 hr protocol (D, repeated-measures ANOVA F(1,8)=6.57, p=0.04). In contrast, during forced wakefulness waking slow-wave activity was significantly increased in Bmal1 muscle-overexpressed mice (D, repeated-measures ANOVA main effect of genotype, F(1,8)=5.7, p=0.045). Grey bars indicate forced wakefulness, black bars indicate darkness (active period). Data presented as mean ± s.e.m, n = 16 muscle overexpression, n = 16 littermate controls (muscle), brain overexpression n = 8, littermate controls (brain) n = 11. *p<0.05.
Figure 4—figure supplement 1
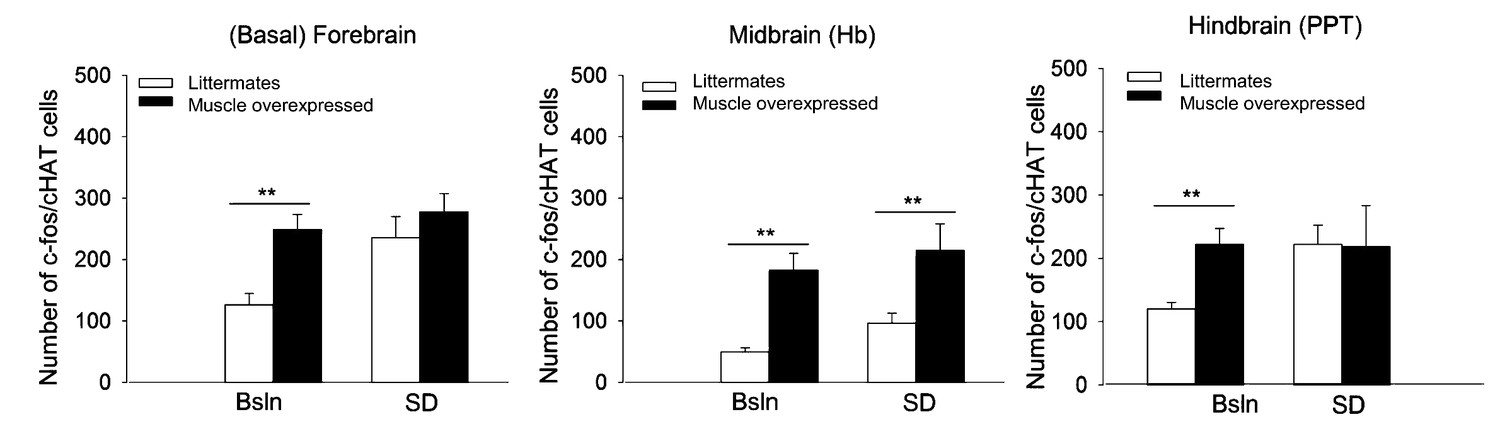
Fos-immunoreactivity (IR) in densely cholinergic areas is increased in Bmal1 muscle-overexpressed mice.
Fos-IR in three brain areas known to be involved in sleep—wake regulation was assessed. Male mice were sacrificed at mid-day by CO2 inhalation in the presence (SD) or absence (Bsln) of 6 hr sleep deprivation. **p<0.05; wild-type n = 5; muscle overexpressed n = 6. Basal forebrain, F1,16=26.6, p<0.001, univariate ANOVA; lateral habenula (Hb), F1,16=75.6, p<0.001; pedunculopontine tegmentum (PPT), F1,16=31.0, p<0.001.
Figure 4—figure supplement 2
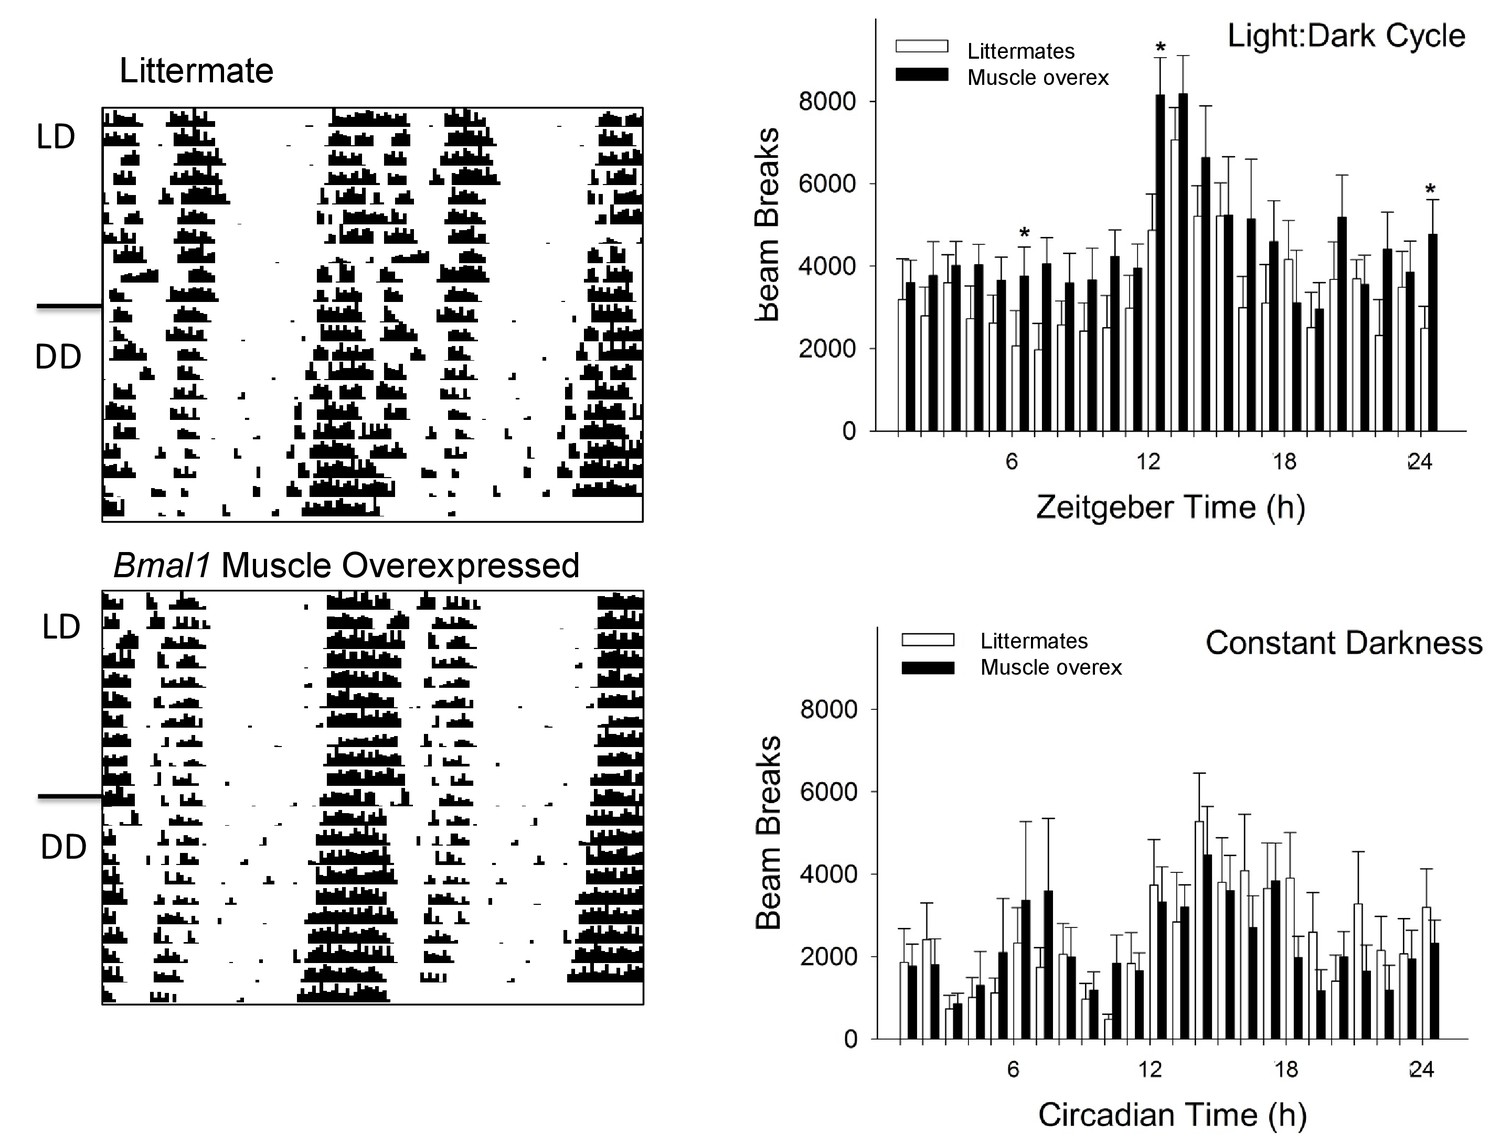
Activity rhythms in Bmal1 muscle-overexpressed mice are modestly increased when compared to wildtype mice.
No differences were found in the circadian rhythm of wheel-running activity between either genotype [Left panel]. Overall locomotor activity measured with infrared sensors revealed increased activity of muscle-overexpressed mice at several time points (n = 7–8/genotype; Right panel). *p<0.05, repeated measures ANOVA [one-way ANOVA, post-hoc]; zeitgeber time 12 = activity onset; LD, light—dark cycle; DD, constant darkness.
Figure 4—figure supplement 3
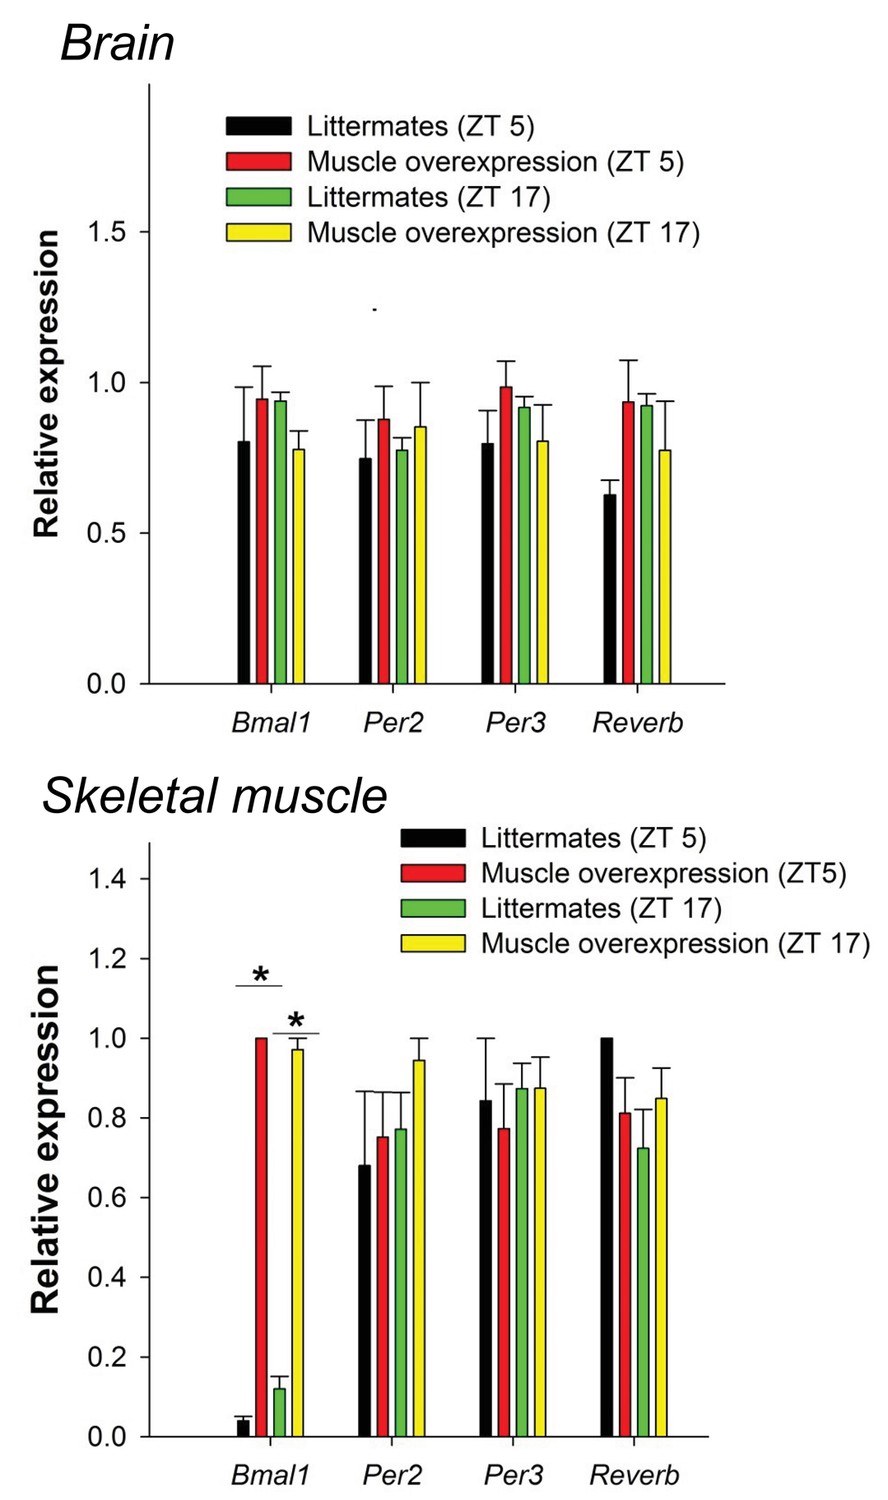
Bmal1 muscle-overexpressed mice do not have not altered levels of CLOCK:BMAL1-target genes in the brain or muscle.
No significant differences in CLOCK:BMAL1-target gene expression between wildtype and muscle-overexpressed mice were found in the hypothalamus at either time point investigated (ZT5 and ZT17). As expected, Bmal1 expression was significantly elevated in the muscle of muscle-overexpressed mice (32.4-fold increase at ZT5 vs. WT; F1,22=15.3, p=0.001, two-way ANOVA; 5.1-fold increase at ZT 17, p=0.003). **p<0.05.
Download links
A two-part list of links to download the article, or parts of the article, in various formats.
Downloads (link to download the article as PDF)
Open citations (links to open the citations from this article in various online reference manager services)
Cite this article (links to download the citations from this article in formats compatible with various reference manager tools)
Bmal1 function in skeletal muscle regulates sleep
eLife 6:e26557.
https://doi.org/10.7554/eLife.26557


