Human embryonic lung epithelial tips are multipotent progenitors that can be expanded in vitro as long-term self-renewing organoids
- Wellcome Trust/CRUK Gurdon Institute, University of Cambridge, United Kingdom
- University of Cambridge, United Kingdom
- European Molecular Biology Laboratory, European Bioinformatics Institute, Wellcome Genome Campus, United Kingdom
- University of Cambridge and Addenbrookes Hospital, United Kingdom
- University College London, United Kingdom
- Wellcome Trust/MRC Stem Cell Institute, United Kingdom
Figures
Figure 1 with 5 supplements
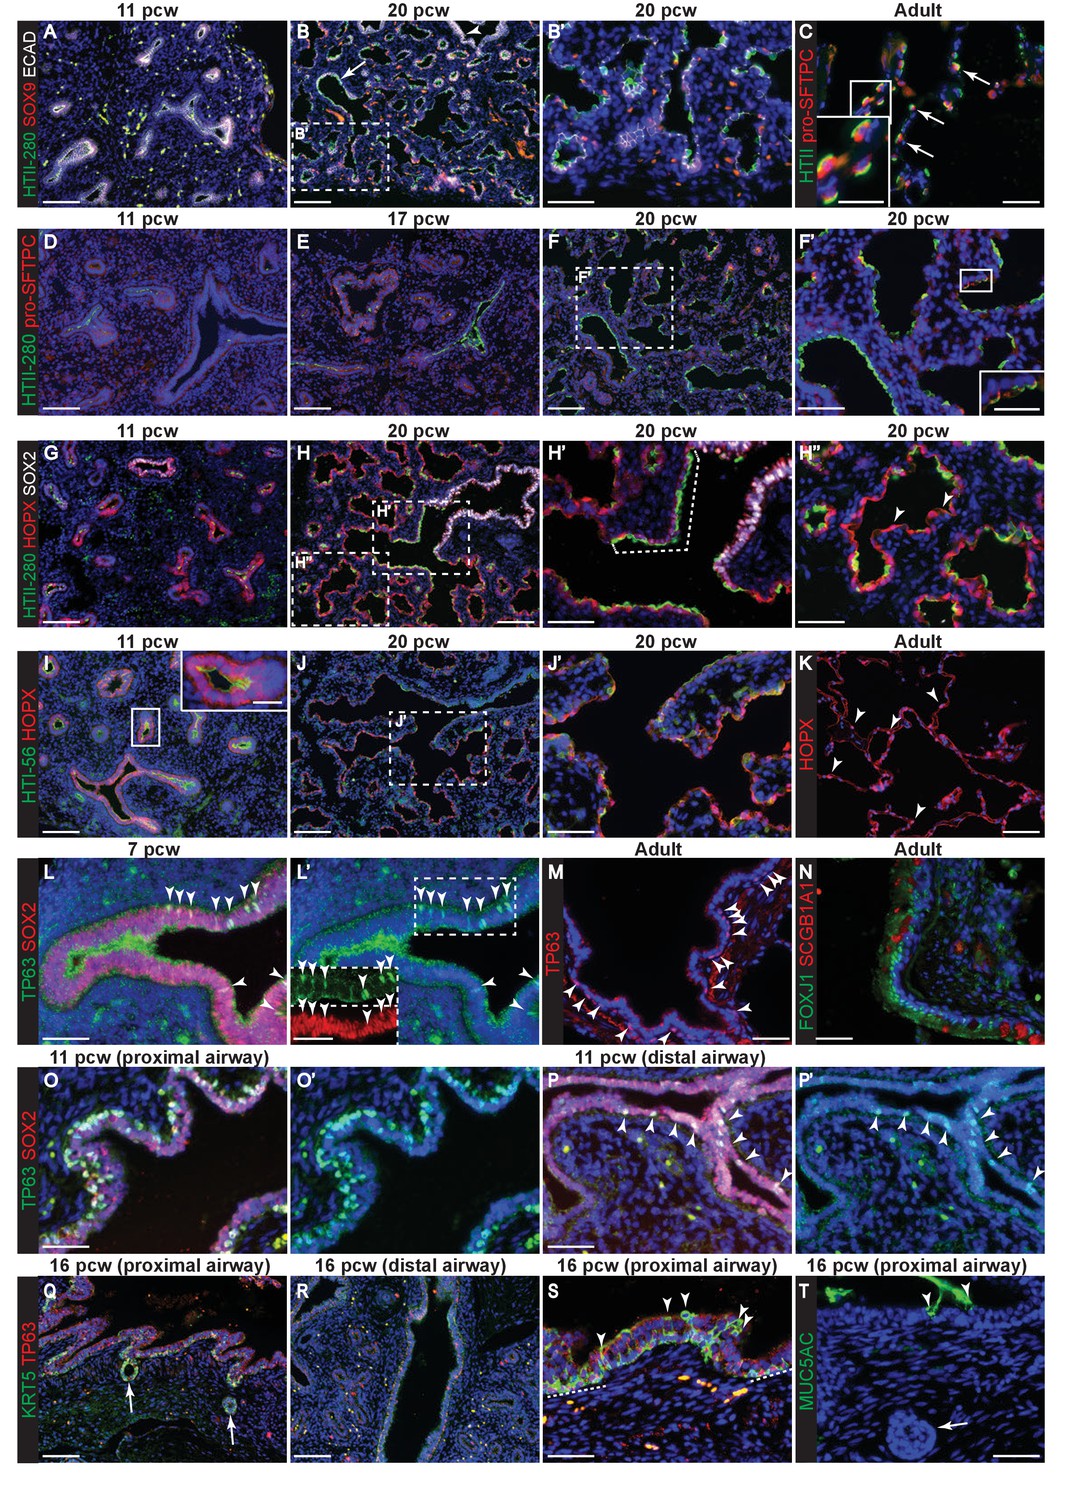
Evolution of alveolar and bronchiolar marker gene expression during human embryonic lung development.
Sections of human embryonic and adult lungs. (A, B) 11 and 20 pcw. Green: HTII-280; red: SOX9 (tips); white: ECAD (epithelial cells). Arrow = HTII-280 positive terminal airway. (C) Adult. Green: HTII-280 (AT2 cells); red: pro-SFTPC (AT2 cells). Arrow = selected AT2 cells. (D–F) 11, 17 and 20 pcw. Green: HTII-280; red: pro-SFTPC. (G–H) 11 and 20 pcw. Green: HTII-280; red: HOPX; white: SOX2 (bronchiolar cells). Dotted bracket = terminal airway cells co-expressing SOX2 and HTII-280. Arrowheads = differentiating AT1 cells. (I, J) 11 and 20 pcw. Green: HTI-56; red: HOPX. K. Adult. Red: HOPX (AT1 cells). Arrowheads = HOPX+ nuclei. (L) 7 pcw. Green: TP63; red: SOX2. Arrowheads = TP63/SOX2 dual-positive cells in the more proximal airway region. Boxed region is shown as an inset in L’ with channels separated. (M) Adult. Red: TP63 (basal cells). Arrowheads = TP63+ cells in an intra-lobar bronchiole. (N) Adult. Green: FOXJ1 (ciliated cells); red: SCGB1A1 (secretory cells). (O, P) 11 pcw proximal and distal airway from the same lung. Green: TP63; red: SOX2. Arrowheads = TP63/SOX2 dual-positive cells in the more distal airway. (Q–S) 16 pcw proximal and distal airway from the same individual. Green: KRT5; red: TP63. Arrows = developing sub-mucosal glands. Arrowheads = KRT5+, TP63- cells. Dashed lines = patches of KRT5+, TP63+ cells. (T) 16 pcw proximal airway. Green: MUC5AC. Arrows = developing sub-mucosal gland. Arrowheads = mucous cells. Blue: DAPI (nuclei). Bars = 100 μm (A,B,D,E,F,G,H,I,J,Q.R); 50 μm (B’,C, F’,H’,H’’,J’,K,L,L’,M,N,O,O’,P,P’,S,T); 25 μm (insets in C,F’,I,L’).
Figure 1—figure supplement 1
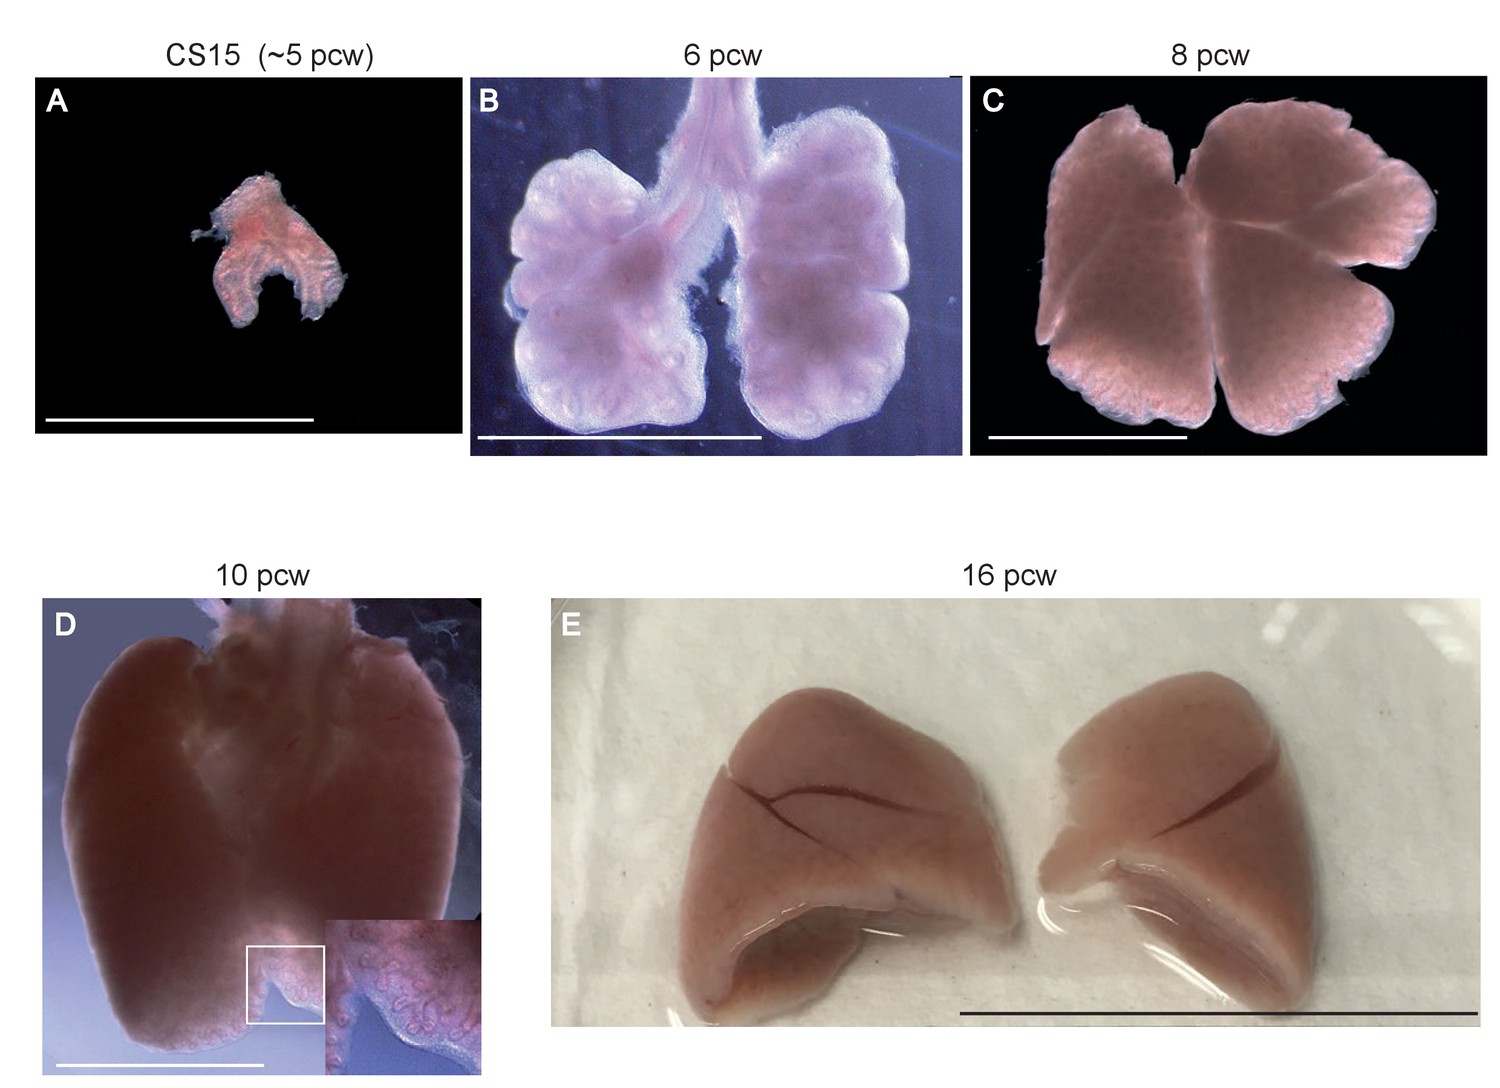
Representative morphology of human embryonic lung samples.
Wholemount images of human embryonic lungs. (A) CS15 (~5 pcw). (B) 6 pcw. (C) 8 pcw. (D) 10 pcw. (E) 16 pcw. Bars = 2.5 mm (A, B); 5 mm (C, D); 3 cm (E).
Figure 1—figure supplement 2
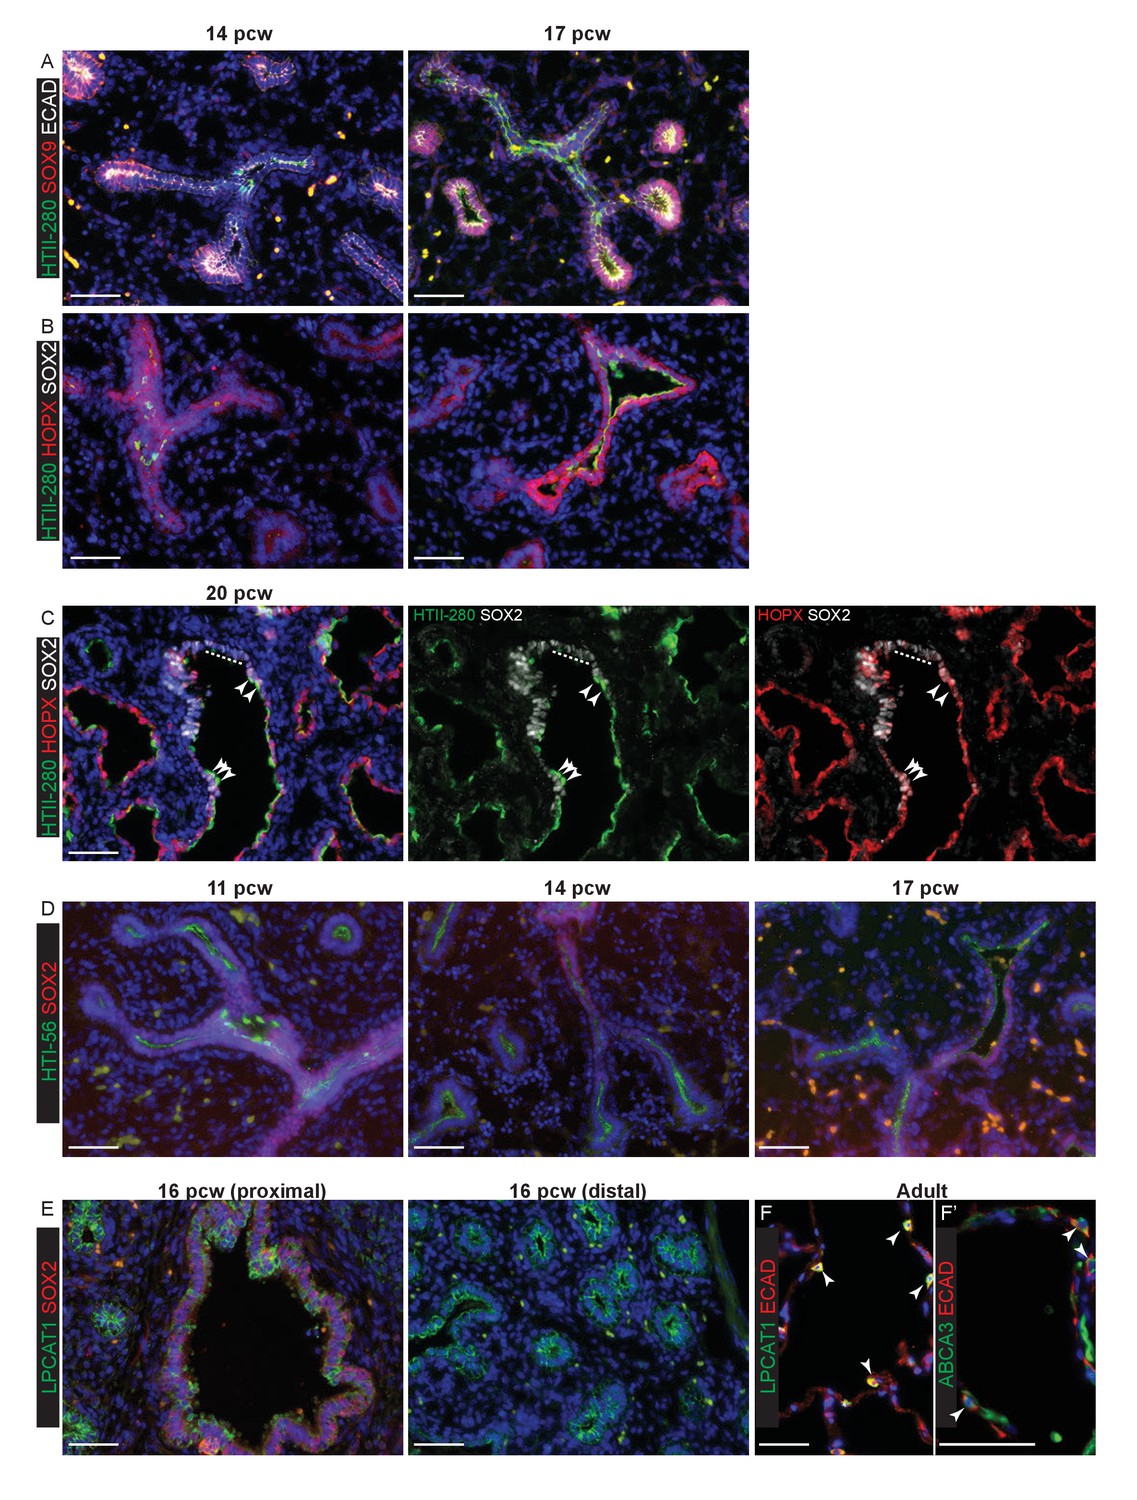
The evolution of alveolar marker gene expression in the human embryonic lung.
Sections of human embryonic and adult lungs. (A) 14 and 17 pcw. Green: HTII; red: SOX9 (tips); white: ECAD (epithelial cells). (B) 14 and 17 pcw. Green: HTII-280; red: HOPX; white: SOX2 (bronchiolar cells). (C) 20 pcw Green: HTII-280; red: HOPX; white: SOX2 (bronchiolar cells). Dotted line indicates SOX2+ cells that do not express the alveolar markers. Arrow heads = triple-positive (SOX2+, HTII-280+, HOPX+) cells. Green/white and red/white channels also shown separately for clarity. (D) 11, 14 and 17 pcw. Green: HTI-56; red: SOX2. (E) 16 pcw. Green: LPCAT1; red: SOX2. (F) Adult. Green: LPCAT1 (AT2 cells); red: ECAD (epithelial cells). (F’) Adult. Green: ABCA3 (AT2 cells); red: ECAD (epithelial cells). Blue: DAPI (nuclei). Bars = 50 μm all panels.
Figure 1—figure supplement 3
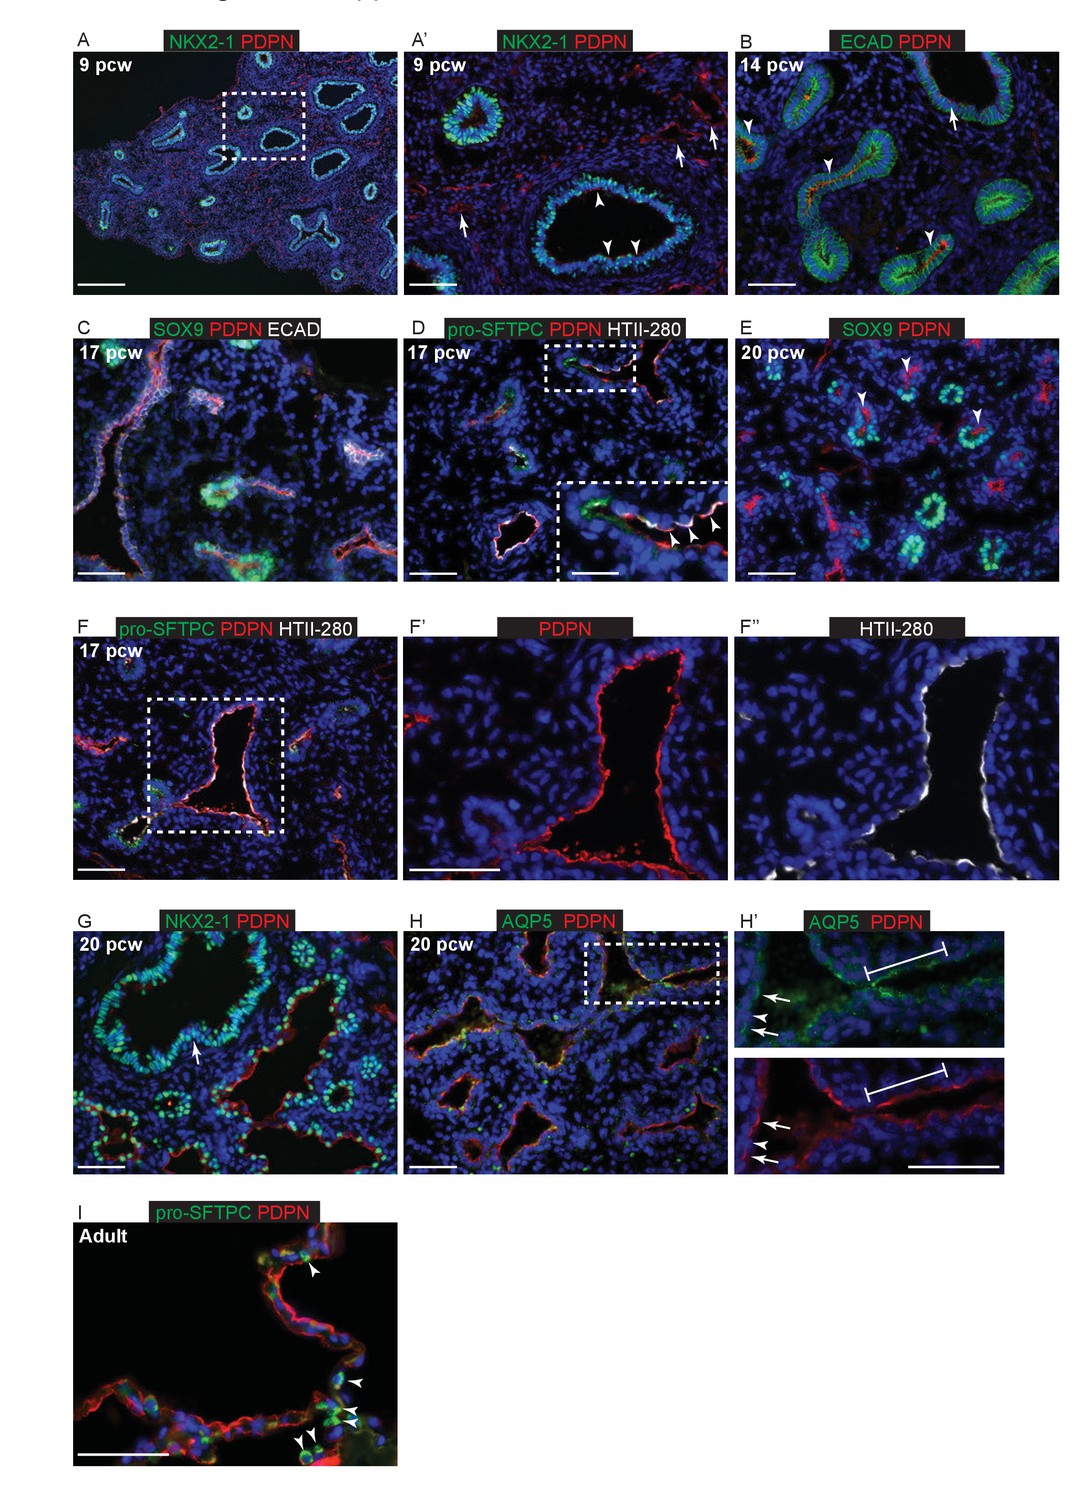
Epithelial PDPN expression is not specific to AT1 cells during human lung development.
Sections of human and adult embryonic lungs. (A, A’) nine pcw. Green: NKX2-1; red: PDPN. Arrowheads = low levels of PDPN in the developing airways. Arrows = PDPN in lymphatic endothelial cells. (B) 14 pcw. Green: ECAD (epithelial cells); red: PDPN. Arrowheads = PDPN is stronger in the more distal epithelium than the developing airways (arrow). (C) 17 pcw. Green: SOX9 (epithelial tips); red: PDPN; white: ECAD (epithelial cells). Low levels of PDPN can be seen in the tips, likely due to the angle of the section. (D) 17 pcw. Green: pro-SFTPC; red: PDPN; white: HTII-280. Arrowheads = PDPN and HTII-280 are largely co-expressed in cells that have already exited the tips. (E) 20 pcw. Green: SOX9 (epithelial tips); red: PDPN. Arrowheads = PDPN is observed in cells that have exited the epithelial tips. (F) 17 pcw. Green: pro-SFTPC; red: PDPN; white: HTII-280. The majority of cells lining the developing alveolar sacs are PDPN+, HTII-280+ dual-positive, although levels of each protein vary (seen clearly in F’ and F’’). (G) 20 pcw. Green: NKX2-1; red: PDPN. Epithelial cells lining the alveolar sacs are mostly PDPN+, low levels of PDPN are still observed in the developing bronchioles (arrow). (H, H’) 20 pcw. Green: AQP5; red: PDPN. Line = rows of continuous epithelial cells lining parts of the developing alveolar sacs are AQP5+, PDPN+ dual-positive. Arrows = distinct, individual, cells are AQP5+, PDPN+ dual-positive and express a higher level of AQP5 (likely developing AT1 cells). Arrowhead = individual cells that are AQP5-, PDPN- dual-negative (likely developing AT2 cells) can also be distinguished. (I) Adult lung. Green: pro-SFTPC; red: PDPN. Arrowheads = adult AT2 cells are pro-SFTPC+ and PDPN-. All panels: blue = DAPI (nuclei). Bars = 200 μm A; 50 μm B, C, D, E, F, F’, F’’, G, H, H’’, I; 25 μm inset in D.
Figure 1—figure supplement 4
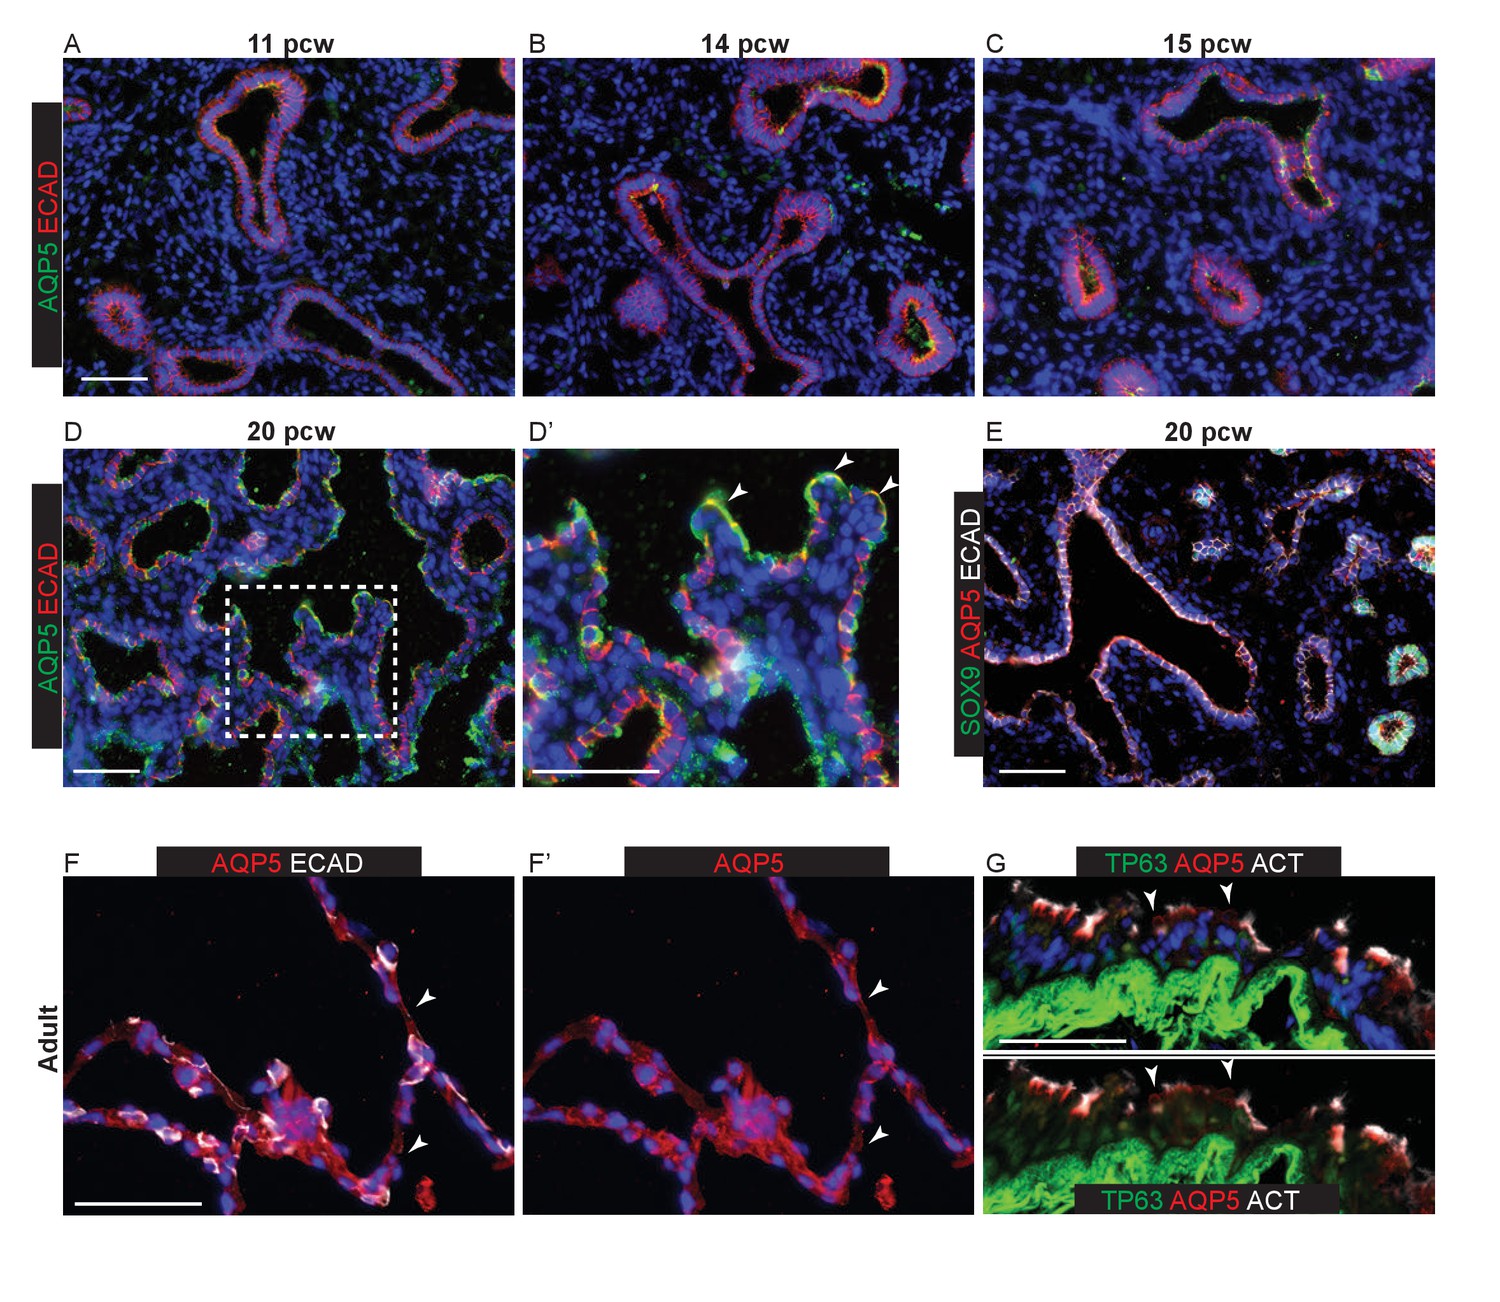
Epithelial AQP5 expression is not specific to AT1 cells during human lung development.
Sections of human and adult embryonic lungs. (A–D) 11, 14, 15 and 20 pcw. Green: AQP5; red: ECAD (epithelial cells). Patches of diffuse, apical AQP5 staining can be observed from 11 pcw. Arrowheads = elongated cells with more intense AQP5 staining observed from 20 pcw. However, AQP5 expression is widespread and also observed in cells with a more columnar epithelial appearance (arrows). (E) 20 pcw. Green: SOX9 (epithelial tips); red: AQP5; white: ECAD (epithelium). AQP5 extends to the epithelial tips. (F) Adult alveolar region. Red: AQP5; white ECAD (epithelial cells). Arrowheads = AT1 staining. (G) Adult terminal bronchiole. Green: TP63 (basal cells); red: AQP5; white: ACT (ciliated cells). Arrowheads = AQP5+ secretory cells. All panels: blue = DAPI (nuclei). Bars = 50 μm all panels.
Figure 1—figure supplement 5
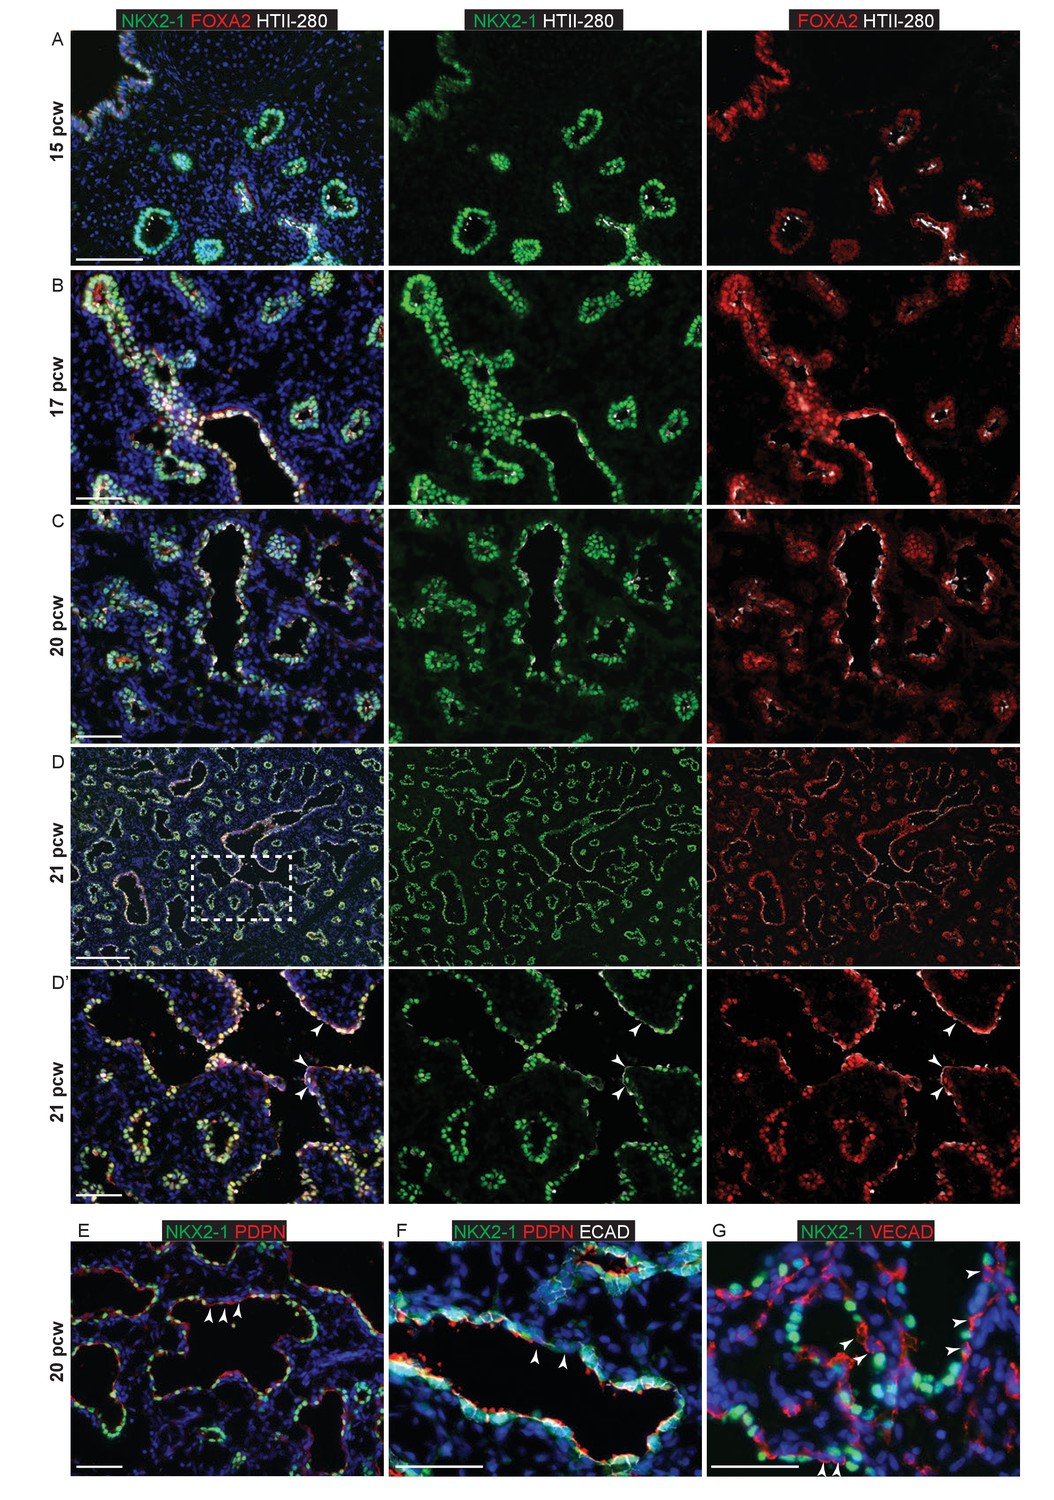
NKX2-1 and FOXA2 are expressed in all human lung epithelial cells up to 20 pcw.
Sections of human embryonic lungs. (A–D). 15, 17, 20 and 21 pcw. Green: NKX2-1; red: FOXA2; white: HTII-280. Arrowheads in D’ = NKX2-1- cells apparently lining the developing alveolar sacs. E-G. 20 pcw. (E) Green: NKX2-1; red: PDPN. Arrowheads = apparently PDPN+, NKX2-1- cells lining the developing alveolar sacs. (F) Green: NKX2-1; red: PDPN; white: ECAD (epithelial cells). Arrowheads = NKX2-1- cells are also ECAD- and therefore not epithelial. (G) Green: NKX2-1; red: VECAD (vascular endothelium). Mesenchymal cells can appear to line the alveolar sacs in thin sections. Arrowheads = NKX2-1-, VECAD+ endothelial cells apparently lining the developing alveolar sacs. All panels: blue = DAPI (nuclei). Bars = 100 μm A; 50 μm B, C, D’, E, F, G; 200 μm D.
Figure 2 with 5 supplements

The tip and stalk epithelial cell populations are clearly demarcated in branching human, pseudoglandular stage, lungs.
(A–E) Sections of human embryonic lungs. (A) 11 pcw. Green: SOX9 (tip); red: SOX2 (stalk); white: α-SMA (smooth muscle). (B) 8 pcw. Green: SOX9 (tip); red: SOX2 (stalk); white: KI67 (proliferating cells). (C, D) 17 pcw. (E) 20 pcw. Green: SOX9 (tip); red: SOX2 (stalk). Arrowheads = SOX9+, SOX2- co-expressing tips. Arrows = SOX9+, SOX2- tips. Blue: DAPI (nuclei). (F) Experimental schematic for tip versus stalk RNAseq. (G) Venn diagram showing common and differentially-expressed transcripts based on a fold-change of at least 2. (H) Unsupervised hierarchical clustering of tip, stalk and published foetal lungs based on the differentially-expressed genes. (I) Chart to show the percentage of the gene ontology classes represented in the differential expression data. (J) List of transcription factors enriched at least two-fold in the tips. Number in brackets indicates fold-change over the stalk. * indicates reported mouse tip expression, see Supplementary file 2. (K) List of differentiation markers enriched in the stalk. (L) List of transcription factors enriched in stalks that were previously reported as expressed in the mesenchyme . Scale bars = 50 μm (A, C, D); 100 μm (B, E); 2 mm (F).
Figure 2—figure supplement 1
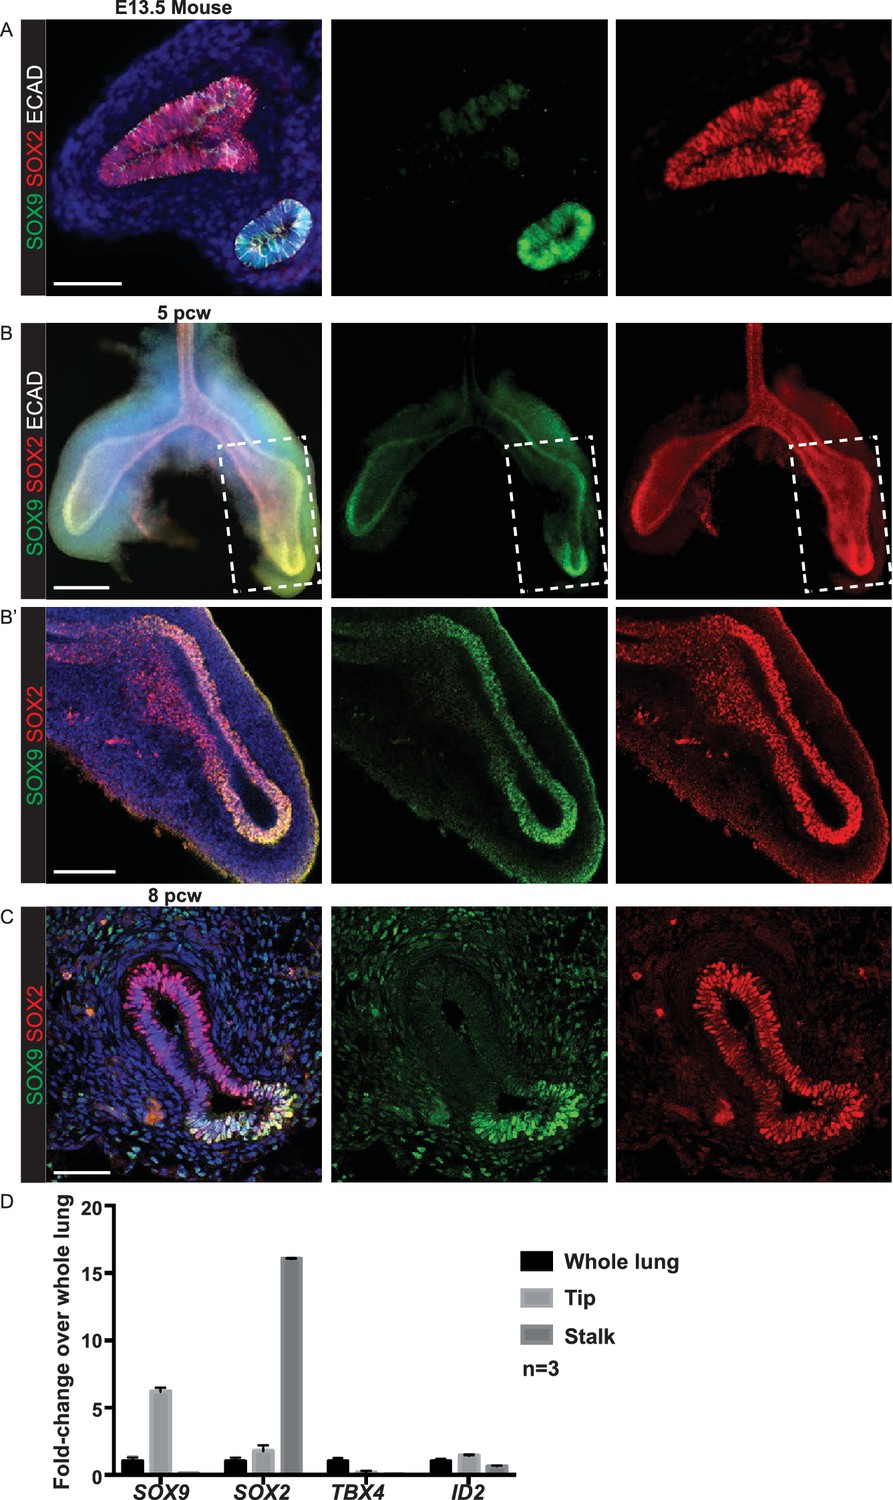
Pseudoglandular stage human lung tips co-express SOX9 and SOX2.
(A) E13.5 mouse lung staining illustrating absence of SOX2 in SOX9+ tip cells. Green: SOX9; red: SOX2; white: ECAD. (B) Whole-mount staining of a 5 pcw human embryonic lung showing the primary branches and SOX2/SOX9 co-expression in the tips (boxed area in B is magnified in B’). Green: SOX9; red: SOX2; white: ECAD. (C) Confocal image of a 8 pcw human embryonic lung illustrating SOX2 expression in SOX9+ tip cells. Green: SOX9; red: SOX2. (D) qRT-PCR of microdissected tip and stalk compared to whole lung: SOX9 and SOX2 data confirm immunostainings. TBX4 is a mesenchymal marker. ID2 is another well-characterised mouse tip gene. Scale bars = 50 μm (A, C); 200 μm (B); 100 μm (B’).
Figure 2—figure supplement 2
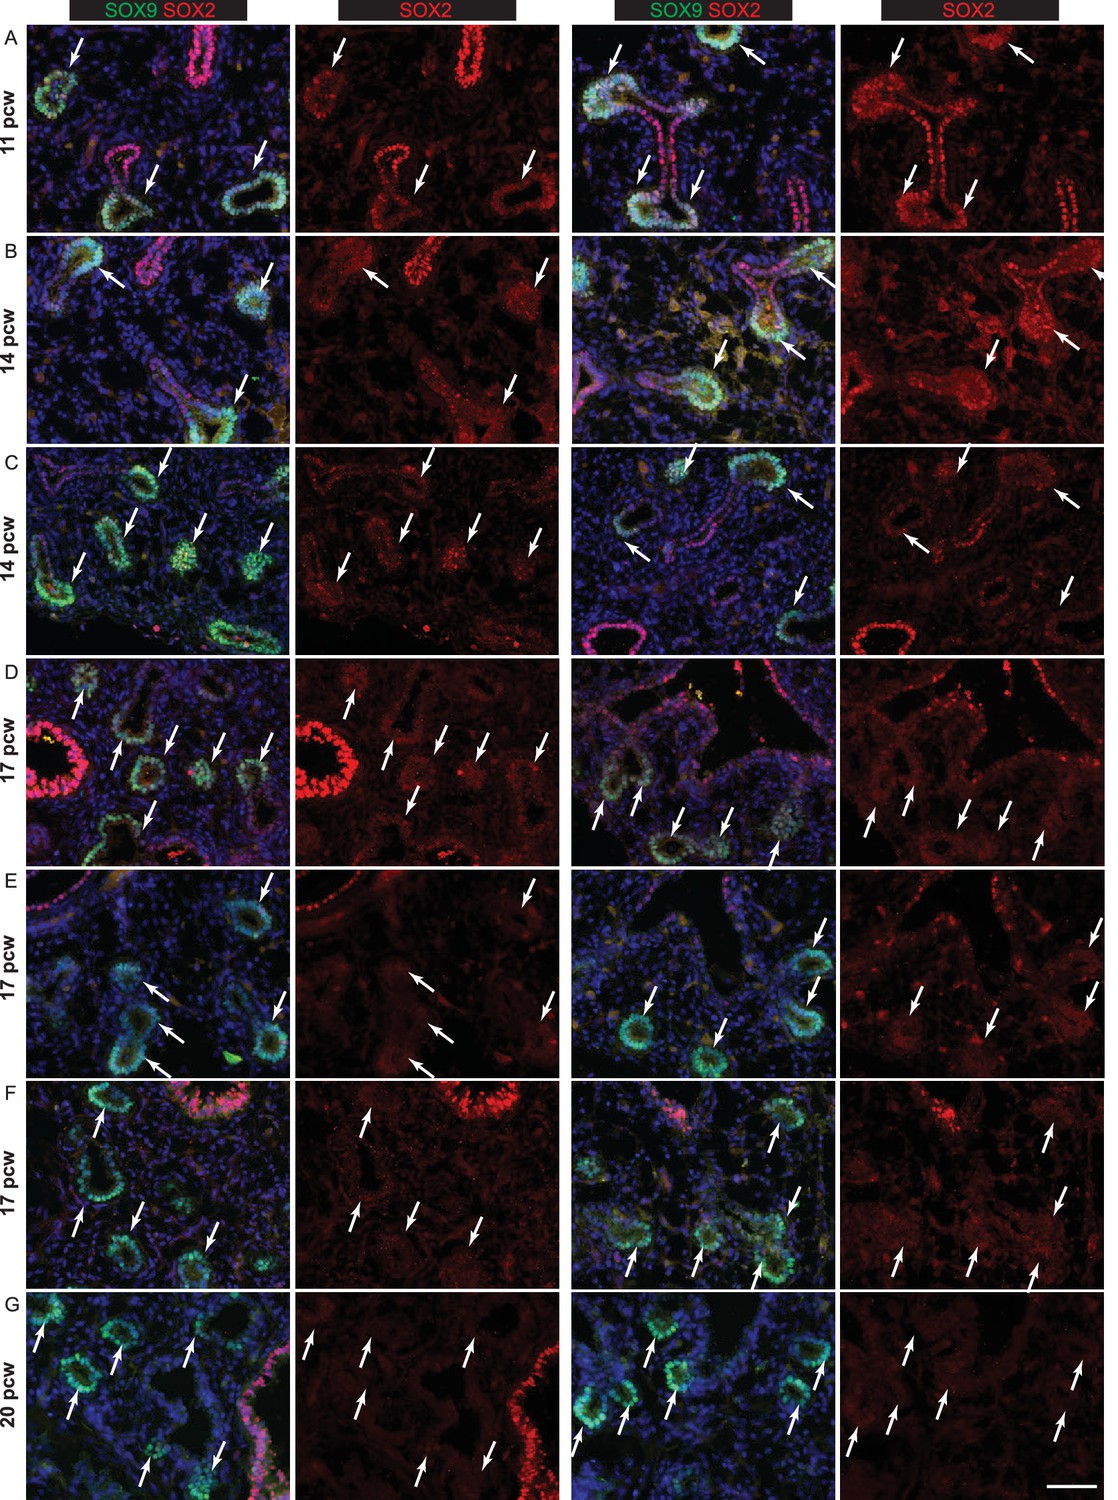
Human lung tips down-regulate SOX2 during the canalicular stage.
(A–G) Sections of human embryonic lungs at 11, 14, 17 and 20 pcw stained for green: SOX9; red: SOX2. Slides were stained simultaneously and imaged using the same microscope settings such that protein levels can be compared between lungs. Each row shows representative images from a different individual lung. SOX2 is also shown as a separate channel. SOX2 is significantly down-regulated in the epithelial tips by 17 pcw, although still present in some tips. It is absent in the tips by 20pcw. Arrows indicate SOX9+ tips. (A) 11 pcw. (B, C) 14 pcw. (D–F) 17 pcw. G. 20 pcw. Blue = DAPI (nuclei). Bar = 50 μm in all panels.
Figure 2—figure supplement 3
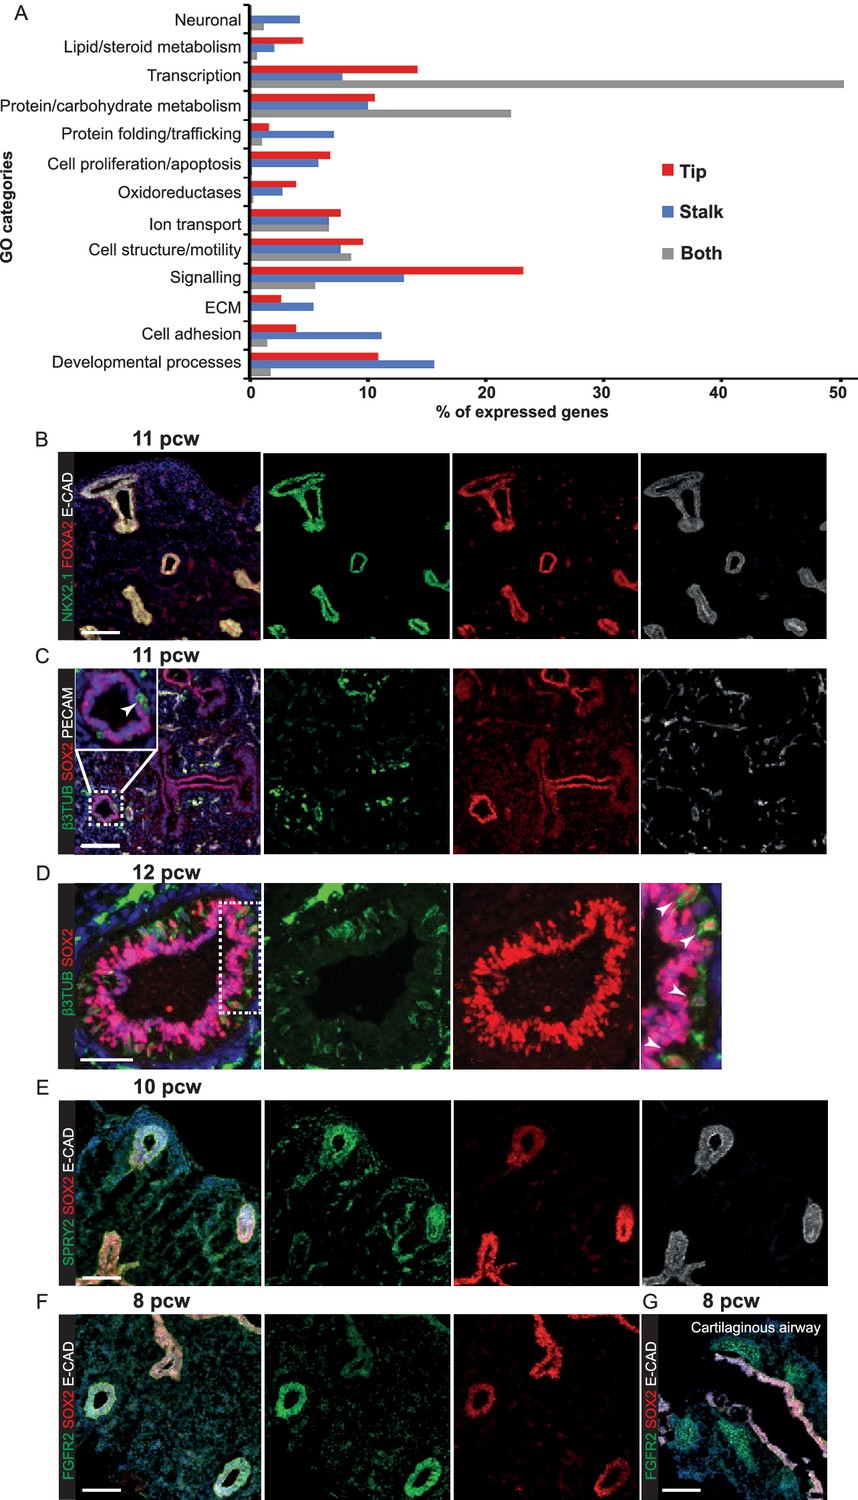
Transcriptional differences and similarities between human pseudoglandular stage tip and stalk populations.
(A) Chart to show the percentage of the expressed genes in the major gene ontology classes represented in the data. (Note: tip and stalk data are reproduced from Figure 2I). (B–E) Human embryonic lung sections. (B) 11 pcw. Green: NKX2.1 (lung epithelium); red: FOXA2 (lung epithelium); white: ECAD (epithelial cells). (C) 11 pcw. Green: β-III-Tubulin (differentiating neurons, including neuroendocrine cells); red: SOX2; white: PECAM (endothelial cells). (D) 12 pcw. Green: β-III-Tubulin (differentiating neurons, including neuroendocrine cells); red: SOX2. Arrowheads = β-III-Tubulin+, SOX2+ neuroendocrine cells. (E) 10 pcw. Green: SPRY2; red: SOX2; white: ECAD (epithelial cells). (F, G) 8 pcw. Green: FGFR2; red: SOX2; white: ECAD (epithelial cells). Scale bars = 100 μm (A, B, C, E, F, G); 50 μm (D).
Figure 2—figure supplement 4
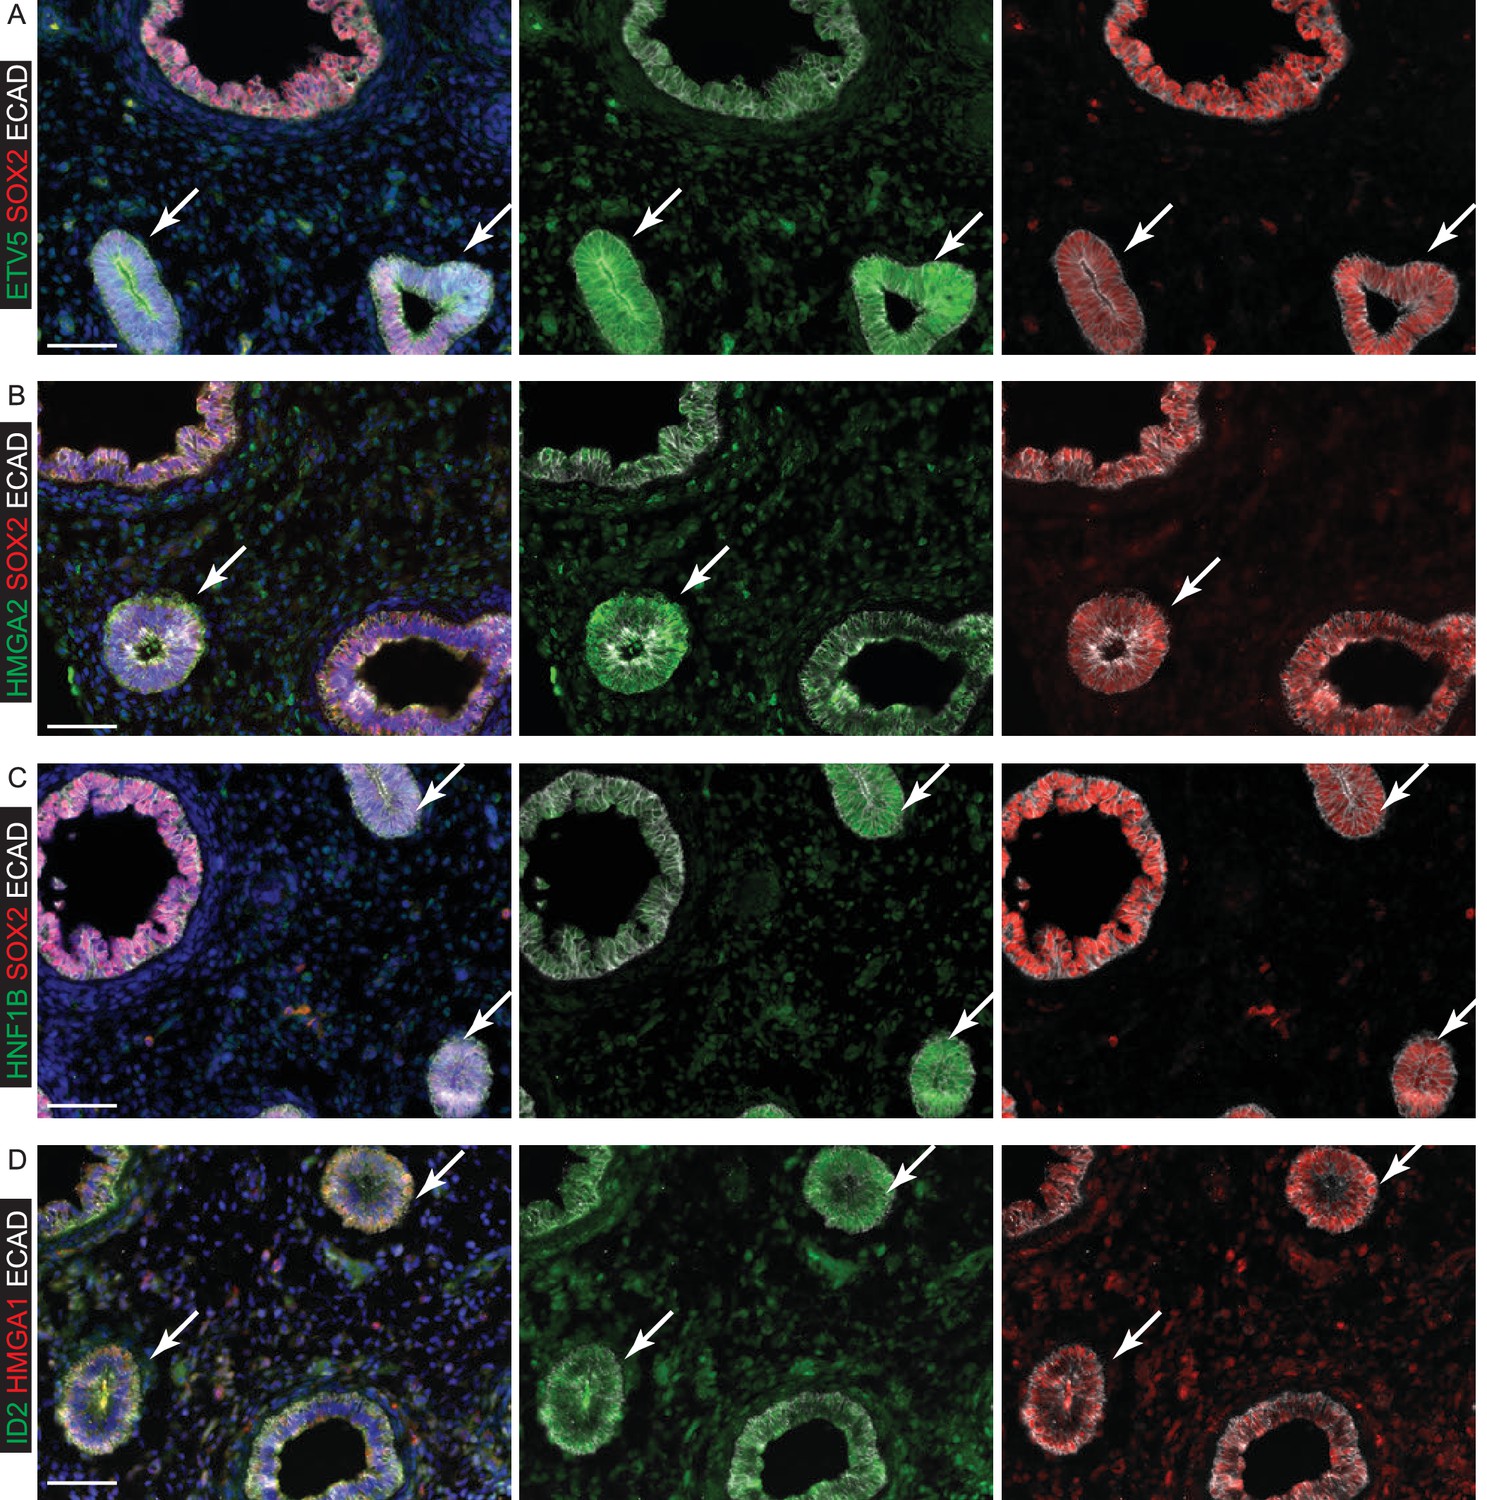
Specific transcription factors are enriched at the protein level in human distal epithelial lung tips.
(A–D) Sections of 8 pcw human embryonic lung. (A) Green: ETV5; red: SOX2; white: ECAD (epithelial cells). (B) Green: HMGA2; red: SOX2; white: ECAD (epithelial cells). (C) Green: HNF1B; red: SOX2; white: ECAD (epithelial cells). (D) Green: ID2; red: HMGA1; white: ECAD (epithelial cells). Arrows = distal tips. Blue = DAPI (nuclei). Bars = 50 μm all panels.
Figure 2—figure supplement 5
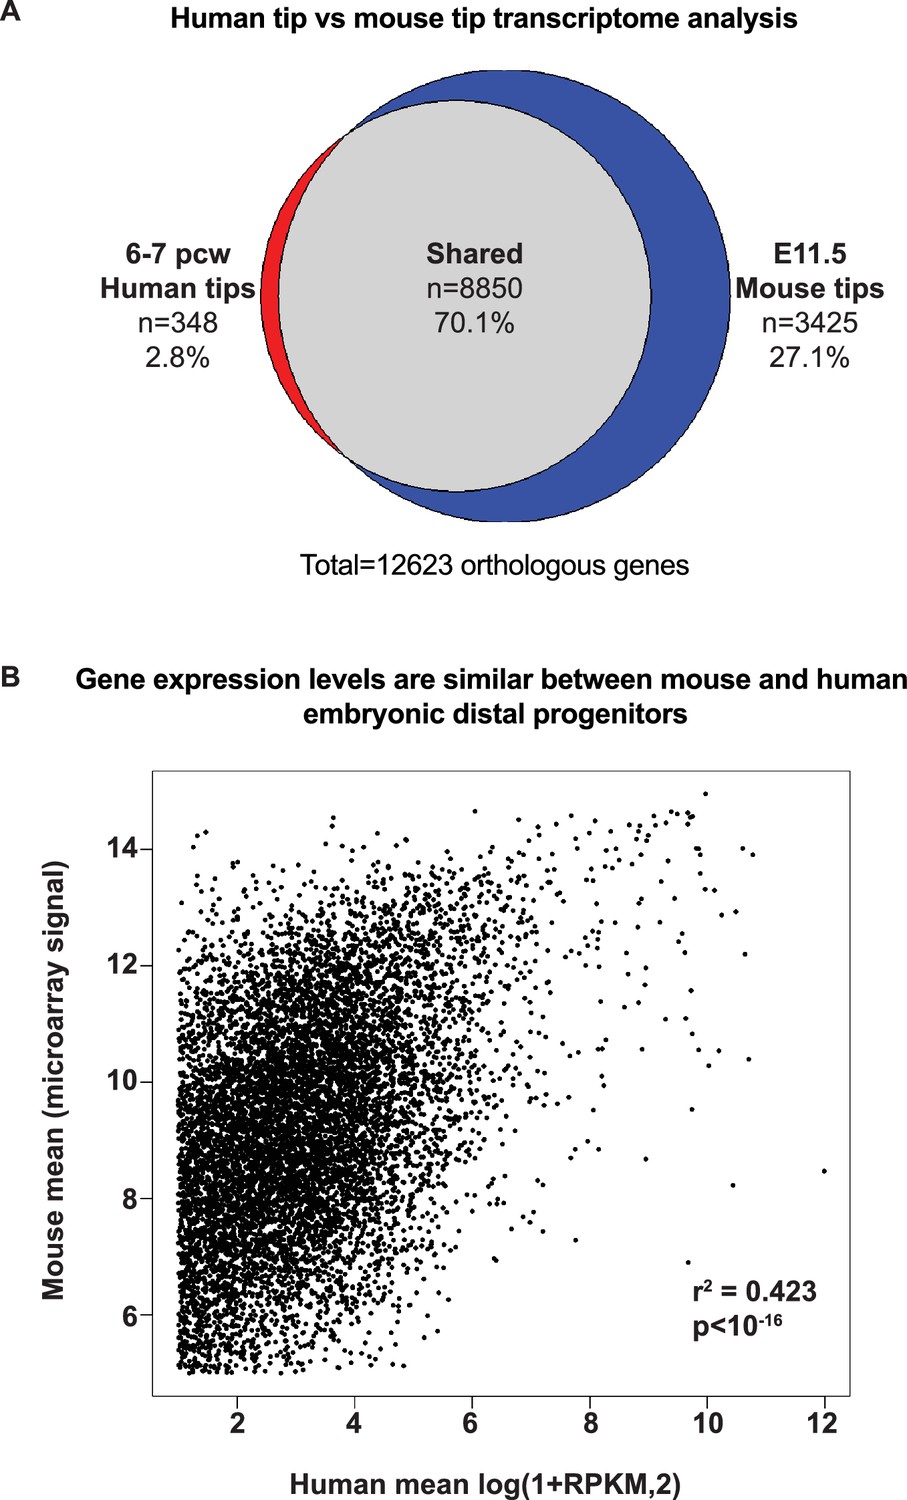
Tip gene expression is highly conserved between mouse and human.
(A) Pie chart showing over-lap of orthologous human-mouse genes called as present in 6–7 pcw human tips and E11.5 mouse tips. (B) Scatter plot to estimate the relative levels of expression of orthologous genes between mouse and human tips. We reasoned that the microarray signal saturates and therefore generated a scatter plot of mean microarray signal, versus mean log-transformed RPKM for each orthologous gene identified. r2 = 0.423; p<10−16.
Figure 3 with 5 supplements
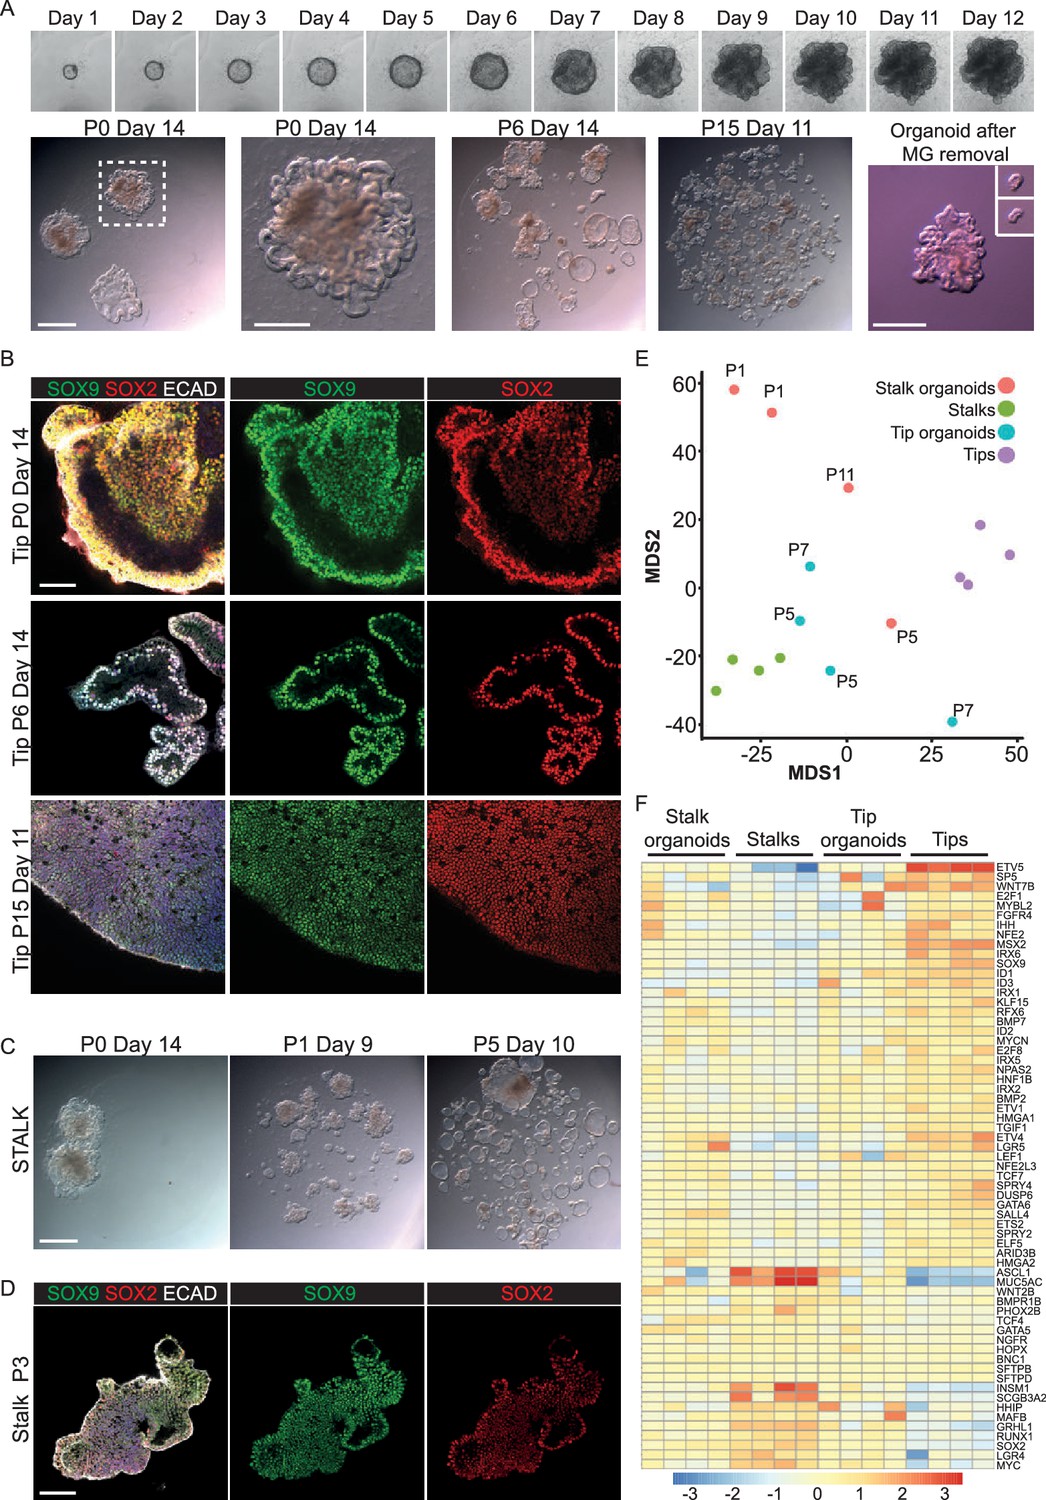
Long-term, self-renewing organoid culture of human lung epithelial tip cells with a initial colony forming efficiency of 100%.
(A) Frames from Video 1 showing bright field images of a single microdissected tip taken every 24 hr for 12 days. Representative bright field images of tip organoid cultures from P0, P6 and P15. A typical organoid after matrigel removal is shown and after further microdissection of branched structures (inset). (B) Confocal images of tip organoids at P0, P6 and P15. Green: SOX9; red: SOX2; white: ECAD. (C) Bright field images of stalk organoids cultured in self-renewing medium at P0, P1, P5. (D) Confocal images of stalk organoids at P3. Green: SOX9; red: SOX2; white: ECAD. (E) Multidimensional scaling plot showing the distribution of fresh tip and stalk transcriptomes and cultured organoids. (F) Heat map of selected tip, stalk and differentiation markers. Bars = 1 mm (A, C); 50 μm (B, D).
Figure 3—figure supplement 1
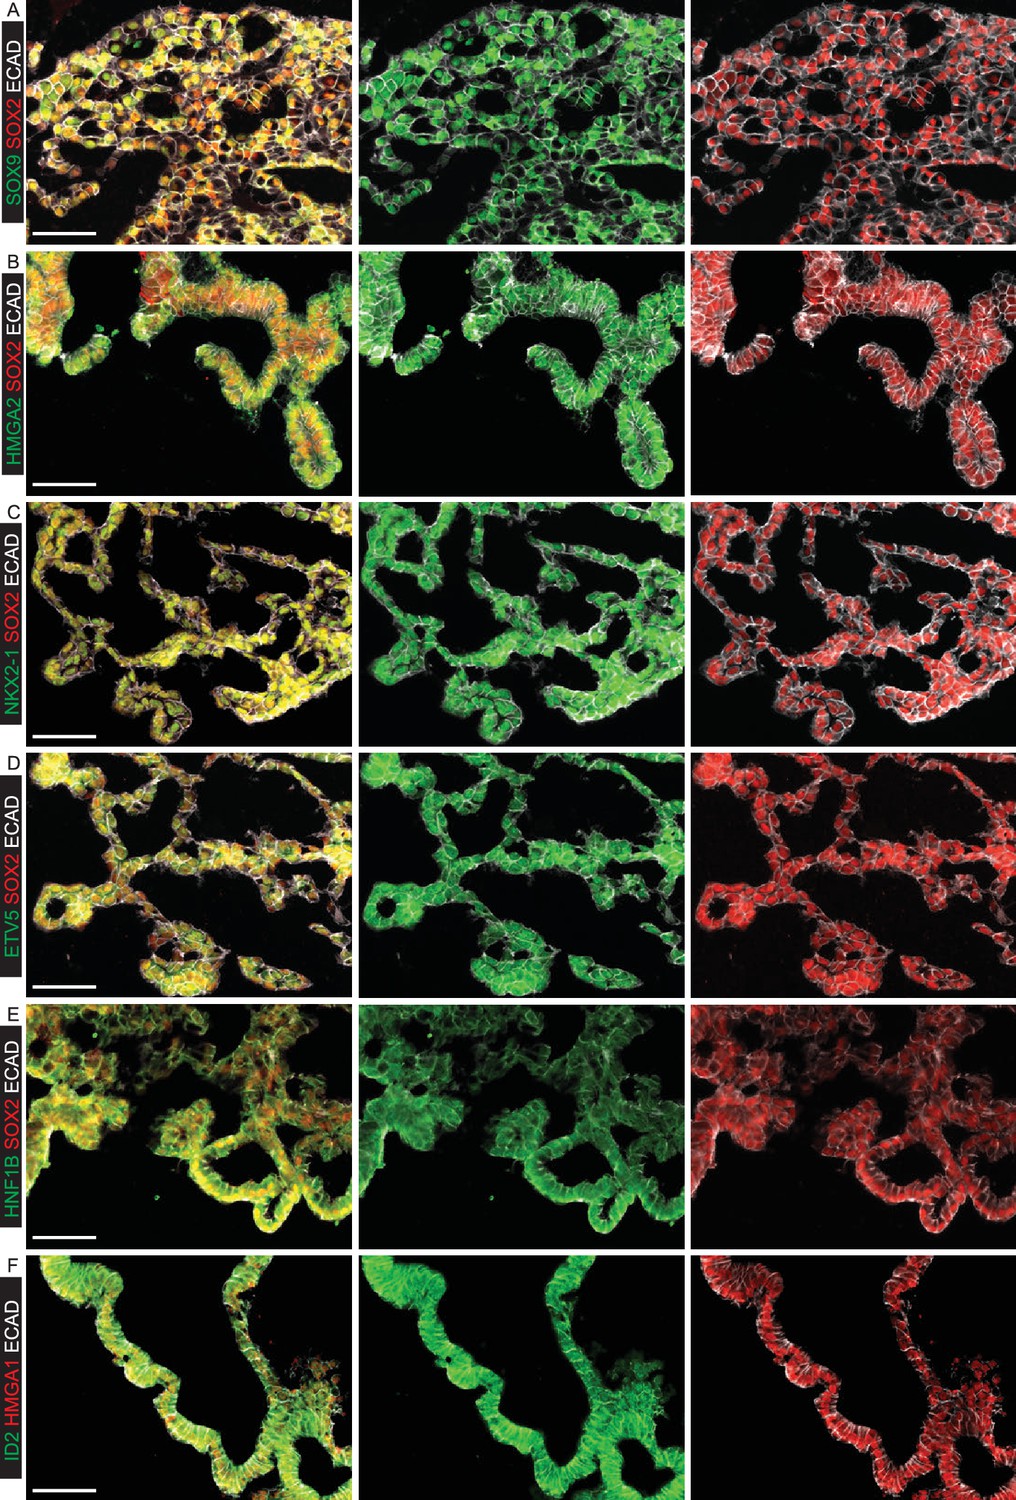
Organoids passaged in self-renewing medium retain tip-specific transcription factor proteins.
(A–F) Cryosections of self-renewing tip organoids between passage 5 and 7. (A) Green: SOX9; red: SOX2; white: ECAD (epithelial cells). (B) Green: HMGA2; red: SOX2; white: ECAD (epithelial cells). (C) Green: NKX2-1; red: SOX2; white: ECAD (epithelial cells). (D) Green: ETV5; red: SOX2; white: ECAD (epithelial cells). (E) Green: HNF1B; red: SOX2; white: ECAD (epithelial cells). (F) Green: ID2; red: HMGA1; white: ECAD (epithelial cells). Bar = 50 μm all panels.
Figure 3—figure supplement 2
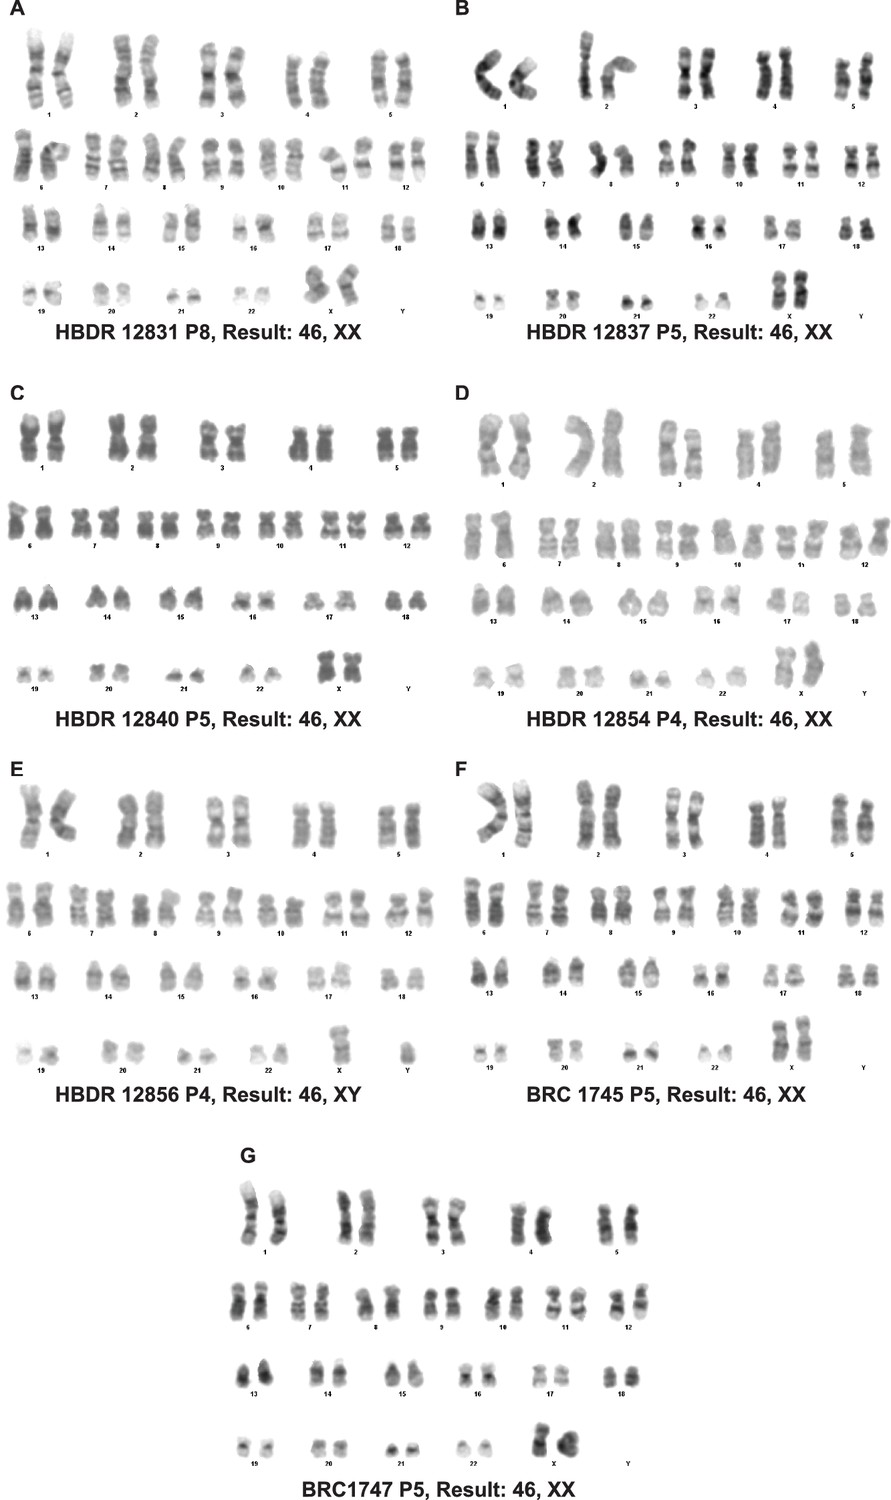
Organoids passaged in self-renewing medium retain a normal karyotype.
(A–G) Karypotype of 7 organoid lines between passage 4 and 8. 7/7 organoid lines tested retained a normal karypotype.
Figure 3—figure supplement 3
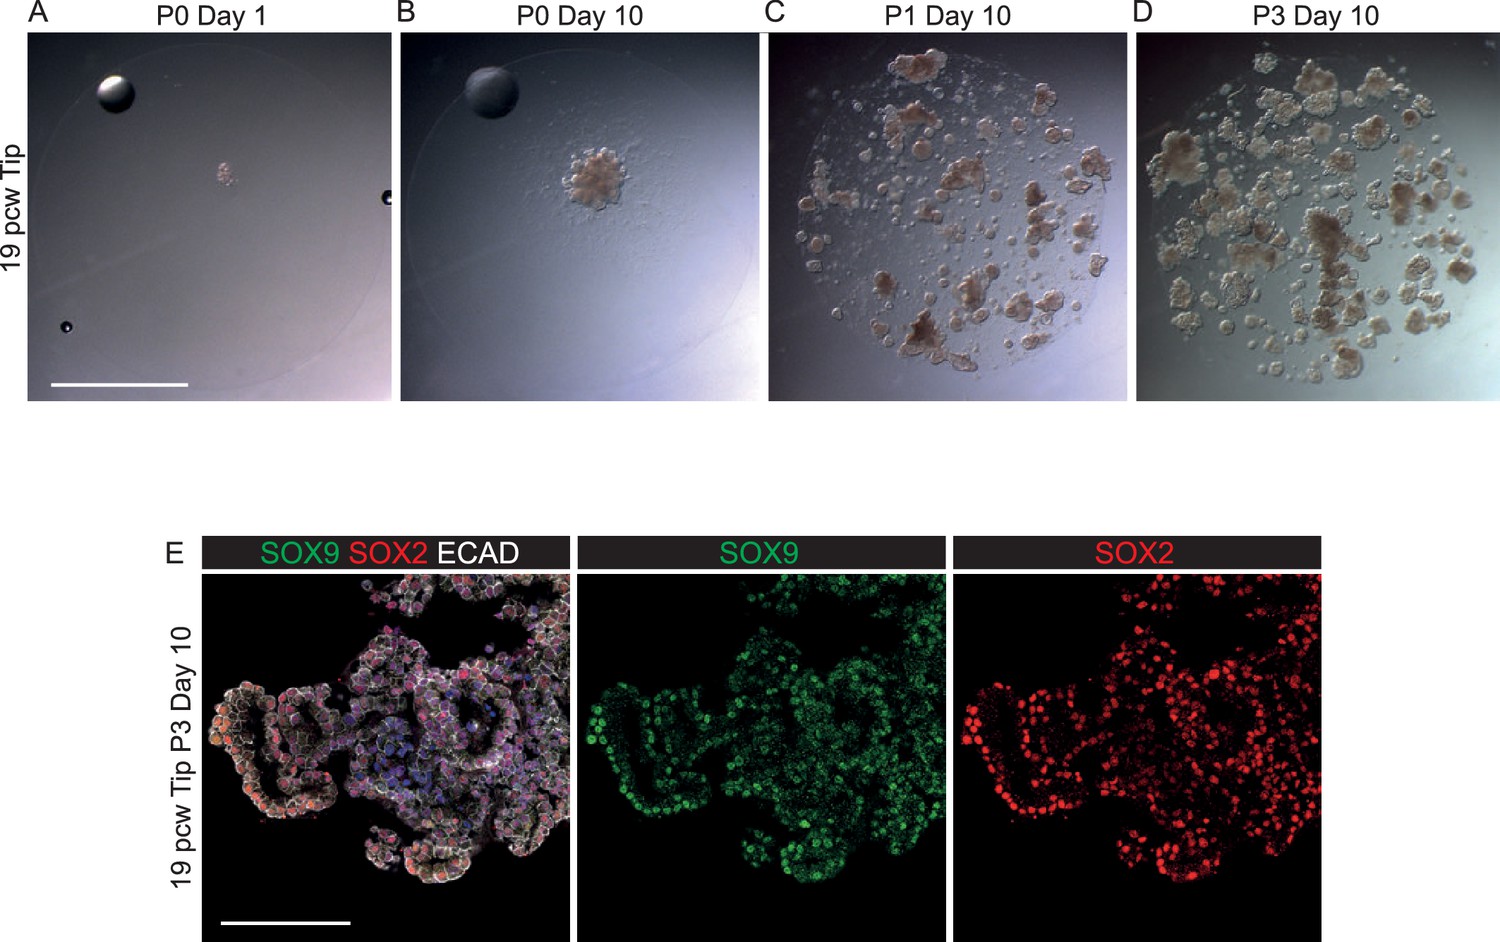
SOX2-, SOX9+ canalicular stage human embryonic tips can be grown as SOX2+, SOX9+self-renewing organoids.
(A–D) Bright field images of 19 pcw tips growing as self-renewing organoids. (E) 19 pcw tip organoids co-express SOX2 and SOX9. Green: SOX9; red: SOX2; white: ECAD. Blue: DAPI. Scale bars = 2 mm (A–D); 100 μm (E).
Figure 3—figure supplement 4
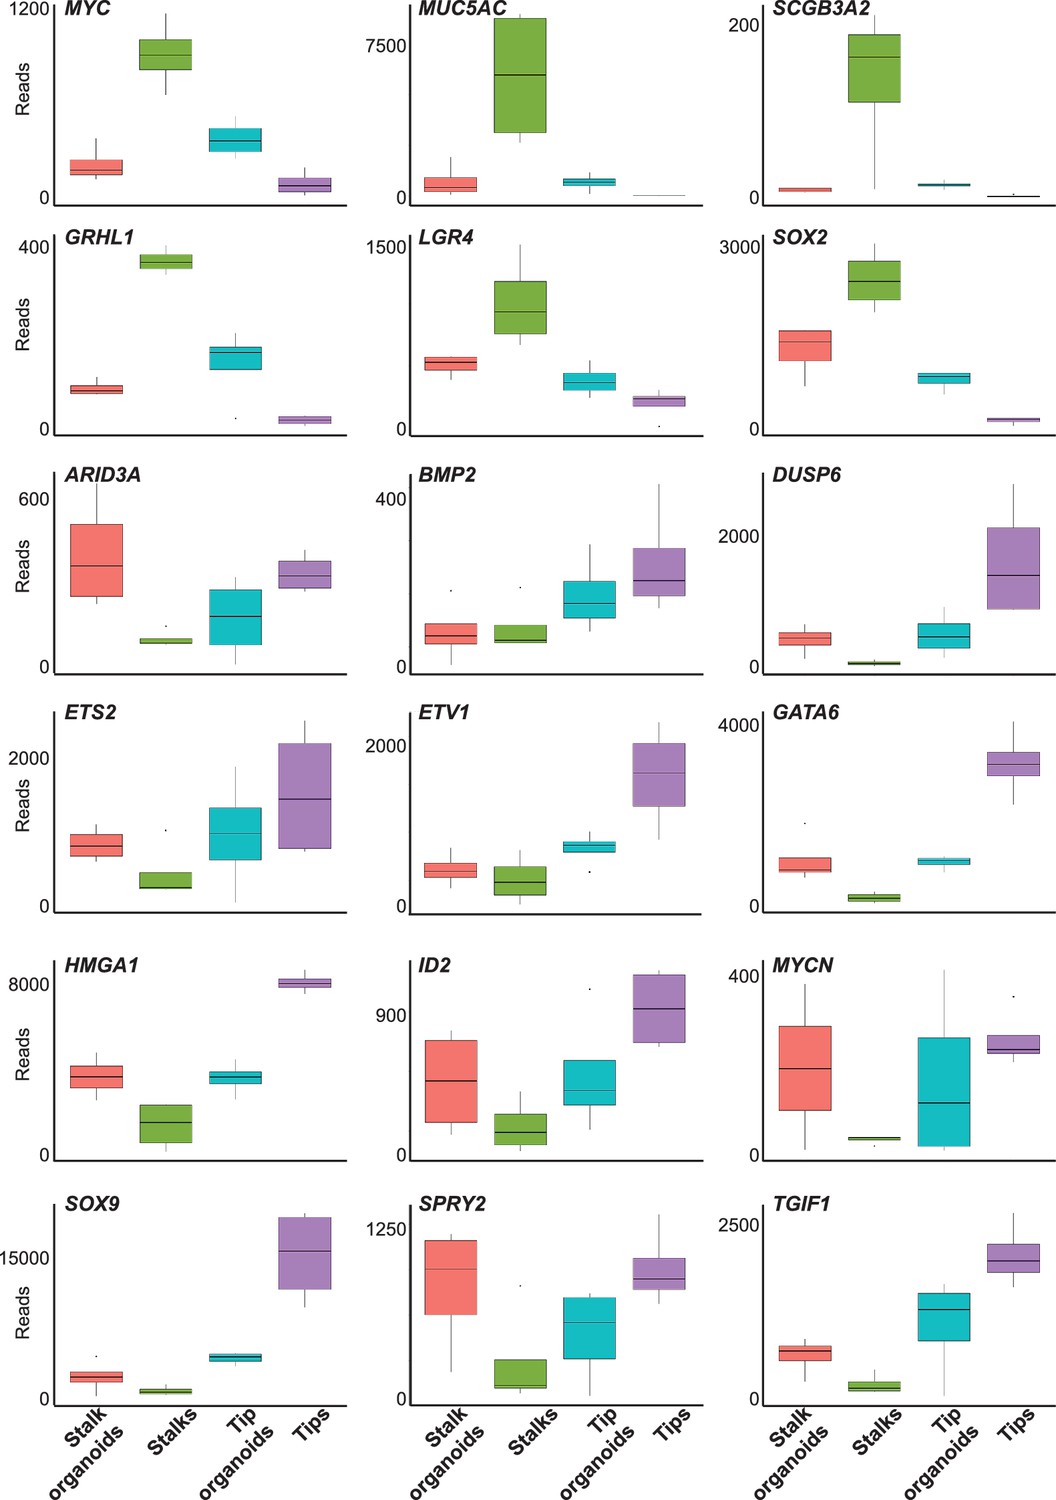
Box plots of selected tip and stalk specific genes showing transcript levels in fresh tissue and cultured organoids.
Normalised RNAseq data was used to generate box plots of selected genes.
Figure 3—figure supplement 5
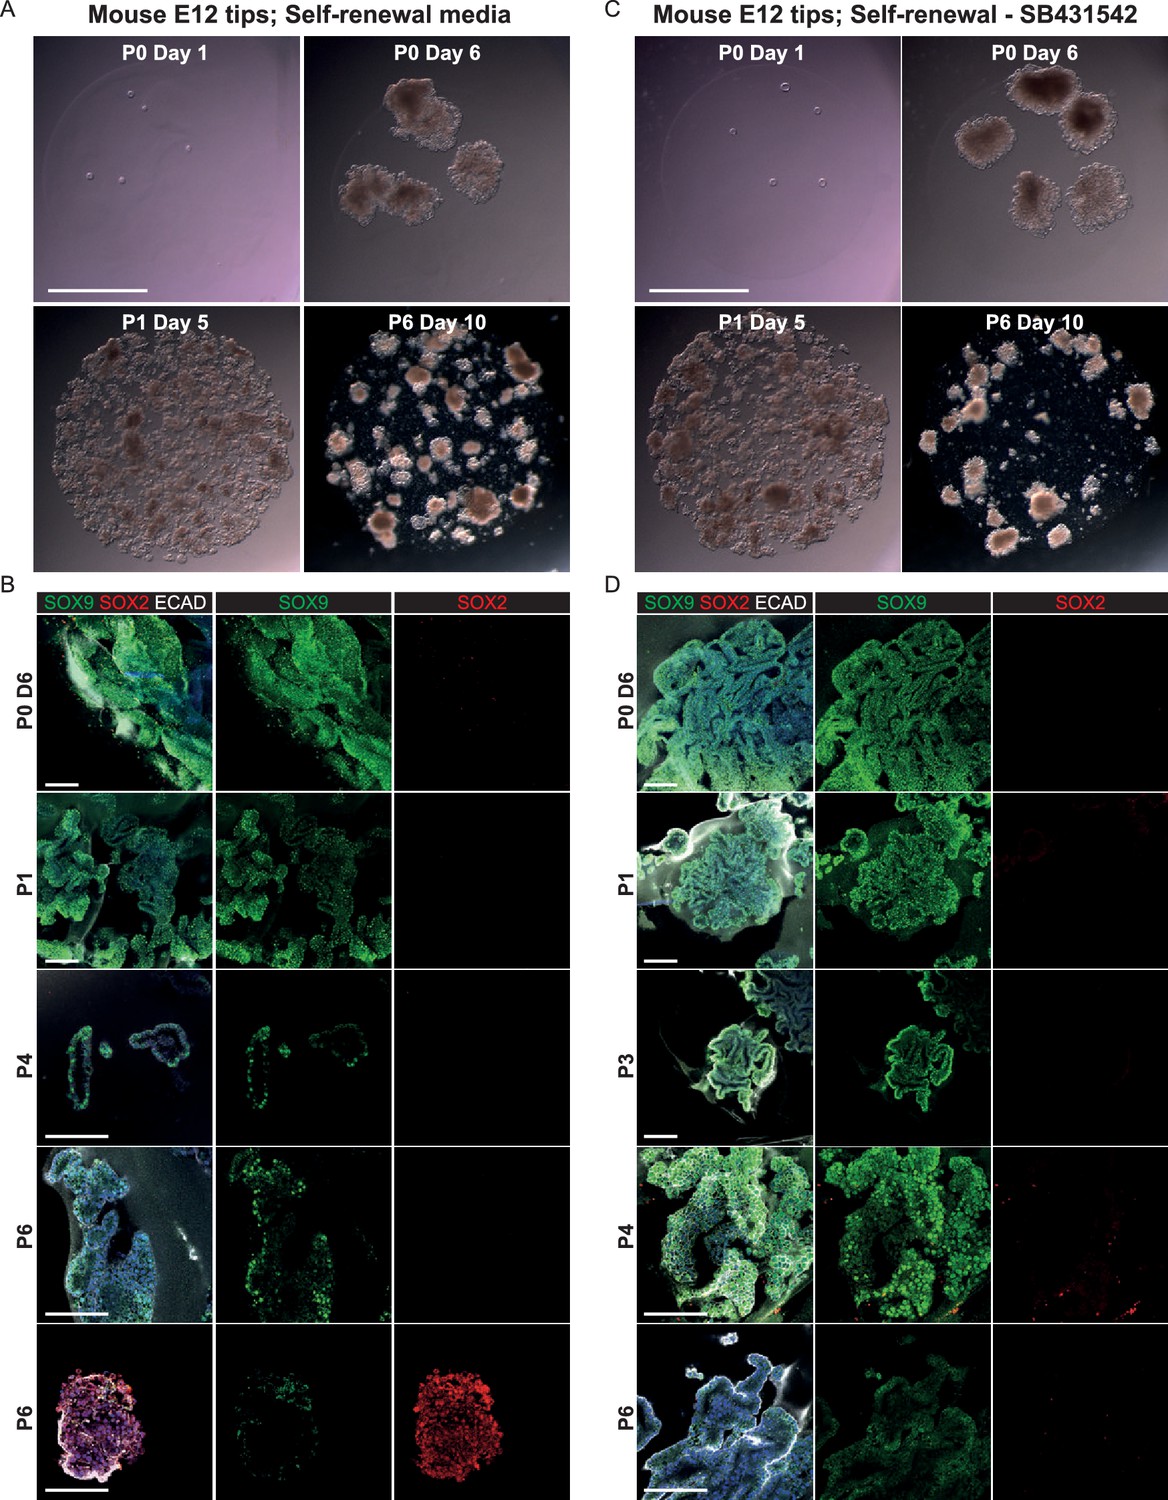
E12.5 mouse tips do not long-term self-renew in the growth medium developed for human tips.
(A, C) Bright-field images of mouse E12.5 tip epithelium growing as organoids in self-renewal medium +/- SB431542. (Factors adjusted to be mouse-specific). (B, D) Confocal images of mouse organoids. These were initially SOX9+, SOX2- similar to the in vivo tissue, but they decreased SOX9 expression and turned on SOX2 over time. Green: SOX9; red: SOX2; white: ECAD. Blue: DAPI. Scale bars = 2 mm (A, C); 100 μm (B, D).
Figure 4
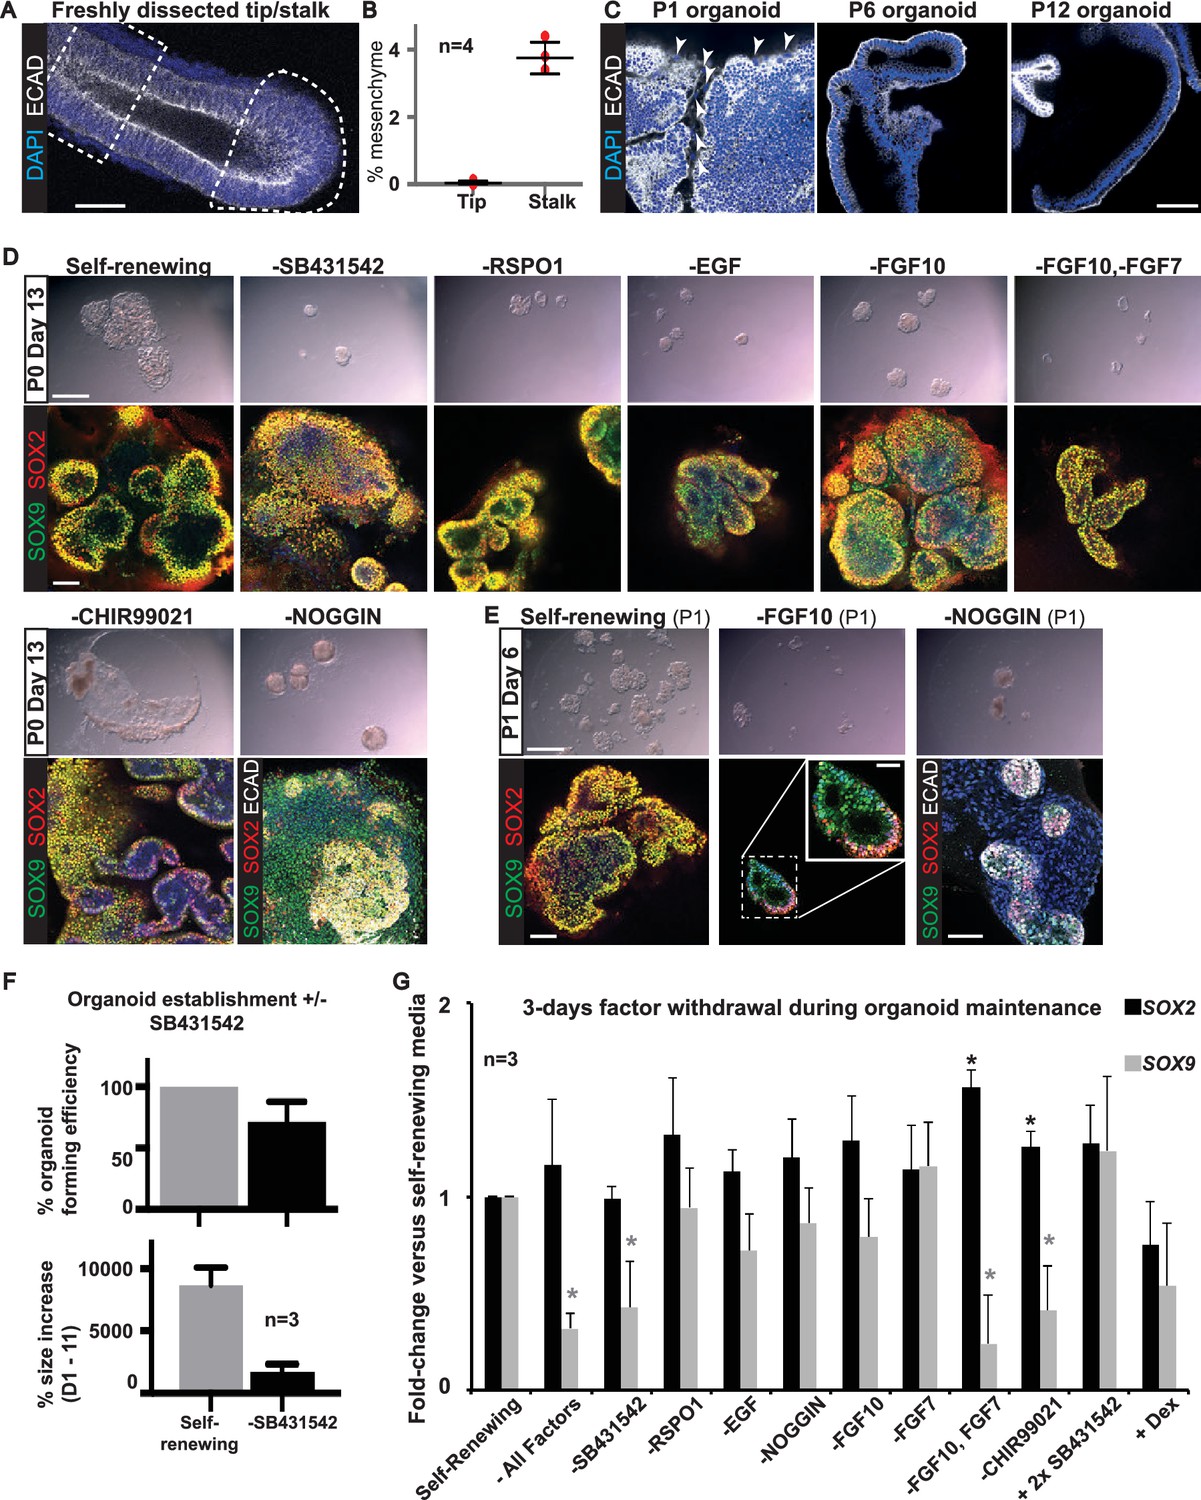
All factors added to the medium are required for culture establishment.
(A) Whole-mount staining for DAPI and ECAD was performed to estimate the fraction of mesenchyme in a microdissected tip (dotted area) and stalk (dashed box). (B) Quantitation of percentage of mesenchyme in four microdissected tips and stalks. (C) Presence of mesenchyme was assessed in six organoid lines over multiple passages by staining for ECAD (arrowhead = mesenchymal cells). (D) Bright field and confocal images of P0 Day 13 organoids cultured in self-renewing medium, or without the indicated factors. Green: SOX9; red: SOX2; white: ECAD. (E). Bright field and confocal images of organoids at P1 Day 6 cultured in self-renewing medium, or without FGF10, or Noggin. Green: SOX9; red: SOX2; white: ECAD. Boxed area is magnified in inset. (F) Quantitation of organoid forming efficiency and size with, or without, TGFβ inhibition. Bars = SEM. Three biological replicates were analysed; 61 tip cultures without TGFβ inhibition, 38 tip cultures with TGFβ inhibition. (G) Established organoid lines were grown for 3 days in self-renewing, or indicated test medium, and levels of SOX2 and SOX9 assessed by qRT-PCR (values normalized to one for self-renewing controls). Three independent tip organoid lines at P9, 15 and 21 were used. Bars = SEM. * = p-value<0.05. Bars = 50 μm (A, C; D, E confocal images); 1 mm (D, E bright field).
-
Figure 4—source data 1
Individual data points for Figure 4B.
Percentage of cells scored as mesenchyme in freshly dissected tips and stalks. Expressed as percentage of non-ECAD+ cells from total DAPI+ cells. Quantitation done using the mesenchyme-macro.ijm for FIJI which is available as a supplemental file.
- https://doi.org/10.7554/eLife.26575.024
-
Figure 4—source data 2
Individual data points for Figure 4F.
Percentage organoid forming efficiency and size increase from D1-11 of culture when fresh tips are plated in self-renewing medium +/- SB43125. Three independent experiments were performed on different lung samples.
- https://doi.org/10.7554/eLife.26575.025
-
Figure 4—source data 3
Raw qRT-PCR data for Figure 4G.
Fold-change was normalised to one for self-renewing medium. Data for three individual organoid lines are shown.
- https://doi.org/10.7554/eLife.26575.026
Figure 5 with 2 supplements
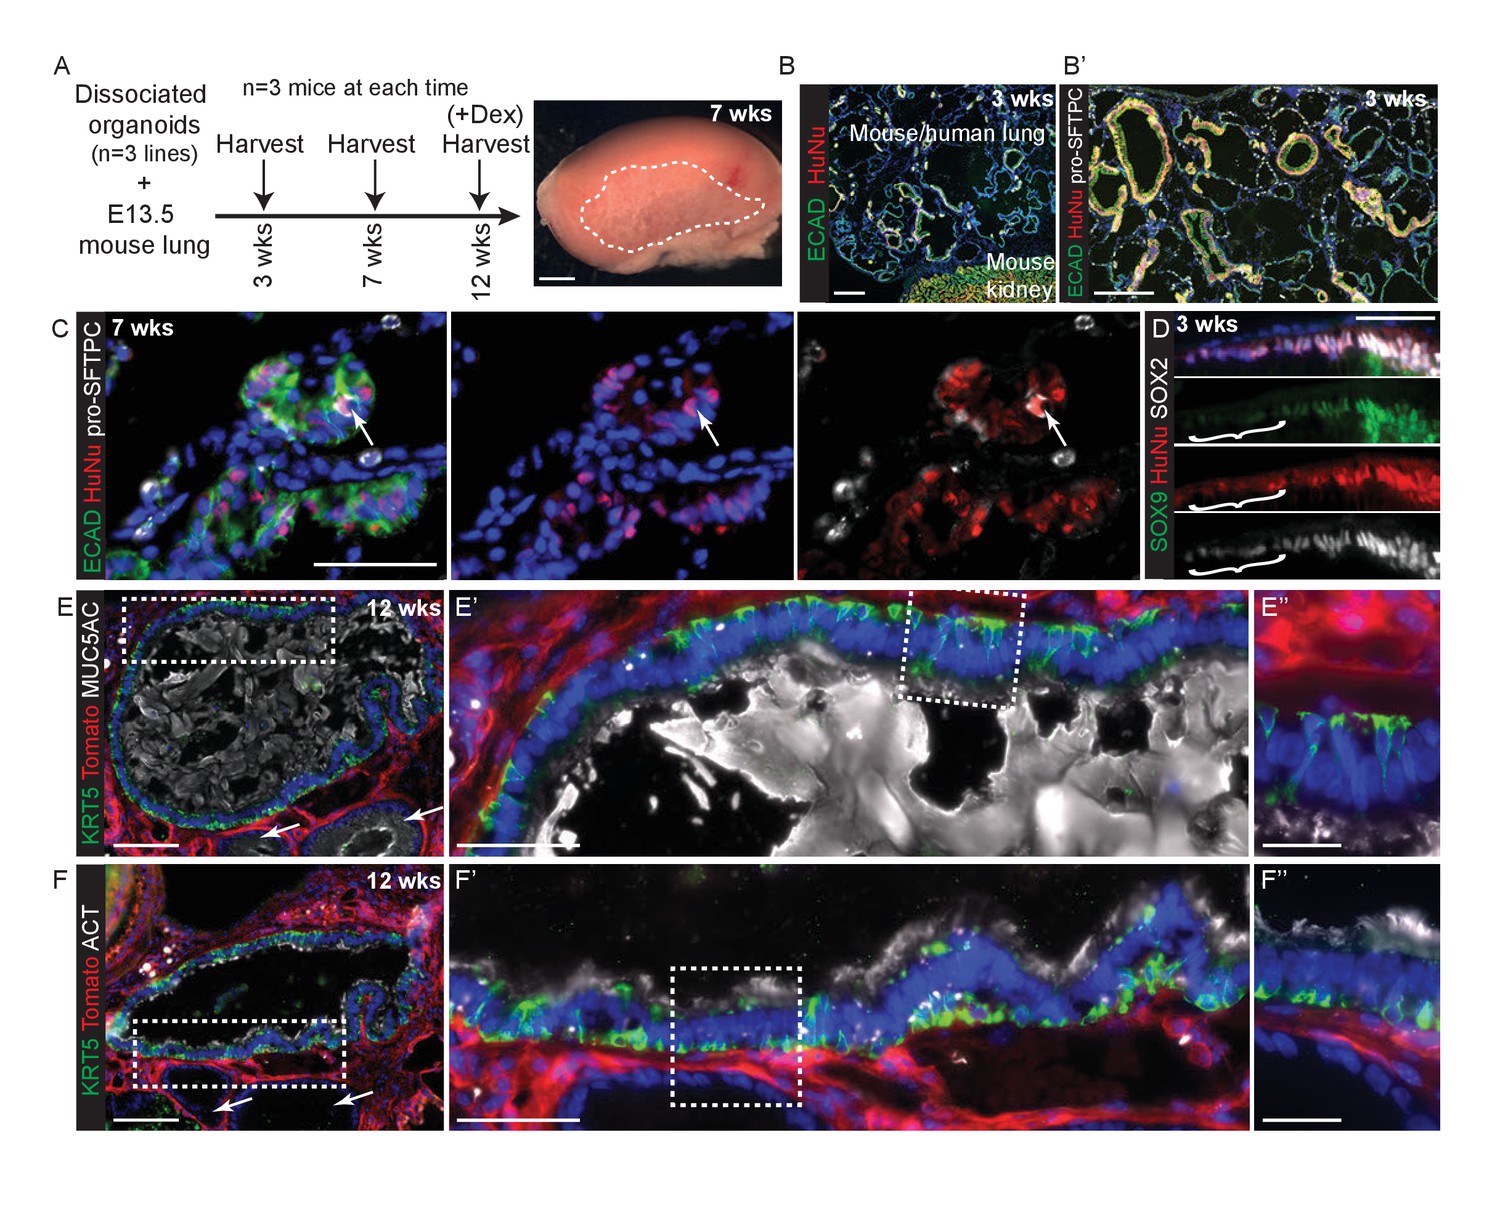
Disscoiated self-renewing organoids are competent to differentiate under the kidney capsule in the presence of embryonic mouse lung cells.
(A) Experimental schematic. Dissociated organoids were mixed with dissociated E13.5 mouse lungs (either MF1 outbred strain for grafts harvested at 3 and 7 weeks, or Rosa26R-mT-mG strain for grafts harvested at 12 weeks.) Animals culled at 12 weeks received 3x dexamethasone injections 1 week before culling. The 7 and 12 week grafts looked identical and thus no effects on the grafts were observed from the dexamethasone injections. Three independent organoid lines were used and three mice (one per organoid line) culled at each time point. Grafts were clearly visible growing beneath the kidney capsule in all nine kidneys harvested. (B) Chimeric mouse/human lung structures were found in all kidneys. Green: ECAD (epithelium); red: HuNu (human nuclei). (B’) It can clearly be seen that mouse and human cells tend to segregate within the grafts, possibly due to their differing size or surface properties. Wide-spread regions of mouse pro-SFTPC+ cells were always visible. Green: ECAD; red: HuNu; white: pro-SFTPC. (C) Rare human pro-SFTPC+ cells (arrow) were identified in all samples. Green: ECAD; red: HuNu; white: pro-SFTPC. (D) Human cells arranged into airway-like structures were strongly SOX9+, SOX2+ at 3 weeks, although patches of cells which were down-regulating SOX9 were visible (bracket). By 7 and 12 weeks SOX9 was expressed at very low levels in some human cells. Green: SOX9; red: HuNu; white: SOX2. (E, F) Rare patches of differentiated human airway cells were identified in 2/3 organoid lines in kidneys harvested at 12 weeks. These were lined with basal, goblet and ciliated cells similar to the in vivo human airways. The remaining human airway-like structures contained goblet cells only and were found in every graft harvested (e.g. arrows in E and F). (E) Green: KRT5 (basal cells); red: Td-Tomato (mouse cells); white: MUC5AC (goblet cells). (F) Green: KRT5 (basal cells); red: Td-Tomato (mouse cells); white: ACT (cilia). Bars = 50 μm (C, D, E’, F’); 2 mm (A); 0.5 mm (B); 200 μm (B’); 100 μm (E, F); 20 μm (E’’, F’’).
Figure 5—figure supplement 1
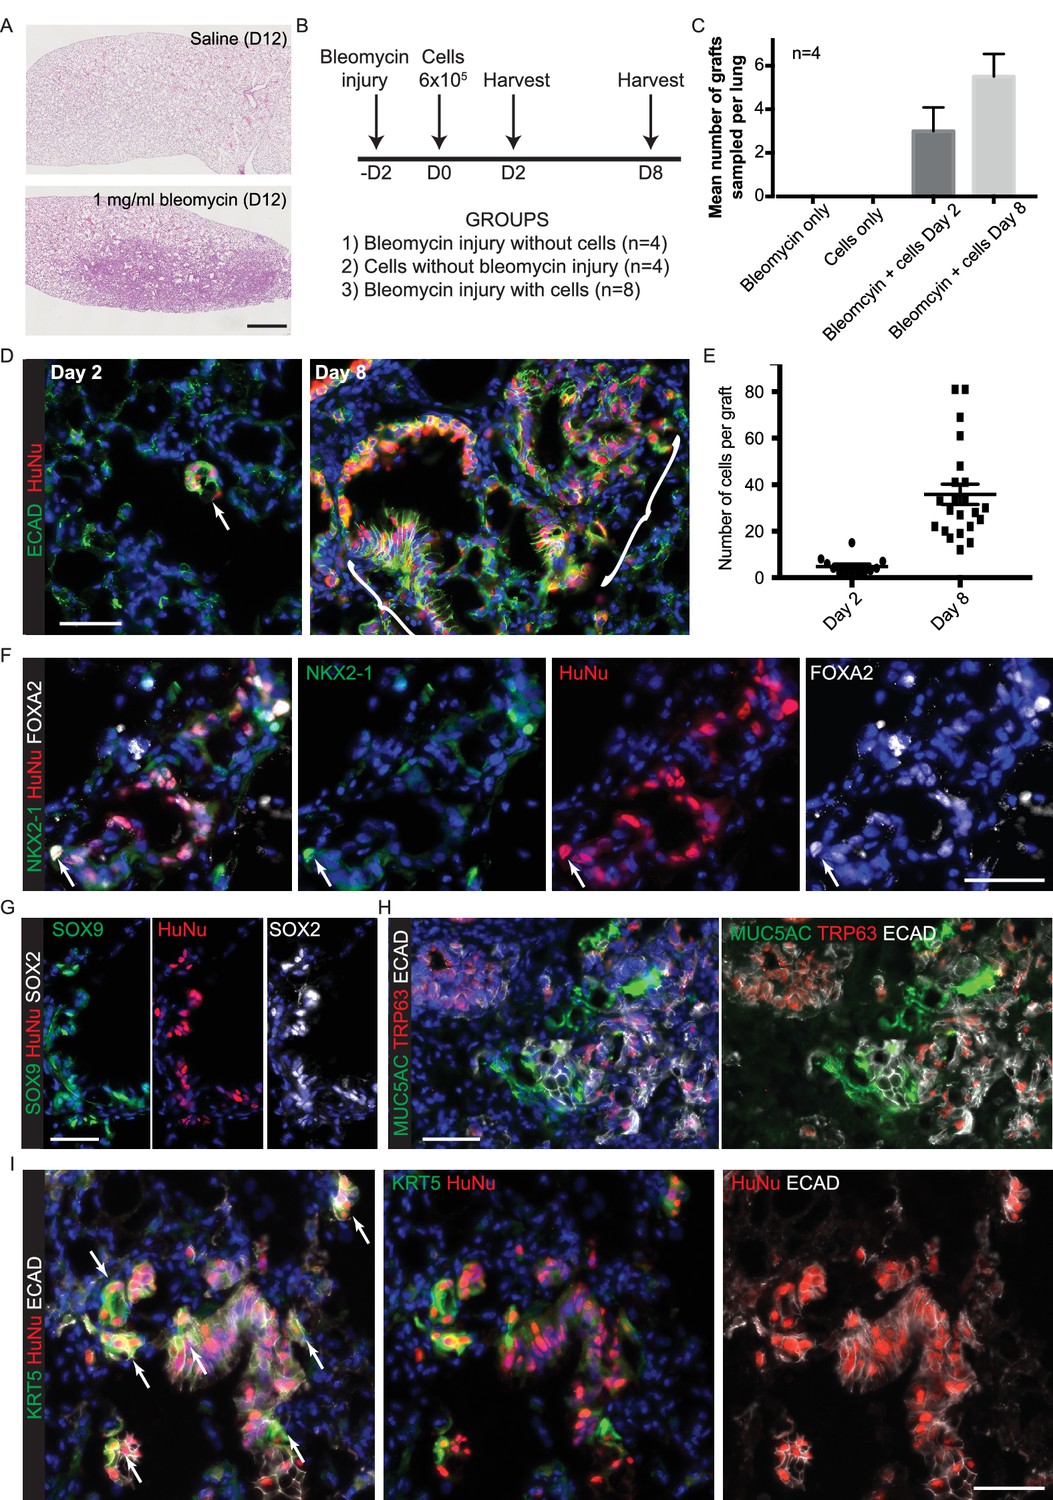
Cells isolated from self-renewing organoids are competent to engraft into adult mouse lungs.
(A) Oropharyngeal administration of 1 mg/ml bleomycin at a dose of 1 μl per gram body weight is sufficient to injure adult male NSG mouse lungs. Representative haematoxylin and eosin stained lung sections. B. Experimental schematic: 6 × 10⁵ cells were administered 2 days post-bleomycin. C. Grafts were only detected in animals that received both injury and cells. Bars = SEM. D. Grafted human cells (arrow or bracket) identified at day 2 and day 8 post-cell administration. Green: ECAD (epithelial cells); red: HuNu (Human nuclear marker). E. Graph showing number of cells per graft counted at day 2 and day 8. F-I. Sections of day eight grafts. F. Green: NKX2-1; red: HuNu (Human nuclear marker); white: FOXA2. Arrow = NKX2-1+ grafted cell; although the majority of the graft is NKX2-1-,FOXA2+. G. Green: SOX9; red: HuNu (Human nuclear marker); white: SOX2. H. Green: MUC5AC (goblet cells); red: TRP63 (basal cells); white: ECAD (epithelial cells). I. Green: KRT5 (basal cells); red: HuNu (Human nuclear marker); white: ECAD (epithelial cells). Arrows = KRT5+ graft cells. Bars = 1 mm (A); 50 μm (D,F–I).
Figure 5—figure supplement 2

Mouse regions of chimeric human-mouse kidney capsule grafts differentiate efficiently.
The extent of differentiation of the mouse cells was indistinguishable at 3, 7 and 12 weeks post-grafting and a selection of representative images from the various times are shown. Regions of mouse alveoli are found throughout the grafts illustrated by pro-SFTPC staining (A) and HOPX staining (B). Mouse airway epithelial cells can be KRT5+, MUC5AC+ (C), SCGB1A1+ (D) and ACT+ (E). Human airway epithelial cells very occasionally have a low level of SCGB1A1 staining (arrow in D). F. Very rare human cells express pro-SFTPC. These are always at the periphery of a tubular structure (arrow). Green: ECAD (epithelium); red: HuNu (Human Nuclei); white: pro-SFTPC. HOPX+ human cells were not identified. Bars = 100 μm (A, B, D); 50 μm (C, E, F).
Figure 6 with 5 supplements
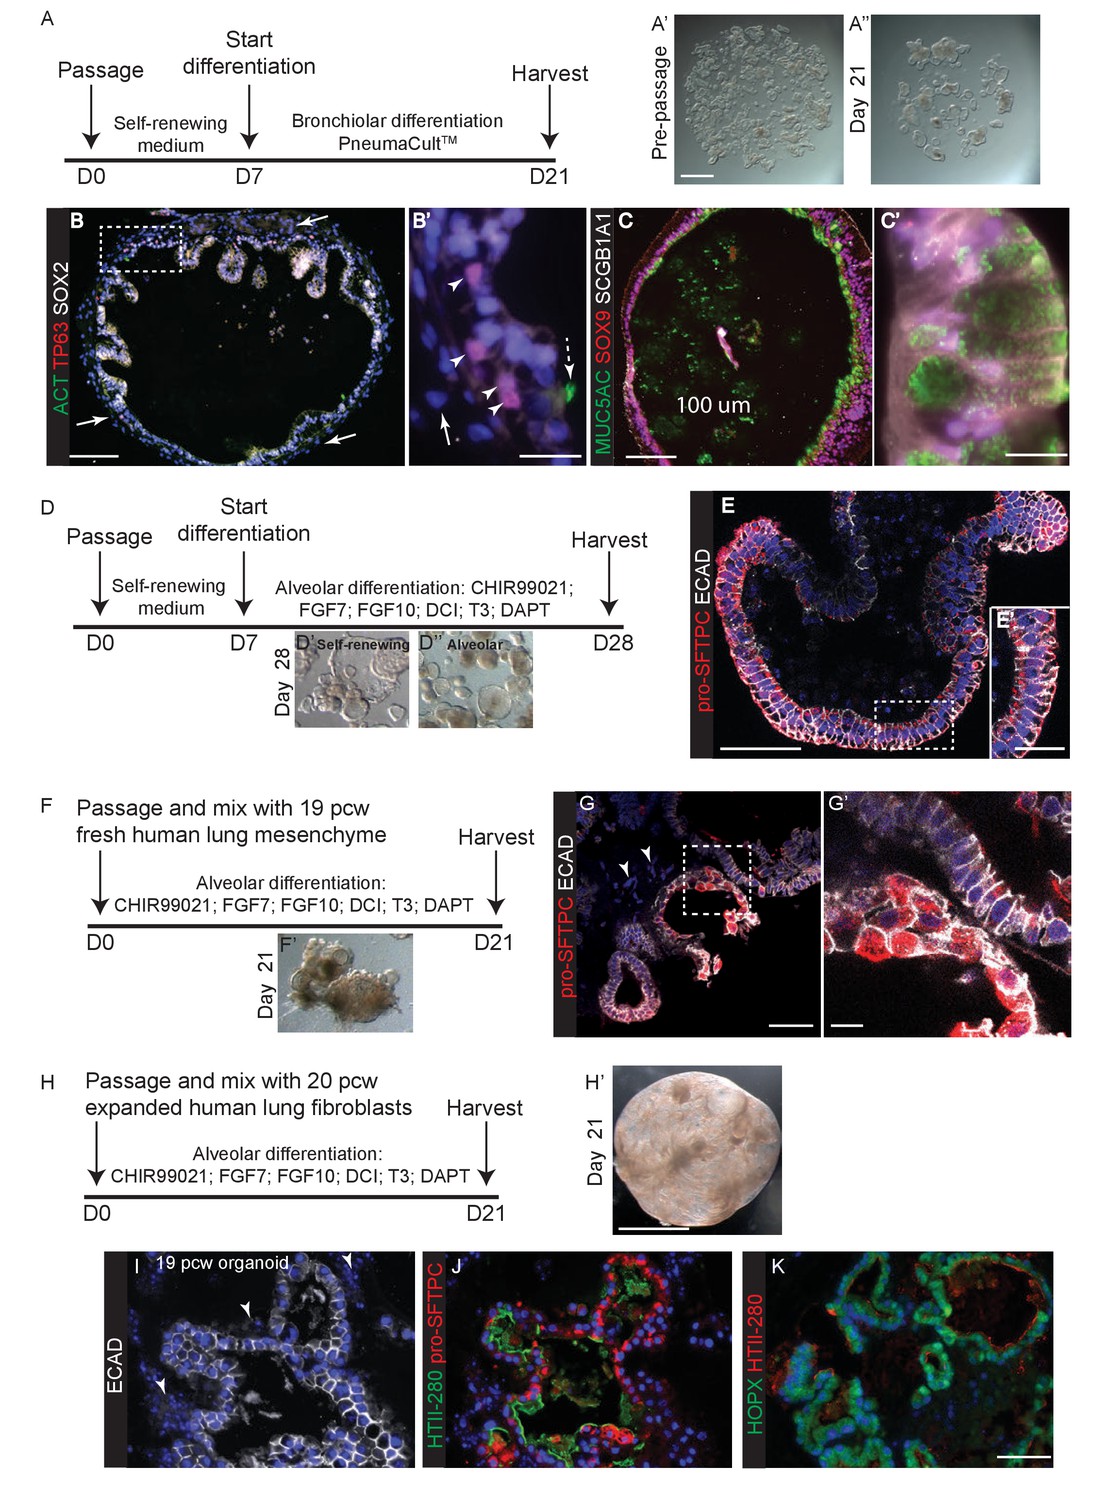
In vitro differentiation of self-renewing organoids towards bronchiolar and alveolar lineages.
(A) Experimental schematic for 3 weeks organoid differentiation in Pneumacult-ALI medium. (B) In low passage number organoids, mesenchyme expanded (arrows), basally-located TP63+ basal cells differentiated and rare ACT+ ciliated cells were seen. Dashed arrow = ciliated cell. Arrow heads = basal cells. Arrow = mesenchyme. Green: ACT (cilia); red: TP63 (basal cells); white: SOX2. (C) Differentiated organoids were predominantly composed of MUC5AC+ goblet cells, although low levels of SCGB1A1 were observed in some cells. Cells retained SOX9 suggesting that differentiation was not complete. Green: MUC5AC (mucous); red: SOX9; white: SCGB1A1. (D) Experimental schematic for 3 week alveolar differentiation experiment. (E) All organoid cells retained a columnar appearance and expressed relatively low levels of apical pro-SFTPC. Red: pro-SFTPC; white: ECAD. (F) Experimental schematic for 3 week alveolar differentiation in the presence of freshly-isolated 19 pcw human mesenchyme. (G) Mesenchymal cells were observed in the cultures (arrowheads), moreover cells expressing higher levels of pro-SFTPC with a more squamous appearance were also obtained. Red: pro-SFTPC; white: ECAD. (H) Experimental schematic for 3 week alveolar differentiation of 19 pcw organoid in the presence of expanded human 20 pcw mesenchymal cells. DCI = dexamethasone, cAMP, IBMX. (I) Organoid epithelium took on a more squamous appearance and was surrounded by mesenchymal cells (arrowheads). White: ECAD. (J) AT2 markers were expressed robustly. Green: HTII-280; red: pro-SFTPC. (K) AT1 and AT2 markers were co-expressed. Green: HOPX; red: pro-SFTPC. Blue: DAPI. Bars = 1 mm (A, H); 100 μm (B, C); 20 μm (B’, E’); 10 μm (C’, G’); 50 μm (E, G, I, J, K).
Figure 6—figure supplement 1
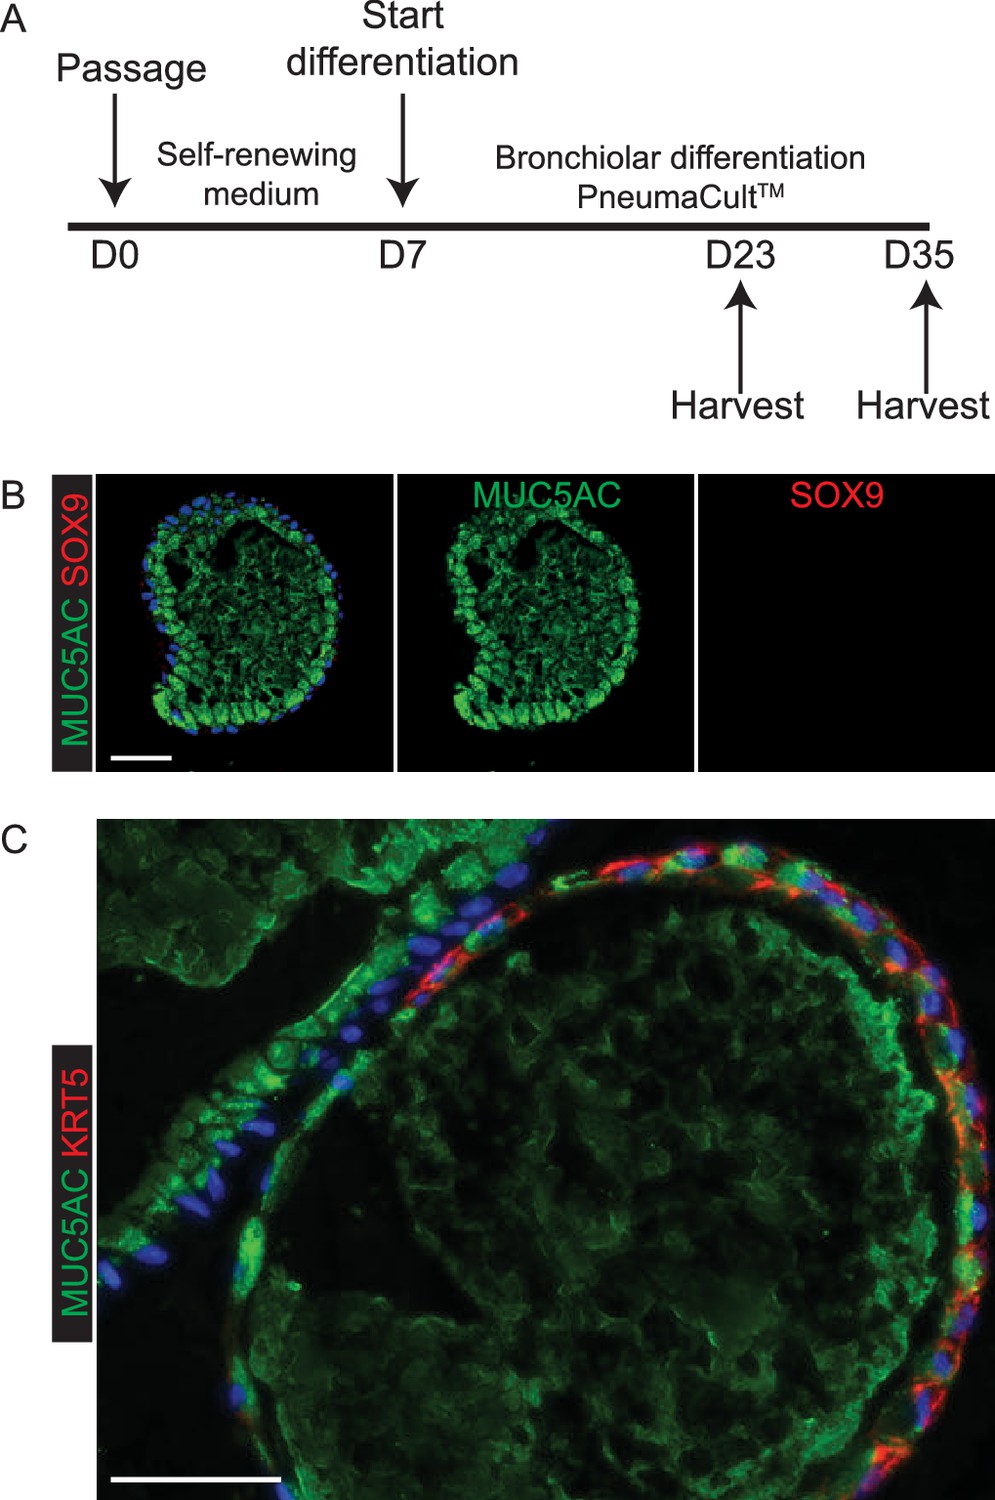
Exposure of self-renewing organoids to PneumacultTM medium leads to efficient goblet cell differentiation with rare patches of KRT5+ basal cells.
(A) Experimental schematic. (B) Every organoid examined had many MUC5AC+ goblet cells and little or no SOX9. Green: MUC5AC (mucous); red: SOX9. (C) More rarely, some organoids contained patches of KRT5+ basal cells. Green: MUC5AC (mucous); red: KRT5 (basal cells). Blue: DAPI. Bar = 50 μm (B, C).
Figure 6—figure supplement 2
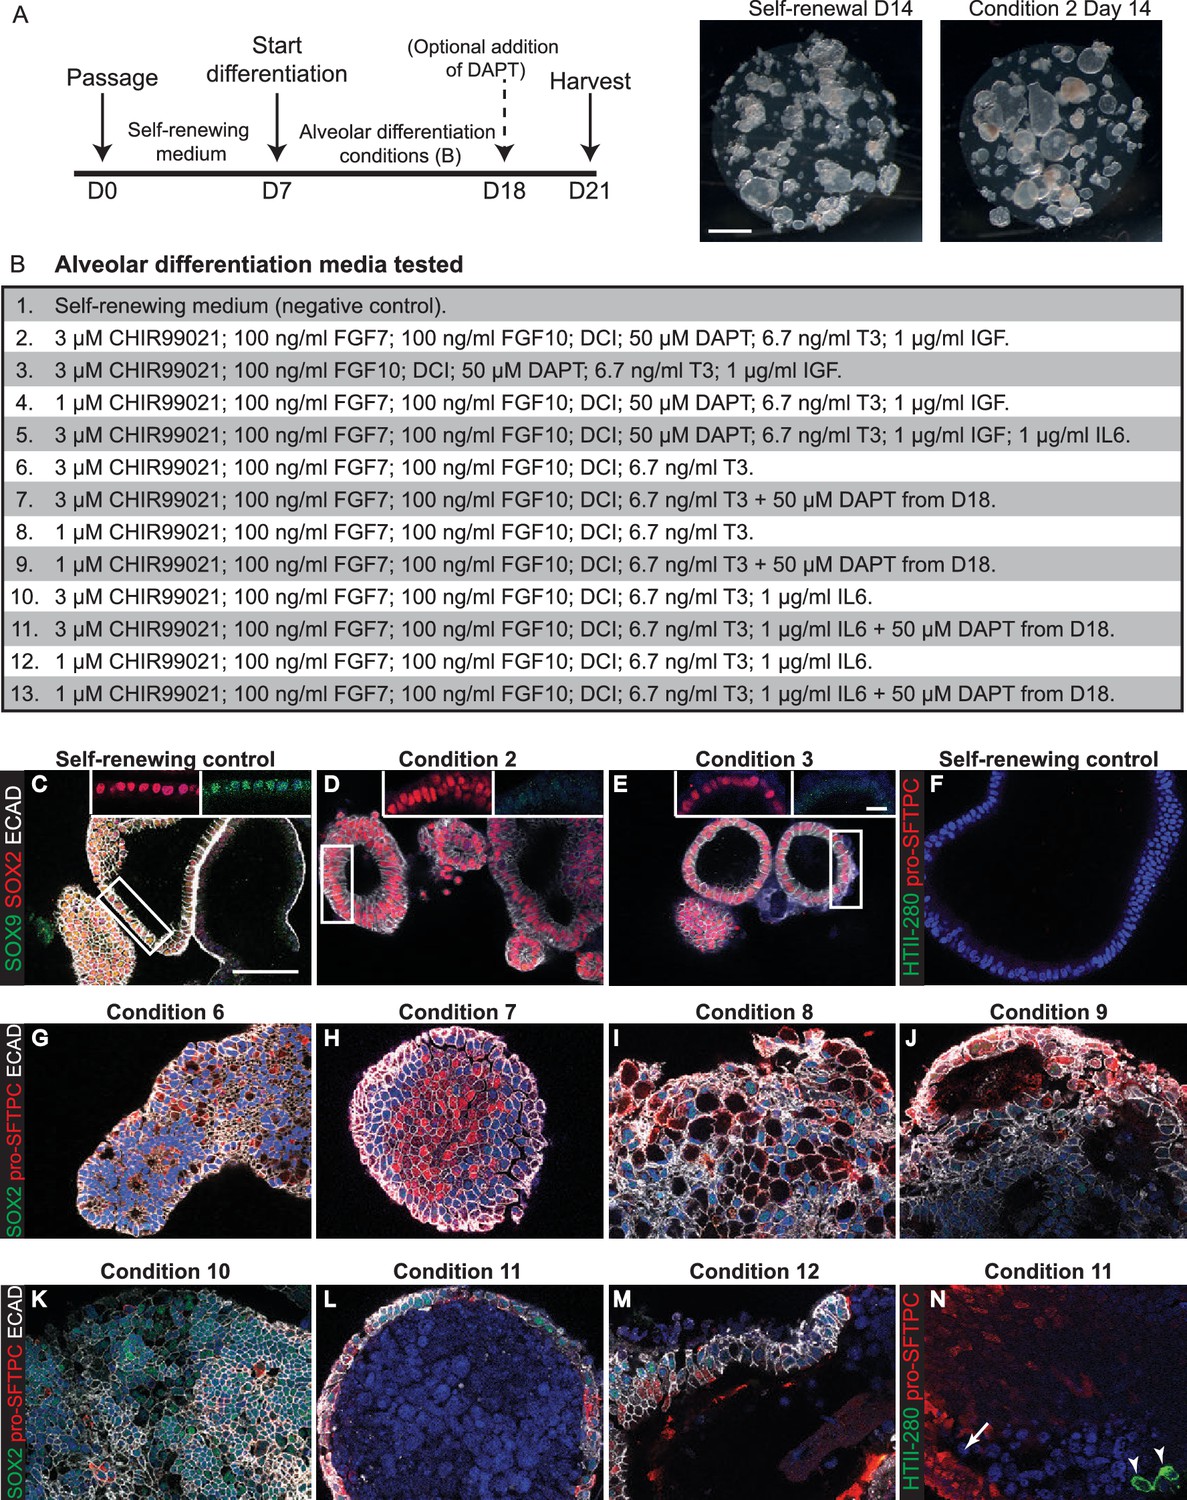
Testing media conditions for ability to promote human organoid alveolar differentiation.
(A) Experimental schematic. (B) Alveolar differentiation media tested. DCI = dexamethasone, cAMP, IBMX. (C-D) Self-renewing controls co-express SOX2 and SOX9, whereas SOX2 is retained and SOX9 is lost following 2 weeks in most media tested. Green: SOX9; red: SOX2; white: ECAD. (F) Green: HTII-280; red: pro-SFTPC cannot be detected in self-renewing control conditions. (G–M) The majority of media tested resulted in patchy loss of SOX2 and upregulation of pro-SFTPC. Green: SOX2; red: pro-SFTPC; white: ECAD. (N) HTII-280 expression was very rarely observed in any differentiation condition. Green: HTII-280; red: pro-SFTPC. Scale bars = 1 mm (A); 50 μm (C–N); 10 μm (insets).
Figure 6—figure supplement 3
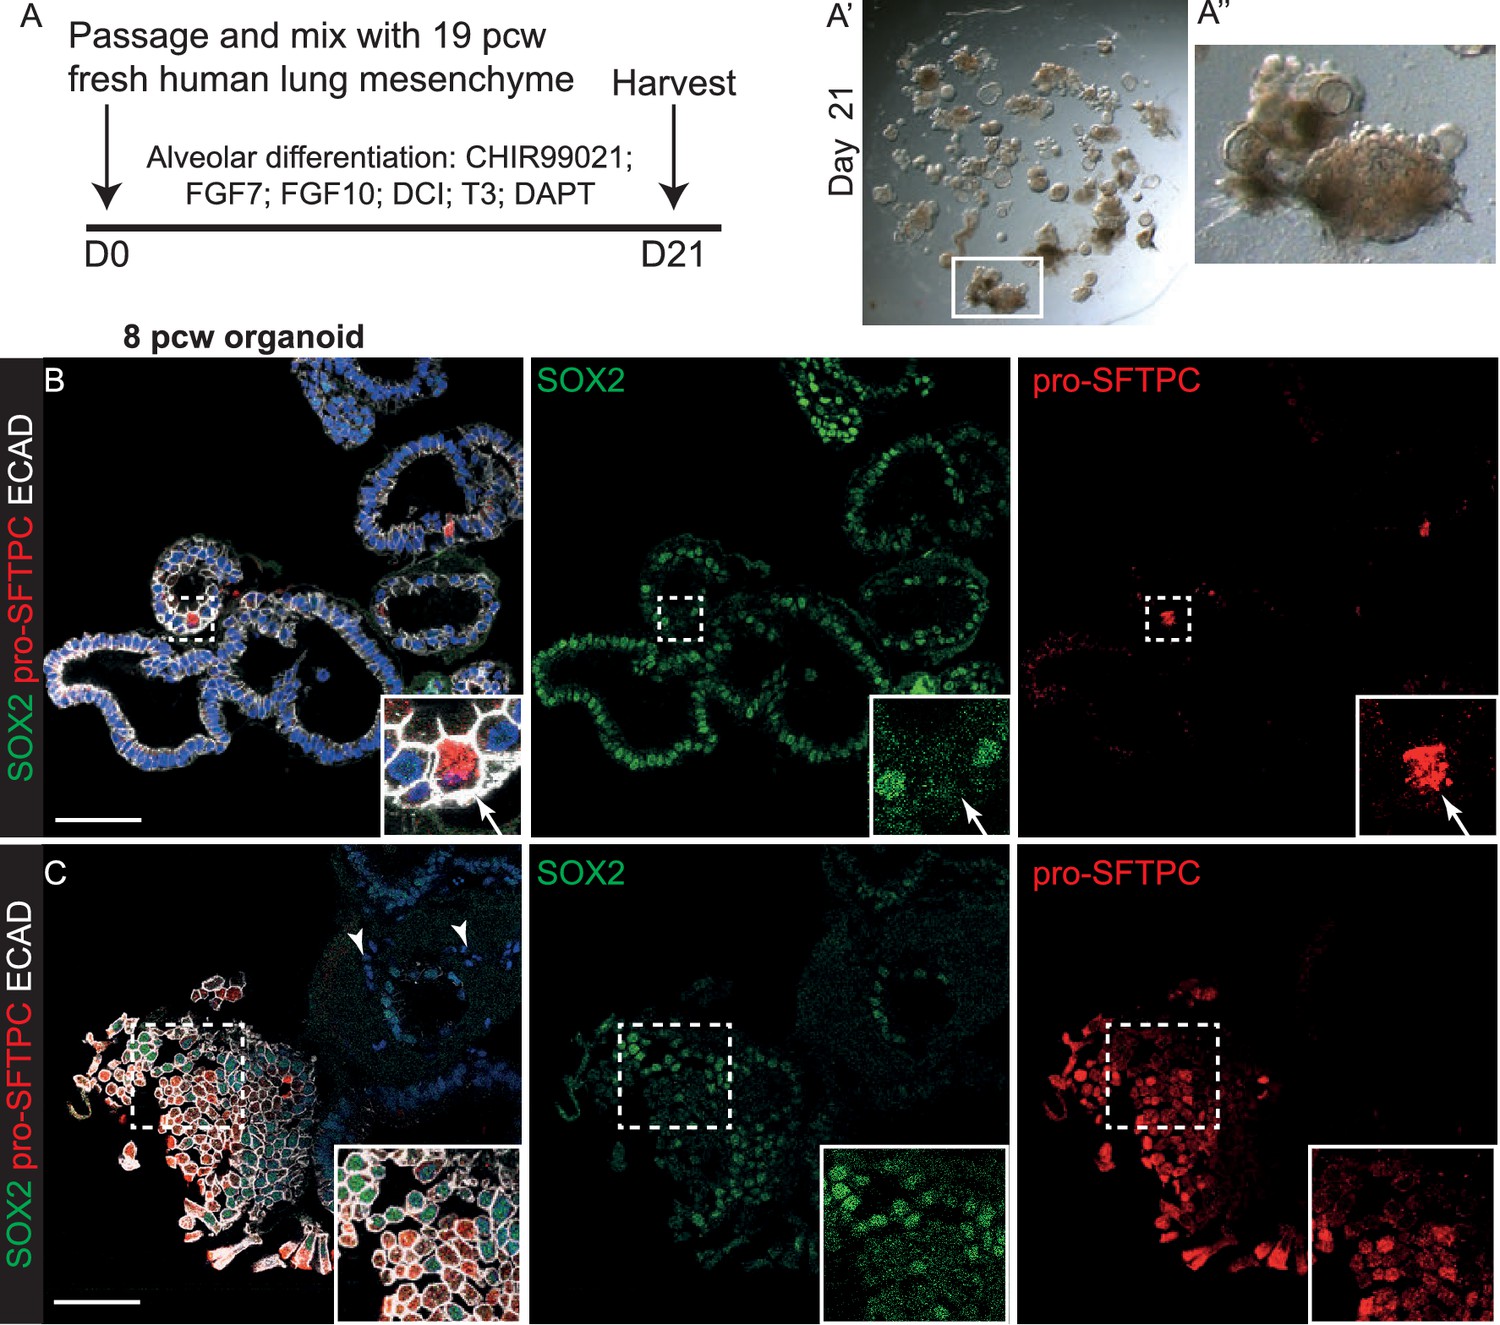
A combination of canalicular stage lung embryonic mesenchyme and alveolar differentiation medium together promote the most efficient organoid alveolar differentiation.
(A) Experimental schematic for 3 week alveolar differentiation of psedoglandular stage-derived organoids in the presence of freshly-isolated 19 pcw human mesenchyme. DCI = dexamethasone, cAMP, IBMX. (B, C) Regions of organoid that have turned off SOX2 and turned on pro-SFTPC can readily be distinguished. Green: SOX2; red: pro-SFTPC; white: ECAD.
Figure 6—figure supplement 4
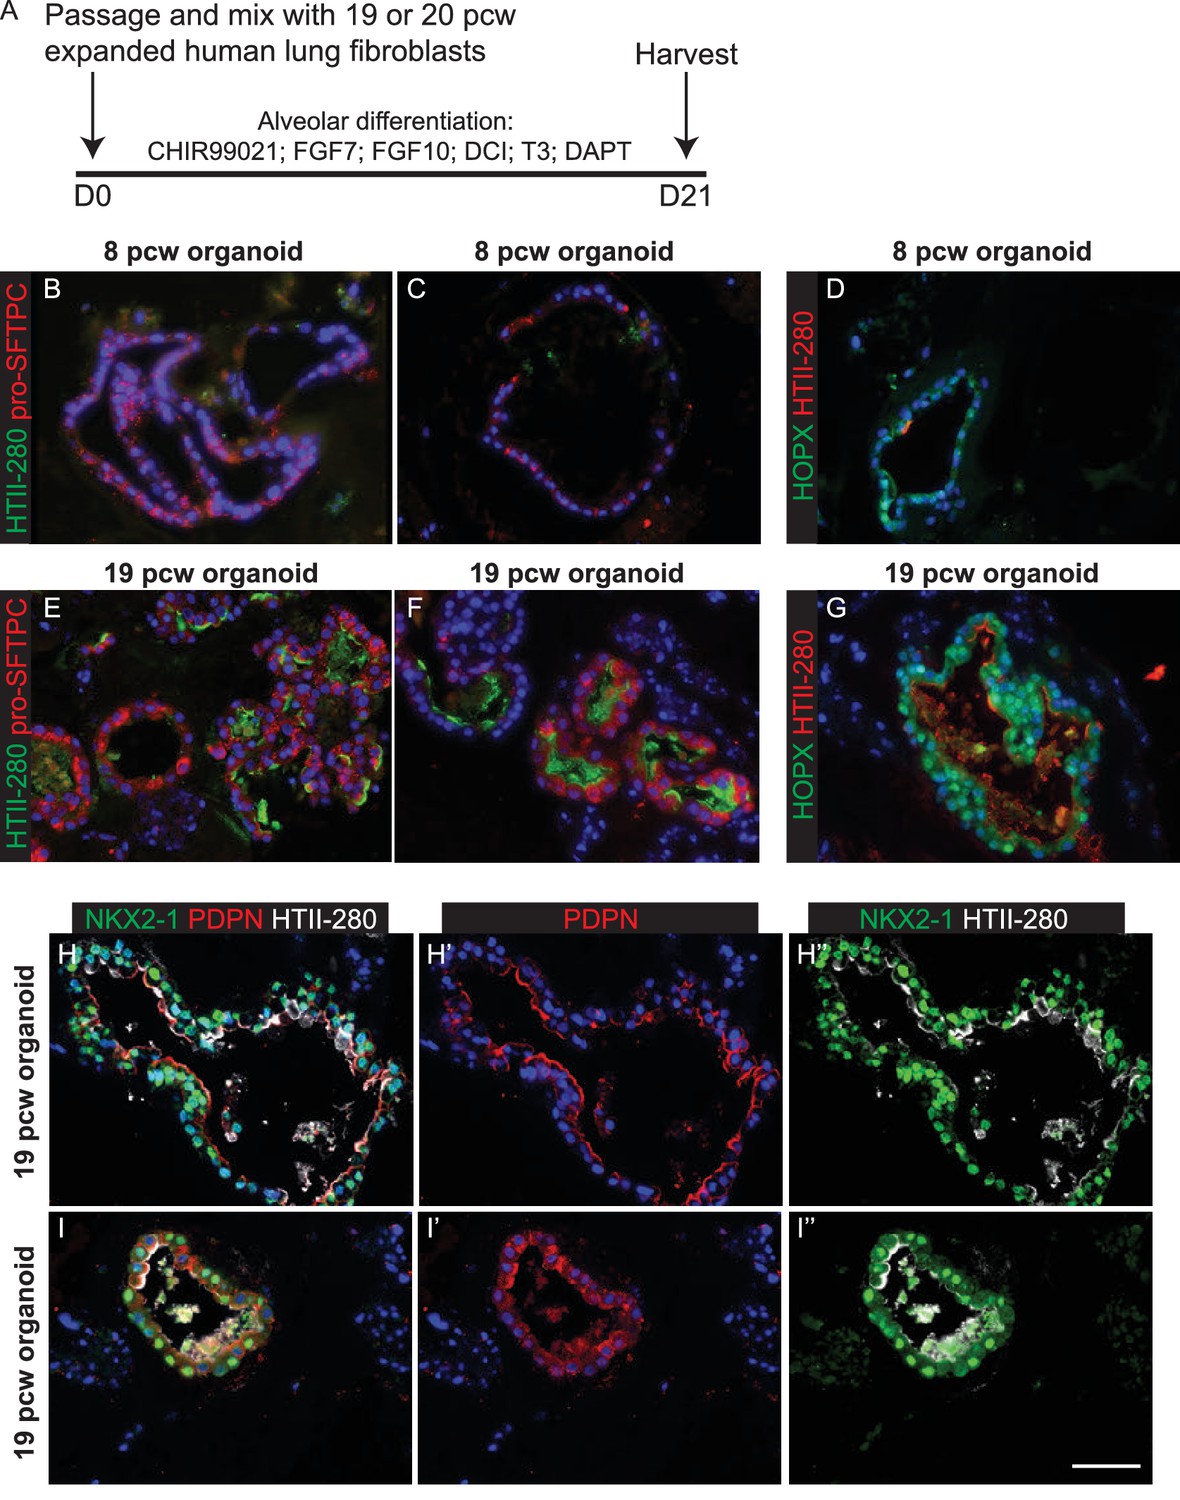
Expanded canalicular stage mesenchyme and alveolar medium can promote organoid alveolar differentiation.
(A) Experimental schematic for 3 week alveolar differentiation of psedoglandular and canalicular stage-derived organoids in the presence of expanded 19 or 20 pcw human mesenchyme. (B–D) Pseudoglandular stage organoids took on a squamous appearance and expressed pro-SFTPC and, more rarely, HTII-280. The AT1 marker, HOPX was also expressed. (E–I) Canalicular stage organoids also took on a squamous appearance and expressed higher levels of AT2 markers, in addition to HOPX and PDPN. Cells retained co-expression of AT1 and AT2 markers. Results shown are from two independent 19 pcw organoid experiments are shown. B, C, E, F. Green: HTII-280; red: pro-SFTPC. (D, G) Green: HOPX; red: HTII-280. (H, I) Green: NKX2-1; red: PDPN; white: HTII-280. Blue = DAPI. Bars = 50 μm all panels.
Figure 6—figure supplement 5
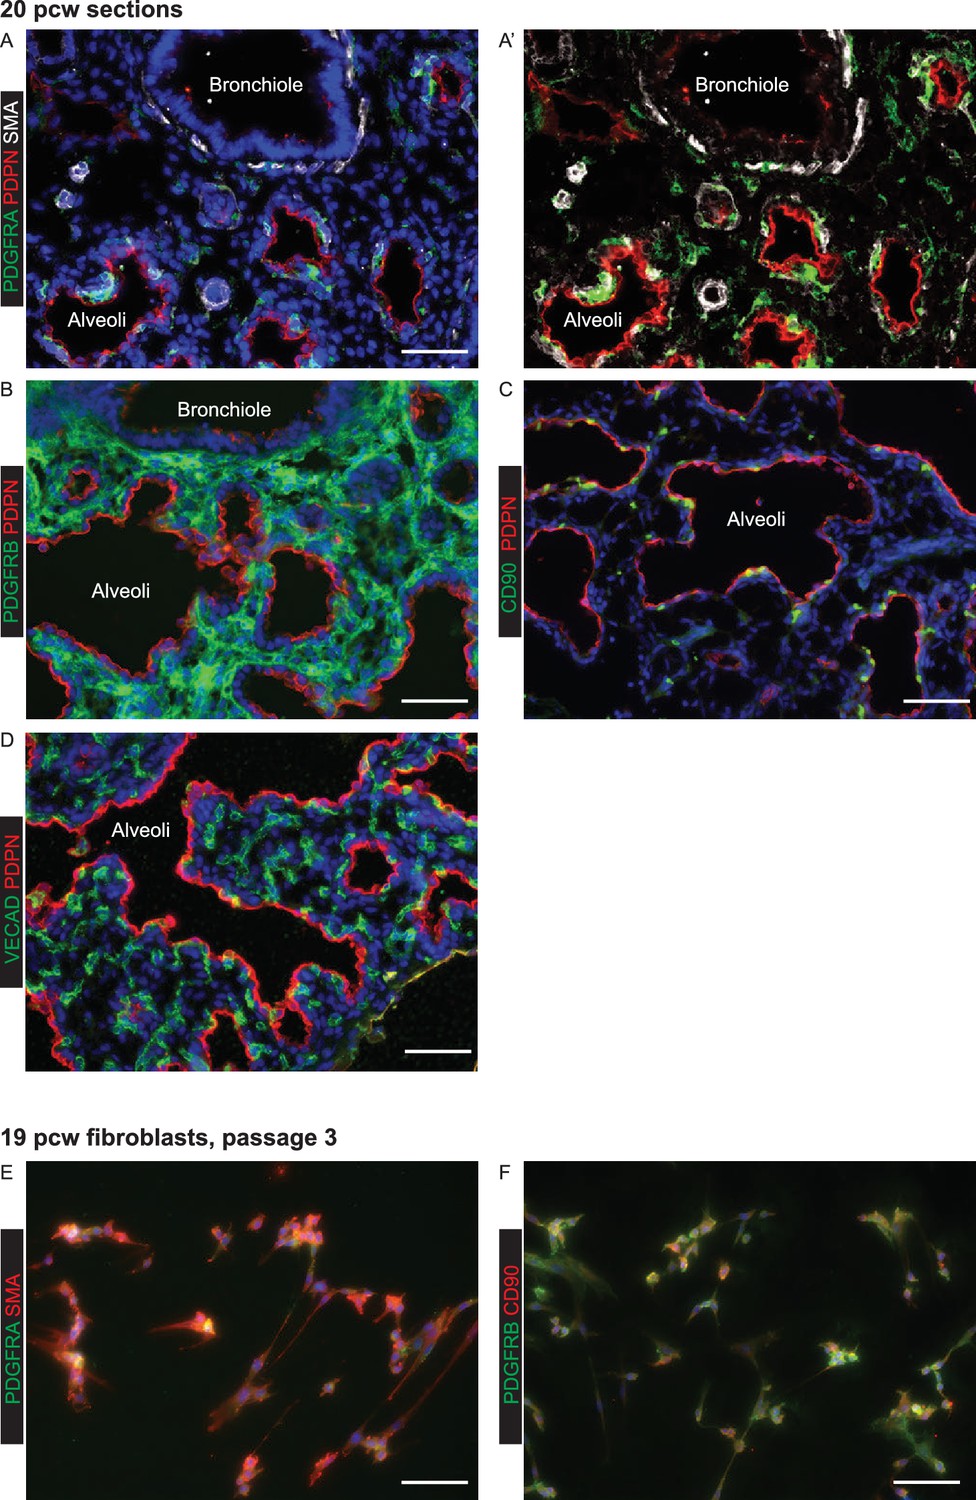
Expanded fibroblasts used for organoid co-cultures are a heterogeneous population expressing various lung embryonic fibroblast markers.
(A–D) 20 pcw lung sections stained for mesenchymal markers. (A) Green: PDGFRA; red: PDPN (alveolar epithelium and lymphatic endothelium); white: SMA. (B) Green: PDGFRB; red: PDPN (alveolar epithelium and lymphatic endothelium). (C) Green: CD90; red: PDPN (alveolar epithelium and lymphatic endothelium). (D) Green: VECAD (vascular endothelium); red: PDPN (alveolar epithelium and lymphatic endothelium). (E–F) Passage three fibroblasts expanded from 19 pcw human embryonic lung. (E) Green: PDGFRA; red: SMA. (F). Green: PDGFRB; red: CD90. Expanded fibroblasts are all PDGFRB+, but co-express a variety of other markers. All panels: blue = DAPI (nuclei). Bars = 50 μm all panels.
Videos
Video 1
Human lung epithelial tip growing into an organoid over 11 days.
Imaged every 12 hr in bright-field on a Nikon Biostation.
Video 2
Organoid structure is a single layer epithelium with a hollow lumen.
Confocal z-stack of P6 tip organoid. Nuclei (DAPI, blue) and epithelial cells (ECAD, white) illustrating typical organoid morphology.
Tables
Table 1
Self-renewal (Human)
| Reagent | Company | Cat no | Final concentration |
|---|---|---|---|
| Advanced DMEM | ThermoFisher Scientific, Invitrogen | 12634–010 | Base medium |
| Penicillin/Streptomycin | ThermoFisher Scientific, Invitrogen | 15140–122 | 100 U/ml (Pen) 100 μg/ml (Strep) |
| Hepes | ThermoFisher Scientific, Invitrogen | 15630–056 | 10 mM |
| Glutamax | ThermoFisher Scientific, Invitrogen | 35050–038 | 2 mM |
| N2 | ThermoFisher Scientific, Invitrogen | 17502–048 | 1:100 |
| B27 (-Vit A) | ThermoFisher Scientific, Invitrogen | 12587–010 | 1:50 |
| N-acetylcysteine | Sigma-Aldrich | A9165 | 1.25 mM |
| Matrigel (growth factor reduced; specific lots of matrigel with at least 8 mg/ml protein concentration were used) | Corning | 356231 | undiluted |
| R-spondin1 conditioned medium | Stem Cell Intitute, University of Cambridge | From 293T-HA-Rspo1-Fc cell line made by Calvin Kuo, Stanford | 5% v/v |
| EGF | Peprotech, UK | AF-100–15 | 50 ng/ml |
| Noggin | R and D Systems | 6057 NG-100 | 100 ng/ml |
| FGF10 | R and D Systems | 345-FG-025 | 100 ng/ml |
| FGF7 | Peprotech | 100–19 | 100 ng/ml |
| CHIR 99021 | Stem Cell Institute, University of Cambridge | n/a | 3 μM |
| SB 431542 | Tocris | 1614 | 10 μM |
| 48 well plates (Greiner Cellstar) | Sigma-Aldrich | M9437 | n/a |
Table 2
Self-renewal (Mouse)
| Reagent | Company | Cat no | Final concentration |
|---|---|---|---|
| Advanced DMEM | ThermoFisher Scientific, Invitrogen | 12634–010 | n/a |
| Penicillin/Streptomycin | ThermoFisher Scientific, Invitrogen | 15140–122 | 100 U/ml (Pen) 100 μg/ml (Strep) |
| Hepes | ThermoFisher Scientific, Invitrogen | 15630–056 | 10 mM |
| Glutamax | ThermoFisher Scientific, Invitrogen | 35050–038 | 2 mM |
| N2 | ThermoFisher Scientific, Invitrogen | 17502–048 | 1:100 |
| B27 (-Vit A) | ThermoFisher Scientific, Invitrogen | 12587–010 | 1:50 |
| N-acetylcysteine | Sigma-Aldrich | A9165 | 1.25 mM |
| Matrigel | Corning | 356231 | Undiluted |
| R-spondin conditioned medium | Stem Cell Institute, University of Cambridge | From 293T-HA-Rspo1-Fc cell line made by Calvin Kuo, Stanford | 5% v/v |
| mEGF | R and D Systems | 2028-EG-200 | 50 ng/ml |
| Noggin | R and D Systems | 6057 NG-100 | 100 ng/ml |
| FGF10 | R and D Systems | 345-FG-025 | 100 ng/ml |
| mFGF7 | R and D Systems | 5028 KG_025 | 100 ng/ml |
| CHIR 99021 | Stem Cell Institute, University of Cambridge | n/a | 3 μM |
| SB 431542 | Tocris | 1614 | 10 μM |
Table 3
Human foetal lung mesenchyme
| Reagent | Company | Cat no | Final concentration |
|---|---|---|---|
| Dish Nunc T/C 92 mm | ThermoFisher Scientific | 10508921 | n/a |
| Type I collagen | Sigma-Aldrich | C3867-1VL | 55 μg/ml |
| Acetic acid | ThermoFisher Scientific | 10304980 | 0.02 N |
| DMEM/F12 with L-glutamine | ThermoFisher Scientific, Invitrogen | 11320–074 | n/a |
| Dispase | ThermoFisher Scientific, Invitrogen | 17105041 | 24 U/ml |
| FBS | Sigma-Aldrich | F9665 | 10% |
| Penicillin/Streptomycin | ThermoFisher Scientific, Invitrogen | 15140–122 | 100 U/ml (Pen) 100 μg/ml (Strep) |
| DNase I | Qiagen, UK | 79254 | 10 μg/ml |
| Trypsin (from porcine pancreas) | Sigma-Aldrich | T4799 | 0.1% |
Table 4
Human Bronchiolar differentiation
| Reagent | Company | Cat no | Final concentration |
|---|---|---|---|
| PneumaCultTM-ALI medium | Stem Cell Technologies | 05001 | n/a |
| Matrigel | Corning/SLS | 356231 | undiluted |
Table 5
Human Alveolar differentiation
| Reagent | Company | Cat no | Final concentration |
|---|---|---|---|
| Advanced DMEM | ThermoFisher Scientific, Invitrogen | 12634–010 | n/a |
| Penicillin/Streptomycin | ThermoFisher Scientific, Invitrogen | 15140–122 | 100 U/ml (Pen) 100 μg/ml (Strep) |
| Hepes | ThermoFisher Scientific, Invitrogen | 15630–056 | 10 mM |
| Glutamax | ThermoFisher Scientific, Invitrogen | 35050–038 | 2 mM |
| N2 | ThermoFisher Scientific, Invitrogen | 17502–048 | 1:100 |
| B27 (-Vit A) | ThermoFisher Scientific, Invitrogen | 12587–010 | 1:50 |
| N-acetylcysteine | Sigma-Aldrich | A9165 | 1.25 mM |
| Matrigel | Corning/SLS | 356231 | Undiluted |
| CHIR 99021 | Stem Cell Institute, University of Cambridge | n/a | 1 μM or 3 μM |
| FGF10 | R and D | 345-FG-025 | 100 ng/ml |
| FGF7 | Peprotech | 100–19 | 100 ng/ml |
| Dexamethasone | Sigma-Aldrich | D4902-25MG | 50 nM |
| cAMP | Sigma-Aldrich | B5386-5MG | 0.1 mM |
| IBMX | Sigma-Aldrich | I5879-100MG | 0.1 mM |
| DAPT | Sigma-Aldrich | D5942-25MG | 50 μM |
| Tri-iodothyronine (T3) | Sigma-Aldrich | T6397-100MG | 6.7 ng/ml |
| Human IGF-1 | R and D Systems | 291-G1-200 | 1 μg/ml |
| Interleukin-6 | R and D Systems | 206-IL-010 | 1 μg/ml |
Table 6
Primary antibodies
| Antibody | Company | Cat no | Host species | Final dilution | Antigen retrieval (Cryo) | Antigen retrieval (Paraffin) | Research Resource Identifier (RRID) |
|---|---|---|---|---|---|---|---|
| ABCA3 | Seven Hills Bioreagents, Cincinnati, OH | WRAB-ABCA3 | Rabbit | 1:500 | No | Yes | RRID:AB_577286 |
| Acetylated tubulin (ACT) | Sigma | T7451, clone 6-11B-1 | Mouse | 1:3000 | No | No | RRID:AB_609894 |
| AQP5 | Santa Cruz Biotechnology, Dallas, Texas | Sc9890, clone G19 | Goat | 1:100 | Yes | Yes | RRID:AB_2059877 |
| β3-TUBULIN | Biolegend (Covance), UK | PRB-435P | Rabbit | 1:1000 | No | N/A | RRID:AB_291637 |
| CD90 | Novus Biologicals, UK | NBP2-37330 (clone 7E1B11) | Mouse | 1:200 | No | N/A | RRID:AB_2665376 |
| E-CADHERIN | ThermoFisher Scientific Invitrogen | 13–1900 | Rat | 1:3000 | No | N/A | RRID:AB_2533005 |
| E-CADHERIN | BD Biosciences, UK | 610182 | Mouse | 1:500 | No | Yes (citrate) | RRID:AB_397581 |
| ETV5 | Santa Cruz Biotechnology | Sc-22807 | Rabbit | 1:200 | Yes | N/A | RRID:AB_2101008 |
| FGFR2 | Santa Cruz Biotechnology | SC-122 | Rabbit | 1:200 | No | N/A | RRID:AB_631509 |
| FOXA2 | Santa Cruz Biotechnology | SC-6554 | Goat | 1:200 | No | N/A | RRID:AB_2262810 |
| FOXJ1 | Thermo Fisher Scientific | 14-9965-82 | Mouse | 1:200 | Yes | Yes (citrate); needs streptavidin-biotin amplification | RRID:AB_1548835 |
| HMGA1B | R and D Systems, UK | AF5956 | Sheep | 1:50 | Yes | N/A | RRID:AB_1964602 |
| HMGA2 | Proteintech, UK | 20795–1-AP | Rabbit | 1:100 | No | N/A | RRID:AB_2665377 |
| HNF1B | Proteintech | 12533–1-AP | Rabbit | 1:100 | Yes | N/A | RRID:AB_2116758 |
| HOPX | Santa Cruz Biotechnology | SC-30216 | Rabbit | 1:50 | No | Yes (citrate) | RRID:AB_2120833 |
| HTI-56 | Gift from Leland Dobbs | n/a | Mouse | 1:100 | No | N/A | RRID:AB_2665380 |
| HTII-280 | Gift from Leland Dobbs | n/a | Mouse IgM | 1:100 | No | No | RRID:AB_2665381 |
| Human Nuclei (HuNu) | Merck, UK | MAB1281 | Mouse | 1:3000 | No (needs streptavidin-biotin amplification) | N/A | RRID:AB_11212527 |
| ID2 | Abcam, UK | Ab52093 | Rabbit | 1:200 | Yes | N/A | RRID:AB_880731 |
| KRT5 | Covance | PRB-160P-100 | Rabbit | 1:500 | No | Yes (citrate) | RRID:AB_291581 |
| KI67 | BD Transduction Laboratories, UK | 550609, clone B56 | Mouse | 1:100 | No | Yes (citrate) | RRID:AB_393778 |
| LPCAT1 | Proteintech | 16112–1-AP | Rabbit | 1:500 | No | Yes (citrate) | RRID:AB_2135554 |
| MUC5AC | ThermoFisher Scientific | MS-145P | Mouse | 1:500 | No | Yes (citrate) | RRID:AB_62731 |
| NKX2-1 | Abcam | Ab76013 | Rabbit | 1:500 | Yes | Yes (citrate) | RRID: AB_1310784 |
| PDGFRA | Cell Signalling | 3174 (clone D1E1E) | Rabbit | 1:1000 | No | N/A | RRID:AB_2162345 |
| PDGFRB | Cell Signalling | 3169 (clone 28E1) | Rabbit | 1:100 | No | N/A | RRID:AB_2162497 |
| PDPN | Proteintech | 11629–1-AP | Rabbit | 1:200 | No | Yes | RRID:AB_2162067 |
| PDPN | R and D Systems | AF3670 | Sheep | 1:200 | No | Yes | RRID:AB_2162070 |
| PECAM (CD31) | Abcam | Ab9498 | Mouse | 1:200 | No | N/A | RRID:AB_307284 |
| SCGB1A | Santa Cruz Biotechnology | SC-25555 | Rabbit | 1:200 | No | Yes (citrate or trypsin) | RRID:AB_2269914 |
| pro-SFTPC | Millipore, UK | Ab3786 | Rabbit | 1:500 | No | Yes (citrate) | RRID:AB_91588 |
| SMA | Sigma | A5228, clone 1A4 | Mouse | 1:500 | No | N/A | RRID:AB_262054 |
| SOX2 | Santa Cruz Biotechnology | SC-17320 | Goat | 1:250 | No/Yes | Yes (citrate) | RRID:AB_2286684 |
| SOX9 | Santa Cruz Biotechnology | SC-20095 | Rabbit | 1:200 | No | Yes (citrate) | RRID:AB_661282 |
| SOX9 | Abcam | ab196450 | Rabbit | 1:200 | No | N/A | RRID:AB_2665383 |
| SPRY2 | Abcam | ab50317 | Rabbit | 1:200 | Yes | N/A | RRID:AB_882688 |
| TP63 | Cell Signaling | 13109 | Rabbit | 1:200 | Yes | Yes (citrate); needs streptavidin-biotin amplification | RRID:AB_2637091 |
| VECAD | R and D Systems | AF938 | Goat | 1:400 | No | N/A | RRID:AB_355726 |
Table 7
Secondary antibodies
| Antibody | Company | Cat no | Final dilution | Research Resource Identifier (RRID) |
|---|---|---|---|---|
| Donkey α-mouse 488 | Thermo Fisher Scientific | A21202 | 1:2000 | RRID:AB_141607 |
| Donkey α-rabbit 488 | Thermo Fisher Scientific | A21206 | 1:2000 | RRID:AB_2535792 |
| Donkey α-rat 488 | Thermo Fisher Scientific | A21208 | 1:2000 | RRID:AB_2535794 |
| Donkey α-mouse 546 | Thermo Fisher Scientific | A10036 | 1:2000 | RRID:AB_2534012 |
| Donkey α-rabbit 546 | Thermo Fisher Scientific | A10040 | 1:2000 | RRID:AB_2534016 |
| Donkey α-goat 555 | Thermo Fisher Scientific | A21432 | 1:2000 | RRID:AB_2535853 |
| Donkey α-rat 594 | Thermo Fisher Scientific | A21209 | 1:2000 | RRID:AB_2535795 |
| Donkey α-sheep 594 | Jackson Immunoresearch, West Grove, PA | 713-585-147 | 1:2000 | RRID:AB_2340748 |
| Donkey α-mouse 647 | Thermo Fisher Scientific | A31571 | 1:2000 | RRID:AB_162542 |
| Donkey α-rabbit 647 | Thermo Fisher Scientific | A31573 | 1:2000 | RRID:AB_2536183 |
| Goat α-rat 647 | Thermo Fisher Scientific | A21247 | 1:2000 | RRID:AB_141778 |
| Streptavidin 594 | Jackson Immunoresearch | 016-580-084 | 1.8 μg/ml | RRID:AB_2337250 |
| Biotin-SP-conjugated Donkey α-mouse | Jackson Immunoresearch | 715-065-150 | 1:500 | RRID:AB_2307438 |
Table 8
RT-PCR primers
| TaqMan primer | Company | Cat no | Id no |
|---|---|---|---|
| GAPDH | Thermo Fisher Scientific | # 4326317E | n/a |
| SOX2 | Thermo Fisher Scientific | # 4331182 | Hs01053049_s1 |
| SOX9 | Thermo Fisher Scientific | # 4331182 | Hs01001343_g1 |
| TBX4 | Thermo Fisher Scientific | # 4331182 | Hs00218515_m1 |
Table 9
Published whole foetal lung RNAseq (Bernstein et al., 2010).
| Sample label | Description | Source | Donor ID | Accession # |
|---|---|---|---|---|
| Lung_A_6 | Foetal day 105 | GEO Datasets | H-24005 | GSM1101693 |
| Lung_F_2 | Foetal day 105 | GEO Datasets | H-24111 | GSM1101708 |
| Lung_F_3 | Foetal day 108 | GEO Datasets | H-23887 | GSM1101684 |
| Lung_F_4 | Foetal day 91 | GEO Datasets | H-23914 | GSM1101685 |
| Lung_F_5 | Foetal day 96 | GEO Datasets | H-24089 | GSM1101699 |
| Lung_F_6 | Foetal day 98 | GEO Datasets | H-23964 | GSM1101687 |
Additional files
-
Supplementary file 1
Transcription factors and signalling molecules differentially expressed in human tip versus stalk (related to Figure 2F–L).
- https://doi.org/10.7554/eLife.26575.045
-
Supplementary file 2
Transcription Factors with mouse orthologues upregulated > 2 fold in human tips or stalks: evidence for mouse expression pattern (related to Figure 2J and L).
- https://doi.org/10.7554/eLife.26575.046
Download links
A two-part list of links to download the article, or parts of the article, in various formats.
Downloads (link to download the article as PDF)
Open citations (links to open the citations from this article in various online reference manager services)
Cite this article (links to download the citations from this article in formats compatible with various reference manager tools)
Human embryonic lung epithelial tips are multipotent progenitors that can be expanded in vitro as long-term self-renewing organoids
eLife 6:e26575.
https://doi.org/10.7554/eLife.26575


