Figures
Figure 1 with 1 supplement
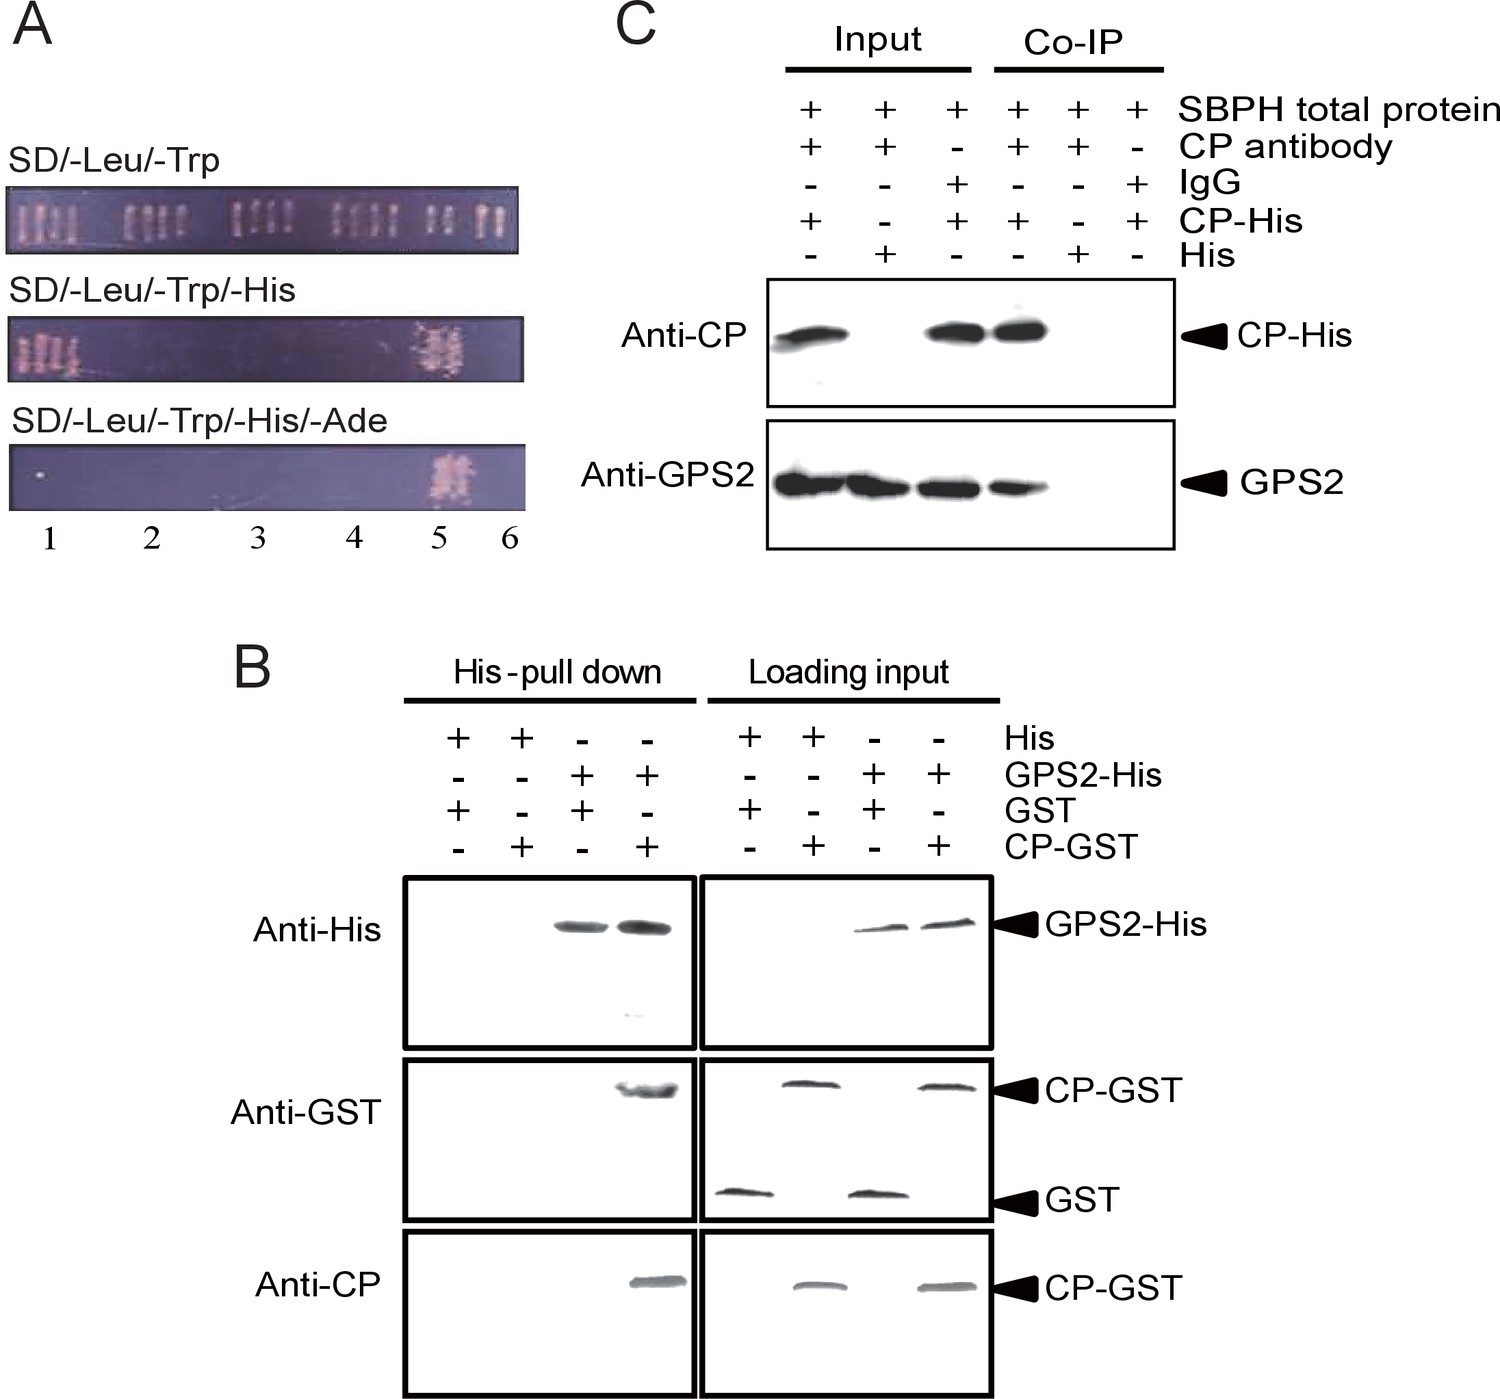
Small brown planthopper GPS2 binds Rice Stripe Virus capsid protein.
(A) GPS2 binds CP in yeast two-hybrid assays. (1) pDBLeu-CP and pDEST22-GPS2; (2) pDBLeu-CP and pDEST22, self activation; (3) pDBLeu and pDEST22-GPS2, self activation; (4) pDBLeu and pDEST22, negative control; (5) pGBKT7-53 and pGADT7, positive control; (6) pGBKT7-Lam and pGADT7, negative control. Interaction between pDBLeu-CP and pDEST22-GPS2 was observed only on the SD/–Leu/–Trp/–His medium. (B) His-tag pull-down assay. Recombinantly expressed GPS2-His was bound to Ni Sepharose as a bait to hook the prey protein, recombinantly expressed CP-GST. The products from His vector (pET28a) and GST vector (pGEX-3X) were applied as negative controls. Anti-His, anti-GST, or anti-CP antibody was used to detect proteins. (C) Co-immunoprecipitation (CoIP) for recombinantly expressed CP-His and GPS2 from non-viruliferous planthopper total proteins. For (B) and (C), three independent biological replicates were carried out for each experiment.
Figure 1—figure supplement 1
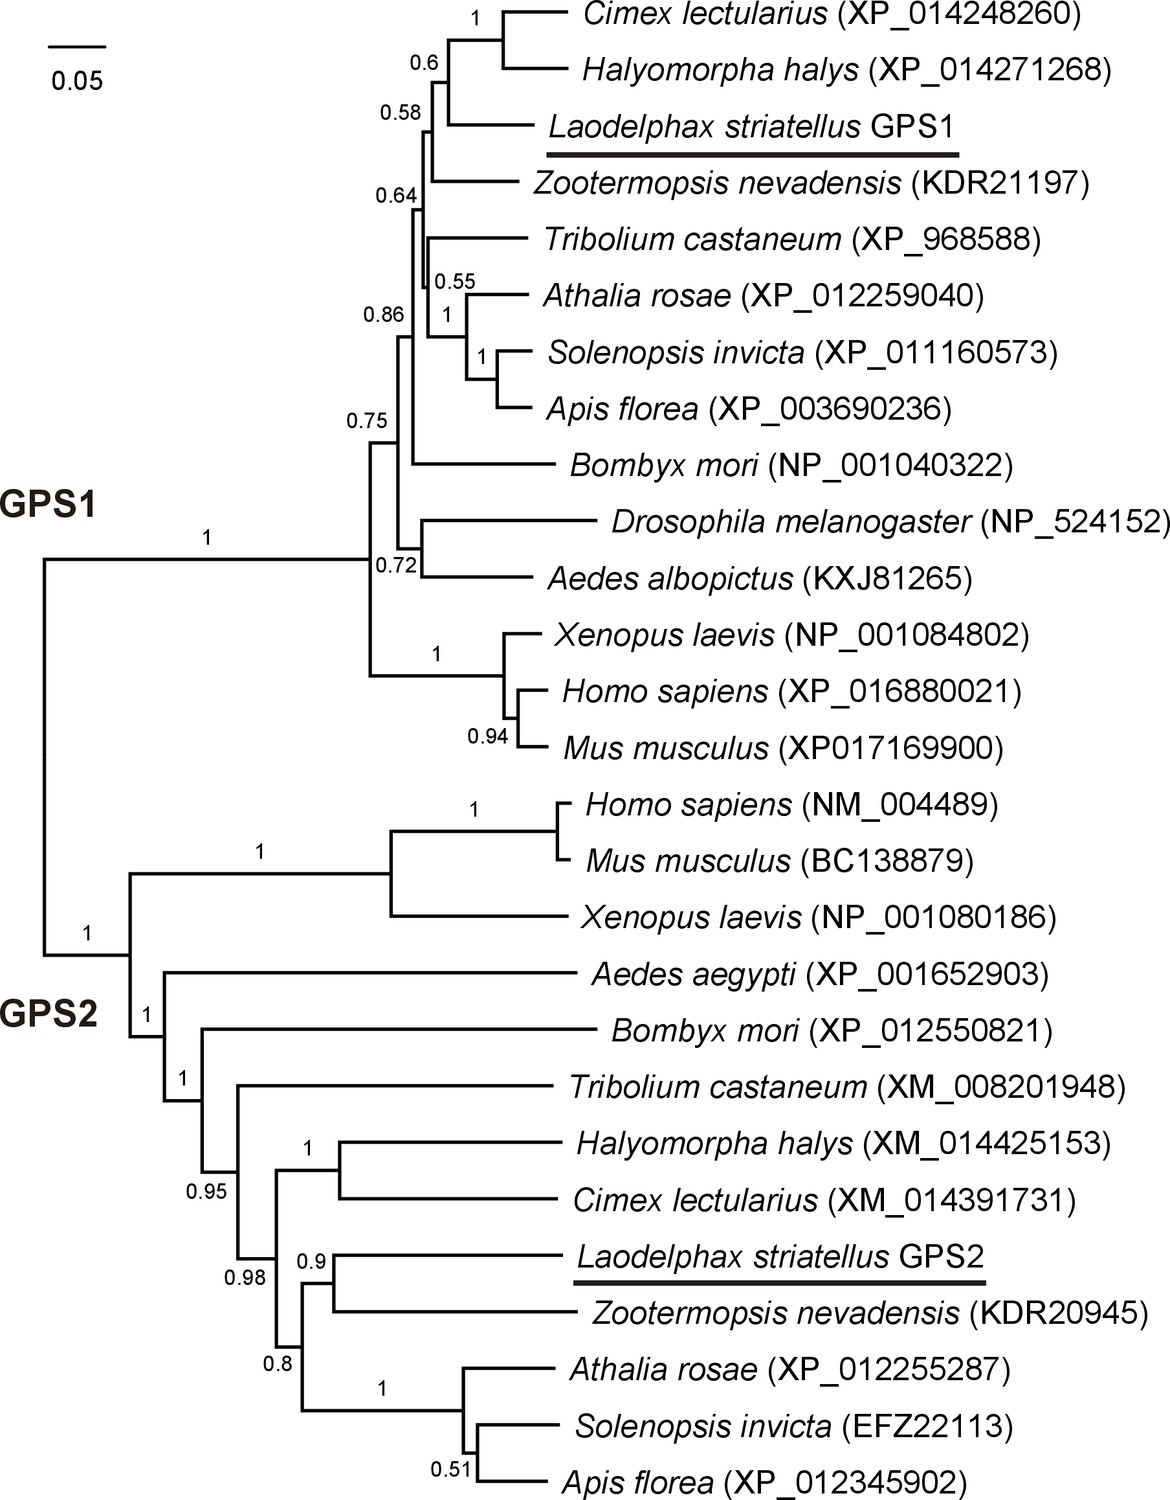
Phylogenetic tree of planthopper GPS2 and GPS1 proteins and those from other insect species.
The neighbor-joining method (pairwise deletion and p-distance model) was used in Mega 6.06 software. Bootstrap analysis (1000 replicates) was applied to evaluate the internal support for the tree topology.
Figure 2 with 2 supplements
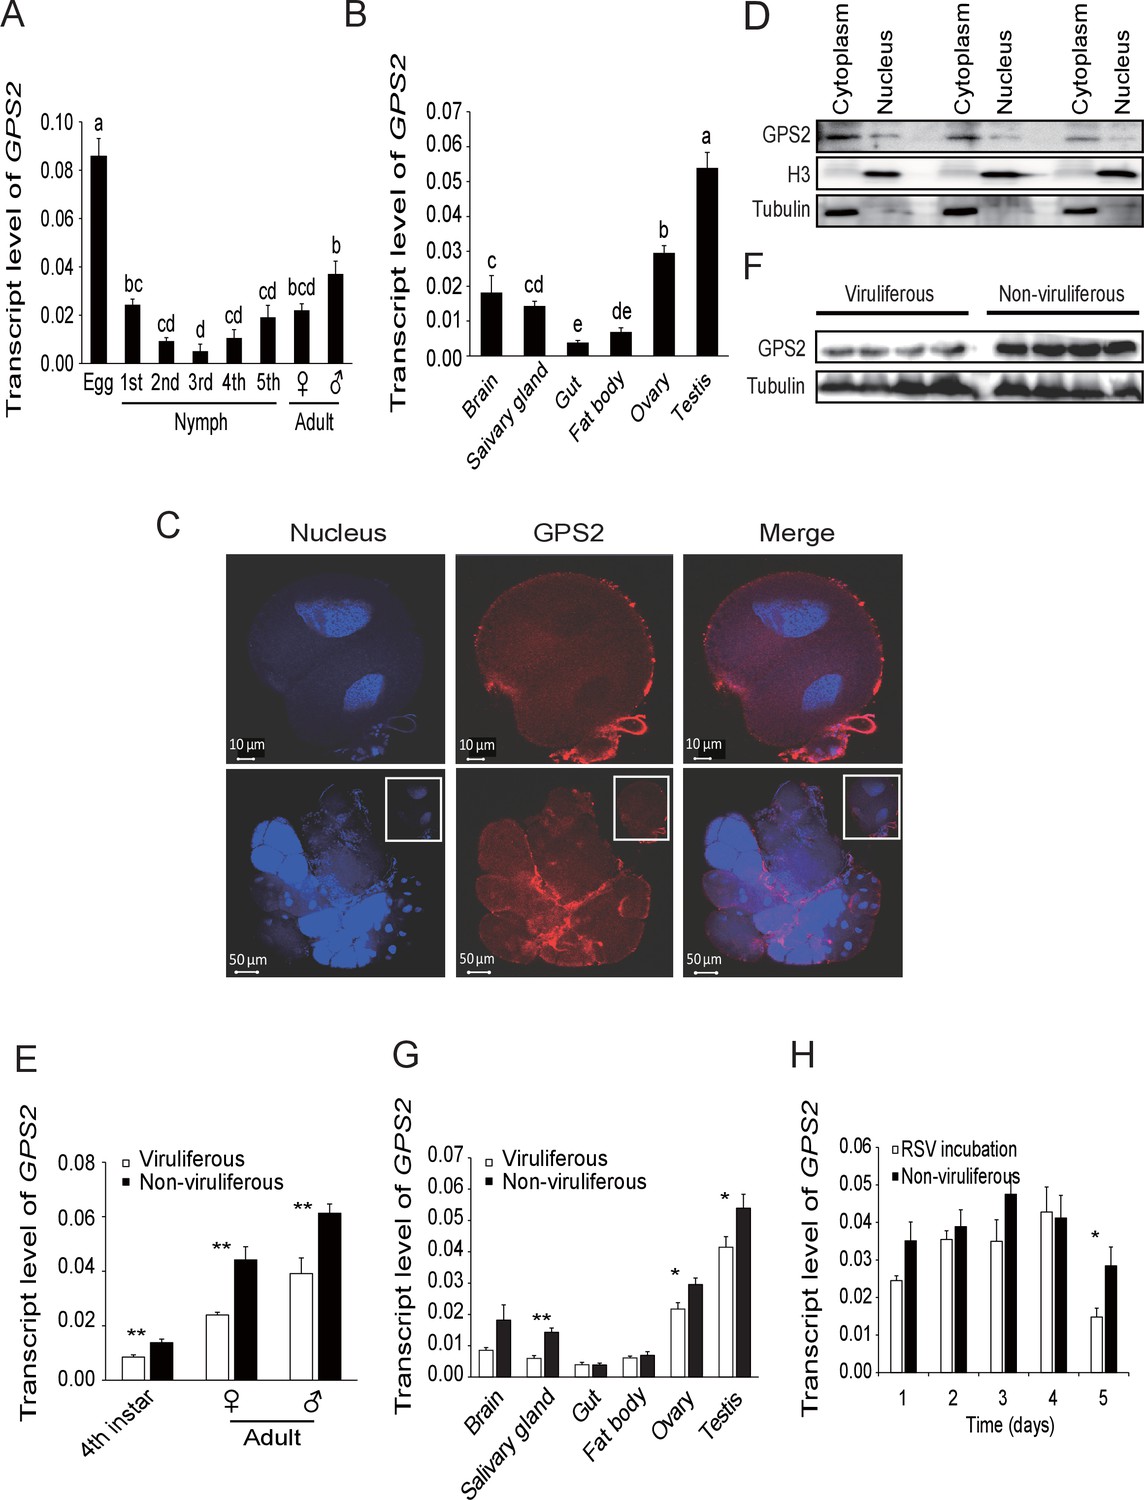
Temporal, spatial and subcellular expression of GPS2 in the planthopper.
(A) Relative transcript levels of GPS2 throughout the developmental stages of non-viruliferous planthoppers. (B) Relative transcript levels of GPS2 in various tissues of non-viruliferous planthoppers. The transcript levels of GPS2 are normalized to that of the ef2 transcript. Different letters indicate significant differences in Tukey’s multiple comparison test. (C) Subcellular localization of GPS2 in the salivary gland cells of non-viruliferous planthoppers revealed by an anti-human GPS2 polyclonal antibody in immunohistochemistry. Red is the positive signal. Nuclei are stained blue. (D) Western blotting showing GPS2 in the nuclei and cytoplasm of cells in insect whole-body samples. Reference proteins for nuclear and cytoplasmic proteins were histone H3 and tubulin, respectively, which were displayed using an anti-human H3 monoclonal antibody and an anti-human tubulin monoclonal antibody. (E) Comparison of relative transcript levels of GPS2 between viruliferous and non-viruliferous fourth instar nymphs, females and males. (F) Western blotting showing GPS2 protein in fourth instar nymphs of viruliferous and non-viruliferous planthoppers. (G) Comparison of relative transcript levels of GPS2 between the viruliferous and non-viruliferous various tissues. (H) Relative transcript levels of GPS2 when RSV is incubated within the insects for five days. *p<0.05; **p<0.01.
-
Figure 2—source data 1
Numerical data that are represented as graphs in Figure 2A,B,E,G,H.
- https://doi.org/10.7554/eLife.26591.006
Figure 2—figure supplement 1
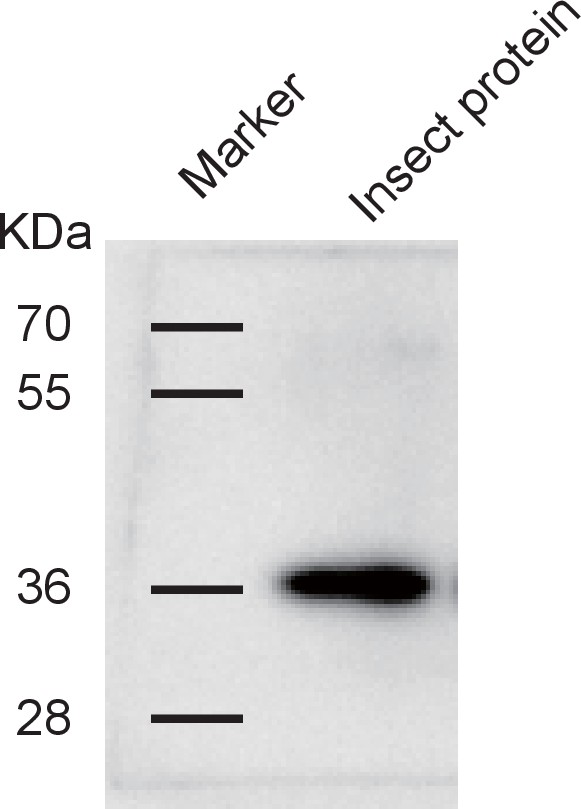
Western blotting to show the specificity of the anti-human GPS2 polyclonal antibody for recognizing planthopper GPS2.
Total proteins were extracted from non-viruliferous fourth instar planthoppers using T-PER Tissue Protein Extraction Reagent, containing a protease inhibitor cocktail.
Figure 2—figure supplement 2
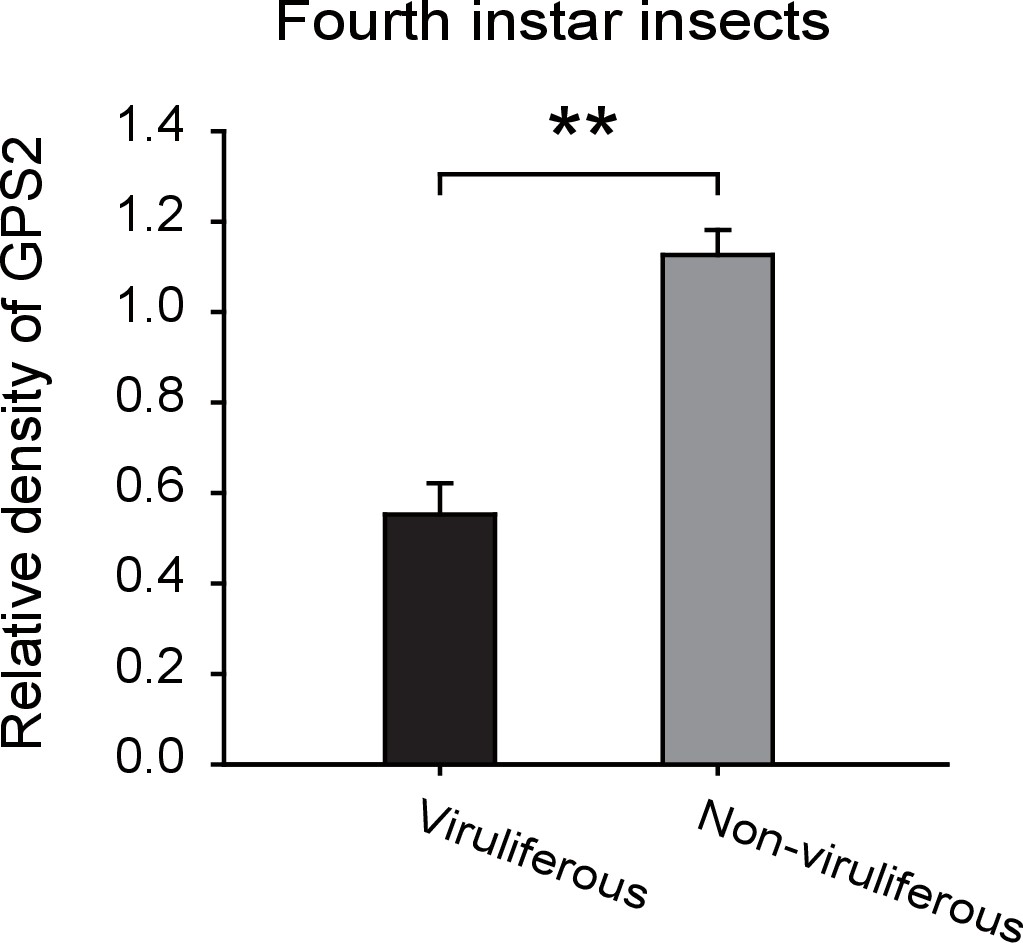
Densitometry analysis for the GPS2 image bands from Figure 2F.
The relative densities of GPS2 were normalized with those of tubulin and presented as mean ± SE. **p<0.01.
Figure 3 with 3 supplements
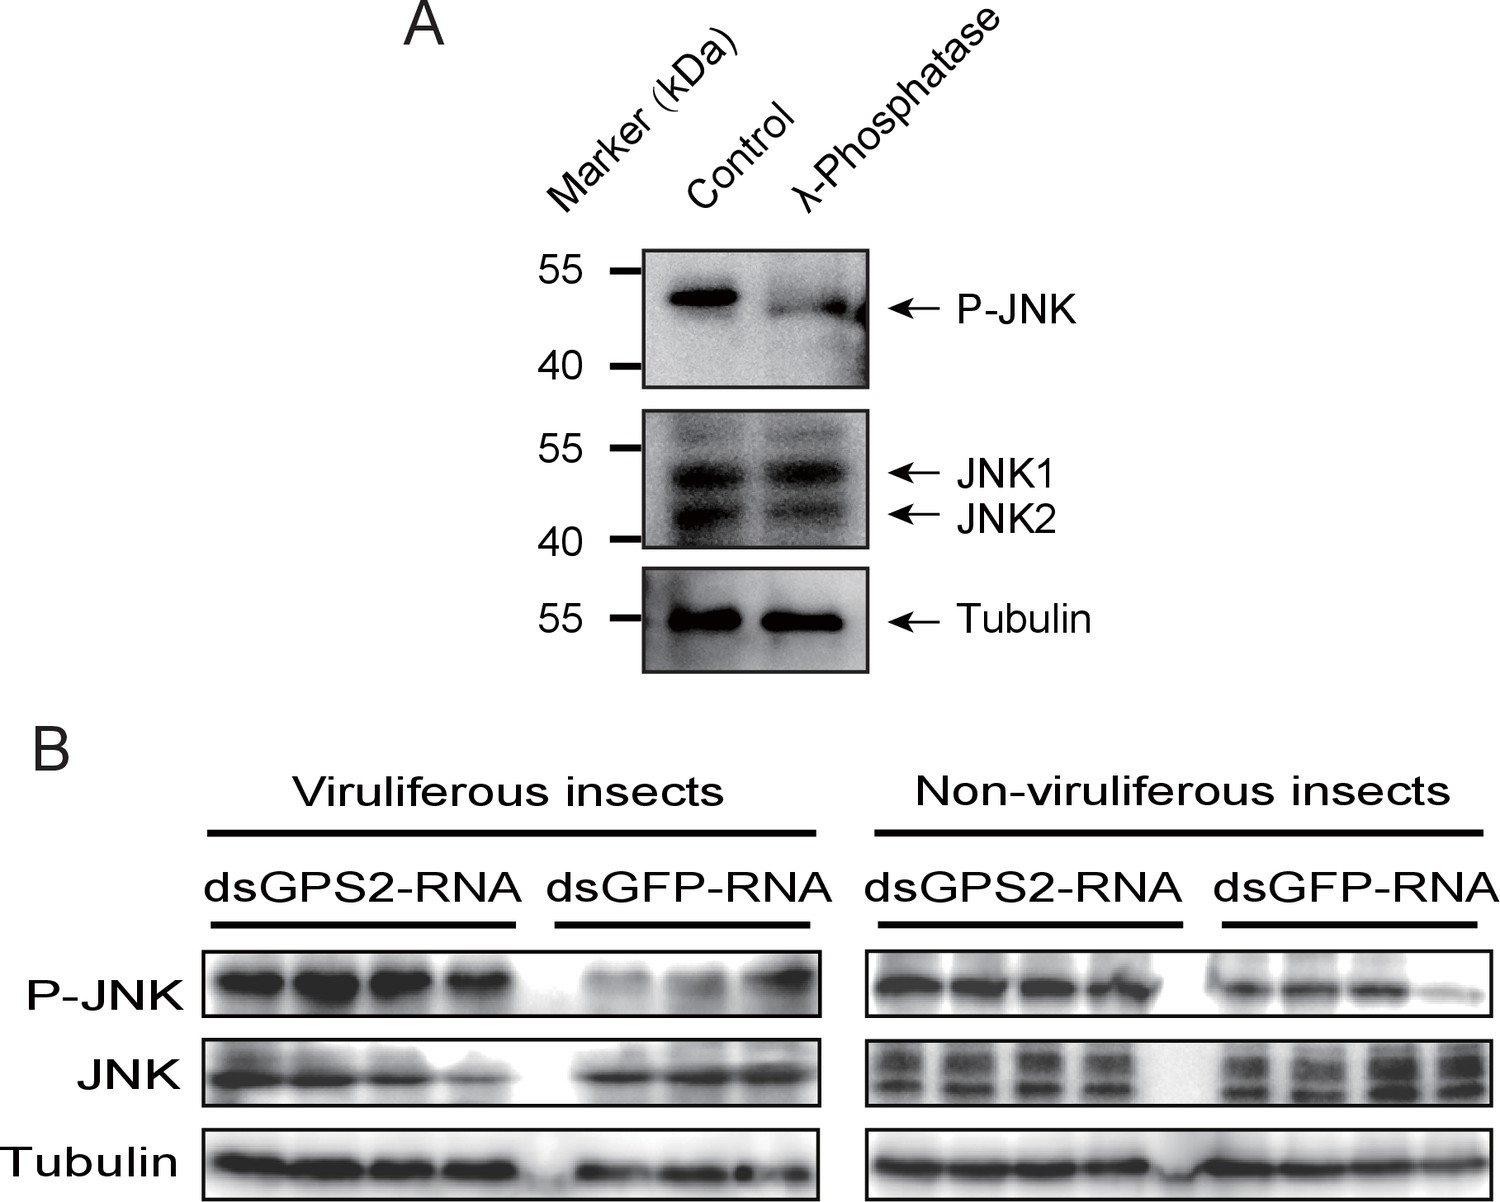
GPS2 represses JNK activation in the planthopper.
(A) Western blot of the phosphorylated JNK (P-JNK) and total JNKs in non-viruliferous fourth instar planthoppers before and after the treatment with λ-phosphatase. Total protein was incubated with λ-phosphatase for 1 hr at 30°C. Three independent biological replicates were carried out. Here we show one representative result. (B) Western blotting showing P-JNK in viruliferous or non-viruliferous fourth instar nymphs when dsGPS2-RNA was injected. Levels were determined 3 d after injections. dsGFP–RNA injection was used as control. The P-JNK, total JNKs, and tubulin were detected using an anti-phospho-human JNK2 antibody, an anti-human JNK2 polyclonal antibody, and an anti-human tubulin monoclonal antibody, respectively.
Figure 3—figure supplement 1
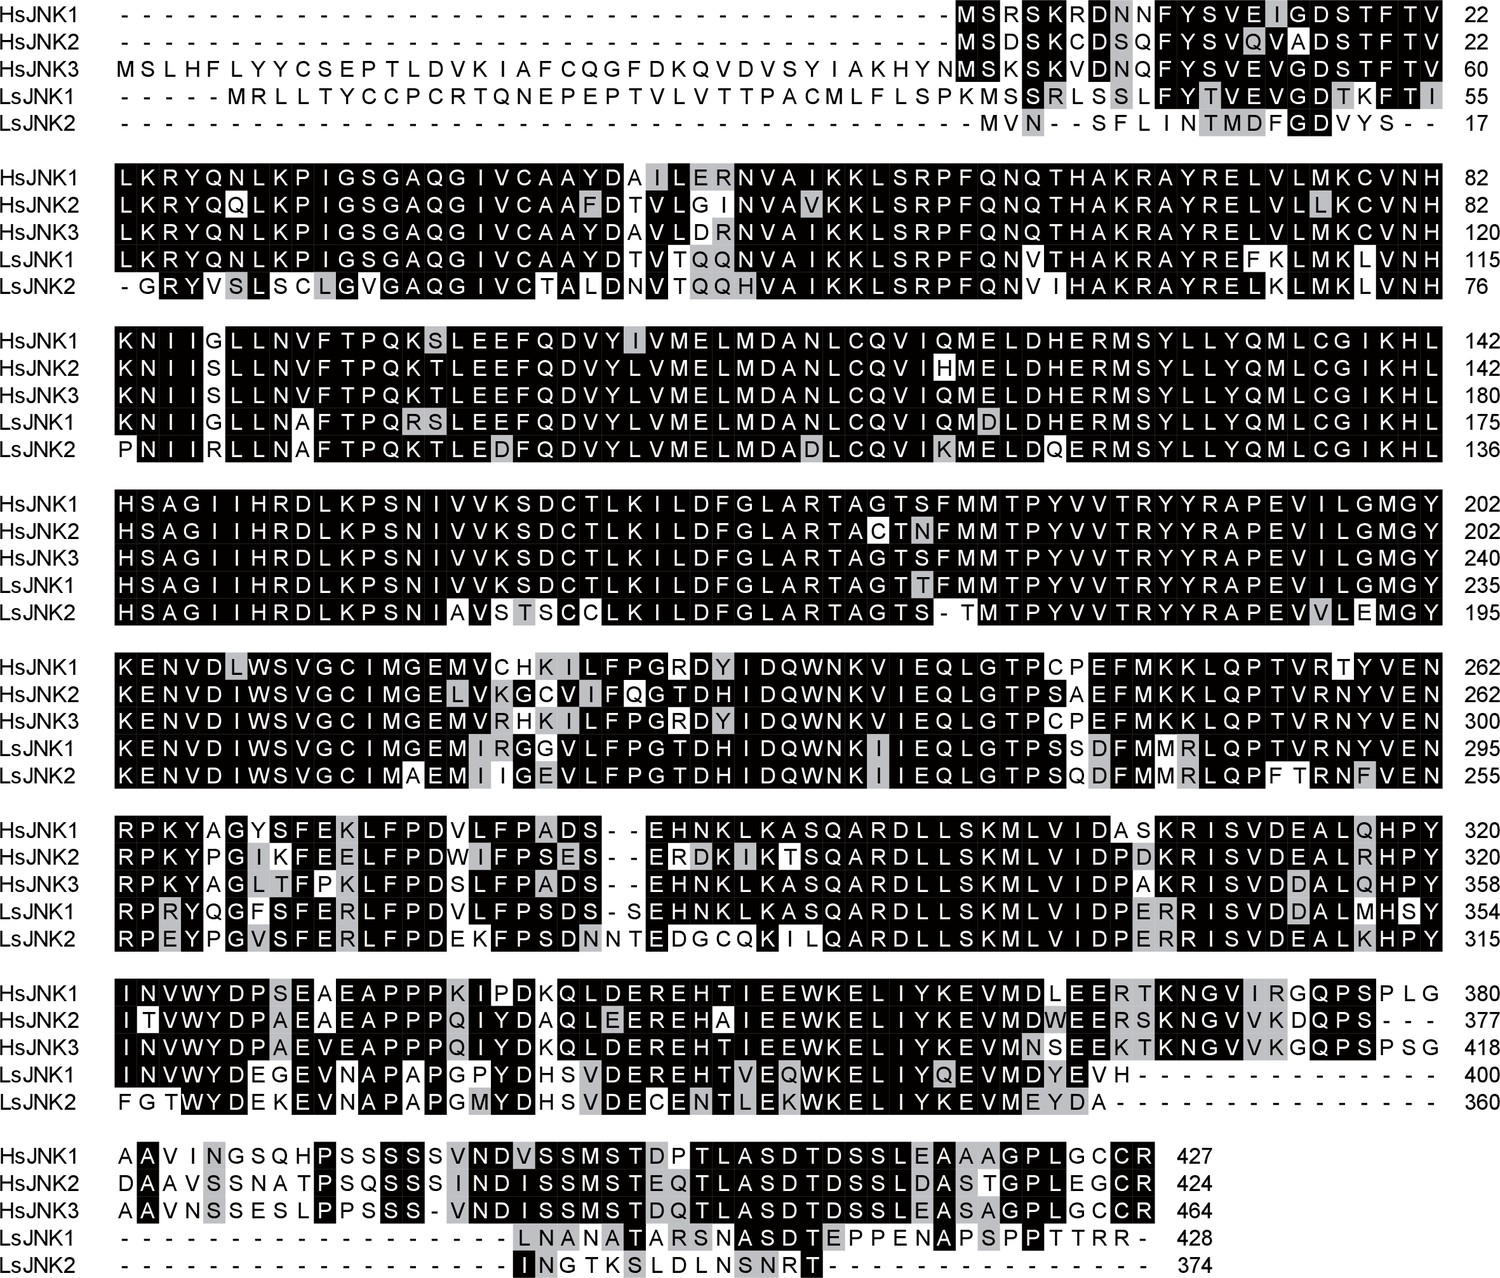
Amino acid sequence alignments of planthopper JNKs (LsJNK1 and LsJNK2) and human JNKs (HsJNK1, HsJNK2, HsJNK3).
https://doi.org/10.7554/eLife.26591.010
Figure 3—figure supplement 2
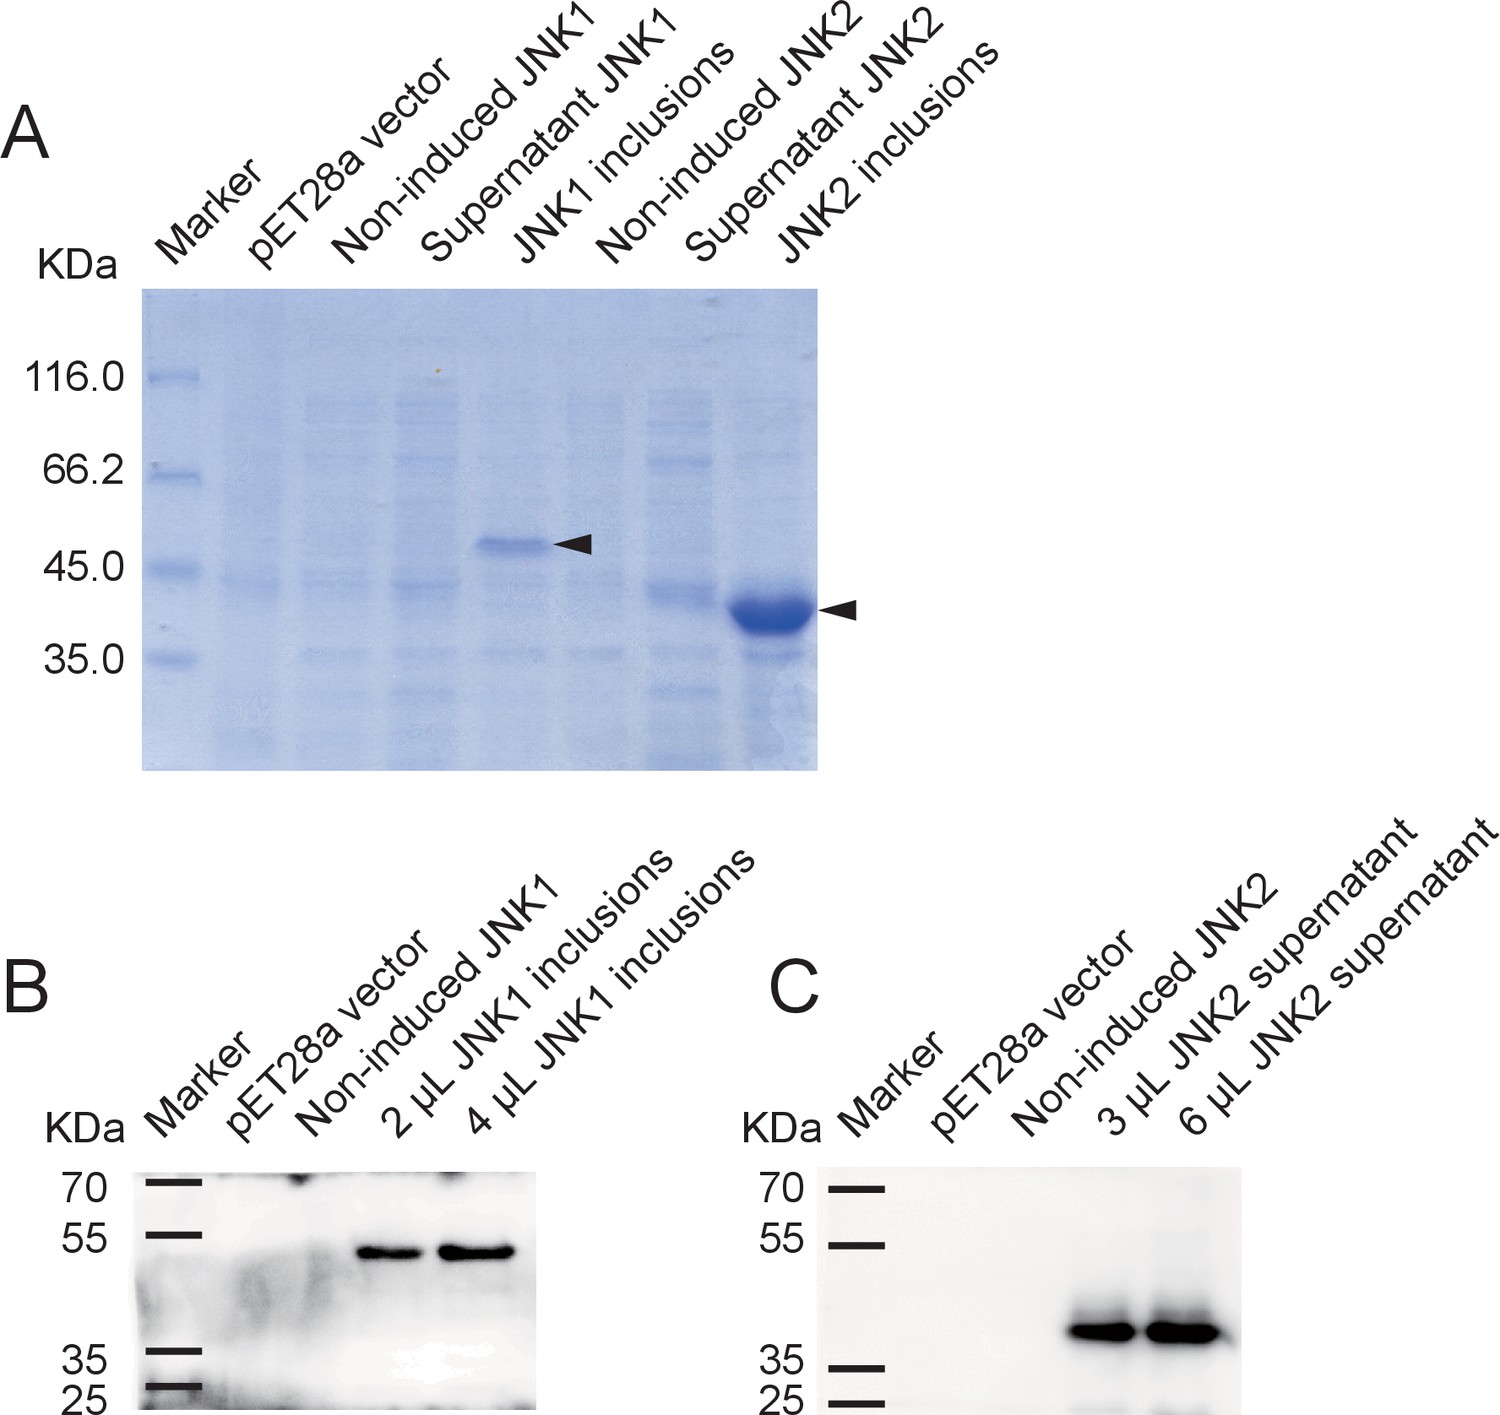
Recombinant expression of planthopper JNK1 and JNK2 for specificity verification of the anti-human JNK2 polyclonal antibody.
(A) SDS-PAGE showed the recombinant expression of JNK1 and JNK2 in E. coli. Arrows indicate the target proteins. (B) and (C) Western blot analysis of JNK1 and JNK2 using the anti-human JNK2 polyclonal antibody. JNK1 inclusions and supernatant JNK2 were applied. The 51-kD recombinant JNK1 and 44-kD recombinant JNK2 were revealed.
Figure 3—figure supplement 3
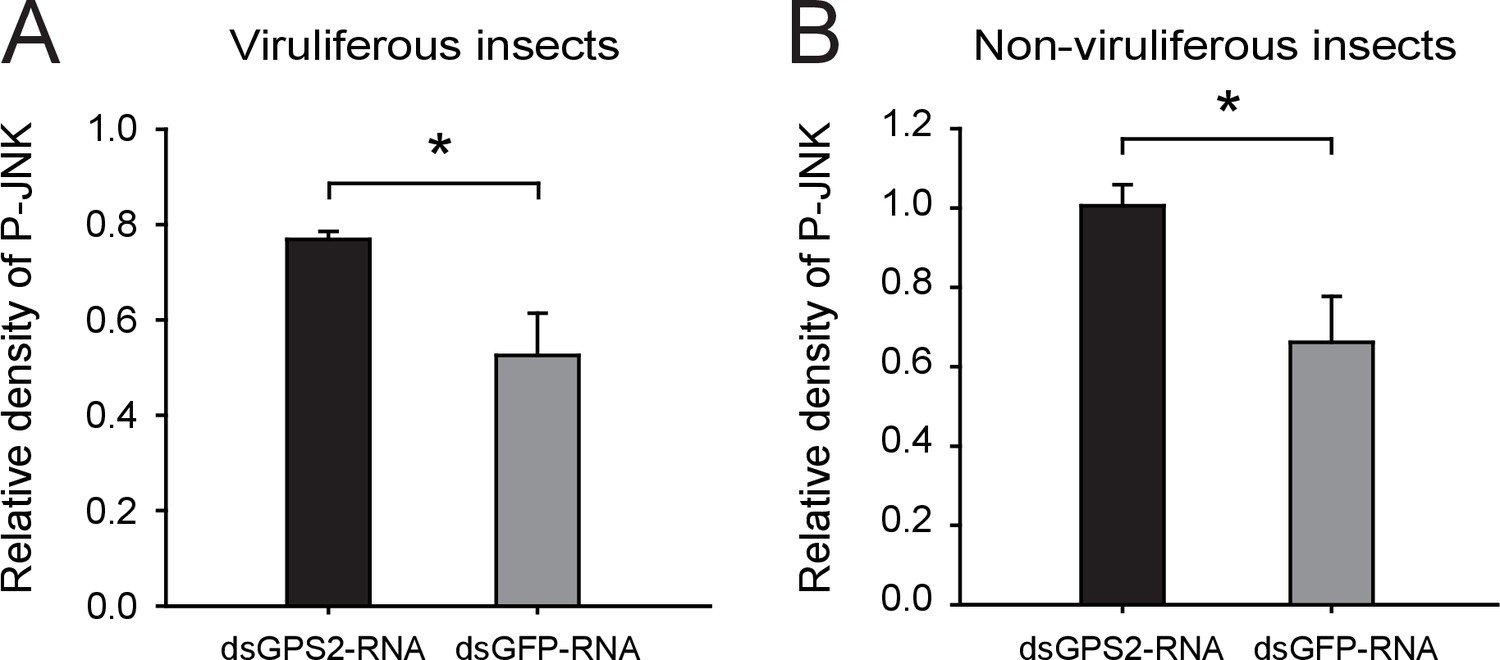
Densitometry analysis for the phosphorylated JNK (P-JNK) image bands from Figure 3B.
The relative densities of P-JNK were normalized with those of tubulin and presented as mean ± SE. *p<0.05.
Figure 4 with 3 supplements
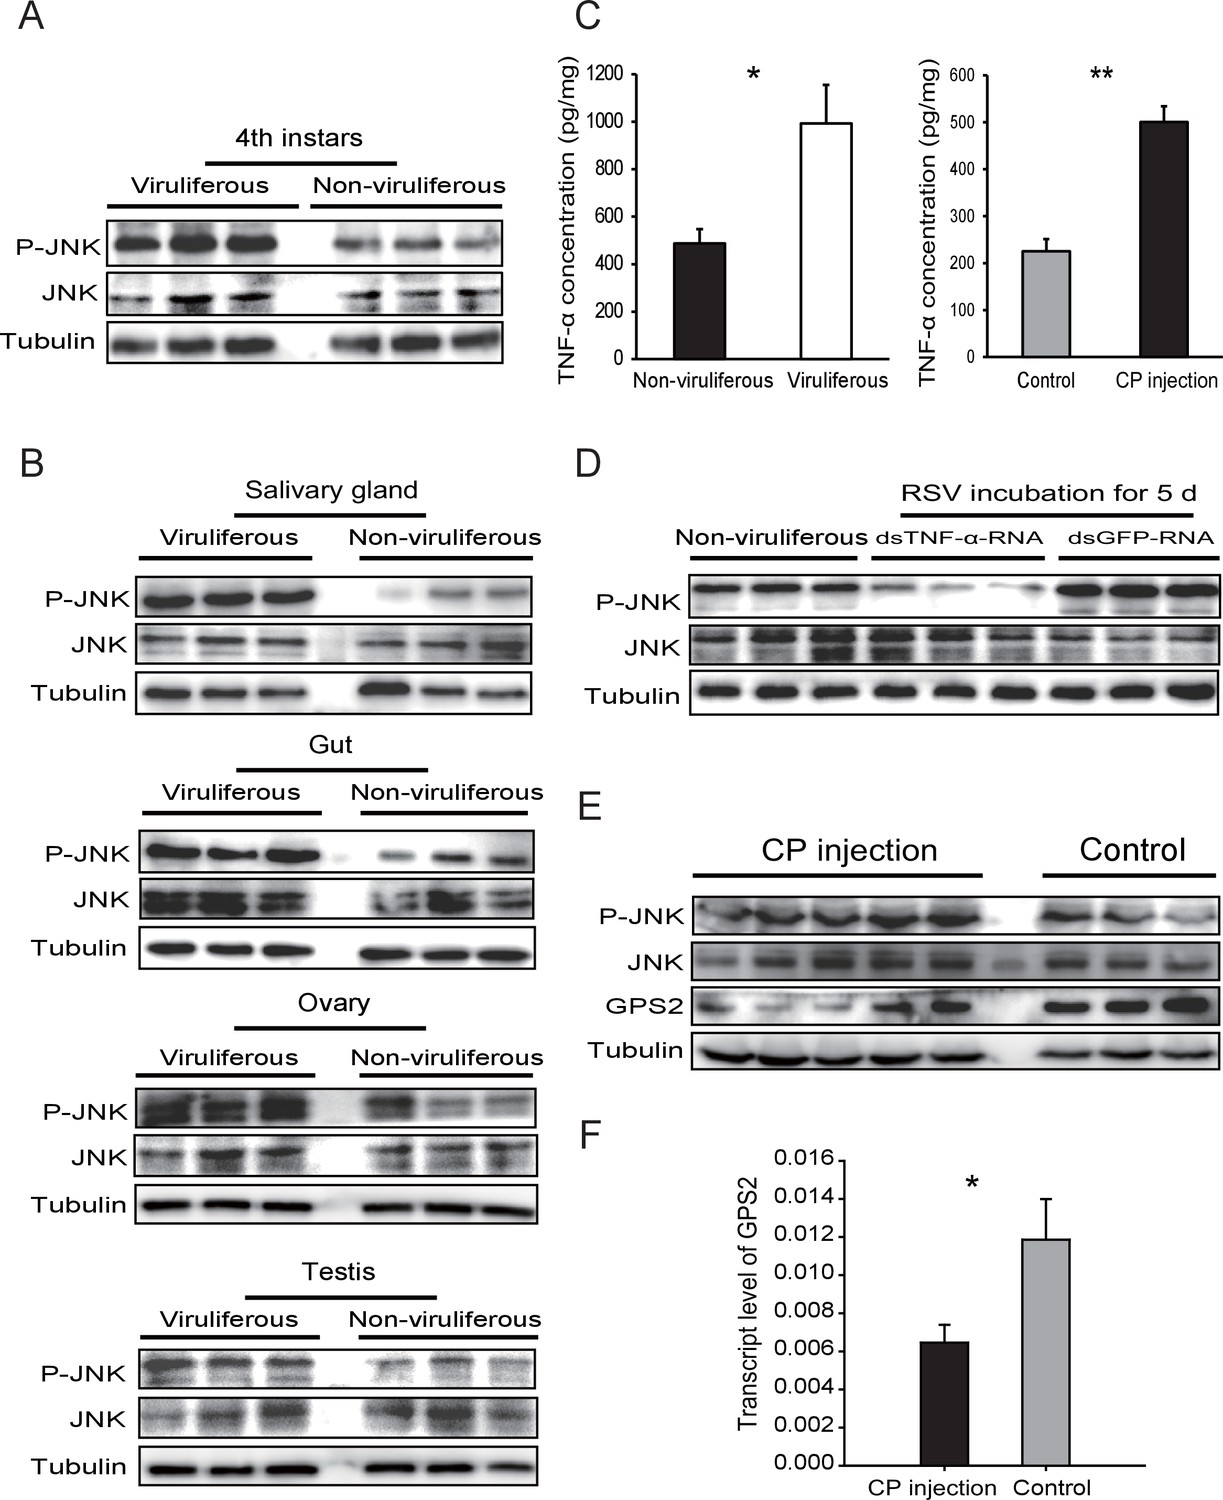
Rice stripe virus activates the JNK signaling pathway.
(A) Western blotting showing the phosphorylated JNK (P-JNK) in the fourth instar nymphs of viruliferous and non-viruliferous planthoppers. (B) Western blotting showing the P-JNK in salivary gland, gut, ovary, and testis of viruliferous and non-viruliferous planthoppers. (C) The TNF-α levels in the fourth instar nymphs of viruliferous and non-viruliferous planthoppers, or in CP-His-protein-injected non-viruliferous insects and negative control groups, determined using a human TNF-α ELISA Kit. (D) Western blotting showing the P-JNK in the fourth instar nymphs when dsTNF-α-RNA was injected and RSV was incubated in insects for five days. (E) Western blotting showing the P-JNK and GPS2 in non-viruliferous fourth instar nymphs at 24 hr after CP-His protein injection. The control insects were injected with purified products from pET28a vector. (F) Relative transcript levels of GPS2 after CP-His protein injection. The P-JNK, total JNK, GPS2, and tubulin were detected using an anti-phospho-human JNK2 polyclonal antibody, an anti-human JNK2 polyclonal antibody, an anti-human GPS2 polyclonal antibody, and an anti-human tubulin monoclonal antibody, respectively. *p<0.05; **p<0.01.
-
Figure 4—source data 1
Numerical data that are represented as graphs in Figure 4C,F.
- https://doi.org/10.7554/eLife.26591.014
Figure 4—figure supplement 1
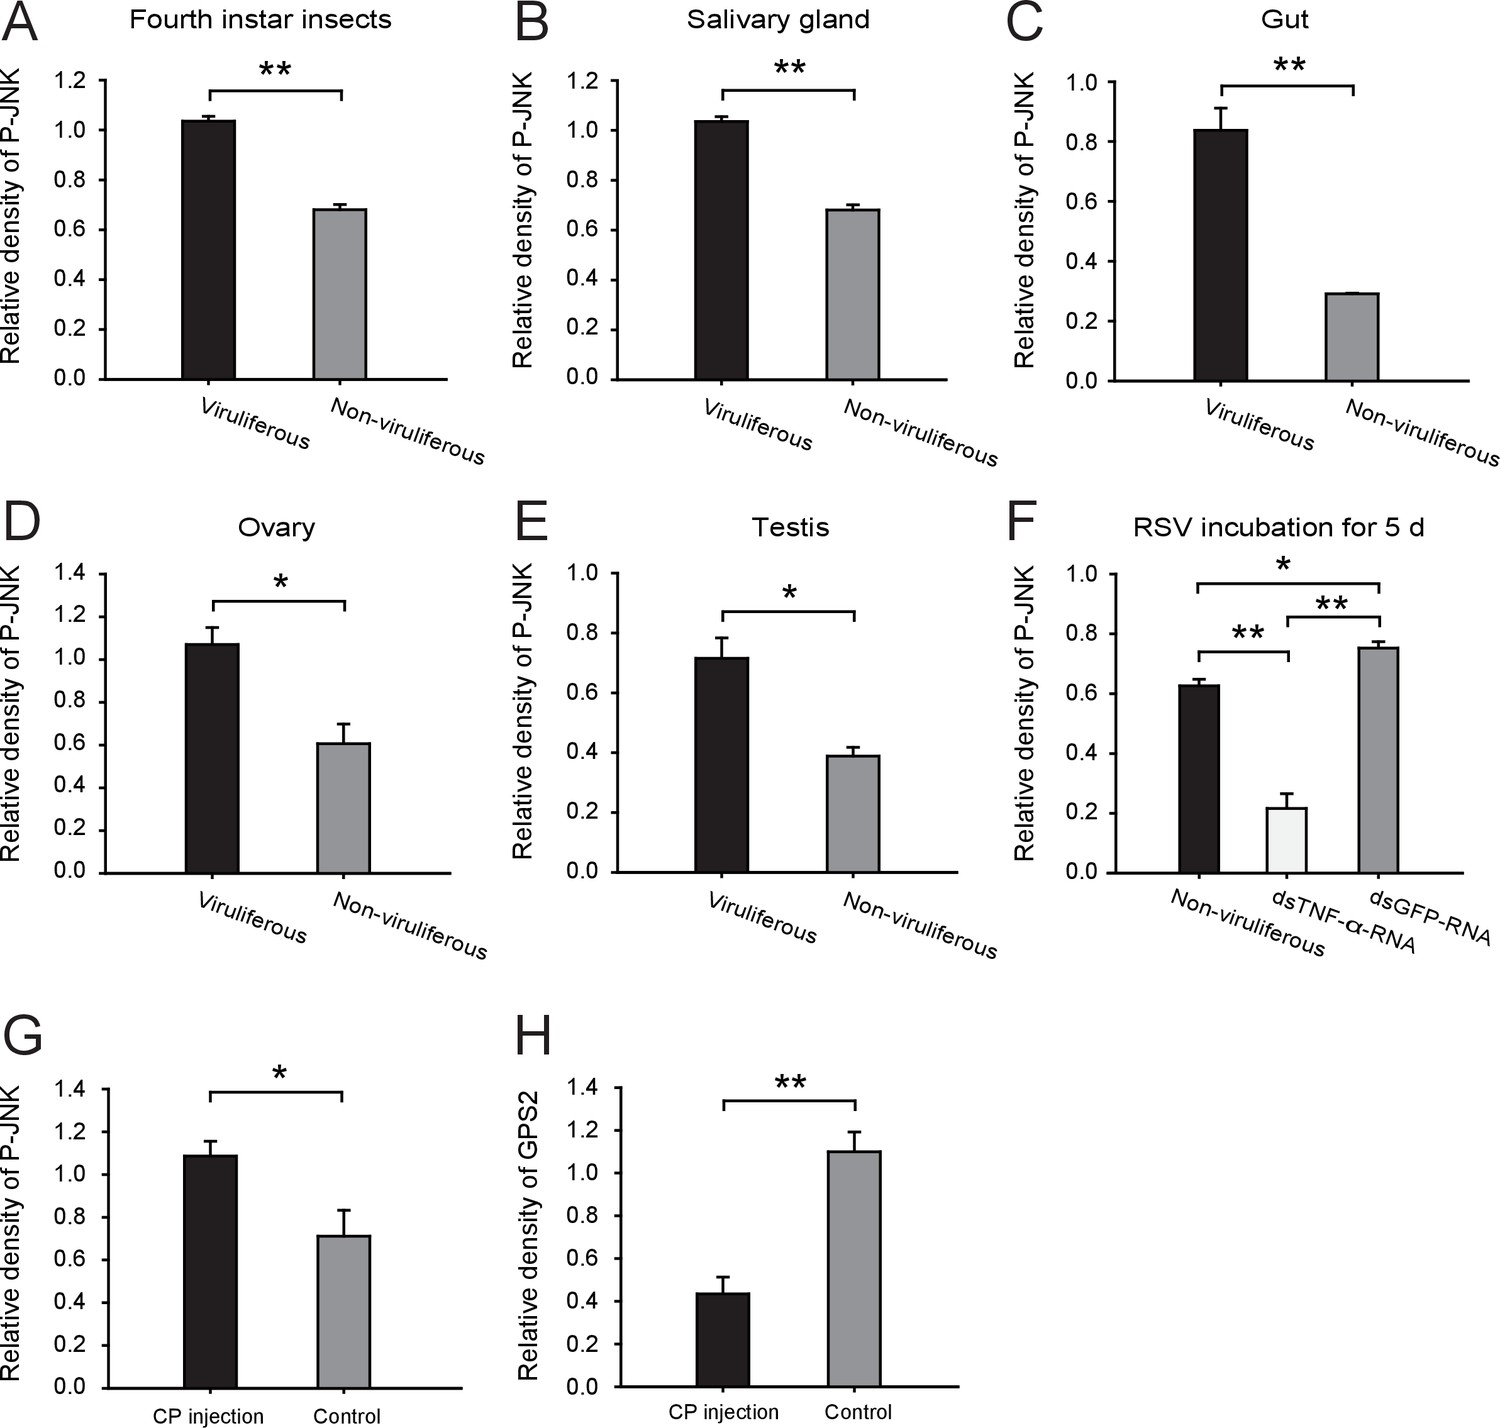
Densitometry analysis for the phosphorylated JNK (P-JNK) and GPS2 image bands from Figures 4A, B, D and E.
The relative densities of P-JNK and GPS2 were normalized with those of tubulin and presented as mean ± SE. *p<0.05; **p<0.01.
Figure 4—figure supplement 2
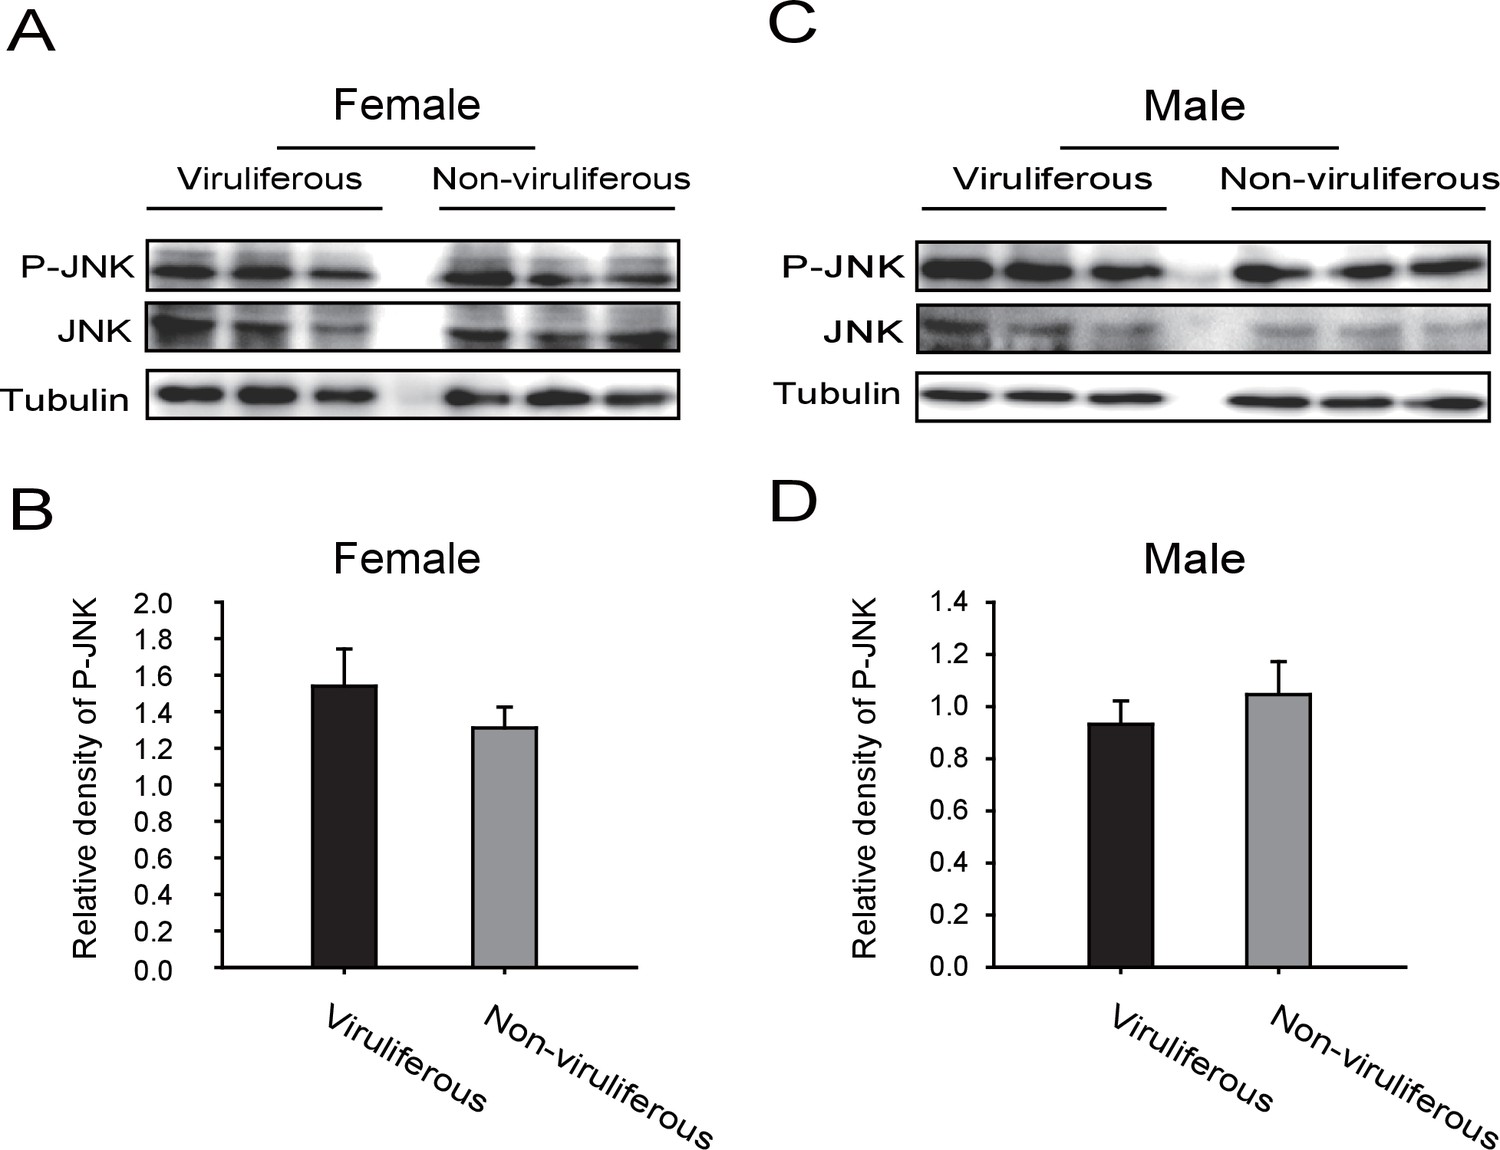
Western blot of the phosphorylated JNK (P-JNK) in female and male viruliferous and non-viruliferous planthoppers.
(A) and (B) are Western blots. The P-JNK, total JNK, and tubulin were detected using an anti-phospho-human JNK2 antibody, an anti-human JNK2 polyclonal antibody, and an anti-human tubulin monoclonal antibody, respectively. (C) and (D) show the relative densities of P-JNK, which were normalized with those of tubulin and are presented as mean ± SE.
Figure 4—figure supplement 3
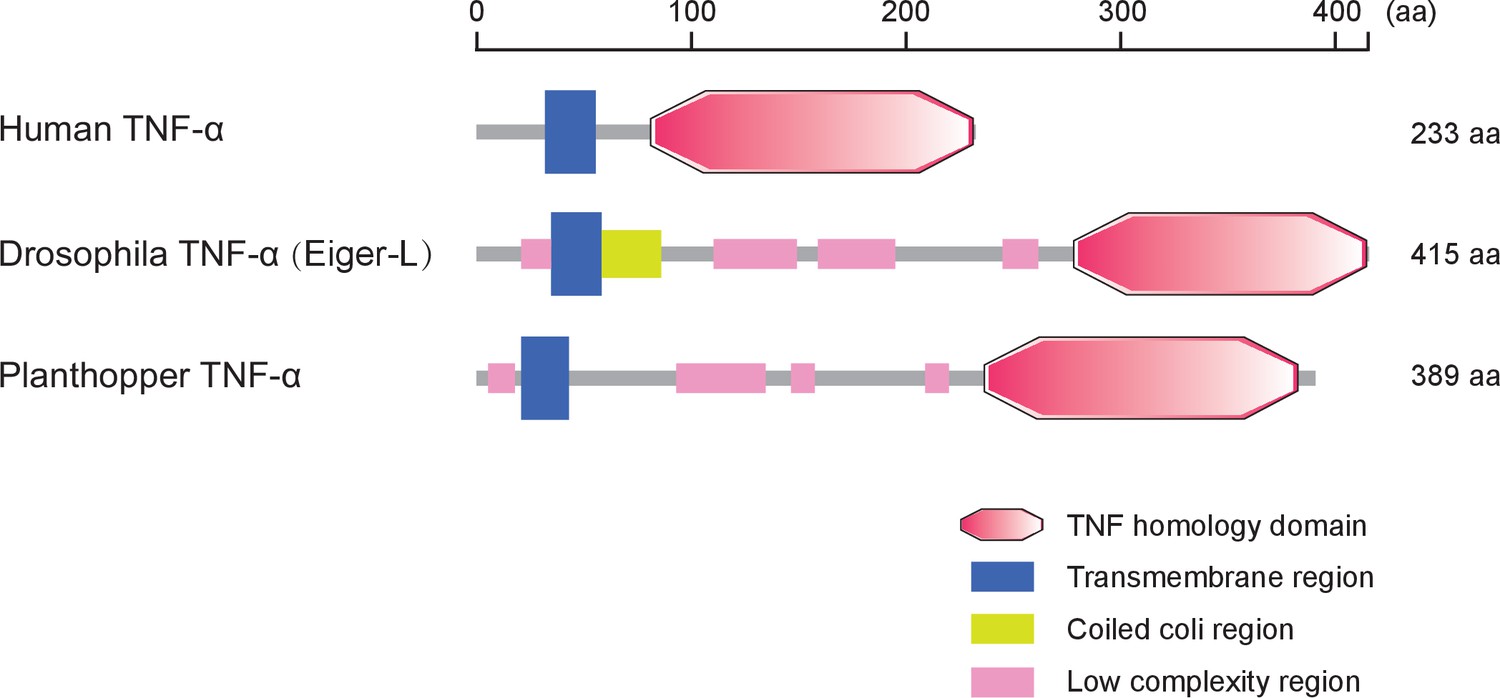
Protein characteristics of TNF-α from small brown planthopper, Drosophila fruit fly, and human.
Domains were predicted at http://smart.embl-heidelberg.de/.
Figure 5 with 4 supplements
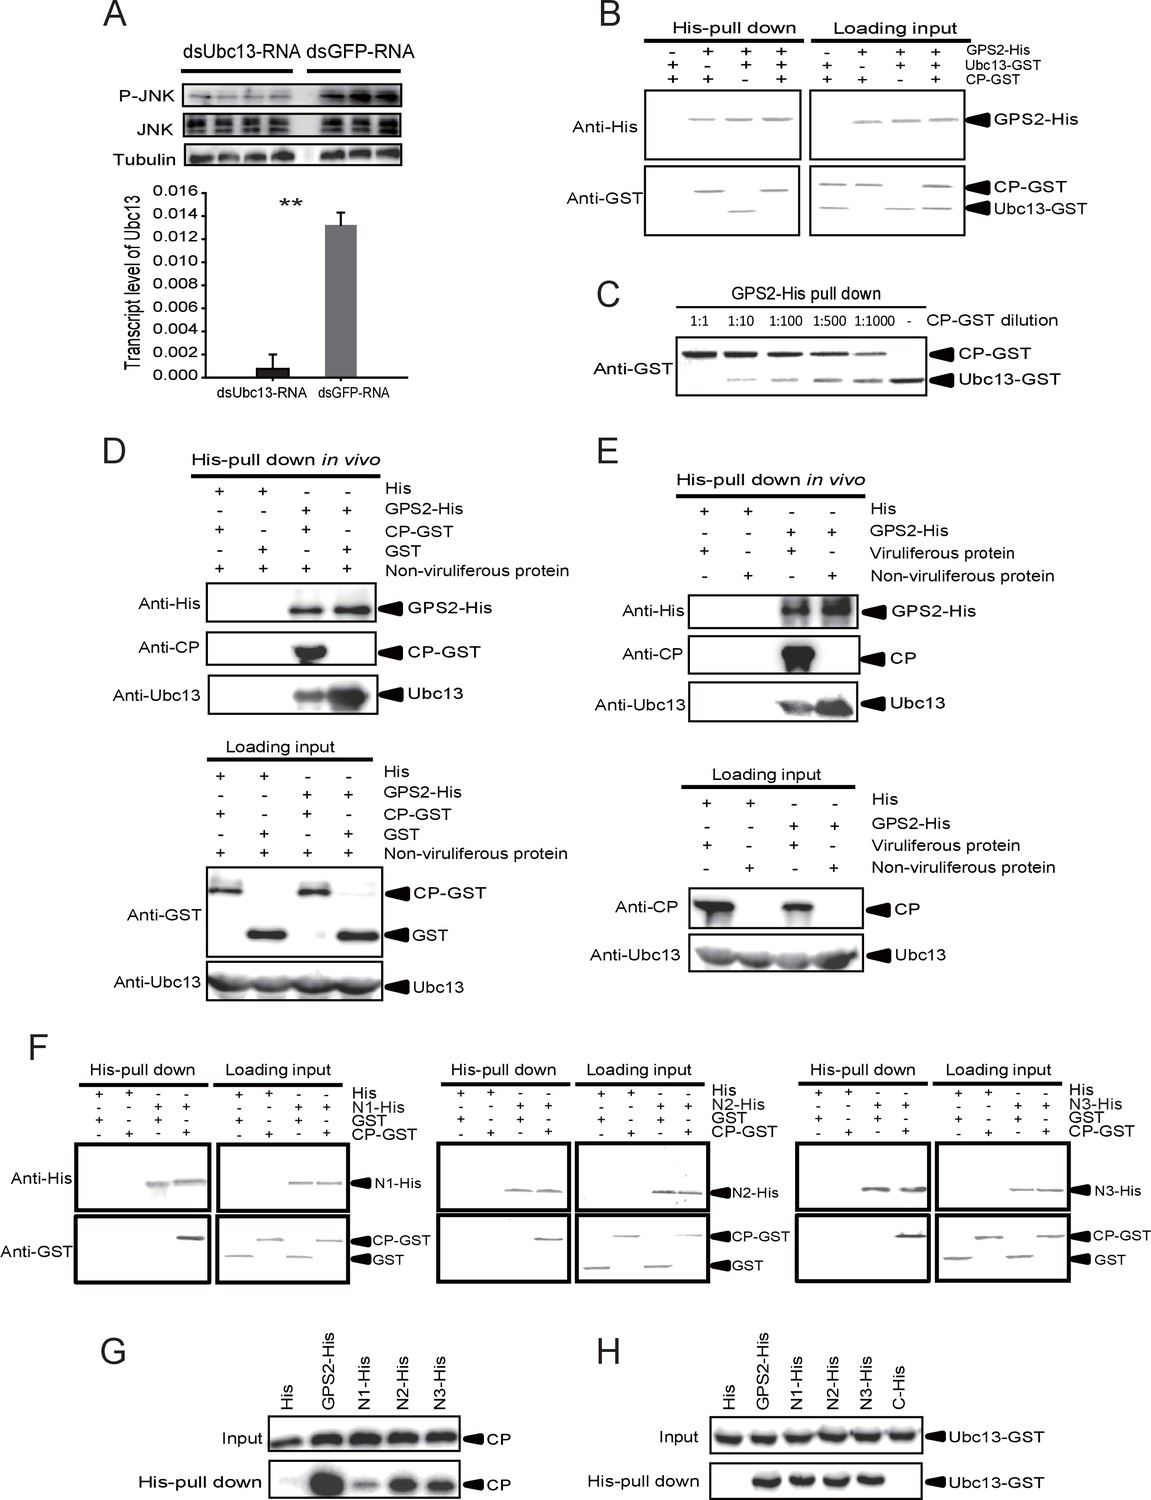
The Rice stripe virus capsid protein competes with Ubc13 in binding GPS2.
(A) Western blotting showing the phosphorylated JNK (P-JNK) when dsUbc13-RNA and mouse TNF-α were injected into the non-viruliferous fourth instar nymphs of the planthopper. Injections of dsGFP–RNA or 20 mM Tris-HCl containing 0.1% Tween 20 were used as controls. Relative transcript levels of Ubc13 were compared after three days of treatment. **p<0.01. (B) and (C) His-tag pull-down assay for the competitive binding of GPS2 by CP and Ubc13 using recombinantly expressed proteins. Recombinantly expressed GPS2-His was bound to Ni Sepharose as a bait for hooking Ubc13-GST at a series of dilutions of CP-GST. (D) His-tag pull-down assay for the competitive binding of GPS2 by CP and in vivo Ubc13. In vitro expressed GPS2-His was bound to Ni Sepharose. CP-GST or GST was applied to the GPS2-His bound Sepharose. Then, the total proteins from non-viruliferous planthoppers were applied to the Sepharose. (E) His-tag pull-down assay for the competitive binding of GPS2 by in vivo CP and in vivo Ubc13. Recombinantly expressed GPS2-His was bound to Ni Sepharose. Then the total proteins from viruliferous or non-viruliferous planthoppers were applied to the Sepharose. (F) His-tag pull-down assay for the interaction between CP-GST and the N1-His (nucleotides 1–465), N2-His (1-657), or N3-His (1-903) fragment of GPS2. The expression products from His vector (pET28a) and GST vector (pGEX-3X) were applied as negative controls. (G) His-tag pull-down assay for the interaction between the N1-His, N2-His, or N3-His fragment of GPS2 and the CP from the total protein of viruliferous planthoppers. The expression product from His vector (pET28a) was applied as negative control. (H) His-tag pull-down assay for the interaction between the N1-His, N2-His, N3-His, or C-His (nucleotides 886–1296) fragment of GPS2 and Ubc13-GST. The expression product from His vector (pET28a) was applied as negative control. Anti-phospho-human JNK2 polyclonal antibody, anti-human JNK2 polyclonal antibody, anti-human tubulin monoclonal antibody, anti-human Ubc13 monoclonal antibody, anti-CP monoclonal, anti-His monoclonal, and anti-GST polyclonal antibody were used to detect proteins. From (B) to (H), three independent replicates were carried out for each experiment. We show one representative result for each experiment here.
-
Figure 5—source data 1
Numerical data that are represented as a graph in Figure 5A.
- https://doi.org/10.7554/eLife.26591.019
Figure 5—figure supplement 1
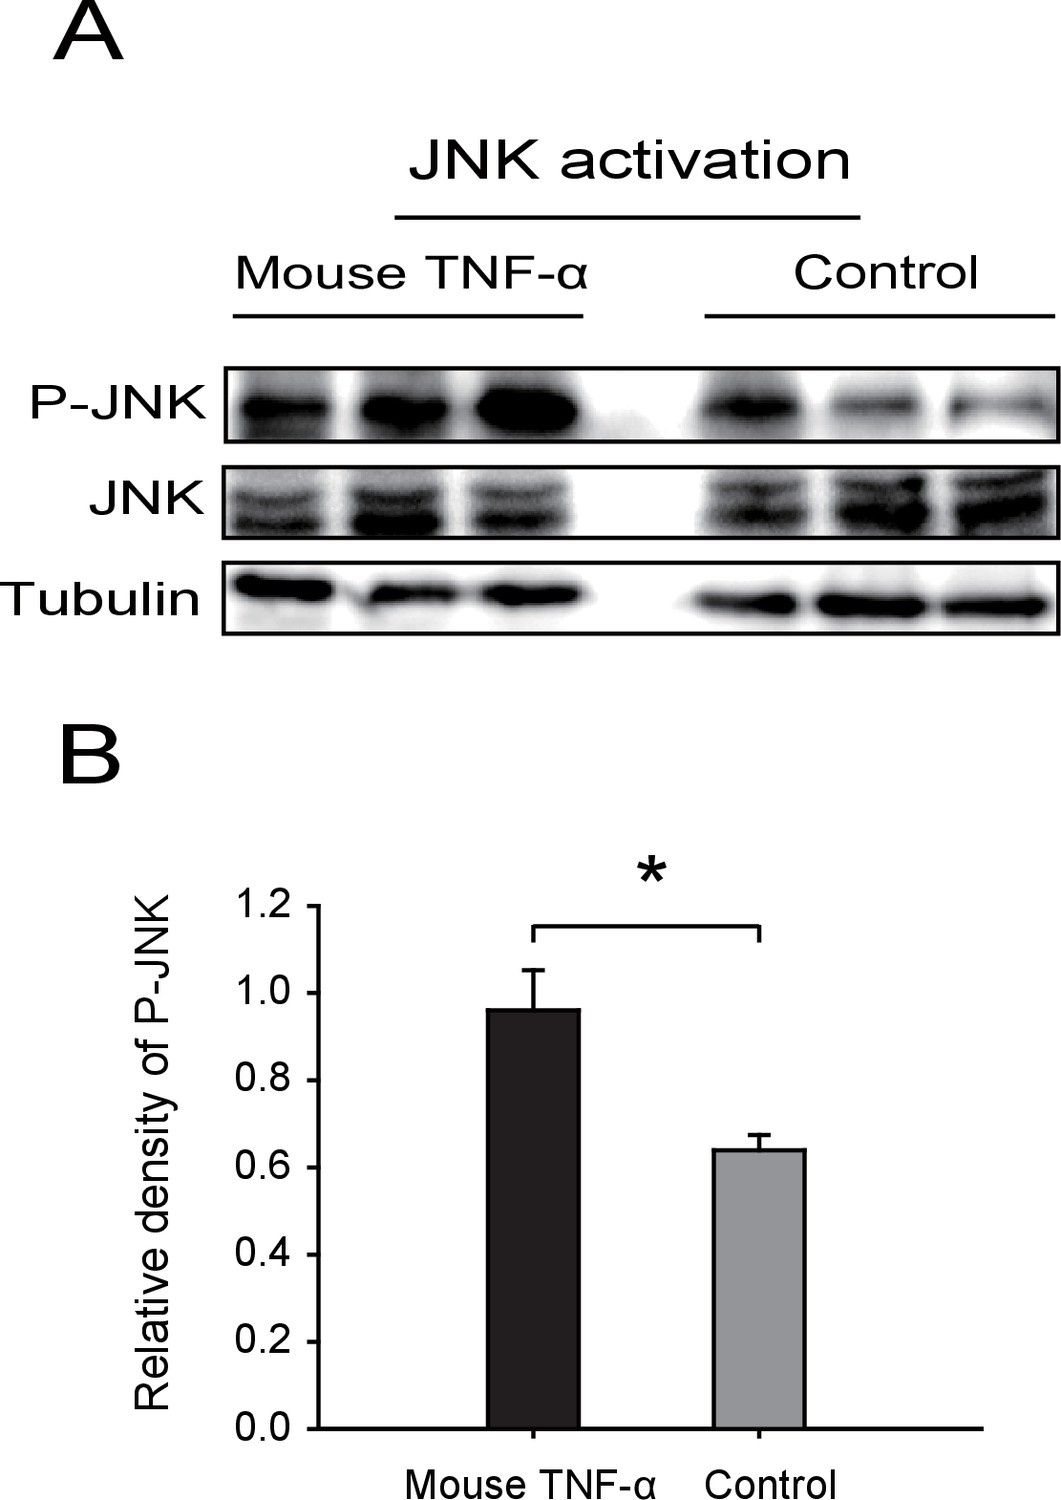
Western blot of the phosphorylated JNK (P-JNK) in response to TNF-α treatment.
(A) Western blotting. The non-viruliferous fourth instar planthoppers were injected with 23 nL of 50 μM mouse TNF-α. The control groups were injected with 23 nL of 20 mM Tris-HCl containing 0.1% Tween 20. Activation or inhibition of JNK were checked after 3 d of treatment. P-JNK, total JNK, and tubulin were detected using an anti-phospho-human JNK2 antibody, an anti-human JNK2 polyclonal antibody, and an anti-human tubulin monoclonal antibody, respectively. (B) The relative densities of P-JNKwere normalized with those of tubulin and are presented as mean ± SE. *p<0.05.
Figure 5—figure supplement 2
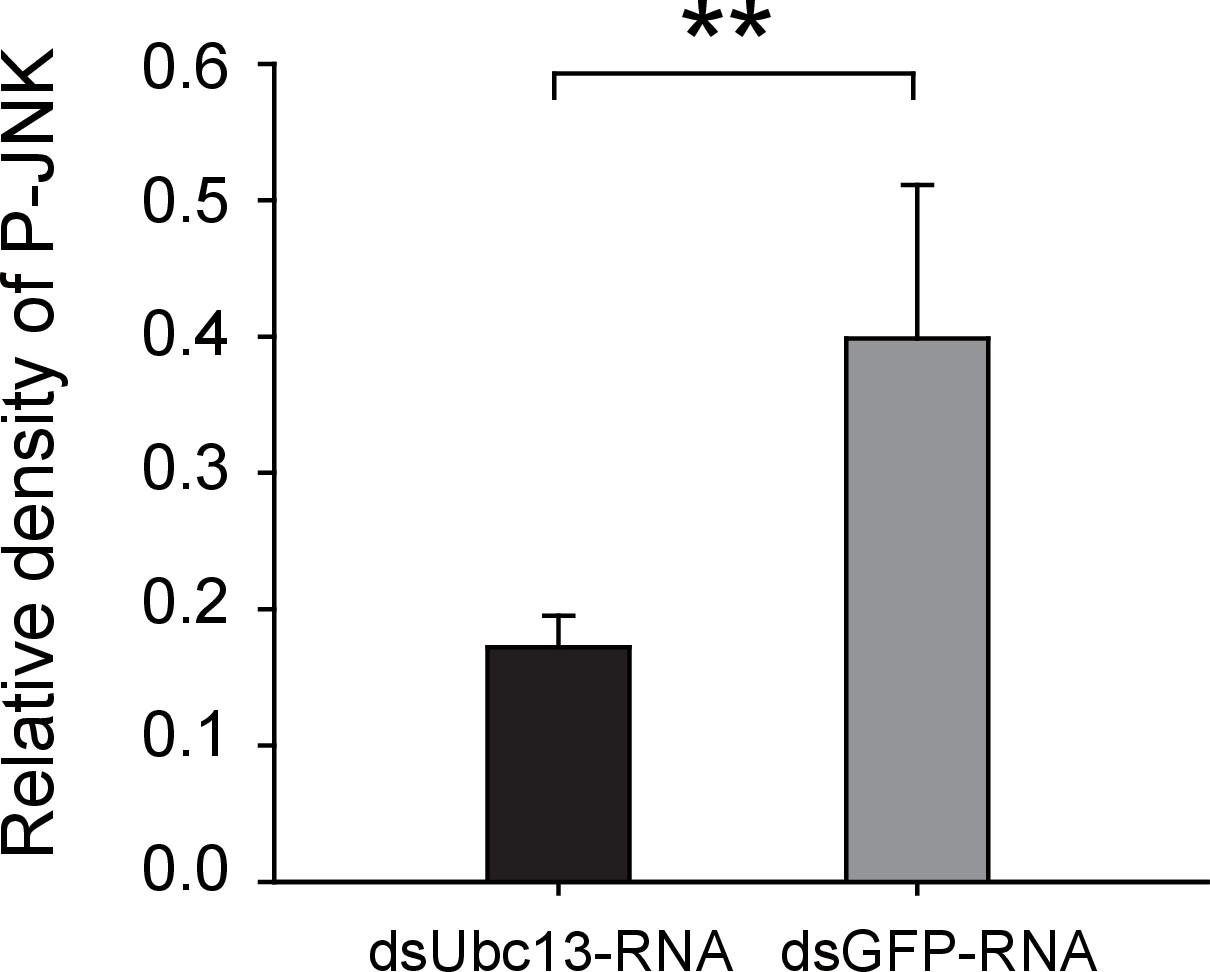
Densitometry analysis for the phosphorylated JNK (P-JNK) image bands from Figure 5A.
The relative densities of P-JNK were normalized with those of tubulin and are presented as mean ± SE. **p<0.01.
Figure 5—figure supplement 3
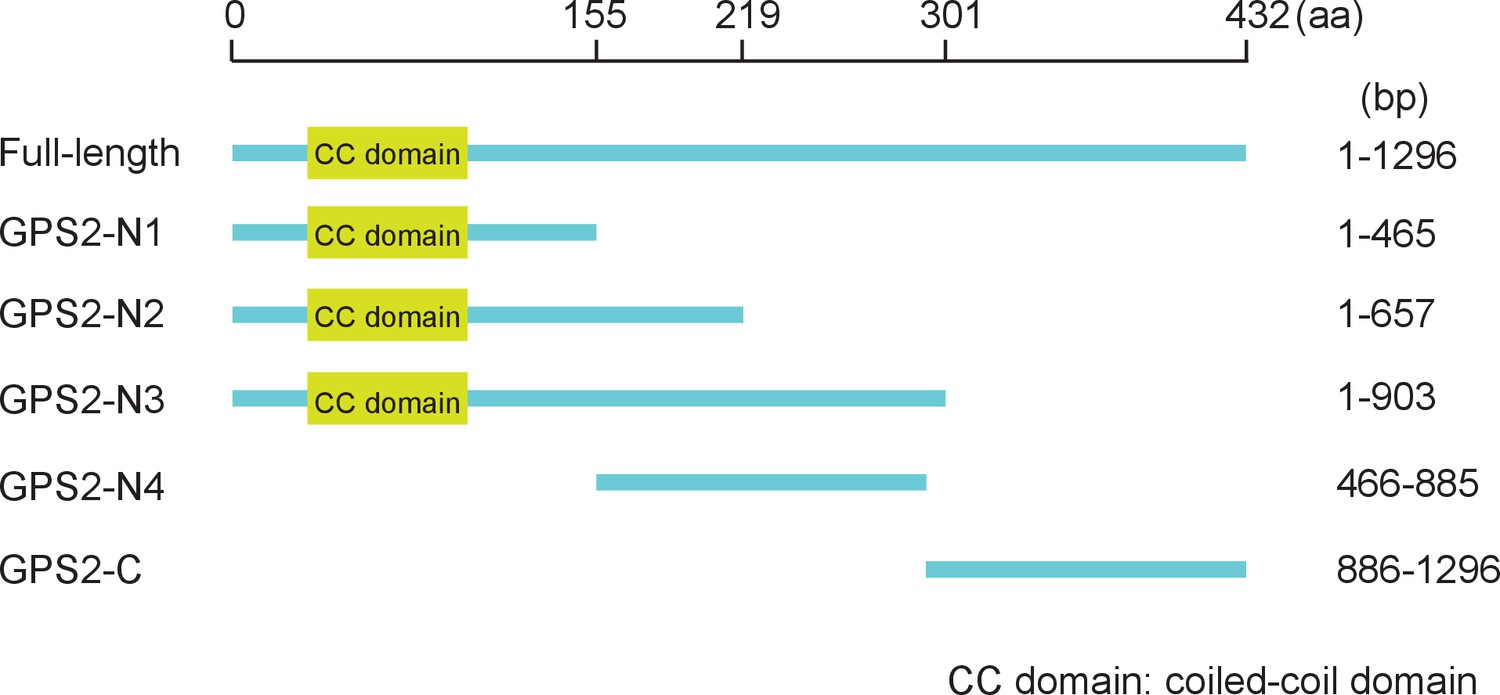
Positions of the five fragments, N1, N2, N3, N4, and C, within GPS2.
https://doi.org/10.7554/eLife.26591.022
Figure 5—figure supplement 4
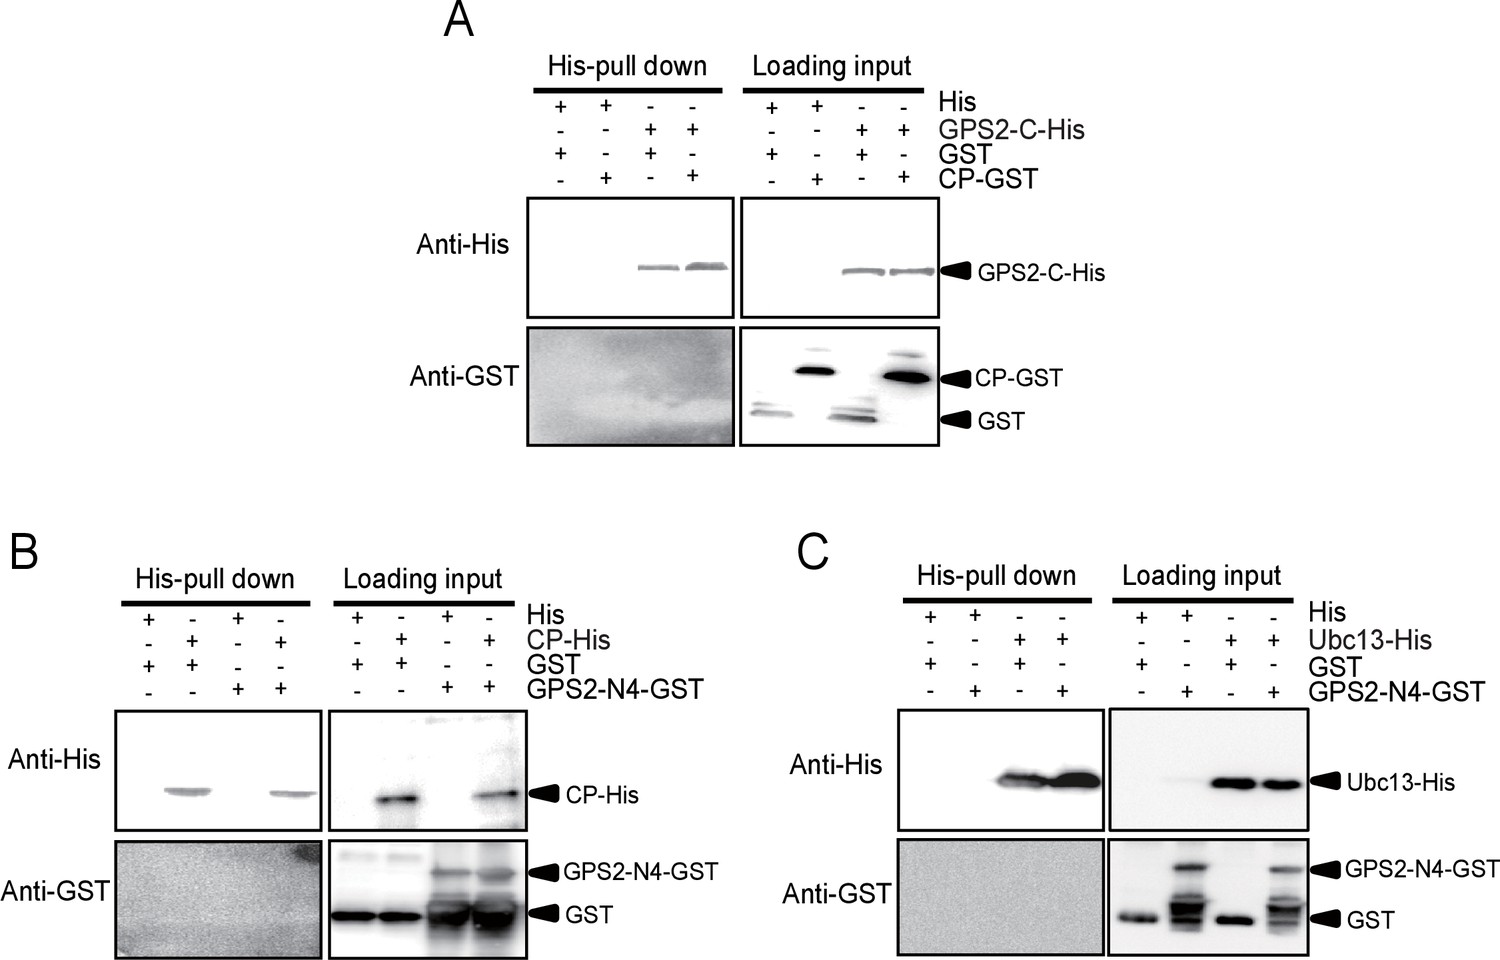
His-tag pull down assay for the interactions of GPS2 fragments with CP or Ubc13.
(A) C-His fragment (nucleotides 886–1296) of GPS2 and CP-GST. (B) N4-GST fragment (466-885) of GPS2 and CP-His. (C) N4-GST and Ubc13-His. The expression products from His vector (pET28a) and GST vector (pGEX-3X) were used as negative controls. Anti-His and anti-GST antibodies were used to detect the proteins with corresponding tags. Three independent replicates were carried out for each experiment. Here we show one representative result.
Figure 6 with 2 supplements

JNK activation facilitates the proliferation of Rice stripe virus in insects.
(A) Relative transcript levels of GPS2 7 d after dsGPS2-RNA or dsGFP-RNA injection. (B) Relative RNA levels of RSV CP in dsGPS2-RNA-injected and dsGFP-RNA-injected planthoppers after 5 d of virus incubation. (C) Relative RNA levels of RSV CP in dsTNF-α-RNA-injected and dsGFP-RNA-injected planthoppers after 5 d of virus incubation. (D) Relative transcript levels of JNK1 and JNK2 3 d after injection of the mixture of dsJNK1-RNA and dsJNK2-RNA. (E) Relative RNA levels of RSV CP in dsJNK1/2-RNA-injected and dsGFP-RNA-injected planthoppers after 5 d of virus incubation. (F) Relative RNA level of RSV CP in JNK-specific chemical inhibitor SP600125-injected planthoppers after 5 d of virus incubation. The control group was injected with an equal amount of 2% DMSO. (G) Relative RNA level of RSV CP in mouse TNF-α-injected planthoppers after 5 d of virus incubation. The control group was injected with an equal amount of 20 mM Tris-HCl containing 0.1% Tween 20. (H) The disease incidence rate of the rice plants fed upon by JNK1 and JNK2 knockdown planthoppers. The plants were placed at 26°C with 16 hr of light per day to observe disease symptoms. Six groups of plants per replicate and four replicates were used to calculate the disease incidence rate on each day. Plants fed upon by dsGFP-RNA injected insects were used as controls. *p<0.05; **p<0.01; ***p<0.001.
-
Figure 6—source data 1
Numerical data that are represented as graphs in Figure 6A–G.
- https://doi.org/10.7554/eLife.26591.025
Figure 6—figure supplement 1
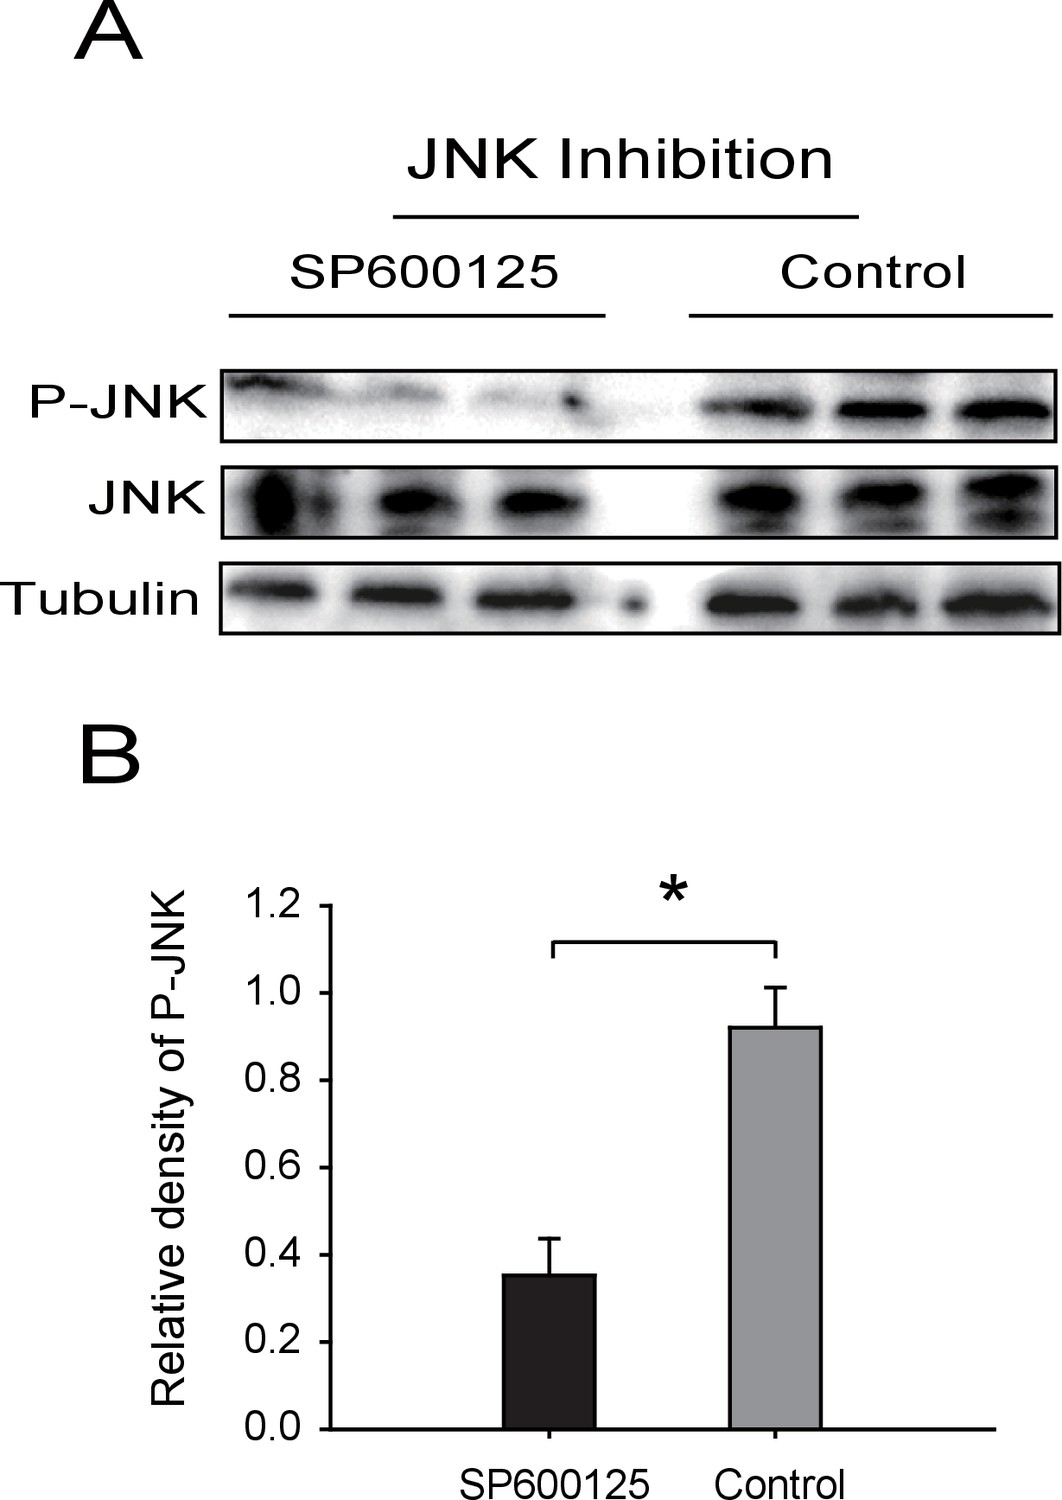
Western blot of phosphorylated JNK (P-JNK) after SP600125 treatment.
(A) The non-viruliferous fourth instar planthoppers were injected with 23 nL of 0.9 μM SP600125. The control groups were injected with 23 nL of 2% DMSO. Activation or inhibition of JNK were checked after 3 d of treatment. The P-JNK, total JNK, and tubulin were detected using an anti-phospho-human JNK2 antibody, an anti-human JNK2 polyclonal antibody, and an anti-human tubulin monoclonal antibody, respectively. (B) The relative densities of P-JNK, which were normalized with those of tubulin and are presented as mean ± SE. *p<0.05.
Figure 6—figure supplement 2
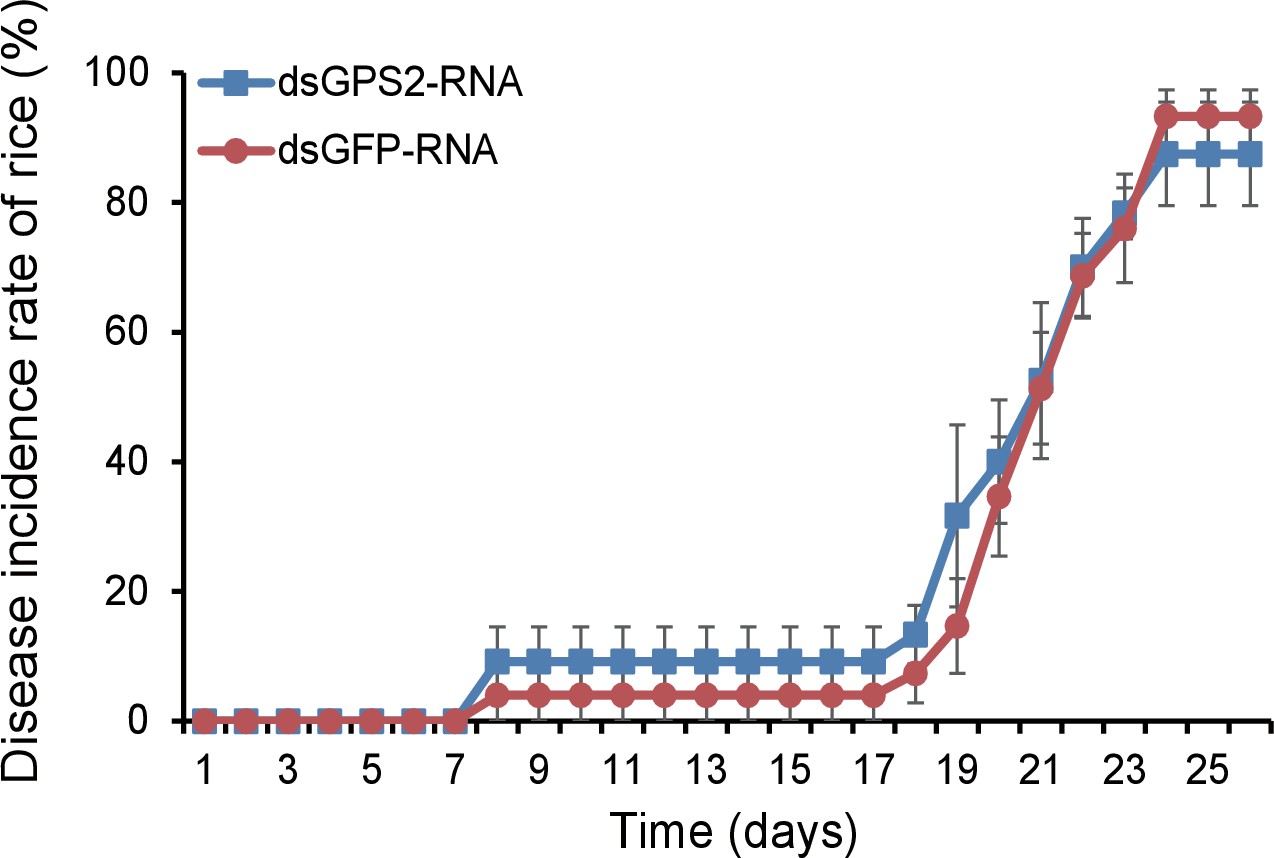
The disease incidence rate of the rice plants fed upon by GPS2 knockdown planthoppers.
The plants were placed at 20°C with 16 hr of light per day to observe disease symptoms. Six groups of plants per replicate and five replicates were used to calculate the disease incidence rate on each day. Plants fed upon by dsGFP-RNA injected insects were used as controls.
Figure 7
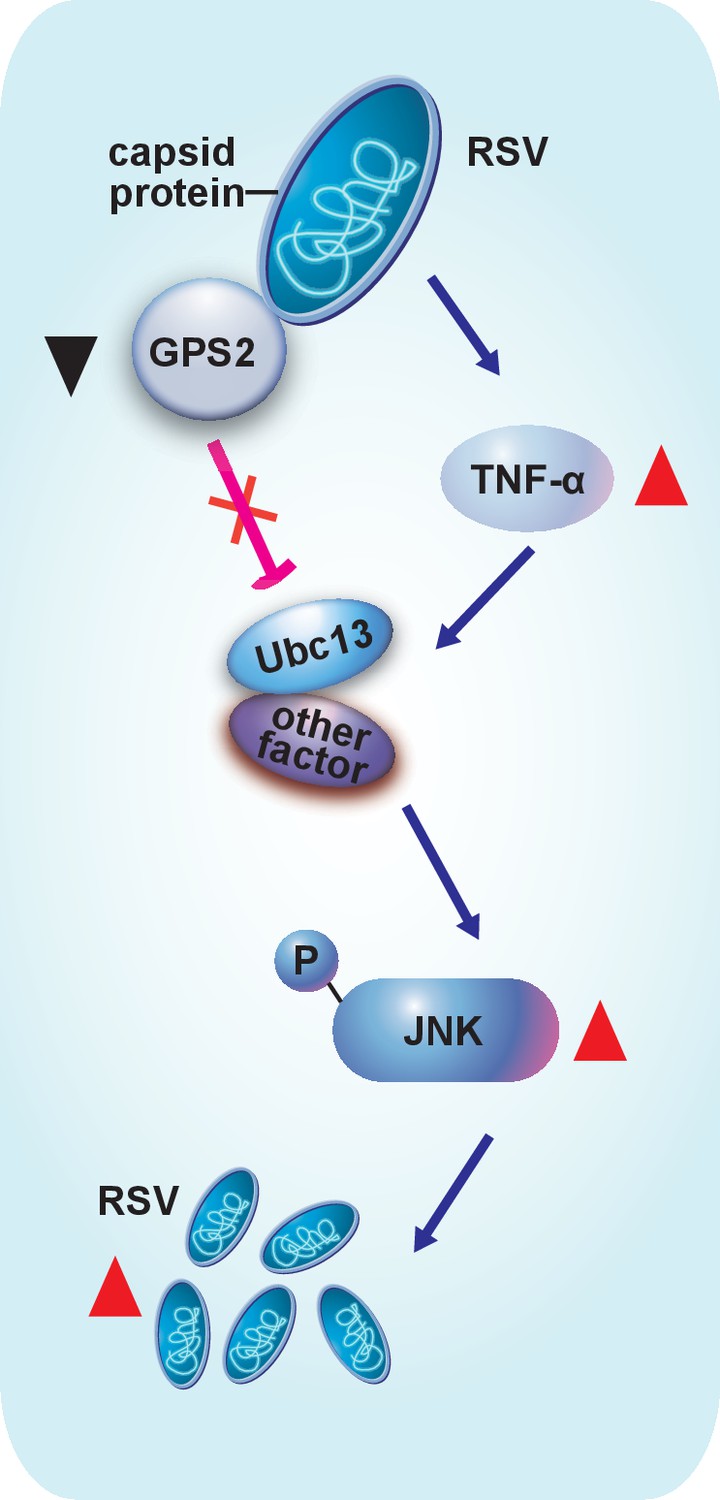
Model of RSV regulation of the JNK signaling pathway of its vector insect causing increased replication.
The virus activates the JNK signaling pathway of the vector insects in three ways: i) upregulating TNF-α; ii) decreasing the expression of GPS2, which is a repressor of JNK activation; and iii) binding of the virus capsid protein to GPS2 to prevent it from inhibiting the JNK activation machinery. JNK activation is beneficial to the ability of the virus to replicate in its vector insects.
Additional files
-
Supplementary file 1
Primers used in this study.
- https://doi.org/10.7554/eLife.26591.029
Download links
A two-part list of links to download the article, or parts of the article, in various formats.
Downloads (link to download the article as PDF)
Open citations (links to open the citations from this article in various online reference manager services)
Cite this article (links to download the citations from this article in formats compatible with various reference manager tools)
The c-Jun N-terminal kinase pathway of a vector insect is activated by virus capsid protein and promotes viral replication
eLife 6:e26591.
https://doi.org/10.7554/eLife.26591


