IFT trains in different stages of assembly queue at the ciliary base for consecutive release into the cilium
- University of Georgia, United States
- University of Massachusetts Medical School, United States
- Salem State University, United States
- Tsinghua-Peking Center for Life Sciences, School of Life Sciences, Tsinghua University, China
- Qingdao National Laboratory for Marine Science and Technology, China
Figures
Figure 1
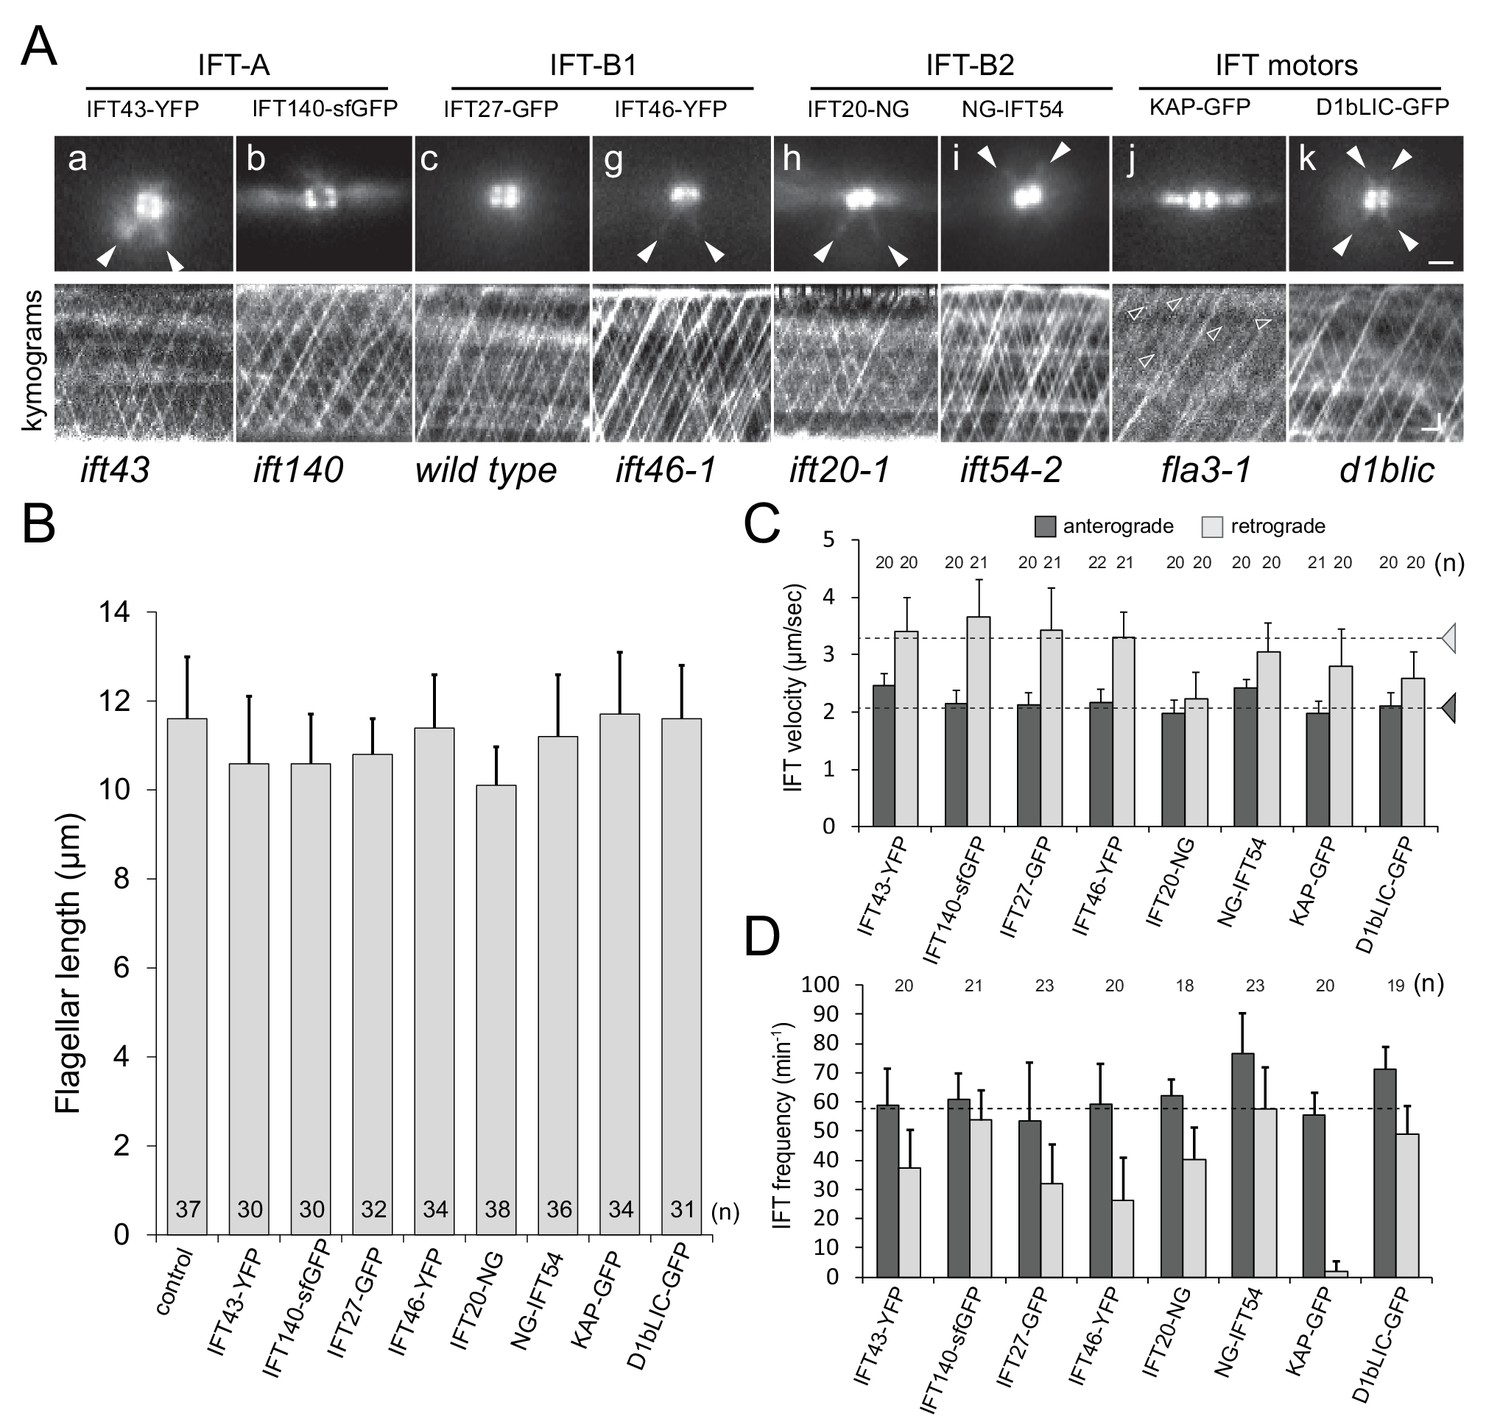
IFT proteins are concentrated at the flagellar base.
(A) top: Still images from live cells showing the distribution of FP-tagged IFT proteins in the basal body pool. Arrowheads: IFT proteins along the microtubular roots. To enhance clarity, 10-frame image averages are shown. Bar = 1 µm. bottom: Kymograms showing the trajectories of IFT trains inside flagella. Anterograde traffic results in trajectories running from the bottom left to the top right; retrograde traffic is presented by lines running from the top left to the bottom right. The genetic background of the strains is indicated. Bars = 1 µm 1 s. (B) Flagellar length of the strains expressing FP-tagged IFT proteins. The standard deviation and the number of measurements are indicated. Strain CC-620 was used as a control. (C) Velocity of anterograde and retrograde IFT traffic in the rescue strains. Note the reduction in retrograde velocity of IFT20-NG. Dashed lines indicate the velocities of anterograde and retrograde trains as determined by DIC microscopy based of Reck et al. (2016). (D) Frequency of IFT traffic. While the anterograde frequency was close to one train/s for all strains, retrograde frequencies were lower and more variable than reported for IFT in C. reinhardtii. The usage of fast bleaching fluorescent proteins (i.e., YFP) and the low laser intensity used here to allow for long-term imaging could have prevented the detection of weaker trains. The standard deviation is indicated.
Figure 2 with 1 supplement

IFT proteins in the pool are exchanged at distinct rates.
(A) Series of still images showing a cell expressing KAP-GFP before (pre) and immediately after bleaching of one of the two IFT bb-pools surrounding the flagellar basal bodies (arrowhead; T0), and during recovery (in s). Bar = 2 µm. (B) Kymograms from FRAP experiments after bleaching of one IFT bb-pool followed by signal recovery; repeated bleaching was used in some experiments (arrows, bottom). The experimental (E) and control (C) pool are indicated. Bar = 1 µm. (C,D) Quantitative analysis of FRAP for KAP-GFP (C) and IFT43-YFP (D) after bleaching of the experimental basal body; data are normalized for the unbleached basal body. The time needed for recovery was determined manually by determining the point of interception of lines along the slope during recovery and the plateau of the recovered signal (red dashed lines). (E) Box plot comparing FRAP times for the FP-tagged IFT proteins. The individual measurements, the median, and the quadrants are indicated. The number of measurements (n) and the result of a paired T-test are indicated. ns, not significant (p>0.05); *p≤0.05; **p≤0.01; ***p≤0.001.
Figure 2—figure supplement 1
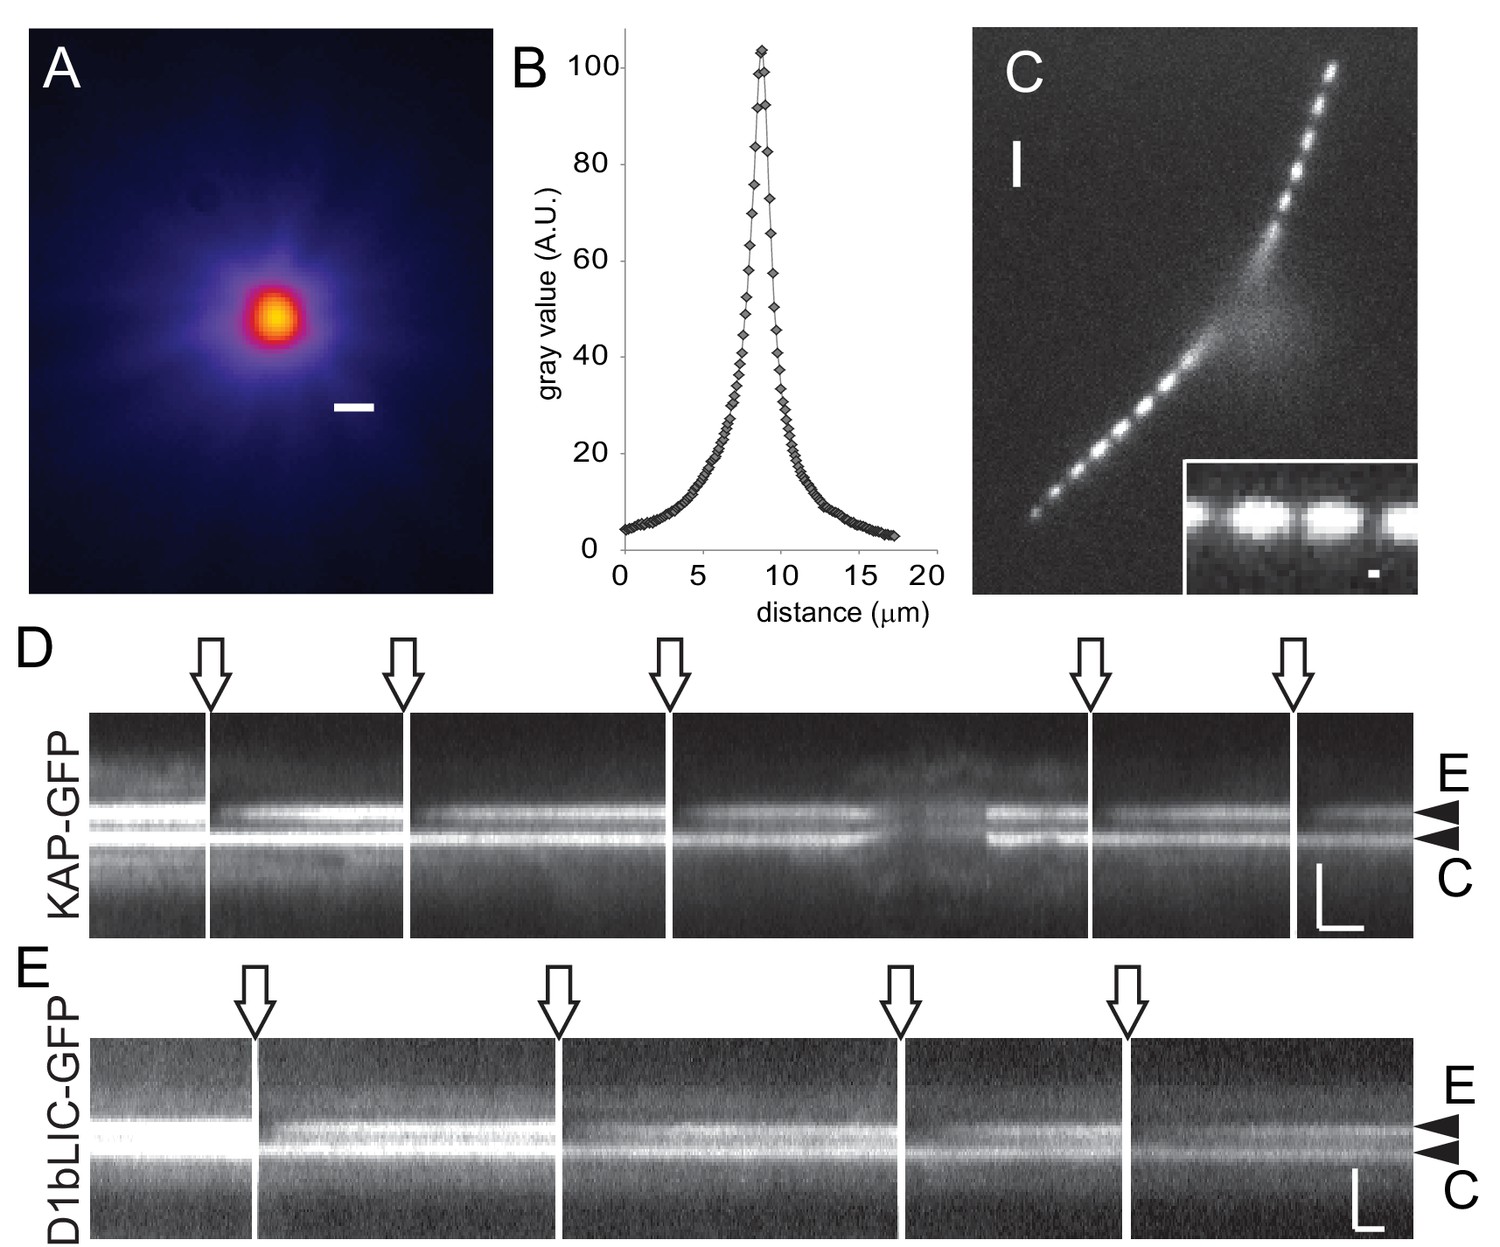
Rapid and local photobleaching using a focused laser beam.
(A) Heat map of a focused laser beam as visualized using fluorescent polystyrene beads. Bar = 1 µm. (B) Intensity profile of a focused laser beam. (C) Spot bleaching of the flagella of a cell expressing sfGFP-alpha-tubulin. Insert: detail of a spot bleached flagellum. Bar = 2 µm and 0.2 µm (insert). (D) Kymogram depicting repeated photobleaching (arrows) and recovery of one basal body (E, experimental basal body) of a KAP-GFP cell; C, the unbleached control basal body. Proper focus was lost for a part of the recording. Bars = 2 s 2 µm. (E) as D, but for a D1bLIC-GFP cell. Bars = 2 s 2 µm.
Figure 3 with 3 supplements
IFT-B, but not IFT-A or motor proteins, return to the basal body pool.
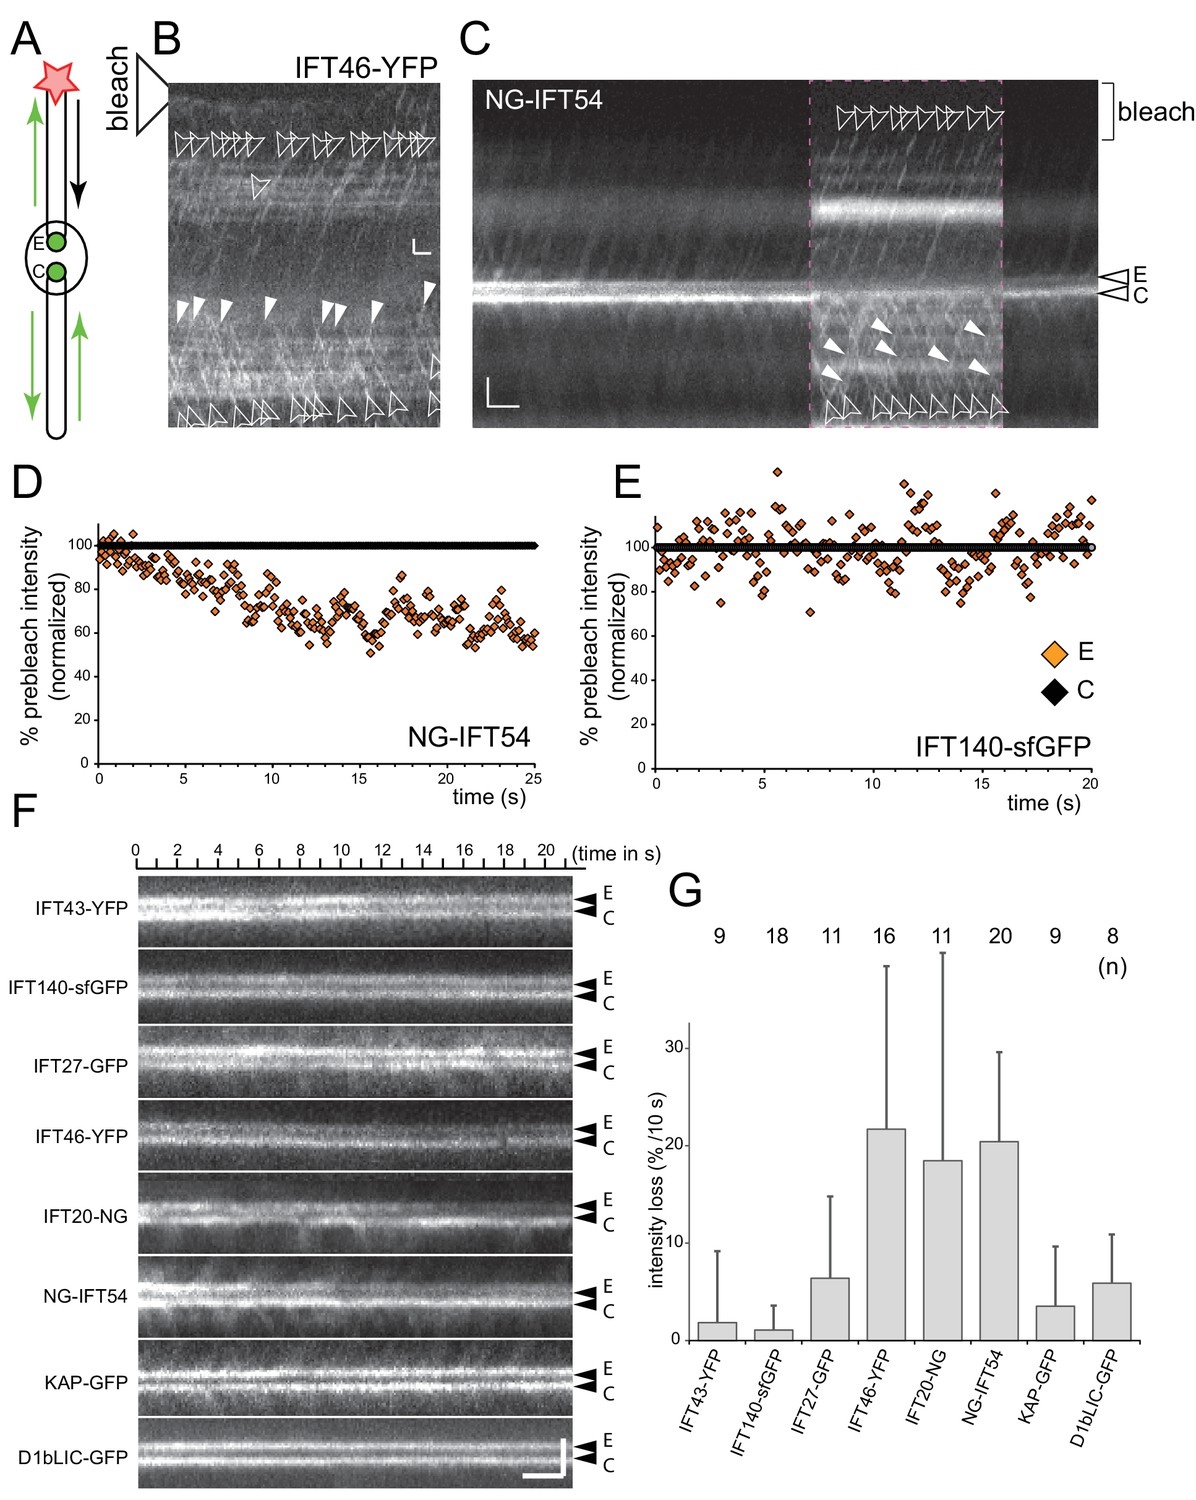
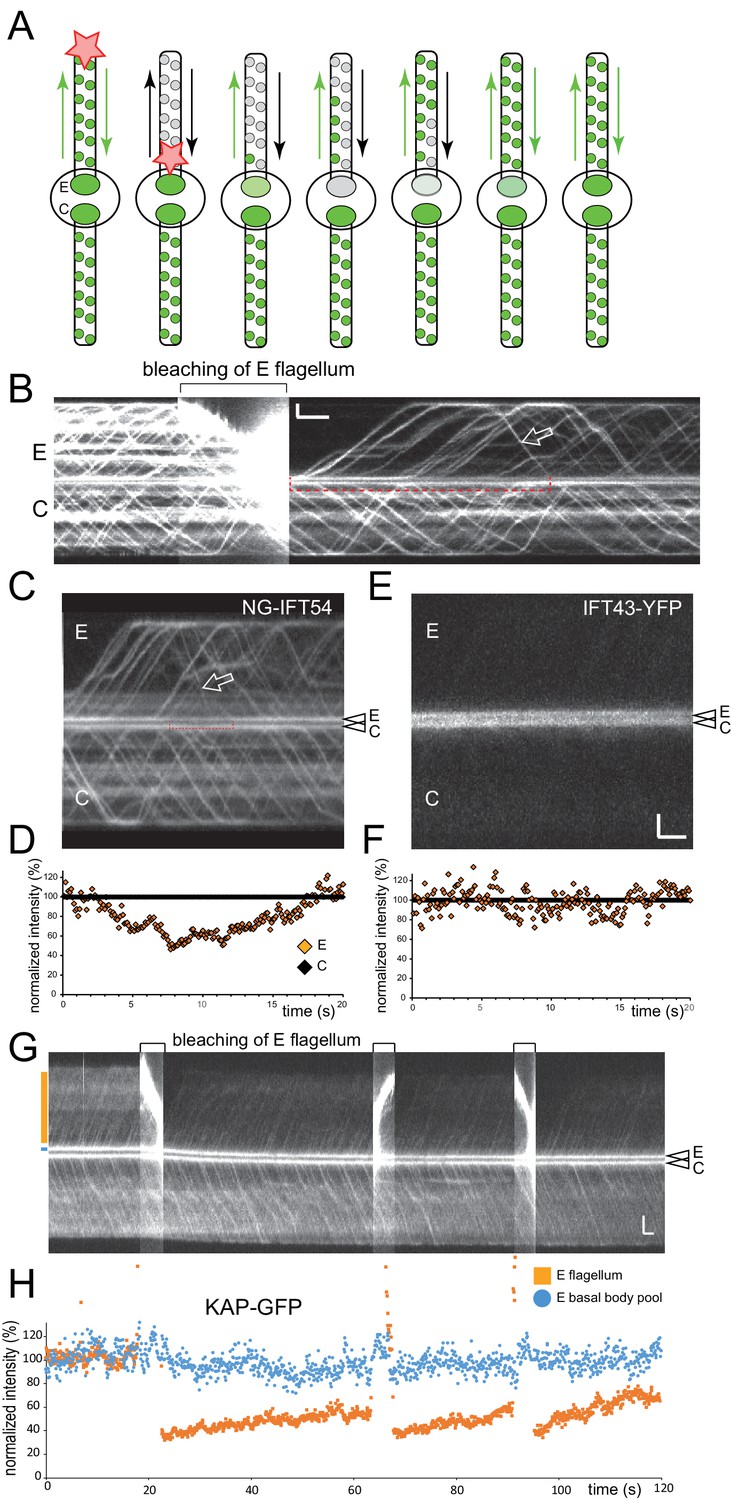
(A) Schematic presentation of the FLIP assay to analyze the return of IFT proteins from the flagella to the bb-pool. The star indicates the laser beam positioned at the tip of the experimental (E) flagellum. (B) FLIP bleaching at the tip of the E flagellum prevented the return of unbleached IFT46-YFP via retrograde IFT; note retrograde tracks in the control (C) flagellum (full arrowheads). See Figure 3—figure supplement 1A for a more detailed analysis of IFT traffic under FLIP illumination. Bar = 1 µm 1 s. (C) Kymogram of a FLIP experiment of a NG-IFT54 cell. FLIP illumination decreased the signal of the E basal body. Unbleached anterograde trains (open arrowheads) continue to enter the E cilium in the absence of fluorescent retrograde traffic. To better visualize IFT traffic the focus level was changed during part of the recording (dashed square). Bar = 2 µm 2 s. (D,E) Quantitative analysis of FLIP of the E basal body of a NG-IFT54 and an IFT140-sfGFP cell; the data are normalized for the control (C) basal body. (F) Kymograms of FLIP experiments using the IFT-FP strains. The experimental (E; top) and control (C) pool are indicated. Bars = 2 µm 2 s. (G) Bar graph showing the average loss of signal of the E basal body during the first 10 s of FLIP illumination. The standard deviation and the number of cells analyzed are indicated. See Figure 3—figure supplement 1E for a box plot presentation of the data.
Figure 3—figure supplement 1

FLIP illumination prevents return of unbleached proteins to the cilary base.
(A) Kymogram showing NG-IFT54 traffic before (pre), during (FLIP), and after (post) illuminating the tip of the experimental flagellum (E) with a focused laser beam. The position of the laser beam is indicated (white bar, bleach). The three boxed areas are shown in detail in the bottom row. Open arrowheads: anterograde trains; full arrowheads, retrograde trains. Bars = 2 s 2 µm. (B,C) Kymograms (bottom) and scatter plots of the signal intensity showing the loss of NG-IFT54 from the experimental pool during FLIP illumination (B) and recovery of the signal when the FLIP laser is turn off (C). (D) As in B but for IFT43-YFP. Bars (B–D) = 2 s 2 µm. (E) Summary of the FLIP experiments as shown in Figure 3G but presented as a box plot. (F) Box plot showing the time of FLIP illumination required to reach a plateau for NG-IFT54. (G) Box plot showing the normalized signal intensity of NG-IFT54 at the experimental basal body after FLIP illumination.
Figure 3—figure supplement 2
Bleaching of the entire NG-IFT54 protein pool.
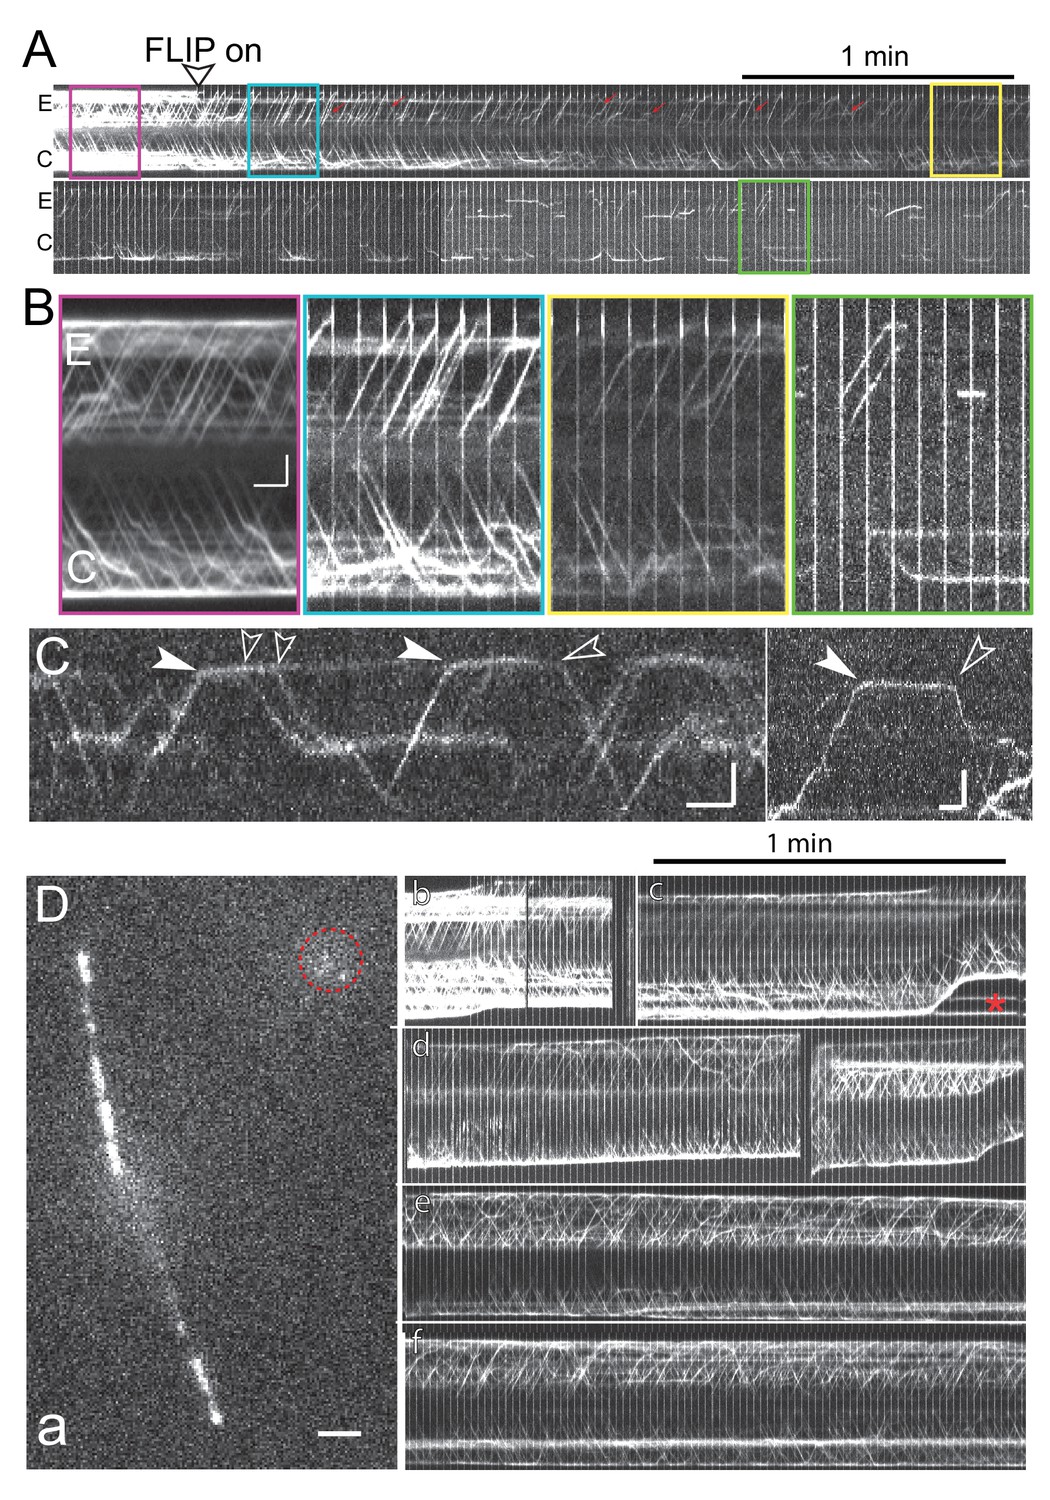
(A) Kymograms of a given cell during prolonged FLIP bleaching of one ciliary tip (E). The start of the FLIP illumination is marked by an arrowhead. While most retrograde trains in the experimental flagellum were bleached, occasionally retrograde trains originating subdistally either from stationary NG-IFT54 or anterograde trains turning around early were present (red arrows). (B) Blow-ups of the boxed areas of the kymograms shown in A. Red, prebleach; blue, briefly after onset of the bleaching; yellow, ~2.5 min of FLIP, and green, after ~8 min of FLIP. Note the absence of retrograde traffic from the E flagellum. Bars = 2 s 2 µm. (C) Kymograms obtained after prolonged FLIP illumination showing the arrival (filled arrowheads) and departure (open arrowheads) of individual IFT trains at the ciliary tip. Bars = 2 s 2 µm. (D) Still image (a) and kymograms (b-f) from a control recording in which the bleaching laser was not aimed at the cilia tip. a) Single frame recorded while the spot bleaching laser was on. The position of the spot bleaching laser is marked by the red circle. Bar = 2 µm. b-f) Kymograms showing continuous IFT traffic in both cilia of the cell shown in a; the kymogram is shown in segments due to movements of the cell. Red star: Vesicles containing NG-IFT54 shed from the ciliary tip. Bar = 1 min.
Figure 3—figure supplement 3
A portion of the pool consists of disassembling IFT-B complexes.
(A) Schematic presentation of total flagella FLIP in which the entire experimental flagellum (E) was bleached by moving a focused laser beam along the flagellum. (B) Kymogram before, during, and after bleaching of NG-IFT54 in the experimental flagellum. Open arrow, first unbleached retrograde train after the bleach. The red bracket indicated the time span during which no unbleached NG-IFT54 returned to the pool; note the decrease in the signal strength of the pool. Bars = 2 s 2 µm. (C) as B, but only depicting the time after the bleaching step. The bracket indicates the trough in the pool signal prior to the return of unbleached NG-IFT54 by retrograde traffic. (D) Quantification of the pool signal corresponding to the kymogram in C. E (orange), experimental basal body. (E,F) as C and D but for a cell expressing IFT43-YFP. Because the pool of IFT43-YFP is deeper inside the cell, imaging of the pool and IFT traffic in the same focal plane was mostly unfeasible. Bars (for C and E): 2 s 2 µm. (G) Kymogram before, during, and after bleaching of KAP-GFP in the experimental flagellum; the bleaching step was repeated thrice as indicated by brackets. Orange and blue boxes indicate the positions of the lines used for signal quantification. Bars = 2s 2 µm. (H) Quantification of the pool signal corresponding to the kymogram in G. The blue markers indicate the pool signal; the orange ones the flagellar signal of the experimental flagellum. Note that the strength of the pool signal is unaffected by repeated bleaching of the associated flagellum. Due to the presence of diffusing KAP-GFP in flagella, the flagellar signal recovers only incompletely.
Figure 4

IMCD cells and T. thermophila have open IFT systems.
(A) Still images of an IMCD cell expressing IFT88-YFP before (pre), immediately after photobleaching of the entire cilium plus basal body (post), and during recovery. The dotted line marks the cell bounderies. Bar = 1 µm. (B) Corresponding kymogram (Bar = 2 µm 5s) and (C) quantitative analysis of the signal at the basal body. (D) Still images showing a detail of the cortex of a T. thermophila cell expressing GFP-Dyf-1 before (pre), immediately after photobleaching of the entire cilium plus basal body (post), and during recovery. Bar = 1 µm. (E) Corresponding kymogram (Bar = 2 µm 5s) and (F) quantitative analysis of the signal at the basal body.
Figure 5
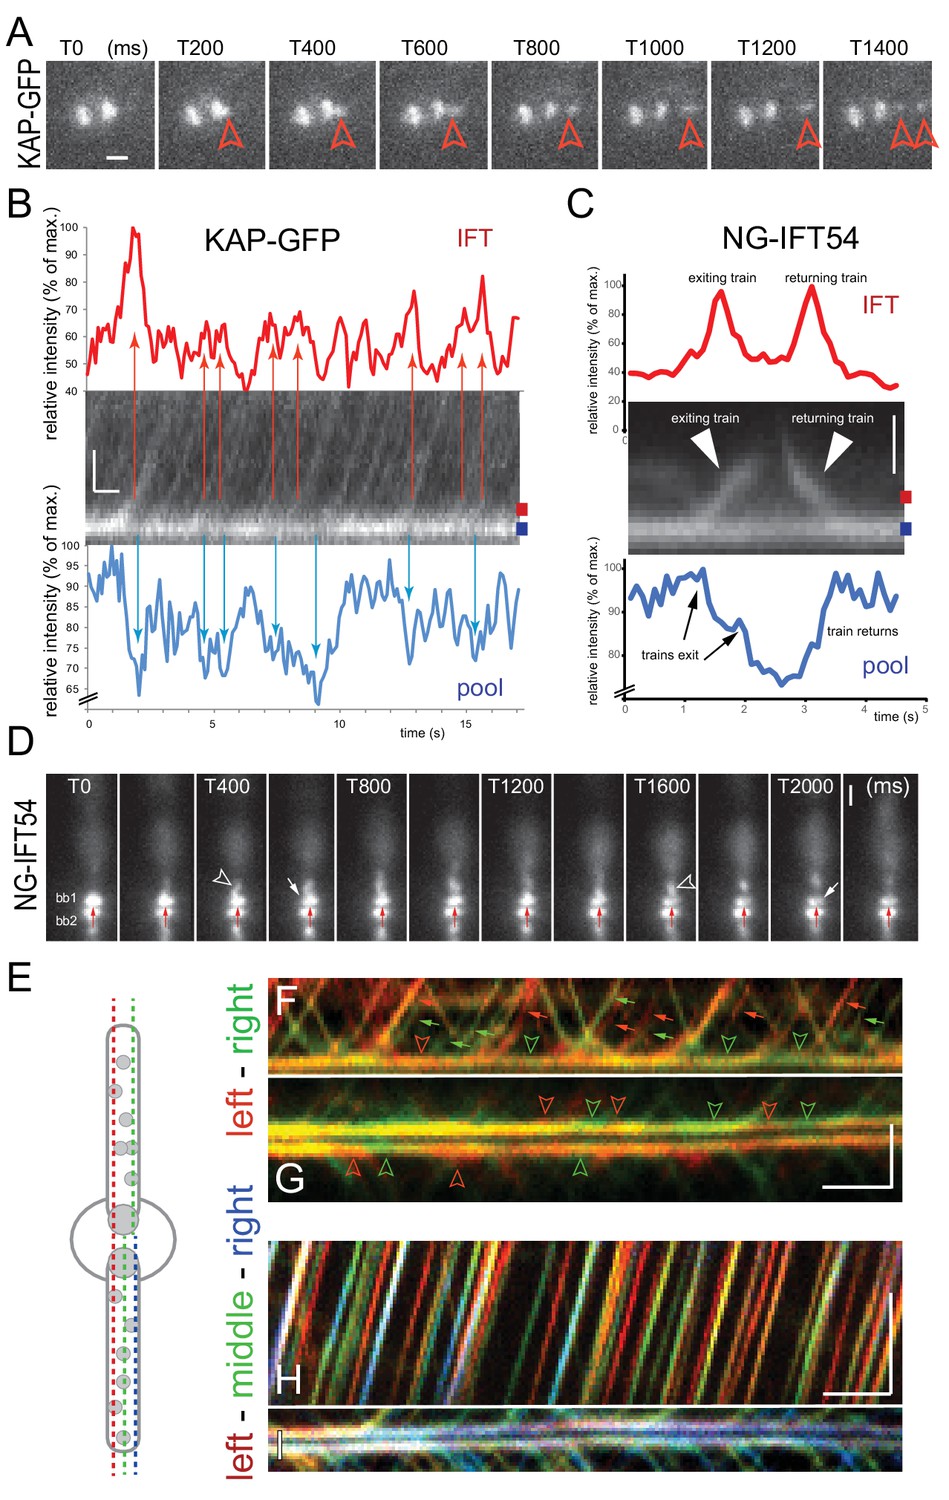
The basal body pool contains IFT proteins equivalent to several IFT trains.
(A) Series of still images from a cell expressing KAP-GFP showing the departure of an IFT train (red arrowhead). The intensity of the bb-pool decreases concomitantly with the departure of the train. Bar = 1 µm; the time points in ms are indicated. (B) Kymogram showing the bb-pool and proximal regions of one flagellum of a cell expressing KAP-GFP. Intensity profiles (in percent of the maximum intensity) for the bb-pool (blue) and flagellum (red) depict the correlation between the exit of IFT trains (red arrows) and a transient decrease of fluorescence in the pool (blue arrows); the positions of the lines used to generate the intensity profiles are indicated. Bars = 1 s 1 µm. (C) Kymogram and its analysis as described in B but for NG-IFT54. Bar = 1 µm. (D) Series of still images from a cell expressing NG-IFT54 showing two IFT trains departing from the upper basal body (bb1; arrowheads). The first train departs from the left (T400) side of the bb-pool while the second train exits the pool at the right side causing a local loss of fluorescence in the pool. The red arrow near bb2 serves as a fiduciary marker. Bar = 1 µm. (E) Schematic presentation of the position of the lines used to generate the kymograms shown in F–I. (F,G) Merged kymograms showing the two sides of the bb-pool and cilium in red and green. Note the alternation of predominantly red and green trains (small arrows) and red and green areas (open arrowheads) in the bb-pool indicative for a transient reduction of NG-IFT54 in one side of the pool. Bars = 2 s 2 µm. (H,I) as in F and G, but showing the left, middle, and right positions of the pool and cilium in red, green, and blue respectively. Bars = 2 s 2 µm.
Figure 6
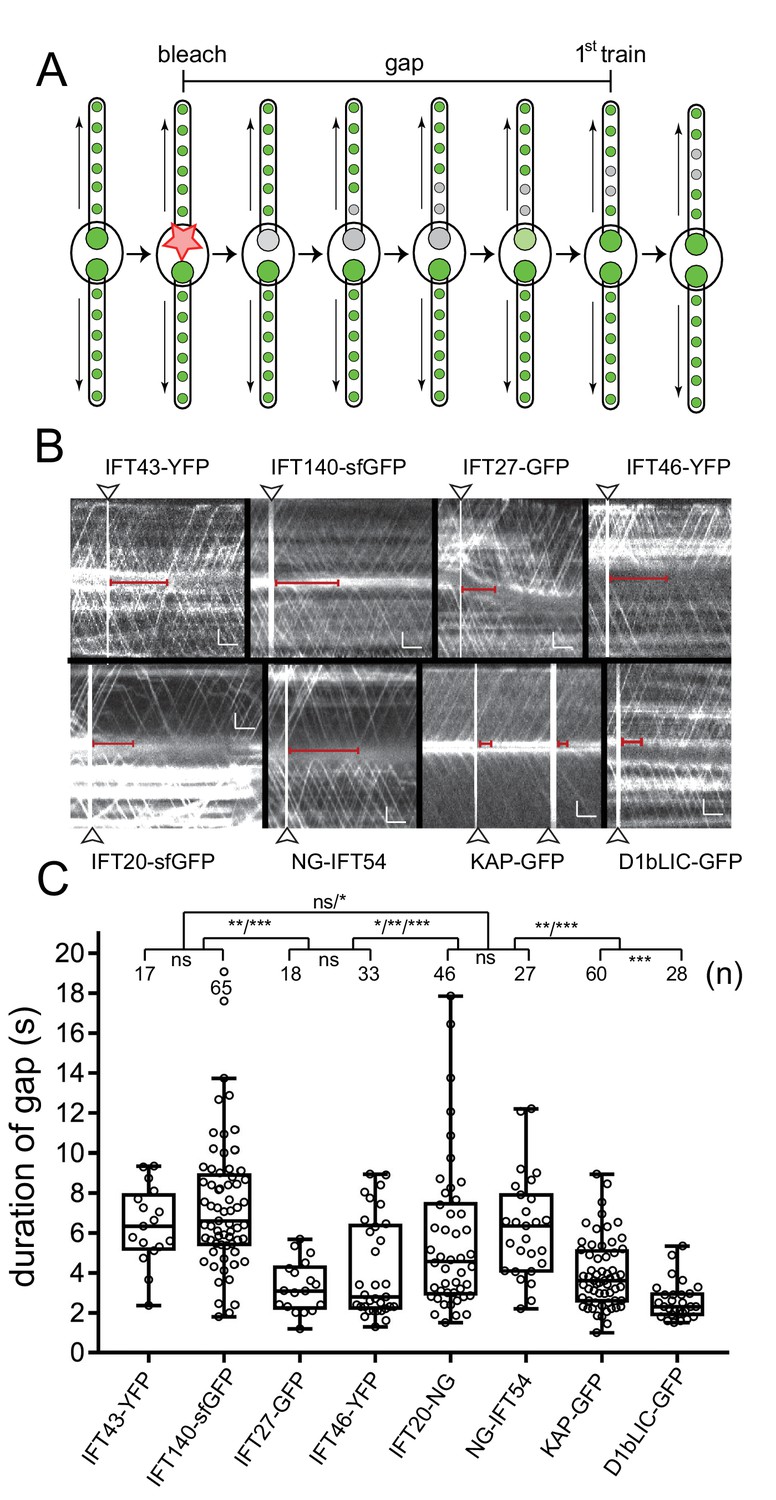
Bleaching of the basal body pool is followed by a gap in IFT traffic.
(A) Schematic presentation of the gap assay to determine the interval between bleaching of the bb-pool (bleach, indicated by the star) and recommencement of fluorescent anterograde IFT traffic (first train). (B) Representative gap analysis for the eight FP-tagged IFT proteins. Arrowheads mark the bleaching steps; the red bars indicate the gap between the bleach and the dispatch of the first unbleached IFT train. Bars = 2 s 2 µm. (C) Quantitative analysis of the gap data. The standard deviation, number of gaps analyzed, and the results of a paired T-test are indicated. ns, not significant (p>0.05); *p≤0.05; **p≤0.01; ***p≤0.001.
Figure 7 with 1 supplement
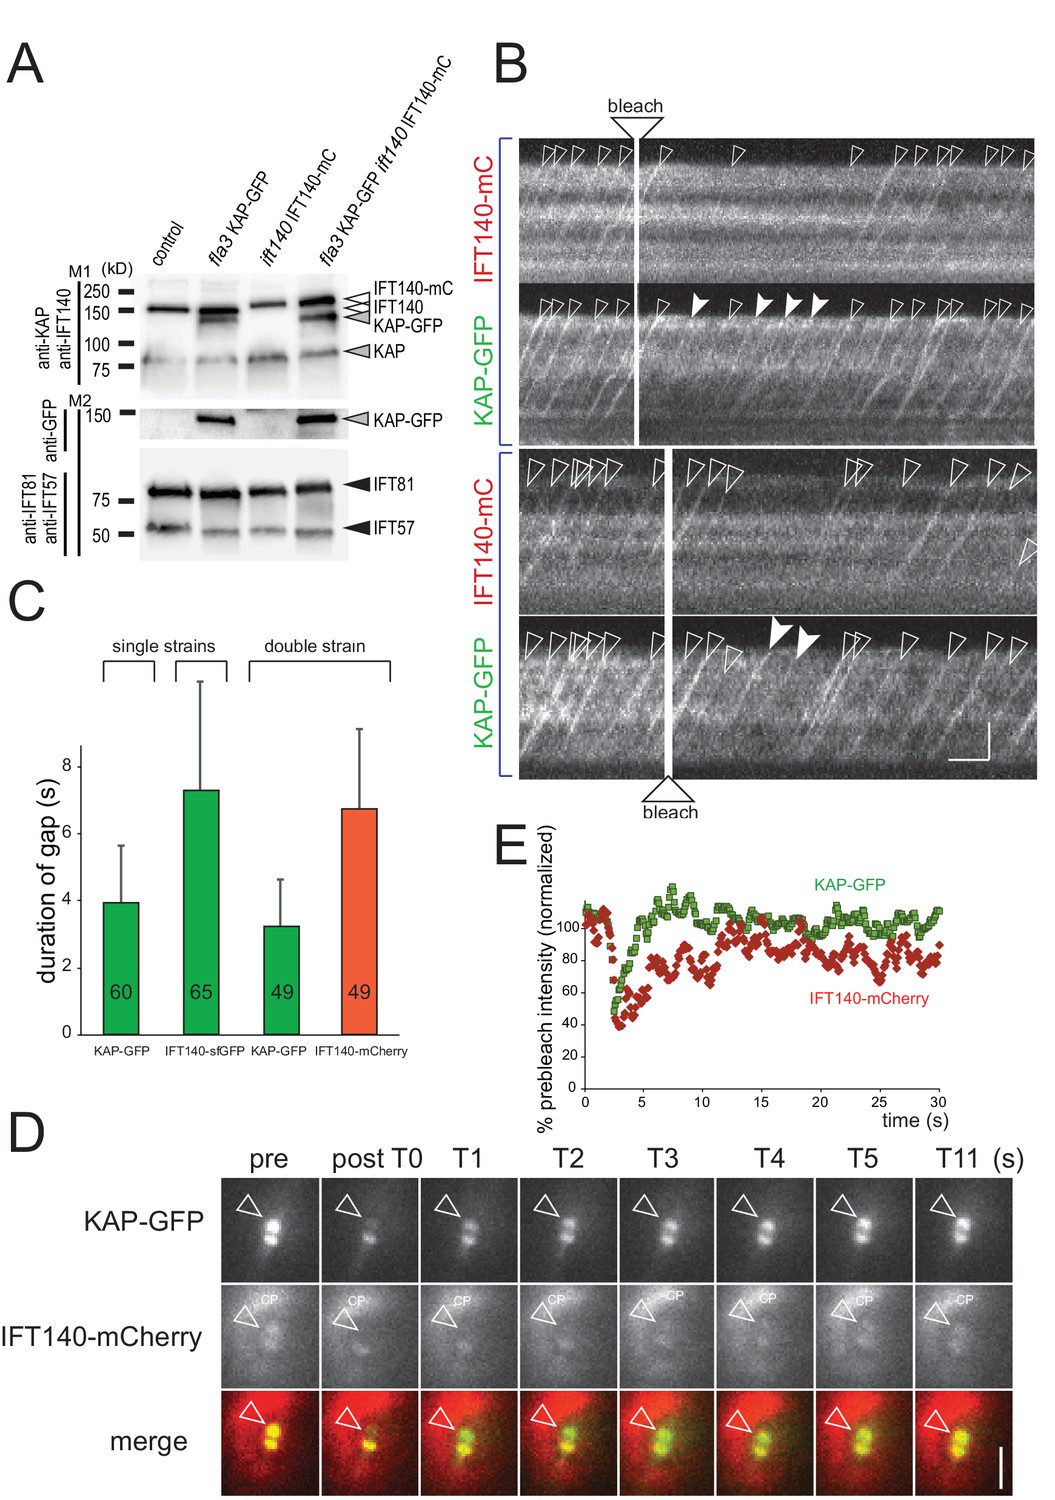
IFT140 is recruited early, KAP is recruited late during IFT train assembly.
(A) Western blot analysis of the flagellar ‘membrane + matrix’ fraction of a control (G1), the KAP-GFP, the IFT140-mC, and the KAP-GFP IFT140-mC strains; note that KAP-GFP was expressed in the fla3 which has a mutated endogenous KAP of reduced function. Two membranes (M1 and M2) loaded with the same amount of sample were stained with a mix of anti-KAP and anti-IFT140 (M1) or of IFT81 and IFT57 as loading controls (M2), the latter membrane was subsequently stained with anti-GFP. Molecular weight markers are indicated (in kD). (B) Two examples showing the recommencement of IFT traffic after photobleaching of the basal body in cells expressing KAP-GFP and IFT140-mCherry. Trains containing only unbleached KAP-GFP (filled arrowheads) appeared before trains containing both unbleached IFT140-mCherry and unbleached KAP-GFP (open arrowheads). Bars = 2 s 2 µm. (C) Histogram comparing the duration of the gap after bleaching of the bb-pool for strains expressing KAP-GFP, IFT140-sfGFP, or KAP-GFP and IFT140-mCherry. (D) FRAP analysis of the bb-pool in a cell expressing KAP-GFP and IFT140-mCherry. Note that the KAP-GFP signal recovered before the IFT140-mCherry signal. CP, chloroplast. (E) Quantification of the KAP-GFP and the IFT140-mCherry signals of the experiment depicted in C. Data are normalized for the signal strength of the control basal body pool.
Figure 7—figure supplement 1
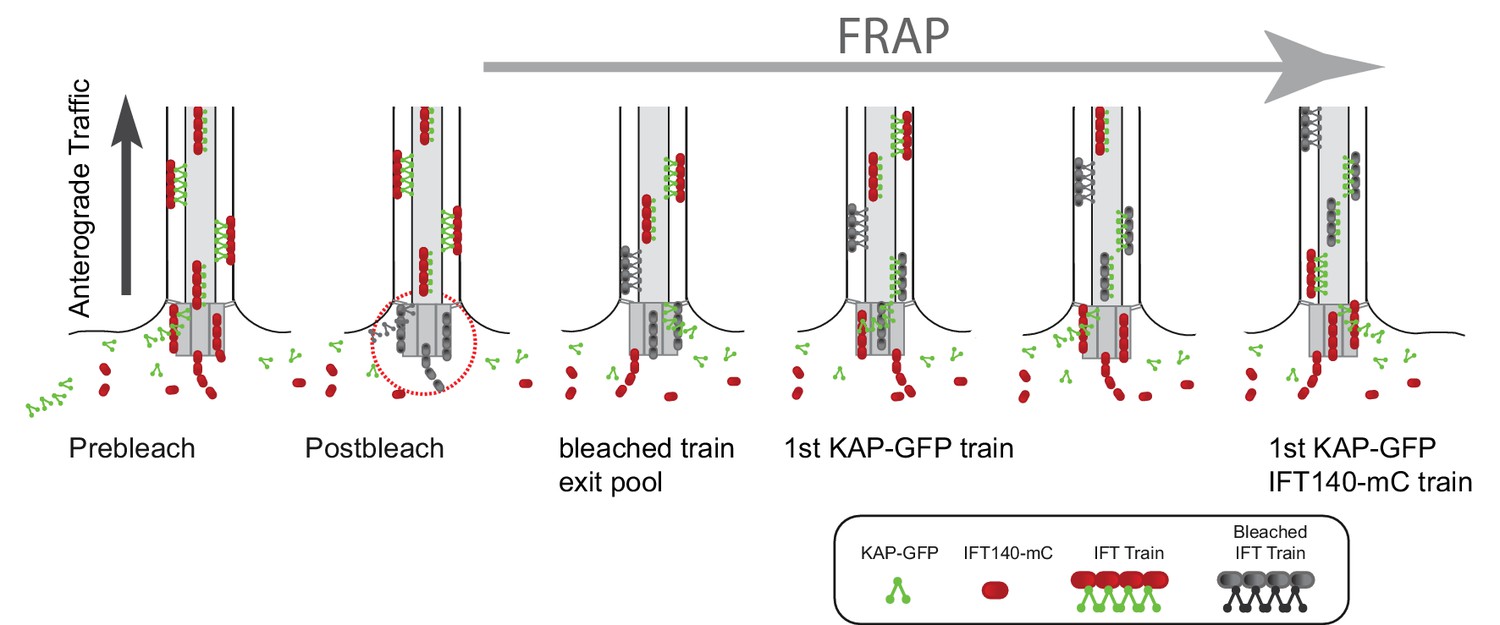
Model of the temporal and spatial organization of IFT proteins in the basal body pool.
Schematic drawings showing how the difference in the postbleach gap in anterograde IFT traffic can be explained by sequential recruiting of proteins into the pool. For simplicity, only KAP and IFT140 are shown. In the proposed model, IFT-A complexes of a given train are recruited early into the bb-pool to be later combined with kinesin-2 motors, which afterwards arrived in the pool.
Figure 8
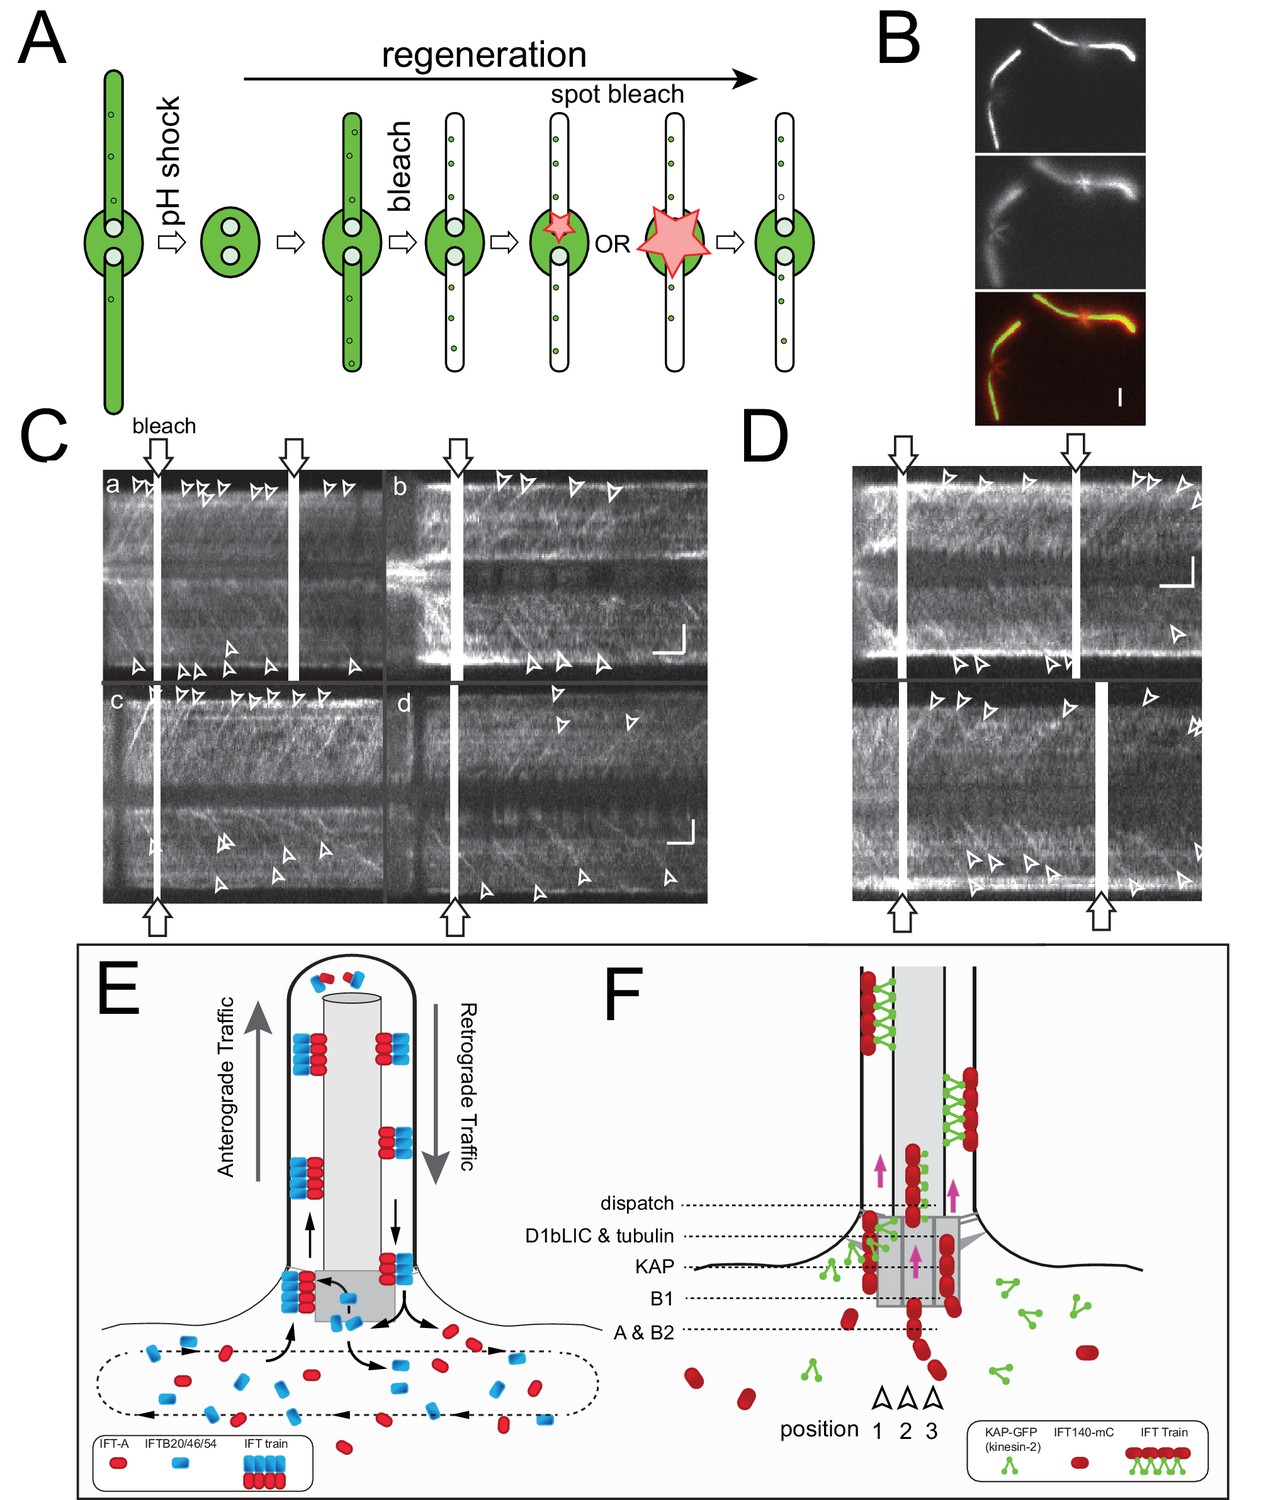
Tubulin is loaded briefly before IFT trains enter the cilium.
(A) Schematic presentation of the experimental design used to determine the gap in anterograde traffic of sfGFP-tubulin after photobleaching of the basal body. Cells were deflagellated by a pH shock, allowed to initiate regeneration, and mounted for TIRF analysis. Then, the two flagella were partially bleached, followed by spot bleaching of either one or both basal body pools (for the latter the size of the laser beam was extended to ~2 µm), and TIRF analysis of tubulin traffic. (B) Two images from a focal series showing the flagella and the microtubular roots; the latter were used to position the cells with respect to the laser beam. The two images are displayed in red and green in the merged image. Bar = 2 µm. (C) Gallery of kymograms from experiments in which one of the two basal body pools was bleached. The bleached basal bodies are oriented to the top. Bars = 2 s 2 µm (in d for a, c, d; in b for b). (D) Gallery of kymograms in which both basal body pools were bleached. In C and D, trajectories indicating IFT of tubulin are indicated by arrowheads. Bars = 2 s 2 µm. (E) Schematic presentation of the open IFT system. IFT-A proteins (and IFT27 and the motors) are recruited to the pool, cycle once through the flagellum, and return into the cell body pool. IFT-B proteins return to the bb-pool to be either reused in subsequent IFT trains or released into the cell body pool. IFT proteins mix in the cb-pool and are randomly re-deployed into IFT trains. (F) Model of the temporal-spatial organization of IFT proteins in the basal body pool. We propose that IFT trains assemble in distinct positions near the basal body from which they are sequentially released into the cilium upon completion. Assembly commences with the arrival of IFT-A complexes which then combine with the other IFT-subcomplexes and motors as they move toward the distal end of the basal body. For simplicity, only IFT-A and kinesin-2 are depicted. See also Figure 7—figure supplement 1.
Videos
Video 1
TIRF microscopy of NG-IFT54.
Chlamydomonas cells tend to adhere with their two flagella to smooth surfaces including cover glass allowing for TIRF imaging of fluorescently labeled proteins inside the flagella. The approximate positions of the flagellar tips (tip1 and tip2) and of the cell body (CB) are indicated. Images were acquired at 10 fps and the video is displayed in real time. The timer counts mm:ss.
Video 2
FRAP analysis of the basal body-associated IFT pool.
TIRF videos of cells expressing KAP-GFP (left) or the IFT particle protein NG-IFT54 (right) showing the IFT pools at the basal bodies. The pool facing to the right in each pair was bleached using brief illumination with a focused laser beam. Note fast recovery of the KAP-GFP signal and slower recovery of NG-IFT54. Images were acquired at 10 fps and playback is set at 20 fps (2 × speed). The timer counts mm:ss.
Video 3
FLIP analysis of the basal body-associated IFT pool.
Shown are the IFT pools for NG-IFT54 (left) and IFT43-YFP (right) during FLIP illumination. The tip of the flagellum attached to the upper basal body in each pair was illuminated with a blinking laser beam to prevent the return of unbleached IFT proteins via retrograde IFT to the attached basal body. The flagella are out of focus and the flashing laser beam is out of the field of view. Note progressive loss of fluorescence for NG-IFT54 in the experimental bb-pool until it reaches a plateau; IFT43-YFP levels in the experimental bb-pool are not affected by FLIP illumination when compared to the control pool but a general loss of signal strength occurs due to the low photostability of YFP and the prolonged illumination. Images were acquired at 10 fps and playback is set at 30 fps (3 × speed). The timer counts mm:ss.
Video 4
FRAP analysis of IFT88-YFP in primary cilia of IMCD3 cells.
The ciliary base of the photobleached cilium is marked by an arrow. Note that the recovered signal strength of the experimental cell is similar to those of the unbleached control cells. Still images of this movie are shown in Figure 4A. Images were acquired at 5 fps and playback is set at 40 fps (8 × speed). The timer counts mm:ss.
Video 5
FRAP analysis of GFP-Dyf-1 (IFT70) in T. thermophila cilia.
The basal body of the bleached cilium is marked by an arrow. For clarity, most of the over-exposed frames of the bleaching step were deleted. Still images of this movie are shown in Figure 4D. Images were acquired at 10 fps and playback is set at 80 fps (8 × speed). The timer counts mm:ss.
Video 6
Spatial analysis of IFT proteins in the pool and flagellum.
IFT in NG-IFT54 cells was monitored at the focus level of the basal bodies (top) or of the flagellum (bottom). Top) The two basal body-associated IFT pools are positioned in the center. Note the fluctuation in the signal intensity in the pools as trains exit and arrive. Often, only a part of the pool signal is bleached indicative for the exit of trains from a particular region of the pool. Bottom) IFT trains moving inside a flagellum. Some trains move closer to the top, other closer to the bottom of the flagellum. Images were acquired at 10 fps and the video is displayed at 20 fps (2 × speed). The timer counts mm:ss.
Video 7
Photobleaching of the IFT pool is followed by a gap in anterograde IFT of fluorescent protein.
One of the two basal bodies of a KAP-GFP (A, top) and a NG-IFT54 cell (B, bottom) was bleached. This results in an interruption of anterograde IFT of fluorescent protein. The gap is short for KAP-GFP and longer for NG-IFT54. This can be best viewed by first focusing on the KAP-GFP flagellum pointing to the right. Once the first unbleached KAP-GFP trains re-appear after the bleaching step, the viewer should focus on the right NG-IFT54 flagellum: At this time point only retrograde but no fluorescent anterograde trains are visible in the NG-IFT54 flagellum. Anterograde IFT of NG-IFT54 will resume a few seconds later. Images were acquired at 10 fps and the video is displayed at 20 fps (2 × speed). The timer counts mm:ss.
Video 8
Gap analysis of a cell expressing KAP-GFP and IFT140-mCherry.
Follow the viewing instruction described for Video 7. Note brief (~2 s) gap between the first post-bleach KAP-GFP train and the first postbleach IFT140-mC train. Images were acquired at 10 fps and the video is displayed at 20 fps (2 × speed). The timer counts mm:ss.
Download links
A two-part list of links to download the article, or parts of the article, in various formats.
Downloads (link to download the article as PDF)
Open citations (links to open the citations from this article in various online reference manager services)
Cite this article (links to download the citations from this article in formats compatible with various reference manager tools)
IFT trains in different stages of assembly queue at the ciliary base for consecutive release into the cilium
eLife 6:e26609.
https://doi.org/10.7554/eLife.26609


