SOX2 regulates acinar cell development in the salivary gland
- University of California, San Francisco, United States
- Blood Systems Research Institute, United States
Figures
Figure 1
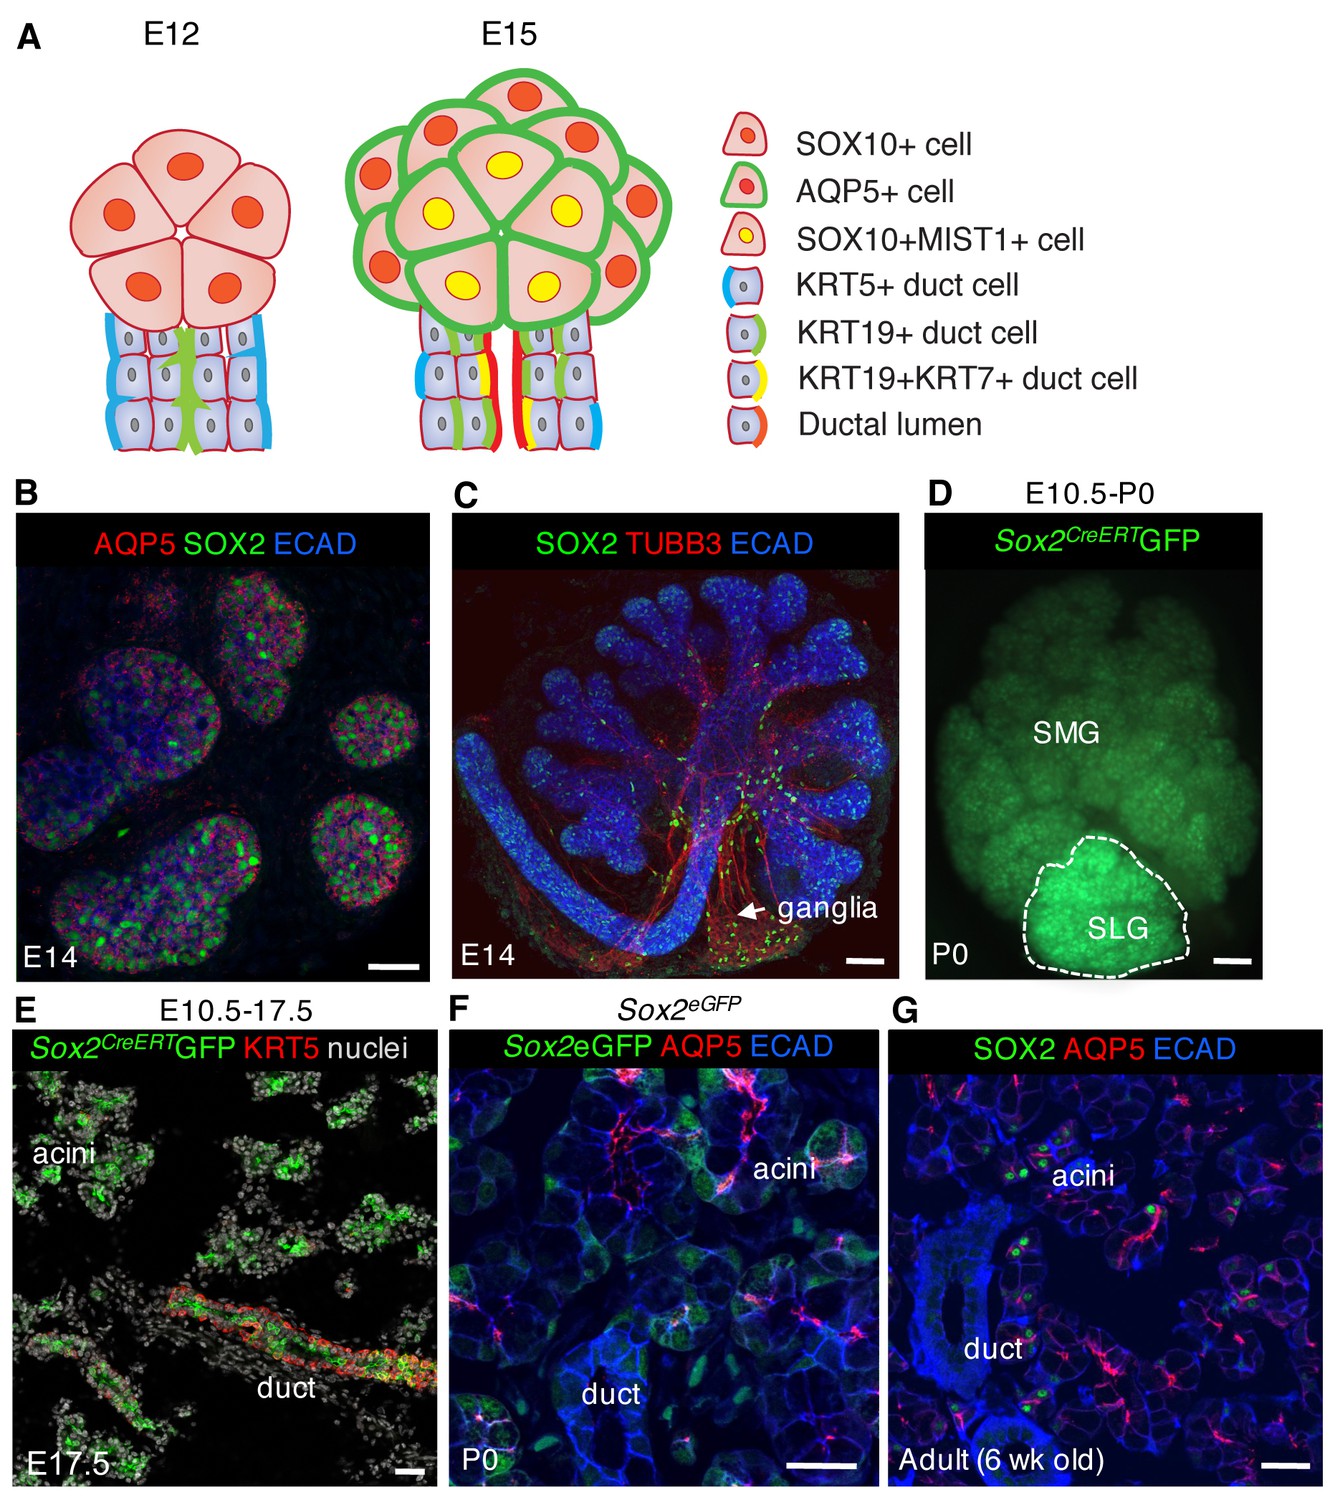
SOX2 marks a progenitor cell population in the salivary gland that gives rise to acinar and duct cells.
(A) Schematic showing markers of acinar and duct cells at E12 and E15. (B) E14 SLG stained for AQP5, SOX2 and E-cadherin (ECAD). Scale bar is 20 µm. (C) Immunostaining of E14 SLG for SOX2, nerves (TUBB3) and Ecadherin-positive epithelial cells (ECAD). (D and E) Recombination was induced in Sox2CreERT2;Rosa26mTmG mice at E10.5 and SMG+SLG traced until E17.5 or P0. (E) SLG were immunostained for KRT5 (red) and nuclei. (F and G) Representative images of P0 Sox2eGFP (F) and adult wild-type (G) SLG immunostained for the acinar marker AQP5, ECAD and/or SOX2. Scale bars in F and G are 20 µm, (C) and E are 50 µm and D is 100 µm; Images in B, E, F and G are 2 µm confocal sections and the image in C is a 30 µm projection of 4 µm sections.
Figure 2 with 1 supplement
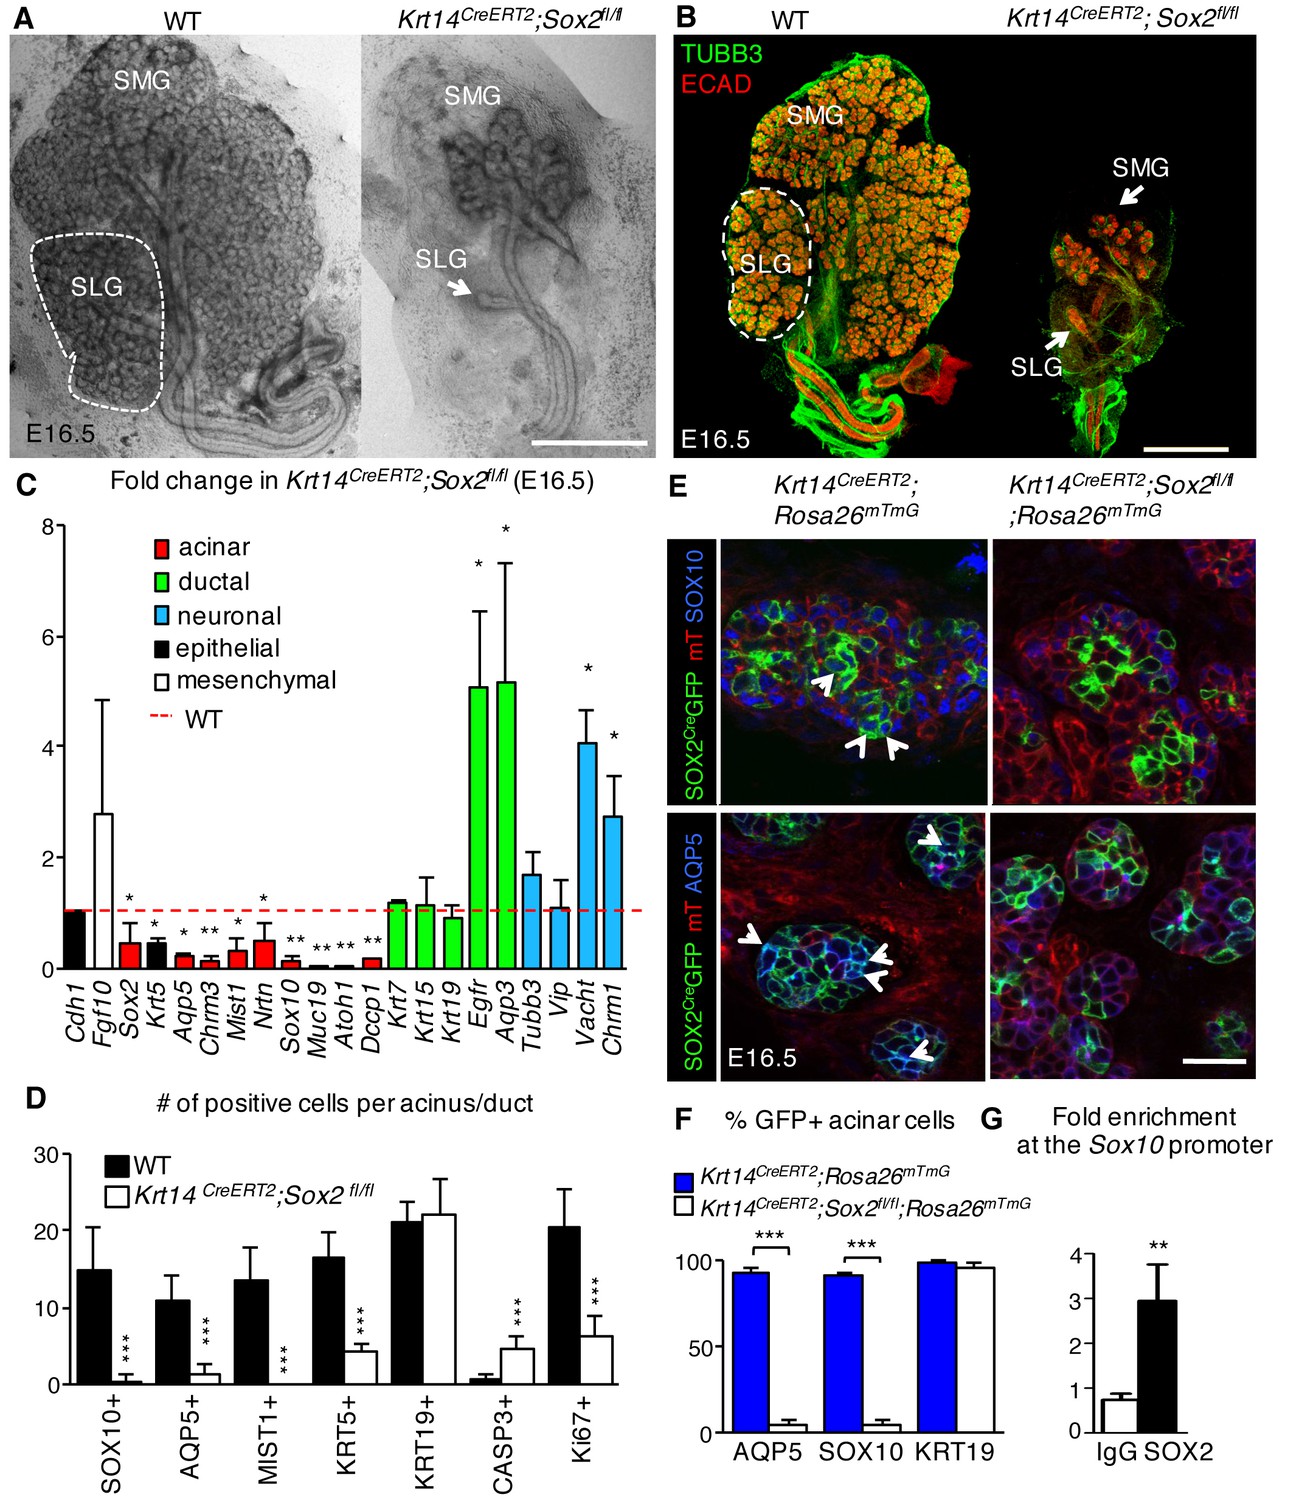
SOX2 is essential for establishing SOX10+ acini during organogenesis.
(A–D) SMG+SLG from Krt14CreERT2; Sox2fl/fl and wild-type (WT) embryos in which recombination was induced before gland ontogenesis at E10.5 and 11.5. (A) Representative brightfield images of Krt14CreERT2; Sox2fl/fl and wild-type (WT) SMG+SLG at E16.5. Scale bar is 1 mm. (B) Representative images of SMG+SLG immunostained for nerves (TUBB3) and epithelium (Ecadherin, ECAD). Scale bar is 1 mm. SMG = submandibular gland, SLG = sublingual gland. Dashed white line denotes SLG. (C) qPCR analysis of E16.5 Krt14CreERT2; Sox2fl/fl and wild-type (WT) SMG+SLG for genes involved in acinar differentiation, ductal differentiation and innervation, with expression normalized to Rsp29. Red dashed line = WT. n = 3 embryos per genotype. Data are means+s.d. and were analyzed using a one-way analysis of variance with post-hoc Dunnett’s test. *p<0.05, **p<0.01. (D) Quantification of cells expressing acinar or ductal markers, cleaved caspase-3 or Ki67 in acini of E16.5 in Krt14CreERT2; Sox2fl/fl and wild-type (WT). n = 2–4 glands/genotype and cells were counted in 3–4 acini/gland. Data are means+s.d. and were analyzed using a Student’s t-test, ***p<0.001. (E and F) SMG+SLG from Krt14CreERT2; Rosa26mTmG and Krt14CreERT2; Rosa26mTmG; Sox2fl/fl in which recombination was induced at E10.5 and 11.5 were immunostained for SOX10 and AQP5 (E) and GFP+ cells expressing SOX10 and AQP5 were quantified (F). n = 3 glands/genotype and cells were counted in 3–4 acini/gland. Data were subjected to a Student’s t-test, ***p<0.001. Scale bar in E is 20 µm. Arrowheads indicate double positive cells. (G) qPCR for enrichment of Sox10 in SOX2 ChIP. n = 20 pooled SLG, average three experiments, *p<0.05. Additional data for this figure in Figure 2—figure supplement 1.
-
Figure 2—source data 1
Source data relating to Figure 2C.
qPCR analysis of E16.5 Krt14CreERT2; Sox2fl/fl and wild-type (WT) SMG+SLG for genes involved in acinar differentiation, ductal differentiation and innervation, with expression normalised to Rsp29 and the WT. n = 3 embryos per genotype. s.d. = standard deviation.
- https://doi.org/10.7554/eLife.26620.005
-
Figure 2—source data 2
Source data relating to Figure 2D.
Quantification of cells expressing acinar or ductal markers, cleaved caspase-3 or Ki67 in acini of E16.5 in Krt14CreERT2; Sox2fl/fl and wild-type (WT). n = 2–4 glands/genotype and cells were counted in 3–4 acini/gland. s.d. = standard deviation.
- https://doi.org/10.7554/eLife.26620.006
-
Figure 2—source data 3
Source data relating to Figure 2F.
SMG+SLG from Krt14CreERT2; Rosa26mTmG and Krt14CreERT2; Rosa26mTmG; Sox2fl/fl were immunostained for SOX10 and AQP5 and GFP+ cells expressing SOX10 and AQP5 were quantified and expressed as a percentage of total positive cells. n = 3 glands/genotype and cells were counted in 3–4 acini/gland. s.d. = standard deviation.
- https://doi.org/10.7554/eLife.26620.007
-
Figure 2—source data 4
Source data relating to Figure 2G.
qPCR for enrichment of Sox10 in SOX2 ChIP. n = 20 pooled SLG, average three experiments. s.d. = standard deviation.
- https://doi.org/10.7554/eLife.26620.008
Figure 2—figure supplement 1

Acini are depleted in the absence of Sox2.
Representative images of Krt14CreERT2; Sox2fl/fl and wild-type (WT) SMG+SLG at E13 (A; scale bar is 100 μm), E13.5 (B; top and bottom panels; scale bars are 100 and 50 μm, respectively) and E16.5 (C; scale bar is 200 µm (top panels), 50 µm (second and fourth panels) and 10 µm (third panels)). SMG = submandibular gland, SLG = sublingual gland. E13.5 SGs (B) were immunostained for SOX2 and E-cadherin (ECAD) and E16.5 SMG+SLG (C) for KRT19, MIST1, SOX10, AQP5, KRT5, Ecadherin (ECAD) and nuclei. Dashed white lines outline acini. Lower panel in B highlights the oral epithelium of the E13.5 SG. (D–E) Quantification of acini at E13.5 and E16.5 is shown in D (n = 3–7) and E (n = 3), with WT set to 100%. Data in D and E were analyzed using a Student’s t-test, *p<0.05, **p<0.01. (F and G) qPCR analysis of gene expression of SG from Krt14CreERT2; Sox2fl/fl versus wild-type littermate (WT) at E13.5 (F) and E16.5 (G). Red dashed line = WT. Data are means+s.d. of 3–4 SMG+SLG per genotype. Data in F and G were analyzed using a one-way analysis of variance with a post-hoc Dunnett’s test. *p<0.05, **p<0.01.
-
Figure 2—figure supplement 1—source data 1
Source data relating to Figure 2—figure supplement 1D.
Quantification of acini in Krt14CreERT2; Sox2fl/fl and wild-type (WT) glands at E13.5, with WT set to 100%. n = 3–7. s.d. = standard deviation.
- https://doi.org/10.7554/eLife.26620.010
-
Figure 2—figure supplement 1—source data 2
Source data relating to Figure 2—figure supplement 1E.
Quantification of acini in Krt14CreERT2; Sox2fl/fl and wild-type (WT) glands at E16.5, with WT set to 100%. n = 3–7. s.d. = standard deviation.
- https://doi.org/10.7554/eLife.26620.011
-
Figure 2—figure supplement 1—source data 3
Source data relating to Figure 2—figure supplement 1F.
qPCR analysis of gene expression in Krt14CreERT2; Sox2fl/fl and wild-type (WT) glands at E13.5. Data were normalized to Rsp29 and WT. n = 3–4 SMG+SLG per genotype. s.d. = standard deviation.
- https://doi.org/10.7554/eLife.26620.012
-
Figure 2—figure supplement 1—source data 4
Source data relating to Figure 2—figure supplement 1G.
qPCR analysis of gene expression in Krt14CreERT2; Sox2fl/fl and wild-type (WT) glands at E16.5. Data were normalized to Rsp29 and WT. n = 3–4 SMG+SLG per genotype. s.d. = standard deviation.
- https://doi.org/10.7554/eLife.26620.013
Figure 3
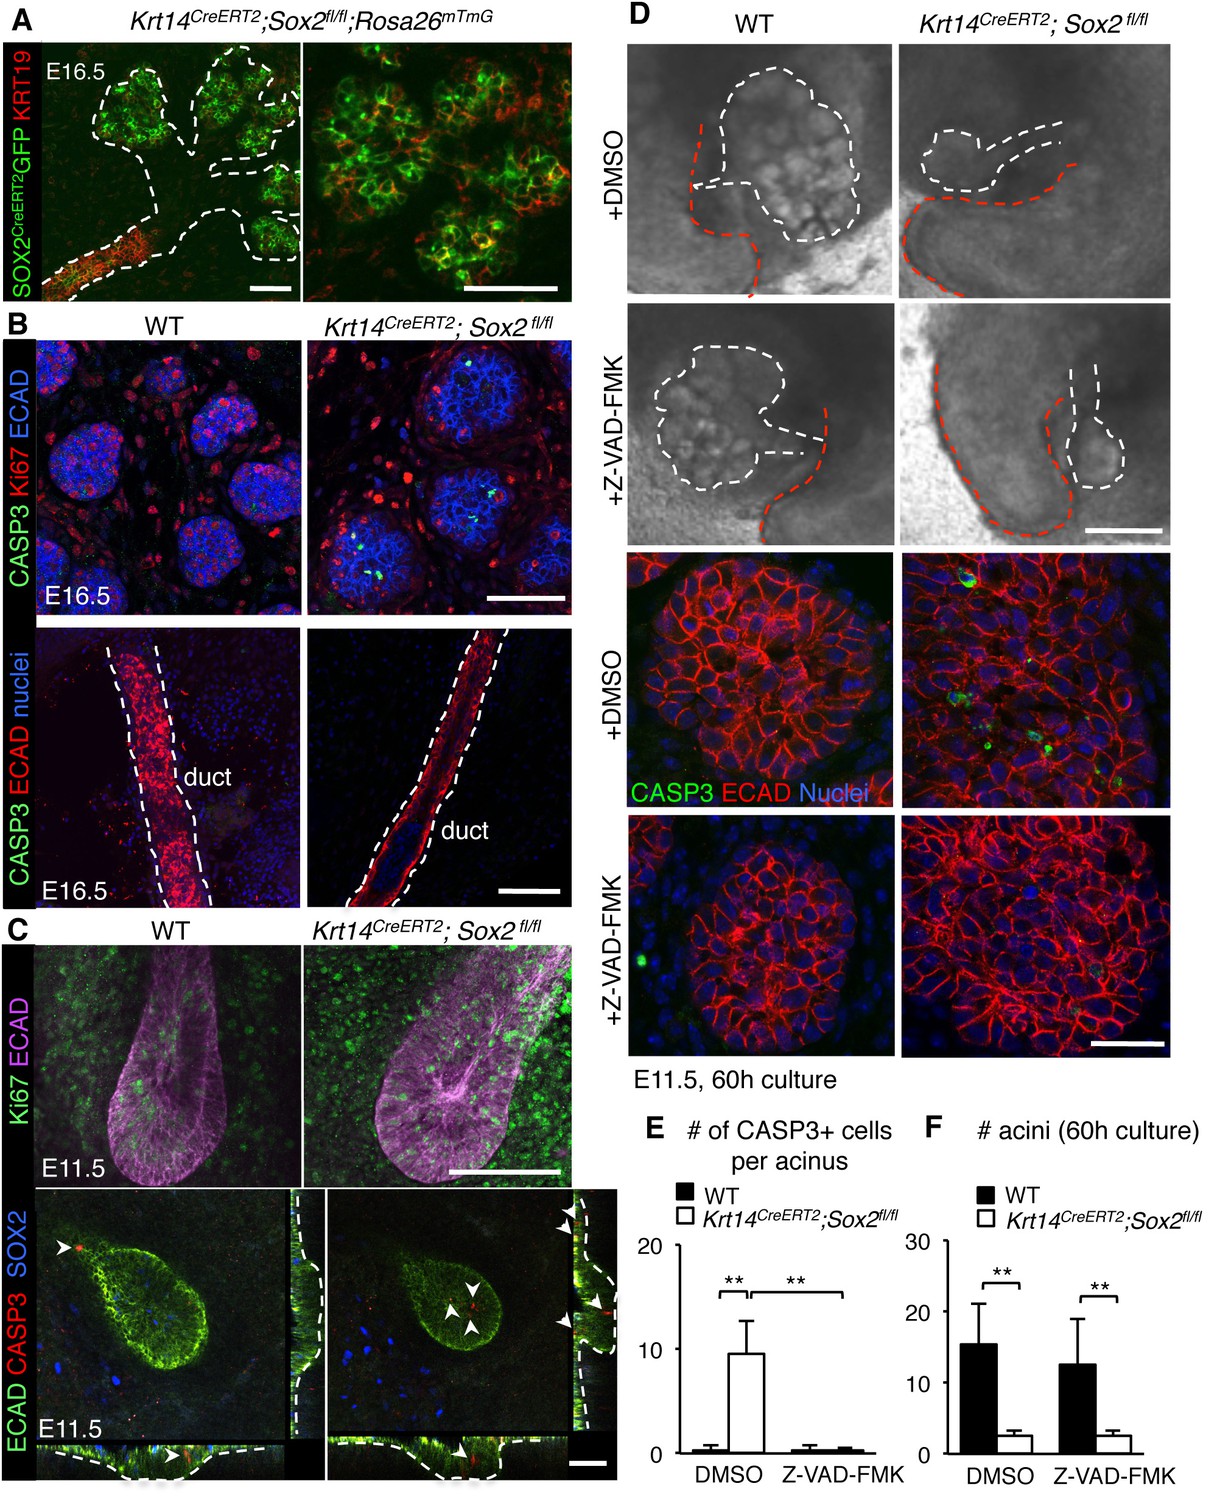
Regulation of the acinar lineage by SOX2 is independent of its function in cell survival.
(A–C) Representative images of SMG+SLG from WT, Krt14CreERT2; Sox2fl/fl; Rosa26mTmG or Krt14CreERT2; Sox2fl/fl immunostained for the ductal marker KRT19, apoptotic marker CASP3, proliferation marker Ki67, SOX2, ECAD and/or nuclei. Scale bars are 50 µm. Images in A, B and lower panel C are 1–2 µm confocal sections; images in C upper panel are 20 µm projections of 1.5 µm sections. Recombination was induced at E10.5 and E11.5 for images in A and B, and E10.5 for images in C. (D) Representative images of E11.5 mandibles from Krt14CreERT2; Sox2fl/fl and wild-type (WT) cultured for 60 hr in the presence of DMSO or the pan-caspase inhibitor ZVAD-FMK (50 µM). SMG+SLG (lower panels) were immunostained for Ecadherin (ECAD), nuclei and cleaved caspase-3 (CASP3). White dashed line (upper panels) denotes SMGs branching off the tongue. Red dashed line indicates tongue. Scale bars are 200 µm (upper panels) and 25 µm (lower panels). (E, F) Quantification of the number of CASP3+ cells (E) and acini (F). n = 3 glands per treatment and cells were counted in 3–4 end acini per gland (E). Data in E and F are means+s.d. of three biological replicates and two experiments. Data were analyzed using a Students t-test. *p<0.05, **p<0.01.
-
Figure 3—source data 1
Source data relating to Figure 3E.
Quantification of the number of CASP3+ cells in acini of E11.5 Krt14CreERT2; Sox2fl/fl and wild-type (WT) glands cultured for 60 hr ± Z-VAD-FMK. n = 3 glands per treatment and cells were counted in 3–4 acini per gland. Data are the mean of three biological replicates and two experiments. s.d. = standard deviation.
- https://doi.org/10.7554/eLife.26620.015
-
Figure 3—source data 2
Source data relating to Figure 3F.
Quantification of the number of acini of E11.5 Krt14CreERT2; Sox2fl/fl and wild-type (WT) glands cultured for 60 hr ± Z-VAD-FMK. n = 3 glands per treatment. Data are means of three biological replicates and two experiments. s.d. = standard deviation.
- https://doi.org/10.7554/eLife.26620.016
Figure 4
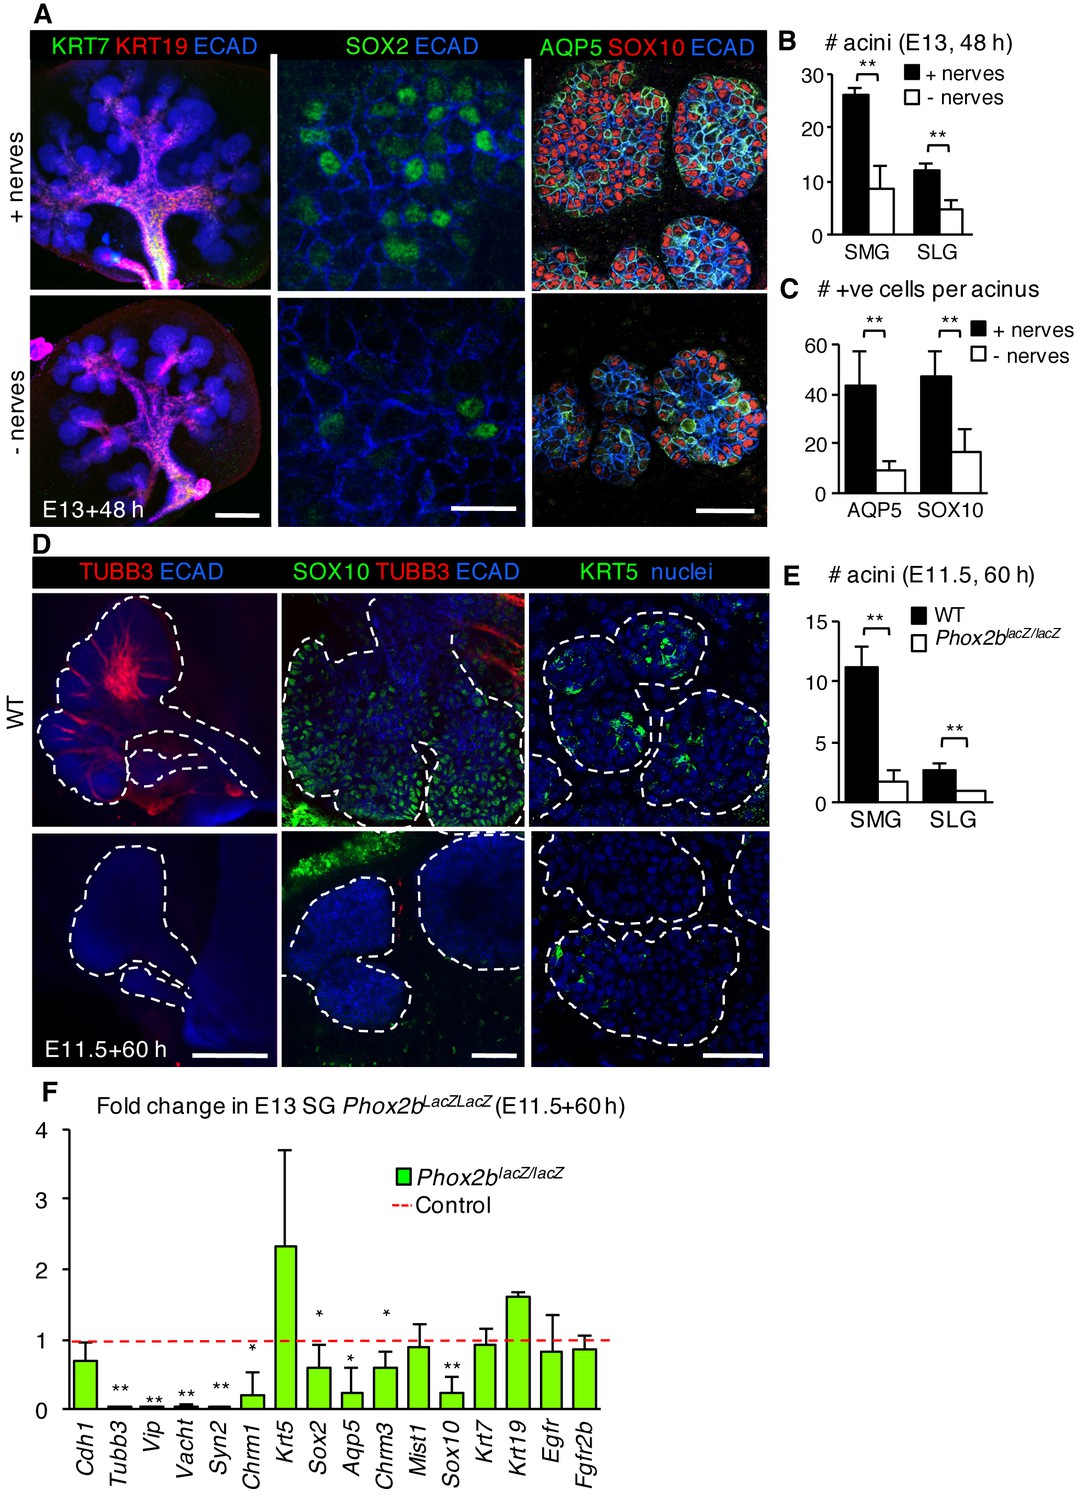
The acinar cell lineage and SOX2 are selectively depleted in the absence of parasympathetic nerves.
(A–C) E13 murine SMG+SLG cultured for 48 hr ± parasympathetic ganglion (nerves) and subjected to immunofluorescent analysis (A). Glands were immunostained for markers of duct cells (KRT19, KRT7), SOX2, SOX10+ acinar progenitors, AQP5+ acinar cells and epithelial cells (E-cadherin; ECAD). The number of acini (B) and AQP5+ and SOX10+ cells (C) were quantified. (D–F) E11.5 murine SMG+SLG deficient in Phox2b were cultured for 60 hr. Glands were were immunostained for markers of nerves (TUBB3), acinar progenitors (SOX10), basal epithelial progenitors (KRT5) and epithelial cells (E-cadherin; ECAD; D), the number of acini were quantified (E) or qPCR was performed. (F; n = 3 embryos per genotype). Scale bars = 200 µm in (A), left panels and (D), left panels; 50 µm in (A), right panels and (D), middle and right panels; 20 µm in (A), middle panels. Data in B, C and E are means ± s.d of three biological replicates and three experiments and were subjected a Student’s t-test. *p<0.05 **p<0.01. Data in F are means+s.d. and were analyzed using a one-way analysis of variance with post-hoc Dunnett’s test. *p<0.05, **p<0.01.
-
Figure 4—source data 1
Source data relating to Figure 4B.
E13 murine SMG+SLG cultured for 48 hr ± parasympathetic ganglion (nerves). The number of acini were quantified. Data are means of three biological replicates and three experiments. s.d. = standard deviation.
- https://doi.org/10.7554/eLife.26620.018
-
Figure 4—source data 2
Source data relating to Figure 4C.
E13 murine SMG+SLG cultured for 48 hr ± parasympathetic ganglion (nerves) and subjected to immunofluorescent analysis. The number of AQP5+ and SOX10+ cells were quantified. Data are means of three biological replicates and three experiments. s.d. = standard deviation.
- https://doi.org/10.7554/eLife.26620.019
-
Figure 4—source data 3
Source data relating to Figure 4E.
E11.5 murine SMG+SLG deficient in Phox2b were cultured for 60 hr. The number of acini were quantified. Data are means of three biological replicates and three experiments. s.d. = standard deviation.
- https://doi.org/10.7554/eLife.26620.020
-
Figure 4—source data 4
Source data relating to Figure 4F.
E11.5 murine SMG+SLG deficient in Phox2b were cultured for 60 hr and qPCR performed. Data were normalized to Rsp29 and the WT. Data are means of three biological replicates and three experiments. s.d. = standard deviation.
- https://doi.org/10.7554/eLife.26620.021
Figure 5 with 1 supplement

Muscarinic signaling regulates the acinar lineage and SOX2+ cells.
(A–B) E14 mouse SLG epithelia cultured with FGF10 ±CCh for 24 hr. White dashed line outlines acini. Arrows indicate double positive SOX2+EdU+ cells. Scale bar is 50 µm. The number of SOX2+, EdU+ and SOX2+EdU+ cells was quantified in B. (C–E) E14 mouse SLG cultured for 24 hr with DMSO or 4-DAMP (10 µM). The number of SOX2+ and SOX2+Ki67+ cells were counted via FACS, normalized to control and expressed as percentage of total ECAD+ cells (C). In D and E, cultured glands were immunostained for SOX2, nerves (TUBB3), AQP5, KRT19 and Ecadherin (ECAD). Images are 50 µm projections of 5 µm confocal sections. Scale bars are 100 µm. (F–H) E13 SMG+SLG were cultured ± ganglia and ± CCh (100 nM) for 48 hr and immunostained for AQP5 (F) and the number of AQP5+ and KRT19+ cells counted (G). SMG+SLG were also subjected to qPCR analysis (H). Data in B, C, G and H are means ±s.d of three biological replicates and three experiments. Data in B, C and G were subjected a Student’s t-test. *p<0.05 **p<0.01. Data in H were analyzed using a one-way analysis of variance with a post-hoc Dunnett’s test. *p<0.05, **p<0.01. Additional data for this figure in Figure 5—figure supplement 1.
-
Figure 5—source data 1
Source data relating to Figure 5B.
E14 mouse SLG epithelia cultured with FGF10 ±CCh for 24 hr. The number of SOX2+, EdU+ and SOX2+EdU+ cells were quantified. Data are means of three biological replicates and three experiments. s.d. = standard deviation.
- https://doi.org/10.7554/eLife.26620.023
-
Figure 5—source data 2
Source data relating to Figure 5C.
E14 mouse SLG cultured for 24 hr with DMSO or 4-DAMP (10 µM). The number of SOX2+ and SOX2+Ki67+ cells were counted via FACS, normalized to control and expressed as percentage of total ECAD+ cells. s.d. = standard deviation.
- https://doi.org/10.7554/eLife.26620.024
-
Figure 5—source data 3
Source data relating to Figure 5G.
E13 SMG+SLG were cultured ± ganglia and ± CCh (100 nM) for 48 hr and the number of AQP5+ and KRT19+ cells counted. Counts were normalized to the control (nerves). Data are means of three biological replicates and three experiments. s.d. = standard deviation.
- https://doi.org/10.7554/eLife.26620.025
-
Figure 5—source data 4
Source data relating to Figure 5H.
E13 SMG+SLG were cultured ± ganglia and ± CCh (100 nM) for 48 hr and subjected to qPCR analysis. Data were normalized to Rsp29 and control (nerves). Data are means of three biological replicates and three experiments. s.d. = standard deviation.
- https://doi.org/10.7554/eLife.26620.026
Figure 5—figure supplement 1

Muscarinic signaling regulates the acinar lineage and SOX2+ cells.
(A) Flow cytometry plots show gating strategy to analyze SOX2+ cells versus SOX2- cells (left) and gating strategy to analyze percentage of SOX2+/SOX2- cells that express the muscarinic receptor CHRM1 (right). SSC-H = side scatter height, 100,000 events were analyzed per sample. (B) E13 SLG cultured for 24 hr and stained for CHRM1, lectin peanut agglutinin (PNA; basement membrane and epithelial marker) and nerves (TUBB3). Scale bar is 20 µm. (C–E) E14 mouse SLGs cultured for 4 or 24 hr with DMSO or the muscarinic inhibitor 4-DAMP (10 µM). In C, glands were cultured for 4 hr and subjected to gene profiling by qPCR. Data were normalized to Rsp29 and control values (DMSO; dashed line), and analyzed using a one-way analysis of variance with post-hoc Dunnett’s test. *p<0.05, **p<0.01. (D) Representative image of SLG cultured for 24 hr immunostained for SOX10 and Ecadherin (ECAD). Image is a 28 µm projections of 2 µm sections. Scale bar is 50 µm. The number of AQP5+, KRT19+, SOX10+, Ki67+ remaining in SLG cultured with or without 4-DAMP for 24 hr were quantified in E (n = 2 SLG per treatment and cells were counted in 3–4 end acini per gland). Data in C and E are means+s.d of four to five biological replicates and three experiments. Data in E were subjected a Student’s t-test. *p<0.05, **p<0.01. (F) E14 mouse SLGs cultured for four with PD 168393 (20 μM), KN-93 (15 μM) or vehicle (water). Data are means±s.d. of three to four SGs per treatment/genotype normalized to Rsp29 and control values (vehicle or WT control; dashed line). Data in C and F were analyzed using a one-way analysis of variance with post-hoc Dunnett’s test. *p<0.05, **p<0.01.
-
Figure 5—figure supplement 1—source data 1
Source data relating to Figure 5—figure supplement 1C.
E14 mouse SLGs cultured for 4 hr with DMSO or the muscarinic inhibitor 4-DAMP (10 µM) and subjected to gene profiling by qPCR. Data were normalized to Rsp29 and control values (DMSO). s.d. = standard deviation.
- https://doi.org/10.7554/eLife.26620.028
-
Figure 5—figure supplement 1—source data 2
Source data relating to Figure 5—figure supplement 1E.
E14 mouse SLGs cultured for 24 hr with DMSO or the muscarinic inhibitor 4-DAMP (10 µM). The number of AQP5+, KRT19+, SOX10+, Ki67+ remaining in SLG cultured with or without 4-DAMP for 24 hr were quantified. n = 2 SLG per treatment and cells were counted in 3–4 end acini per gland. s.d. = standard deviation.
- https://doi.org/10.7554/eLife.26620.029
-
Figure 5—figure supplement 1—source data 3
Source data relating to Figure 5—figure supplement 1F.
E14 mouse SLGs cultured for 4 hr with PD 168393 (20 μM), KN-93 (15 μM) or vehicle (water; Control) were subjected to gene profiling by qPCR. Data were normalized to Rsp29 and control values. Data are means of three to four SGs per treatment/genotype. s.d. = standard deviation.
- https://doi.org/10.7554/eLife.26620.030
Figure 6 with 1 supplement
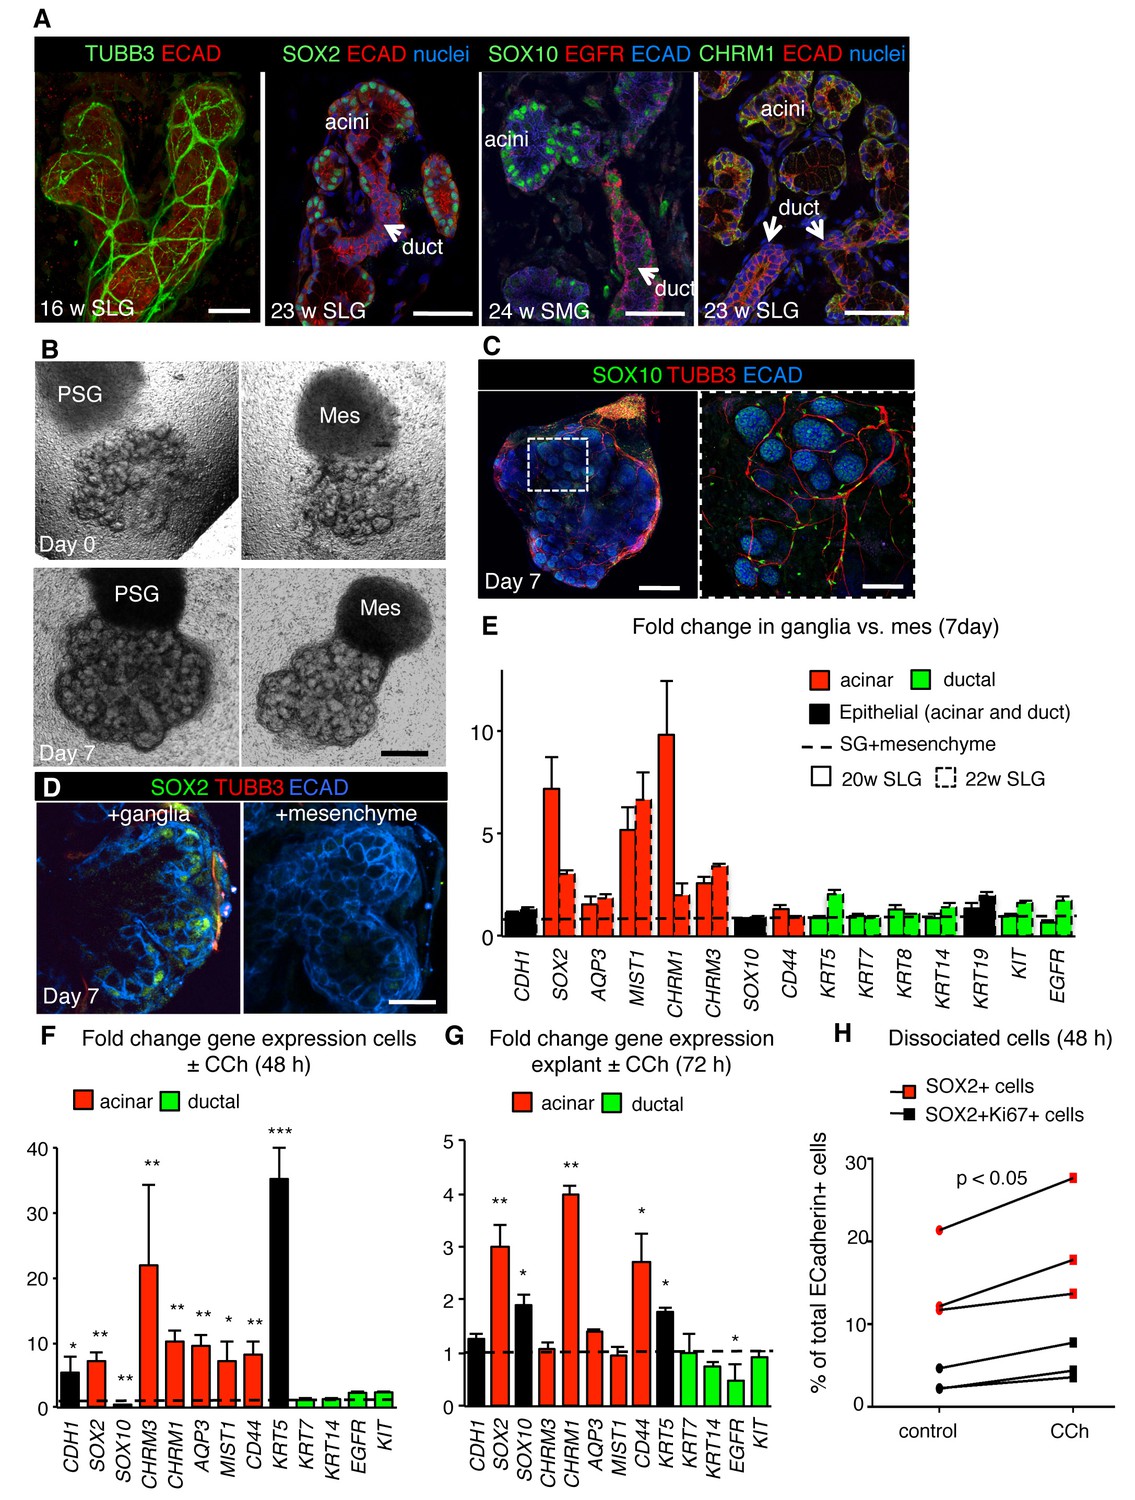
Parasympathetic regulation of SOX2 and the acinar lineage is conserved from mice to humans.
(A) Immunofluorescent analysis of TUBB3+ nerves as well as SOX2-, SOX10-, CHRM1- and EGFR-expressing cells in fetal human submandibular (SMG) or sublingual (SLG) at 16–24 w. E-cadherin (ECAD) marks epithelial cells. Image of the 16 w SLG is a 20 µm stack of 1 µm confocal sections. All other images are 1–2 µm confocal sections. (B) Brightfield images of SLG explants cultured with E13 murine parasympathetic ganglion (PSG) or mesenchyme alone (MES) at day 0 (upper panels) and day 7 (lower panels). (C–E) Explants cultured with murine E13 PSG or mesenchyme for 7 days were subjected to immunofluorescent analysis for SOX10, ECAD and TUBB3+ nerves and SOX2 (C, D) or gene profiling by qPCR (E). Data in E (six biological replicates, two individual experiments) are means+s.d. Scale bar is 50 µm (A, C (right panel)), 500 µm (B, C (left panel), 20 µm (D). (F–H) Analysis of fetal human SLG (22–23 w) dissociated cells (F and H) or explants (G) cultured ± CCh for 48–72 hr. (H) The number of ECAD+SOX2+ (red markers) and ECAD+SOX2+Ki67+ (black markers) cells were measured by FACS as a percentage of cells of total ECAD+ cells. Each line represents an independent experiment. In F and G fold changes in gene expression in dissociated cells or explants were determined via qPCR with expression normalised to GAPDH and control values (dashed line). Data in H were analyzed using a Wilcoxon signed-rank test. Data in F and G were analyzed using a one-way analysis of variance with post-hoc Dunnett’s test. *p<0.05, **p<0.01. Additional data for this figure in Figure 6—figure supplement 1.
-
Figure 6—source data 1
Source data relating to Figure 6E.
Human fetal SLG explants cultured with murine E13 PSG or mesenchyme for 7 days were subjected to gene profiling by qPCR. Data were normalized to GAPDH and control (+ mesenchyme). Data are means of six biological replicates, two individual experiments. s.d. = standard deviation.
- https://doi.org/10.7554/eLife.26620.032
-
Figure 6—source data 2
Source data relating to Figure 6F.
qPCR analysis of fetal human SLG (22–23 w) dissociated cells cultured ± CCh for 48 hr. Data were normalized to GAPDH and control (-CCh). Data are means of six biological replicates, two individual experiments. s.d. = standard deviation.
- https://doi.org/10.7554/eLife.26620.033
-
Figure 6—source data 3
Source data relating to Figure 6G.
qPCR analysis of fetal human SLG (22–23 w) explants cultured ± CCh for 72 hr. Data were normalized to GAPDH and control (-CCh). Data are means of six biological replicates, two individual experiments. s.d. = standard deviation.
- https://doi.org/10.7554/eLife.26620.034
-
Figure 6—source data 4
Source data relating to Figure 6H.
Analysis of fetal human SLG (22–23 w) dissociated cells cultured ± CCh for 48 hr. The number of ECAD+SOX2+ and ECAD+SOX2+Ki67+ cells were measured by FACS as a percentage of total ECAD+ cells. Each # represents an independent experiment. s.d. = standard deviation.
- https://doi.org/10.7554/eLife.26620.035
Figure 6—figure supplement 1
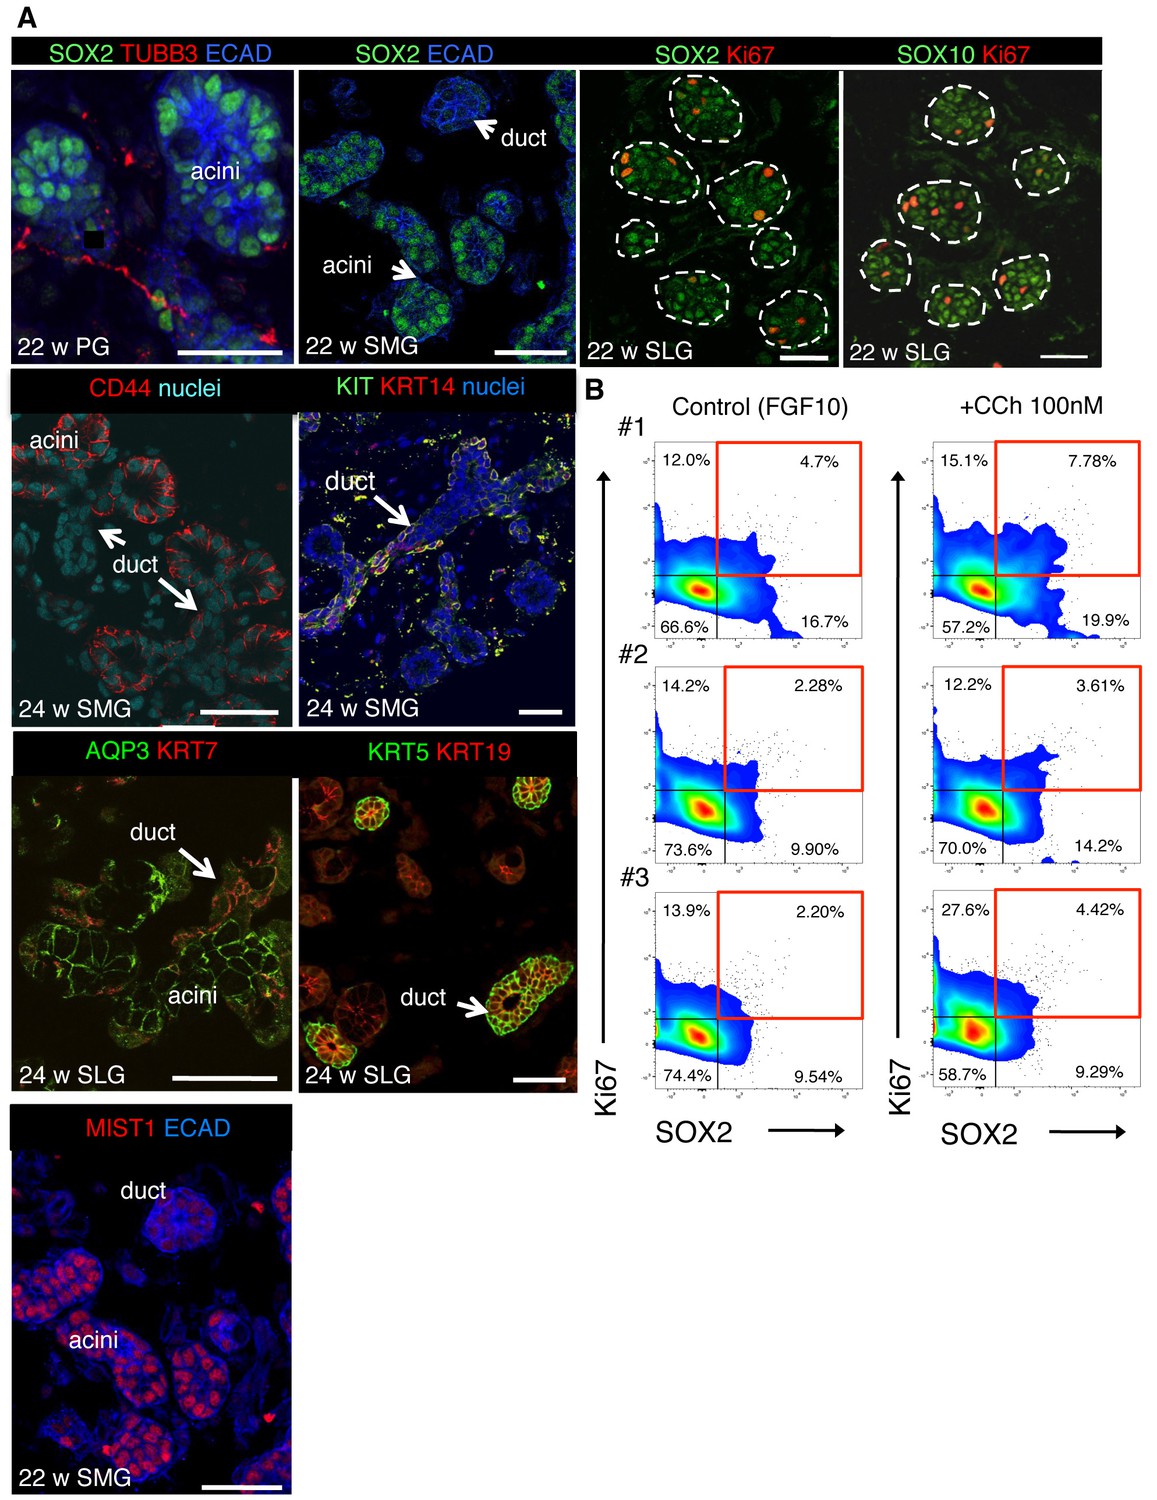
SOX2 and CHRM1 are enriched in acinar cells of human fetal SG, consistent with CCh increasing proliferation of human SG SOX2+ cells.
(A) Immunofluorescent analysis of nerves (TUBB3), acinar (SOX2, SOX10, CD44, and AQP3) and ductal (KRT7, KRT5, KIT, KRT14) cells in fetal human submandibular (SMG), sublingual (SLG) and parotid (PG) at 22–24 w. Some SGs were immunostained for E-cadherin (ECAD) and the proliferation marker Ki67. Images are 1–2 µm confocal sections. Scale bars are 50 µm. White dashed line outlines acini. (B) Flow cytometry plots show gating strategy to analyze the percentage of SOX2+ and Ki67+ cells of total ECAD+ cells of fetal human SLG (22–23 weeks gestation) cultured ± carbachol (CCh; 100 nM) for 48 hr (data presented in Figure 6H). #1–3 represent three individual human fetuses. Red boxes indicate SOX2+Ki67+ cells. 100,000 events were analyzed per sample.
Tables
Table 1
Sequences for mouse primers used for qPCR.
| Gene targ | Forward primer sequence | Reverse primer sequence |
|---|---|---|
| Aqp3 | CTGCCCGTGACTTTGGACCTC | CGAAGACACCAGCGATGGAACC |
| Aqp5 | TCTACTTCTACTTGCTTTTCCCCTCCTC | CGATGGTCTTCTTCCGCTCCTCTC |
| Ascl3 | GACAGGCTCTCGGTCTTCG | CATCTGTGTAAGAGGCCGGTA |
| Atoh1 | GAGTGGGCTGAGGTAAAAGAGT | GGTCGGTGCTATCCAGGAG |
| Bax | TGAAGACAGGGGCCTTTTTG | AATTCGCCGGAGACACTCG |
| Bbc3 | AGCAGCACTTAGAGTCGCC | CCTGGGTAAGGGGAGGAGT |
| Calm1 | TGGGAATGGTTACATCAGTGC | CGCCATCAATATCTGCTTCTCT |
| Calr | GAAGCTGTTTCCGAGTGGTTT | GCACAATCAGTGTGTATAGGTGT |
| Cnn1 | AAACAAGAGCGGAGATTTGAGC | TGTCGCAGTGTTCCATGCC |
| Ccnd1 | CATCCATGCGGAAAATCGTGG | AAGACCTCCTCTTCGCACTTC |
| Cdh1 | GACTGGAGTGCCACCACCAAAGAC | CGCCTGTGTACCCTCACCATCGG |
| Cdkn1a | CCCCCAATCGCAAGGATTCTT | CTTGGTTCGGTGGGTCTGTC |
| Chrm1 | TCCCAAGGCTCACCCAGATGTC | GCTCTGTGTGCTTTATTCTGTTGTTTCC |
| Chrm3 | CATAGCACCATCCTCAACTCTACCAAG | GGGCATTTCTCTCTACATCCATAGTCC |
| Dcpp1 | TGGTGGGGTATTATGTGGGCA | GGGATCGTTAGGGAAGCTAGA |
| Dcpp2 | ATGGGCCAATGTAGATGCTC | CCCAAGAGGCAACAGTAGGA |
| dNp63 | TTGTACCTGGAAAACAATG | GCATCGTTTCACAACCTCG |
| Etv4 | GGTCCTGTGTTCTTGGTGCTGTG | GGTCCTGTGTTCTTGGTGCTGTG |
| Etv5 | AAGCCCTTCAAAGTGATAGCGGAGAC | GTGTCCACAAACTTTCCTCTTTCTGTCAACT |
| Egfr | ACACTACGCCGCCTGCTTCAAGAG | ACTGTGCCAAATGCTCCCGAACCC |
| Fgf1 | GCACCGTGGATGGGACAAGGGACAGGAG | CACTTCGCCCGCACTTTCCGCACTGAG |
| Fgf7 | CTCTACAGGTCATGCTTCCACC | ACAGAACAGTCTTCTCACCCT |
| Fgf10 | TCTTCCTCCTCCTCGTCCTTCTCCTCTCCTTCC | CCGCTGACCTTGCCGTTCTTCTCAATCG |
| Fgfr2b | TGGCTCTGTTCAATGTGACGGAGATGGATG | AGGCGCTTGCTGTTTGGGCAGGAC |
| Kit | TGGTTGTGGTTGTTGTTGTTGTTG | GAAGGCTTGTTCCGAAGTGTAGAC |
| Krt5 | TCCTGTTGAACGCCGCTGAC | CGGAAGGACACACTGGACTGG |
| Krt7 | CGCCGCTGAGTGTGGACATCG | CTGGCTGCTCTTGGCTGACTTCTG |
| Krt8 | GGAGGAGAGCAGGCTGGAGTC | TGGTGCGGCTGAAAGTGTTGG |
| Krt14 | CCTCATCCTCTCAATTCTCCTCTGGCTCTC | CTTGGTGCGGATCTGGCGGTTGG |
| Krt15 | GCTGCTACATGCTGCTCAGGCTTAGG | CCAGGAAGGACAAGGGTCAAGTAAAGAGAGTG |
| Krt19 | GCCACCTACCTTGCTCGGATTG | GTCTCTGCCAGCGTGCCTTC |
| Mist1 | GCTGACCGCCACCATACTTAC | TGTGTAGAGTAGCGTTGCAGG |
| Muc19 | CTGGGTCTGGAAGTAGAAGTA | TCTAAGCCACAGAAGGAGAT |
| Nrtn | CGCTACCACACGCTGCAAGAG | TCCCACACTTATGTGAAGTCAGTTCTC |
| Pip | GGGTCTCTCATTCACATTCAGTG | TGATCTCCTGATTTTCCTGTGCT |
| Pmaip1 | GCAGAGCTACCACCTGAGTTC | CTTTTGCGACTTCCCAGGCA |
| Ptch1 | CACCCAGAAAGCAGACTACCCGAATATC | TCTCCTCCAGCATGACATACTTCACATTG |
| Prol1 | CACCTAAGCCTAGCACCTCTA | ACTTCCAAAACACTTCCGCAAAT |
| Rab3d | TACTATCGCGGAGCTATGGGT | TTTGATCTGCGTAGCCCAGTC |
| Rps29 | GGAGTCACCCACGGAAGTTCGG | GGAAGCACTGGCGGCACATG |
| Smgc | TGGCTCTGCAACACAACAGT | GGCGAAAAGCTCCCAGGTAA |
| Sox2 | CAGCATGTCCTACTCGCAGCAG | TGGAGTGGGAGGAAGAGGTAACC |
| Sox10 | ATCAGCCACGAGGTAATGTCCAAC | ACTGCCCAGCCCGTAGCC |
| Spdef | AAGGCAGCATCAGGAGCAATG | CTGTCAATGACGGGACACTG |
| Syn2 | TAGACTGCTGTGGAGGTGAA | GCTCTGAAAGGTAAAGGTAACTG |
| Trp53 | CTCTCCCCCGCAAAAGAAAAA | CGGAACATCTCGAAGCGTTTA |
| Tubb3 | CCAGAGCCATCTAGCTACTGACACTG | AGAGCCAAGTGGACTCACATGGAG |
| Vacht | GAGTGGGAGATGGGCATGGTTTGG | GCAGGCAGGTACGACGCAAGAG |
| Vip | TCCAGTGATAGGTACTCCATCTC | CATCCATAGCACACGCAGAA |
| Zeb1 | GCTGGCAAGACAACGTGAAAG | GCCTCAGGATAAATGACGGC |
| Zeb2 | ATTGCACATCAGACTTTGAGGAA | ATAATGGCCGTGTCGCTTCG |
Table 2
Sequences for human primers used for qPCR.
| Gene | Forward primer sequence | Reverse primer sequence |
|---|---|---|
| AQP3 | GTTTCTGTGTATGTGTATGTCTGCCTTT | CGTCCCACTGCTCCTACTTATGT |
| CDH1 | AGGTGACAGAGCCTCTGGATAGA | TGGATGACACAGCGTGAG AGA |
| CD44 | CTGCCGCTTTGCAGGTGTA | CATTGTGGGCAAGGTGCTATT |
| CHRM1 | ACCTCTATACCACGTACCTG | TGAGCAGCAGATTCATGACG |
| CHRM3 | ATCGGTCTGGCTTGGGTC | CCCGGAGGCACAGTTCTC |
| EGFR | TGGCAGGTACAGTAGGATAA | CAAGTCAGTCTAACGCTCAT |
| GAPDH | CAGCCTCAAGATCATCAGCA | TGTGGTCATGAGTCCTTCCA |
| KIT | GCAGAGGAAGTGGAAGGCATCAG | TCAGTGAGACAGTAGCATTATGGAAGGT |
| KRT5 | CGTGCCGCAGTTCTATATTCT | ACTTTGGGTTCTCGTGTCAG |
| KRT7 | TCCGCGAGGTCACCATTAAC | GCTCTGTCAACTCCGTCTCAT |
| KRT8 | AAGGATGCCAACGCCAAGTT | CCGCTGGTGGTCTTCGTATG |
| KRT14 | ATCCAGAGATGTGACCTCCTC | CTCAGTTCTTGGTGCGAAGG |
| KRT19 | GTCTGCCTCCAAGGTCCTCTGA | TCTACCCAGAAGACACCCTCCAAA |
| MIST1 | CGGATGCACAAGCTAAATAACG | GCCGTCAGCGATTTGATGTAG |
| SOX2 | TGGCGAACCATCTCTGTGGT | GGAAAGTTGGGATCGAACAAAAGC |
| SOX10 | TCATCCCTTCAATGCCCCCT | TGCGTCTCAAGGTCATGGAGG |
Table 3
Sequences for primers used for SOX10 ChIP-qPCR.
| Primer | Forward primer sequence | Reverse primer sequence |
|---|---|---|
| A | GTGGAGGTTTGTTGATGGA | TTTGCGATGGGAGAGTCTGA |
| B | ACAGTCAGAACCTGTTGCCT | TGATACCTACTGCAGGCTGC |
| C | GCAGCCTGCAGTAGGTATCA | CTTCTTGAAGAGTAGGGC |
| D | AAAAGACAGGAACTGCCCTG | AAGGGTGCCTTCACTGAGAA |
| E | GATAGTGGGGACACAAAGAG | TCCTAATTCACTGGGCTCTG |
| F | TCTTGTTCGGGGCCTTGAAA | ATGCTTGCTGCTCCGTCCCT |
| G | AGACATCAATGAGCAGCAGG | CGCACACACACACTTTCCTA |
Download links
A two-part list of links to download the article, or parts of the article, in various formats.
Downloads (link to download the article as PDF)
Open citations (links to open the citations from this article in various online reference manager services)
Cite this article (links to download the citations from this article in formats compatible with various reference manager tools)
SOX2 regulates acinar cell development in the salivary gland
eLife 6:e26620.
https://doi.org/10.7554/eLife.26620


