Anatomical and functional organization of the human substantia nigra and its connections
- Montreal Neurological Institute, McGill University, Canada
Figures
Figure 1 with 2 supplements
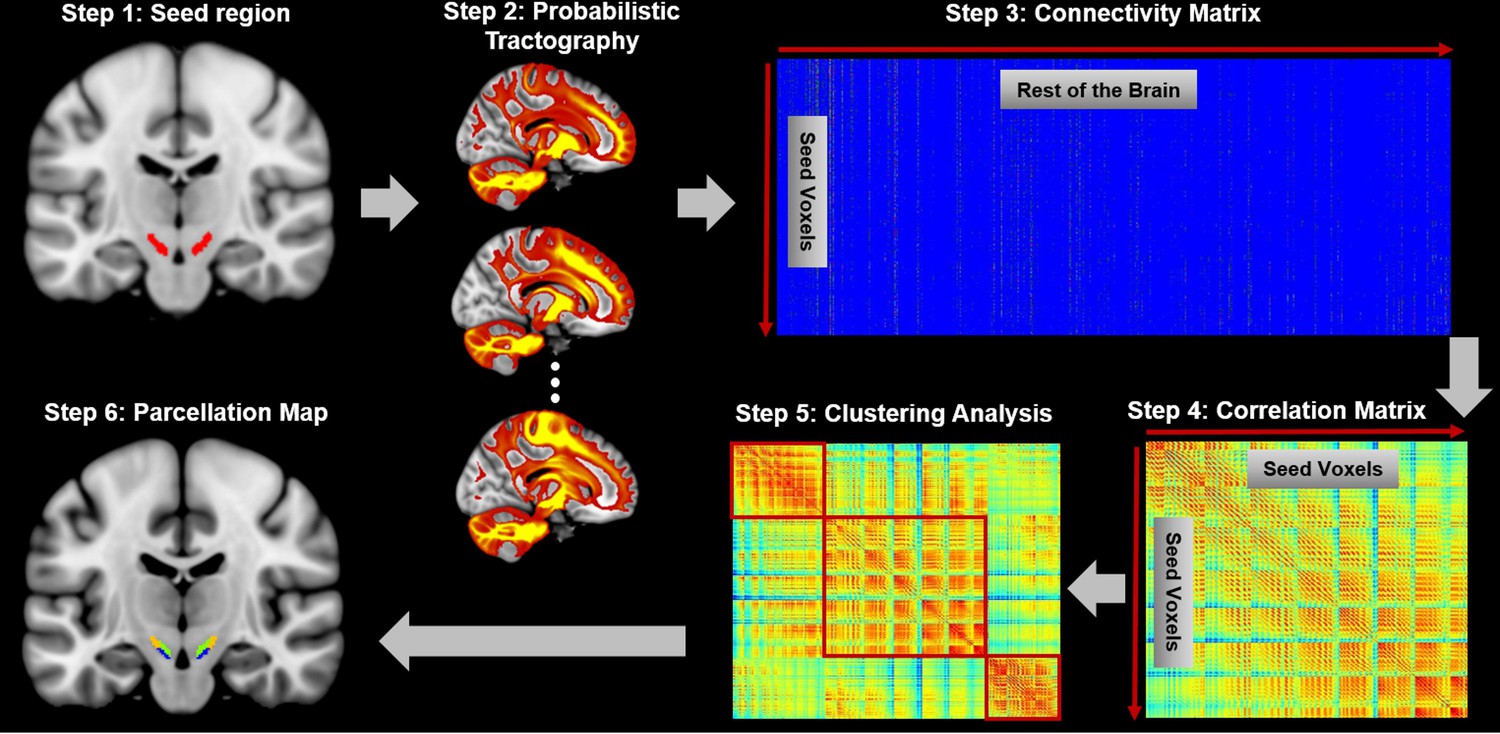
Connectivity-based brain parcellation procedure.
After defining the seed region (step 1), probabilistic tractography was applied by sampling 5000 streamlines at each voxel within the seed mask (step 2). Whole-brain connectivity profiles were used to generate a connectivity matrix with each row representing the connectivity profile of each seed voxel (step 3). Next, a correlation matrix was calculated as a measure of similarity between seed voxels (step 4). Then, spectral clustering was applied to the similarity matrix (step 5) and multiple subdivisions were identified within the seed region (step 6). The entire procedure was applied independently for each hemisphere and each subject.
Figure 1—figure supplement 1
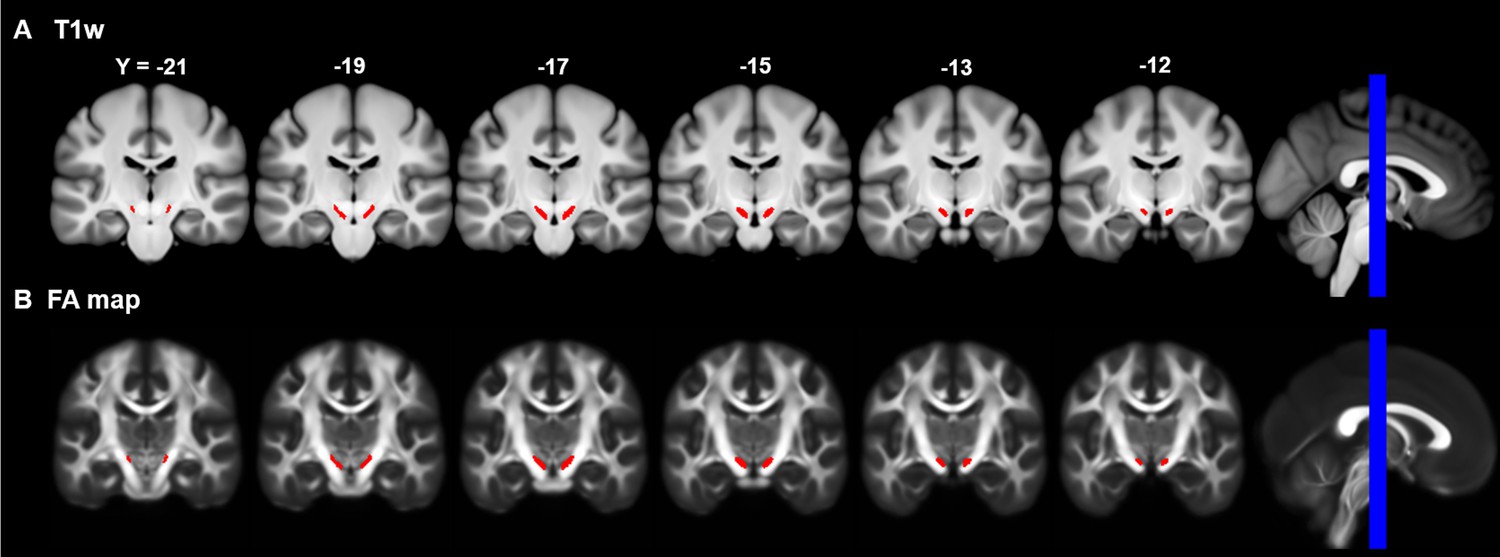
Multi-slice view of the SN seed mask on group averaged brains.
The first row shows the location of the SN seed in the group averaged structural images across 430 subjects. The second row indicates the SN seed on the group averaged Fractional Anisotropy maps.
Figure 1—figure supplement 2
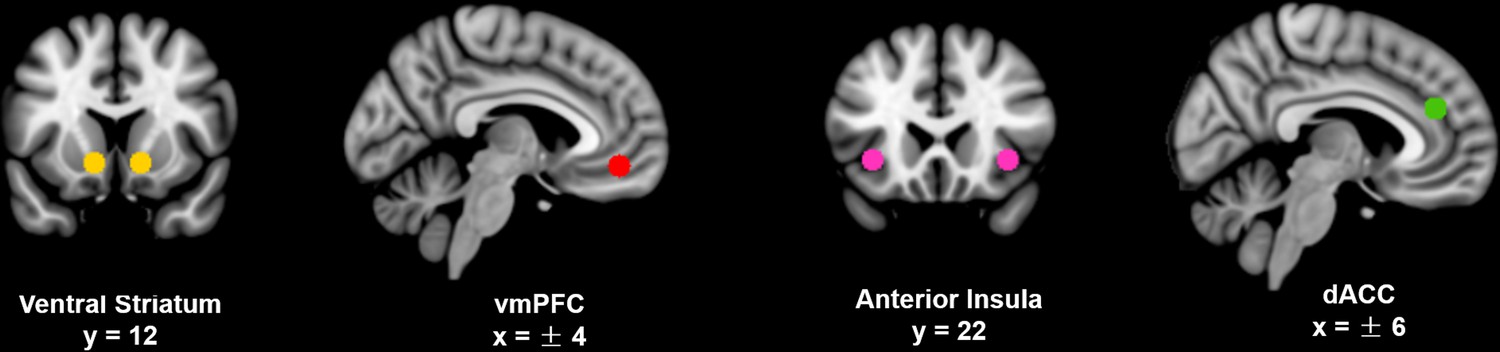
Spatial locations of the four regions of interest.
Ventral striatum (yellow), vmPFC (red), anterior insula (violet) and dorsal anterior cingulate cortex (green) were identified by placing a 6 mm sphere at the peak coordinates based on the literature as described in the text (listed in Table 1). These slice views were generated using MRIcron (http://people.cas.sc.edu/rorden/mricron/index.html) on the ICBM152 brain template.
Figure 2 with 3 supplements
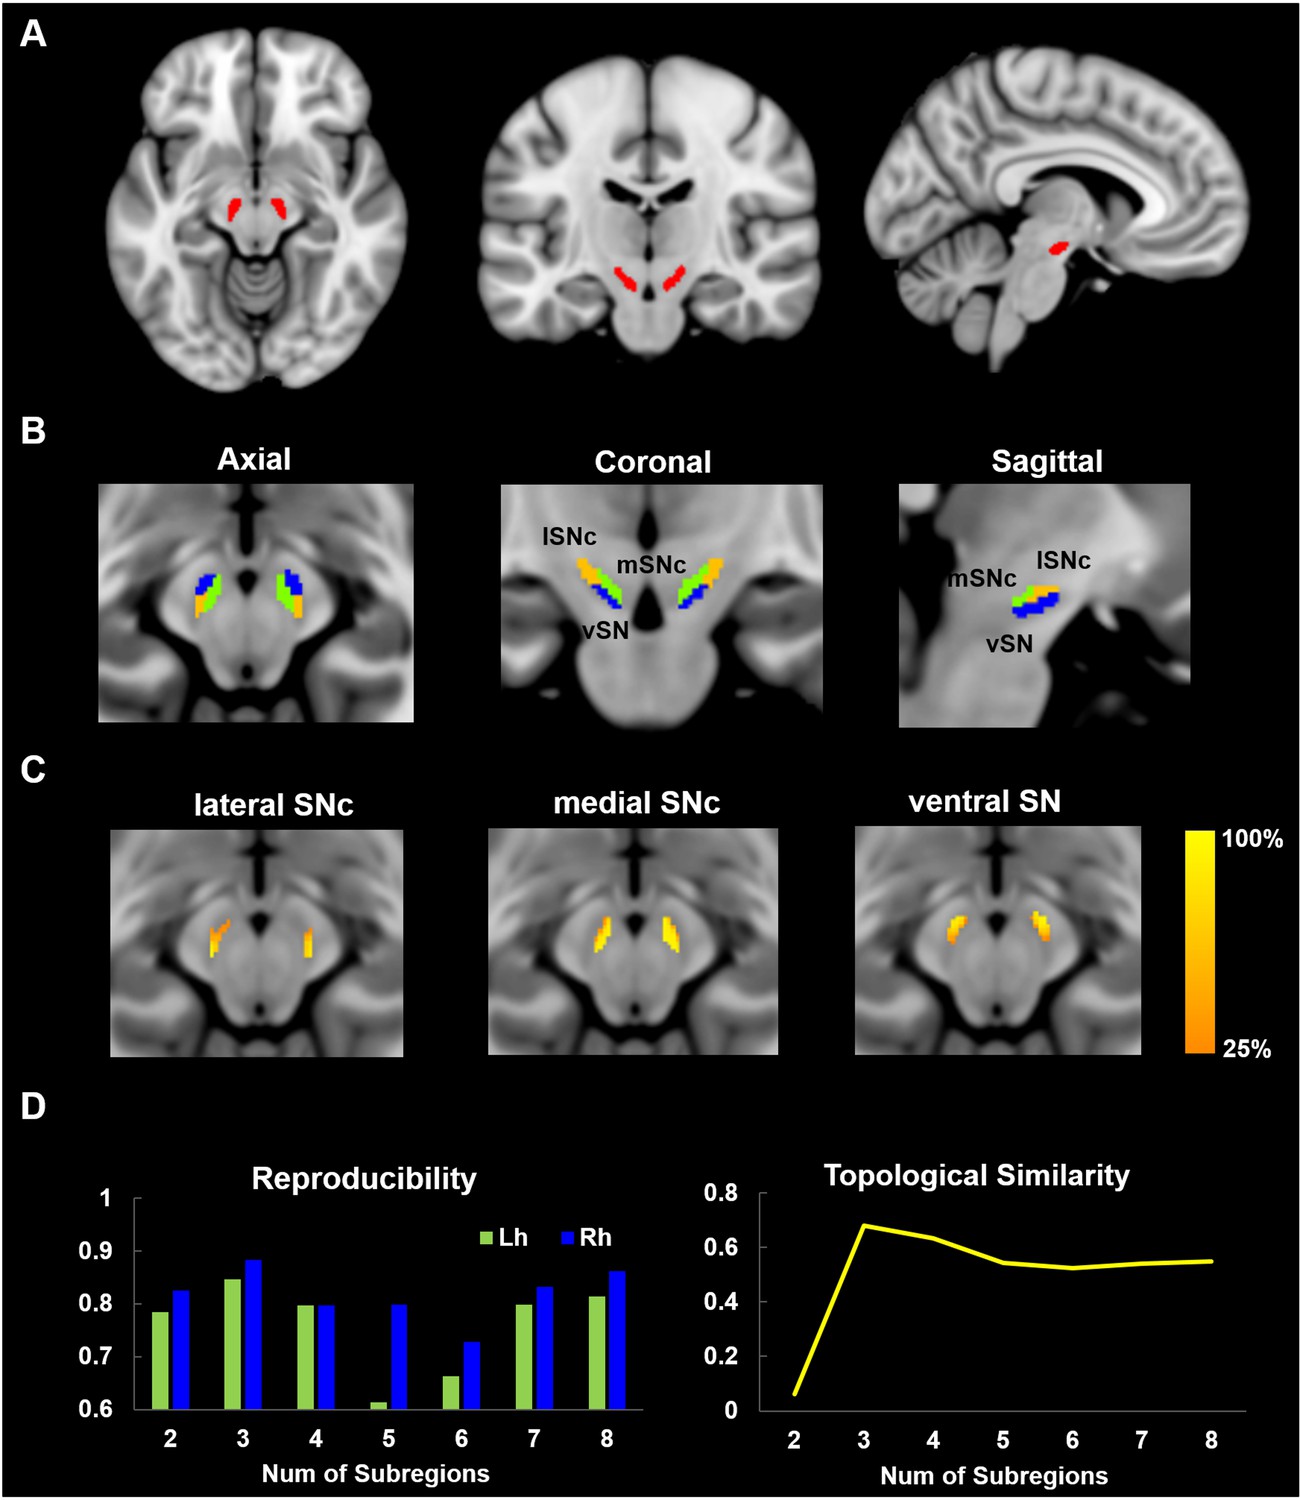
Parcellation of Substantia Nigra based on anatomical connectivity profiles.
(A) Definition of the seed region. Substantia Nigra mask was extracted from a 7T atlas of Basal ganglia based on high-resolution MP2RAGE and FLASH scans (Keuken and Forstmann, 2015). (B) Parcellation map of SN on 60 healthy young subjects. SN was subdivided into three subregions: a dorsolateral area corresponding to lateral part of SN pars compacta (lSNc), a dorsomedial area corresponding to medial part of SNc (mSNc) and a ventral area (vSN). (C) Probabilistic map of each SN subdivision, where the intensity at each SN voxel represents the probability of subdivision assignment over the population. A probability of 100% at voxel i means that the same assignment is made for every subject. (D) Reproducibility and topological similarity of SN parcellation. The three-cluster parcellation of SN showed both high reproducibility, as assessed by repeated split-half resampling (mean NMI = 0.85 and 0.88, respectively for left and right SN) and high inter-hemispheric topological similarity (mean NMI = 0.68). NMI: normalized mutual information.
Figure 2—figure supplement 1
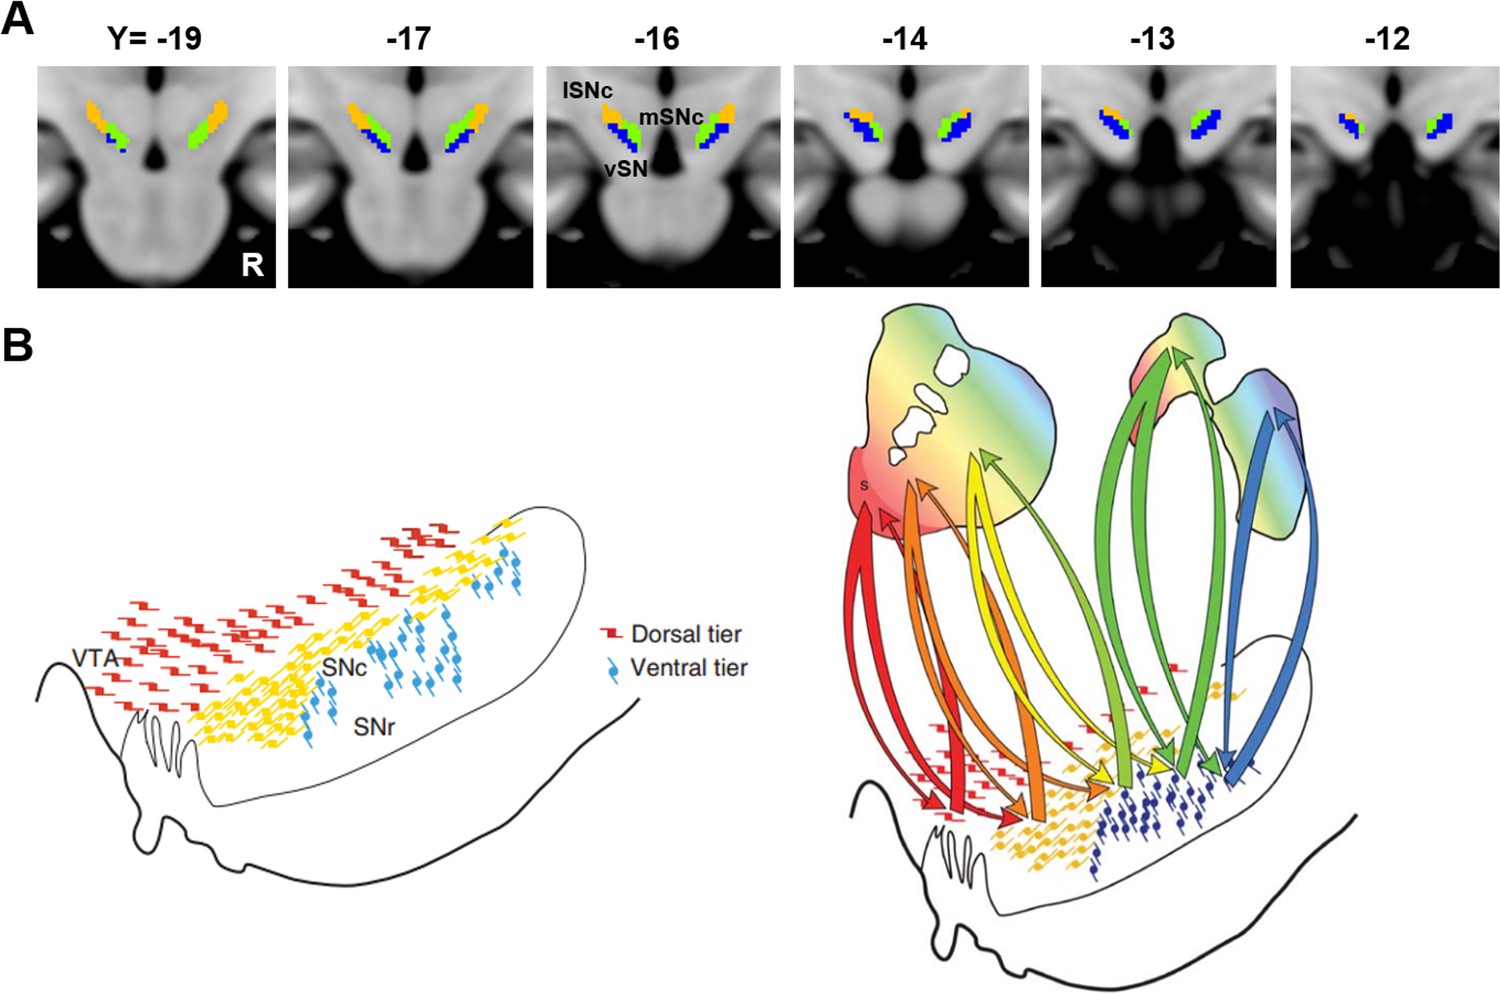
Comparison of the SN parcellation from the current study and the subdivisions of dopamine cells in monkeys.
(A) A multi-slice view of our tripartitite division of SN based on anatomical connections with the rest of brain. (B) Subdivision of dopamine cells in Macaque monkeys based on their efferent and afferent projections. Reprinted by permission from Macmillan Publishers Ltd: [Neuropsychopharmacology] (Haber and Knutson, 2010), copyright (2010).
Figure 2—figure supplement 2
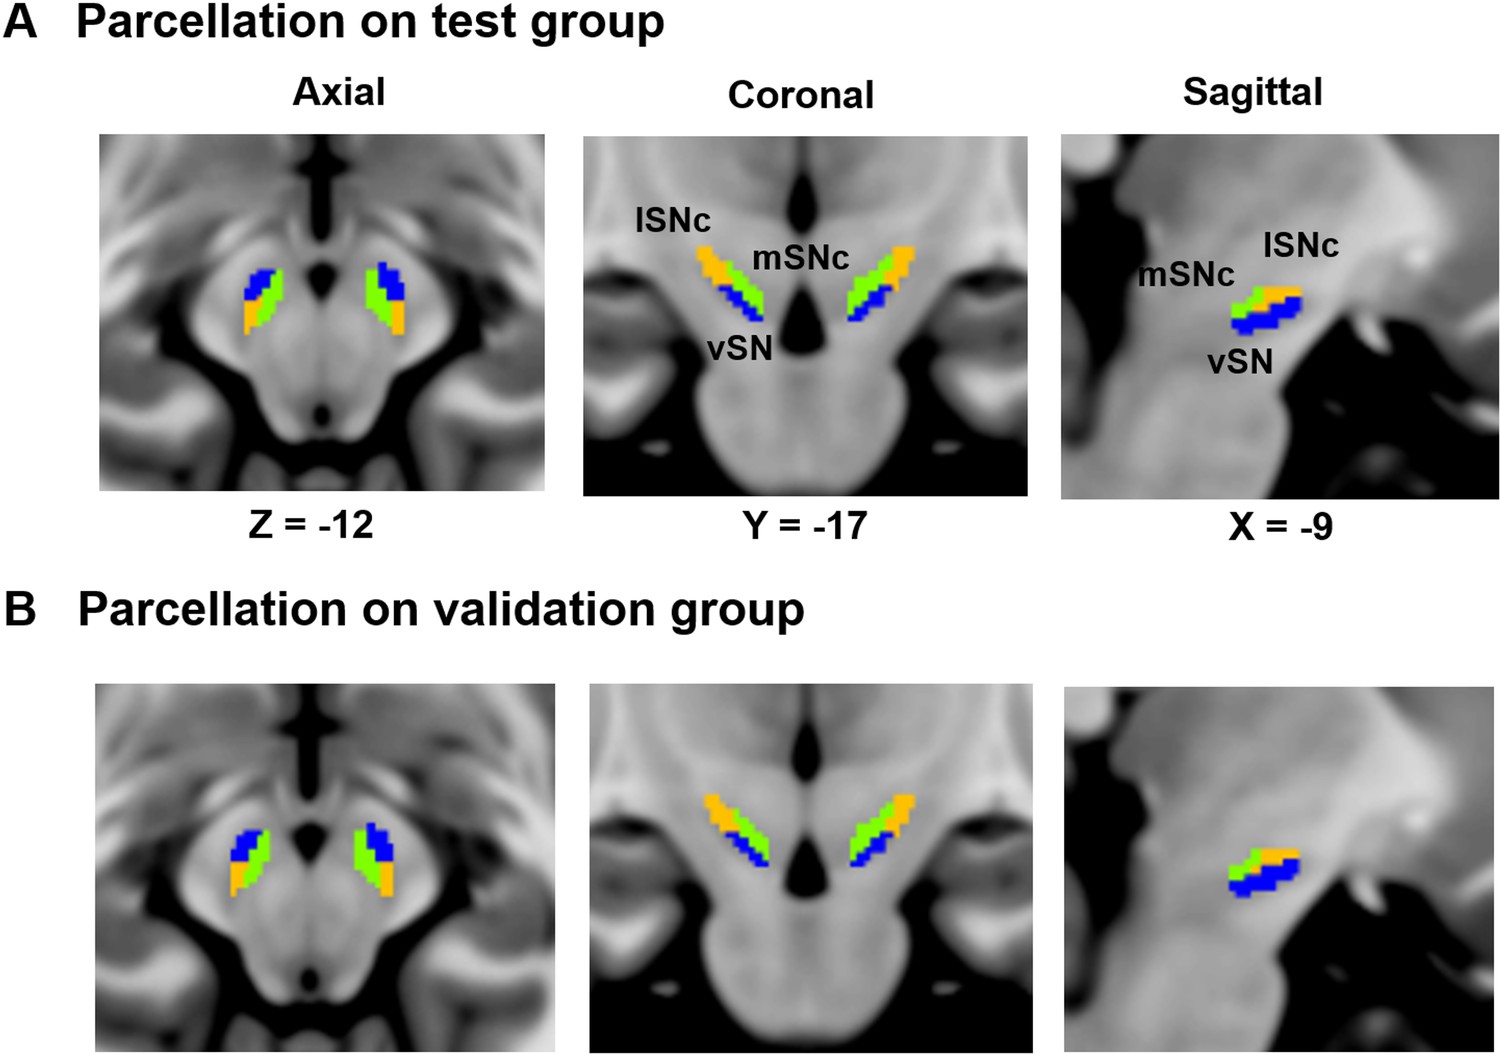
Replication of the SN parcellation in two independent groups.
Parcellation was performed on two randomly selected groups of 60 participants from HCP. The stability index revealed high similarity of parcellation between the two groups (Normalized Mutual Information = 0.95).
Figure 2—figure supplement 3
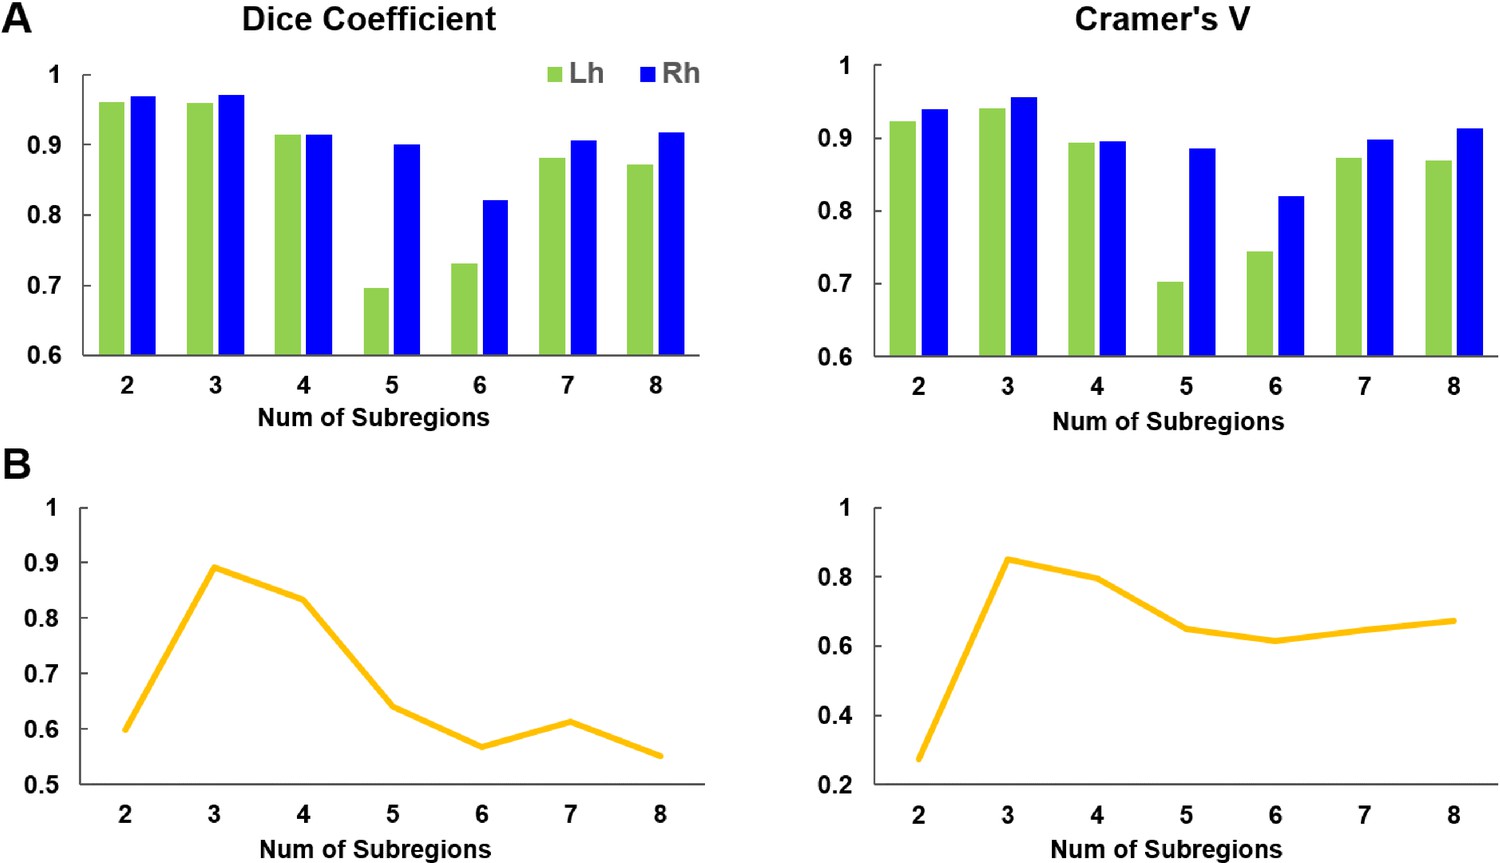
Reproducibility and topological similarity in connectivity-based parcellation of bilateral SN measured by Dice coefficient and Cramer’s V.
Both measures indicated that k = 3 was the most stable number of subdivisions by showing both high reproducibility across randomly selected subgroups (A) and high topological similarity across the two hemispheres (B).
Figure 3 with 2 supplements
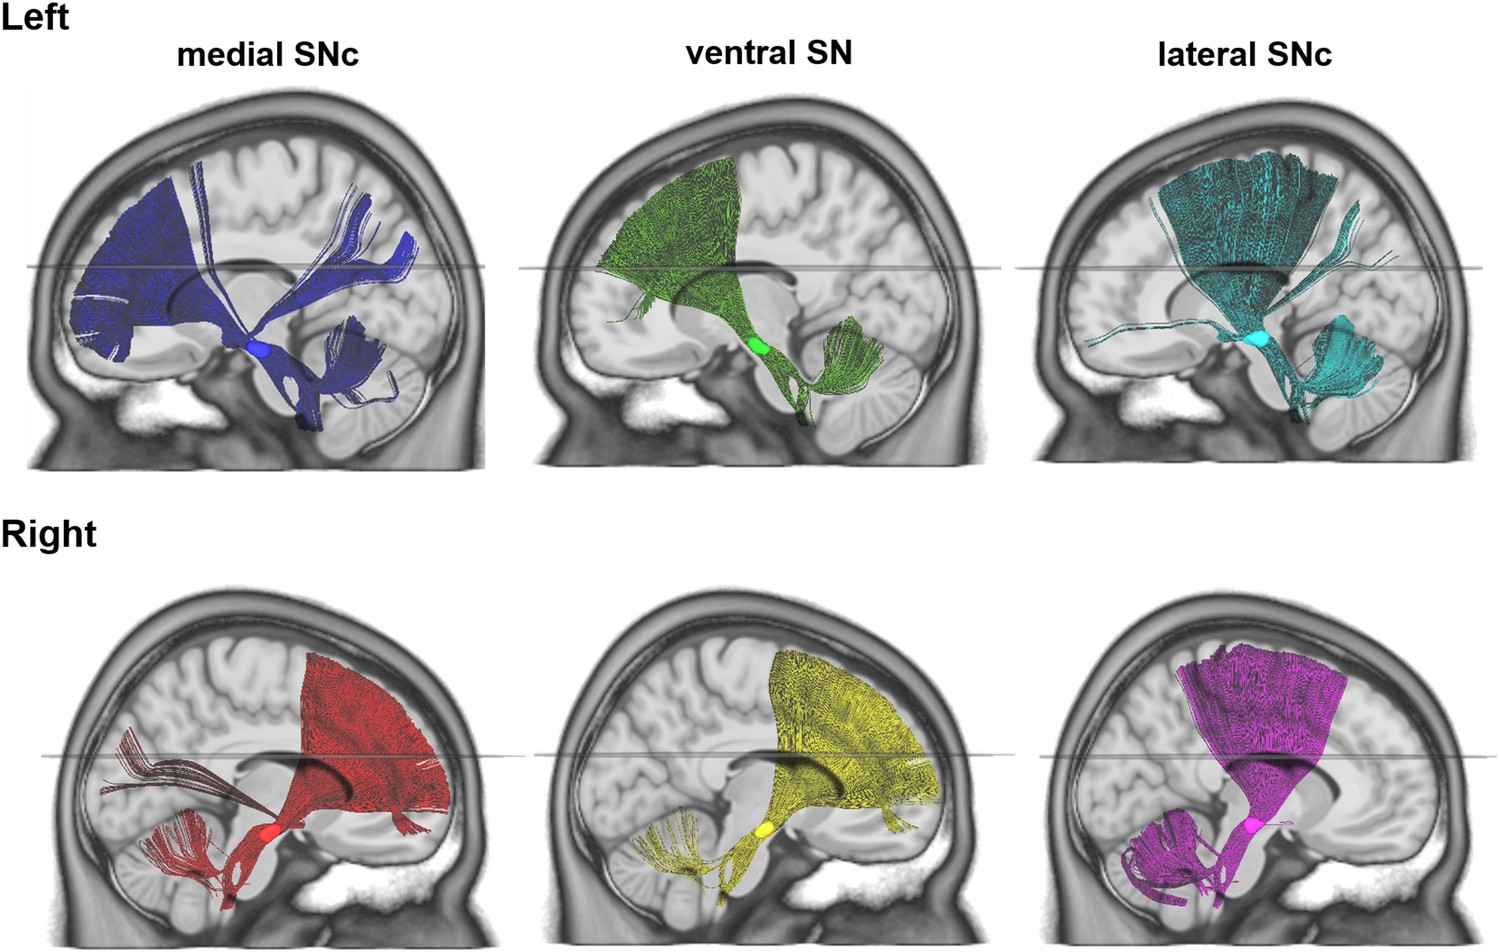
Connectivity patterns of the subdivisions of substantia nigra.
Probabilistic fiber tractrography was performed for each SN subdivision to map its whole-brain connectivity patterns. The population tract maps are shown with a threshold of connectivity probability at 0.05 and rendered using MRIcron on the ICBM152 brain template.
Figure 3—figure supplement 1
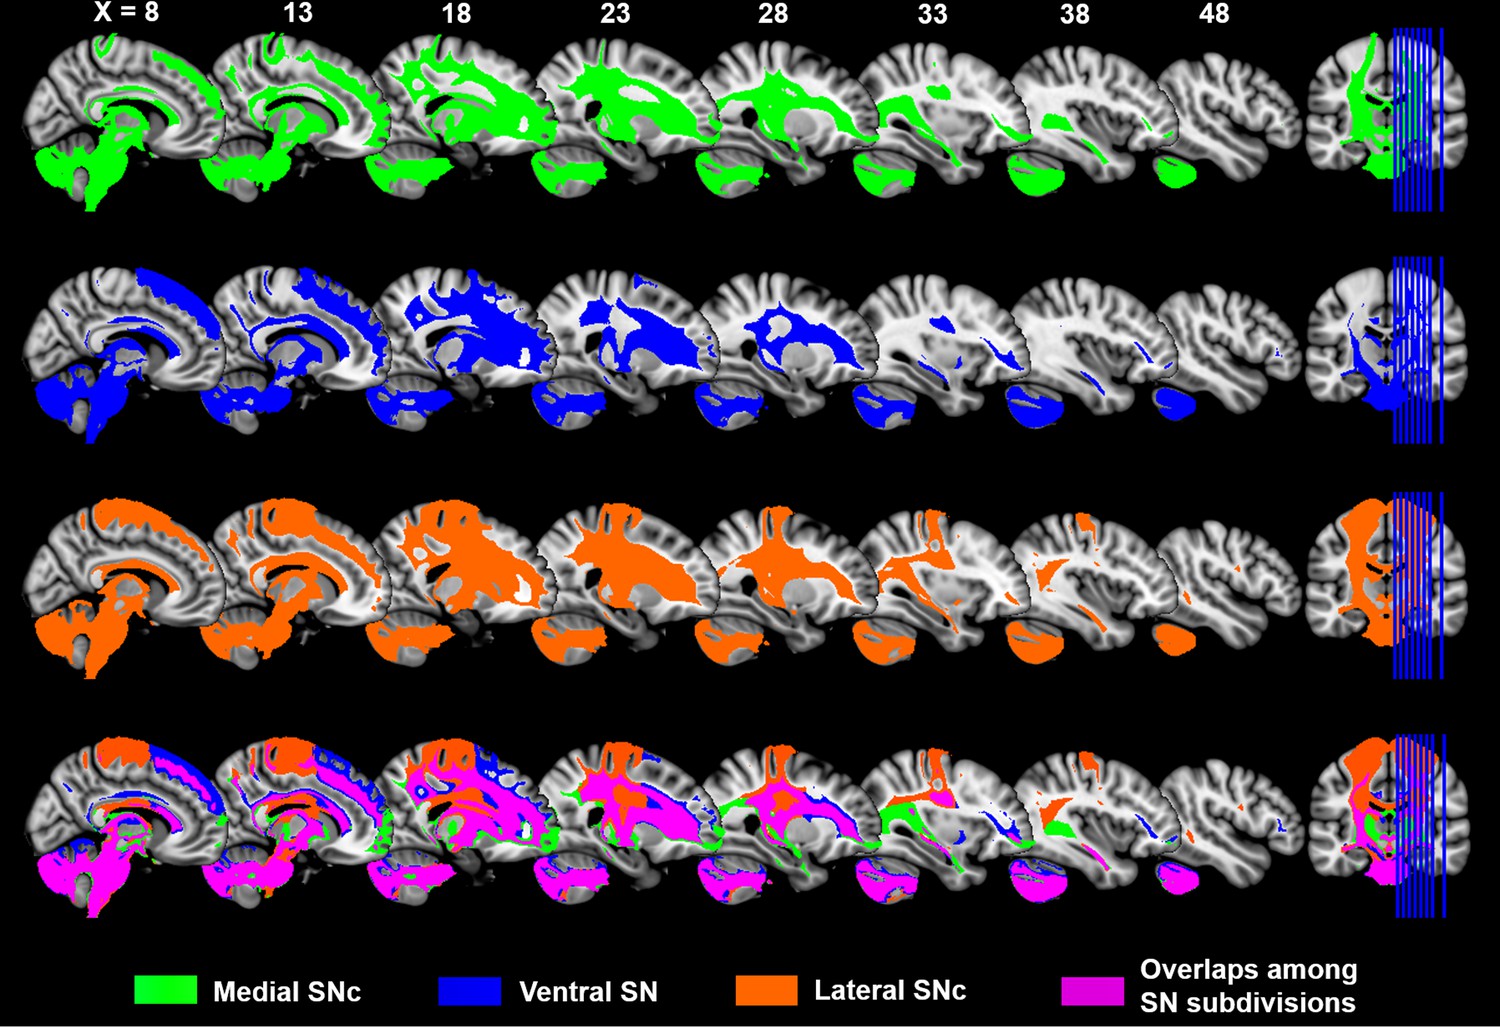
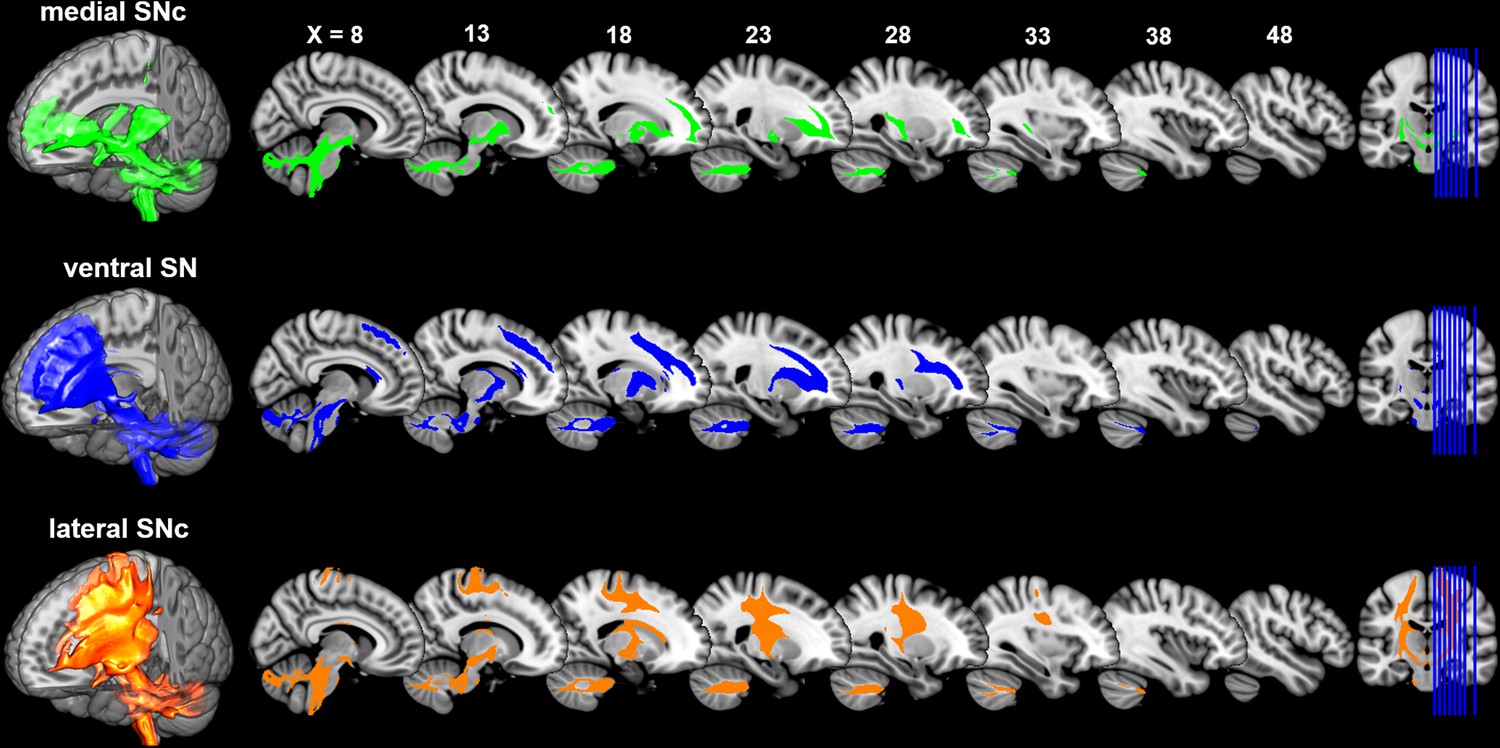
Distinct and overlapping tractography maps among the subdivisions of substantia nigra.
The first three rows show the whole-brain connectivity maps of the three subdivisions of SN via probabilistic fiber tractography. A threshold of connectivity probability at 0.01 was applied. These tract maps were summarized into a single map shown in the fourth row, which includes both distinct tracts of each subdivision (green for medial SNc, blue for ventral SN and orange for lateral SNc) and their overlapping patterns (violet).
Figure 3—figure supplement 2
Connectivity profiles revealed by deterministic fiber tractography using DSI-studio (http://dsi-studio.labsolver.org/) based on the group averaged template of diffusion data from HCP-500 subjects.
https://doi.org/10.7554/eLife.26653.012
Figure 4 with 2 supplements
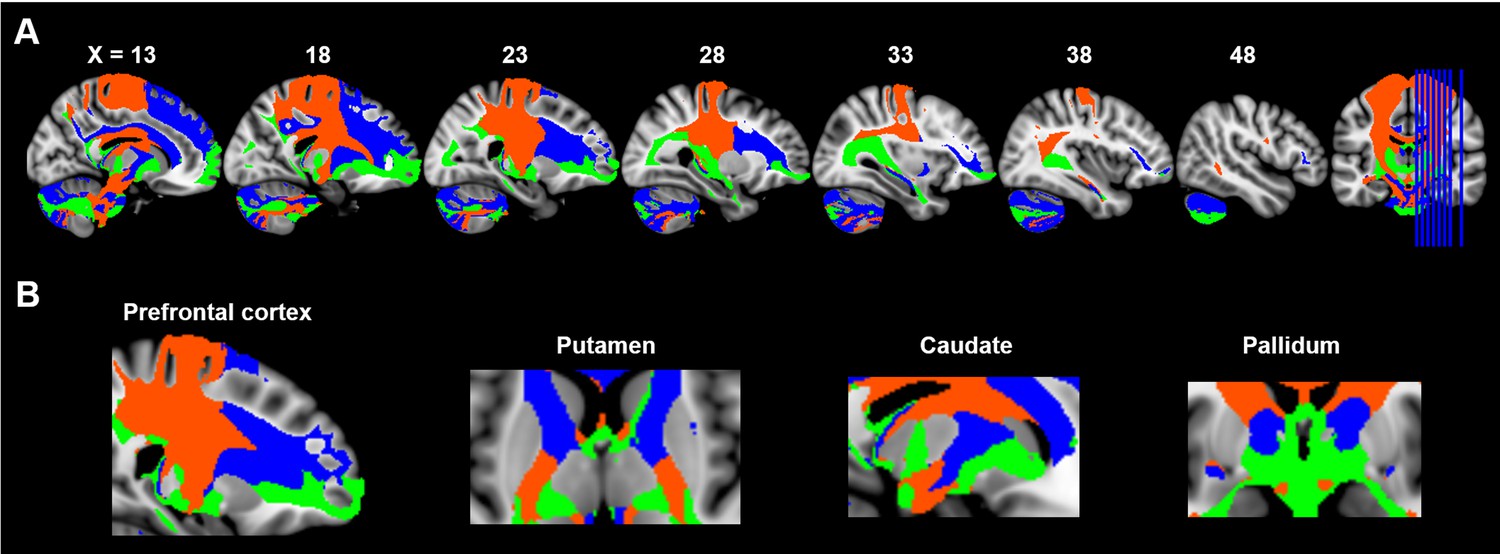
Maximum probability tractograms of the subdivisions of substantia nigra.
A limbic-cognitive-motor organizational topography of SN projections is shown in multi-slice views (A) with a focus on prefrontal cortex, striatum and pallidum (B). Maximum probability tractograms were generated by assigning each voxel to the corresponding SN subdivision with which it showed the greatest connections. SN subdivisions: vSN (blue), mSNc (green) and lSNc (orange).
Figure 4—figure supplement 1
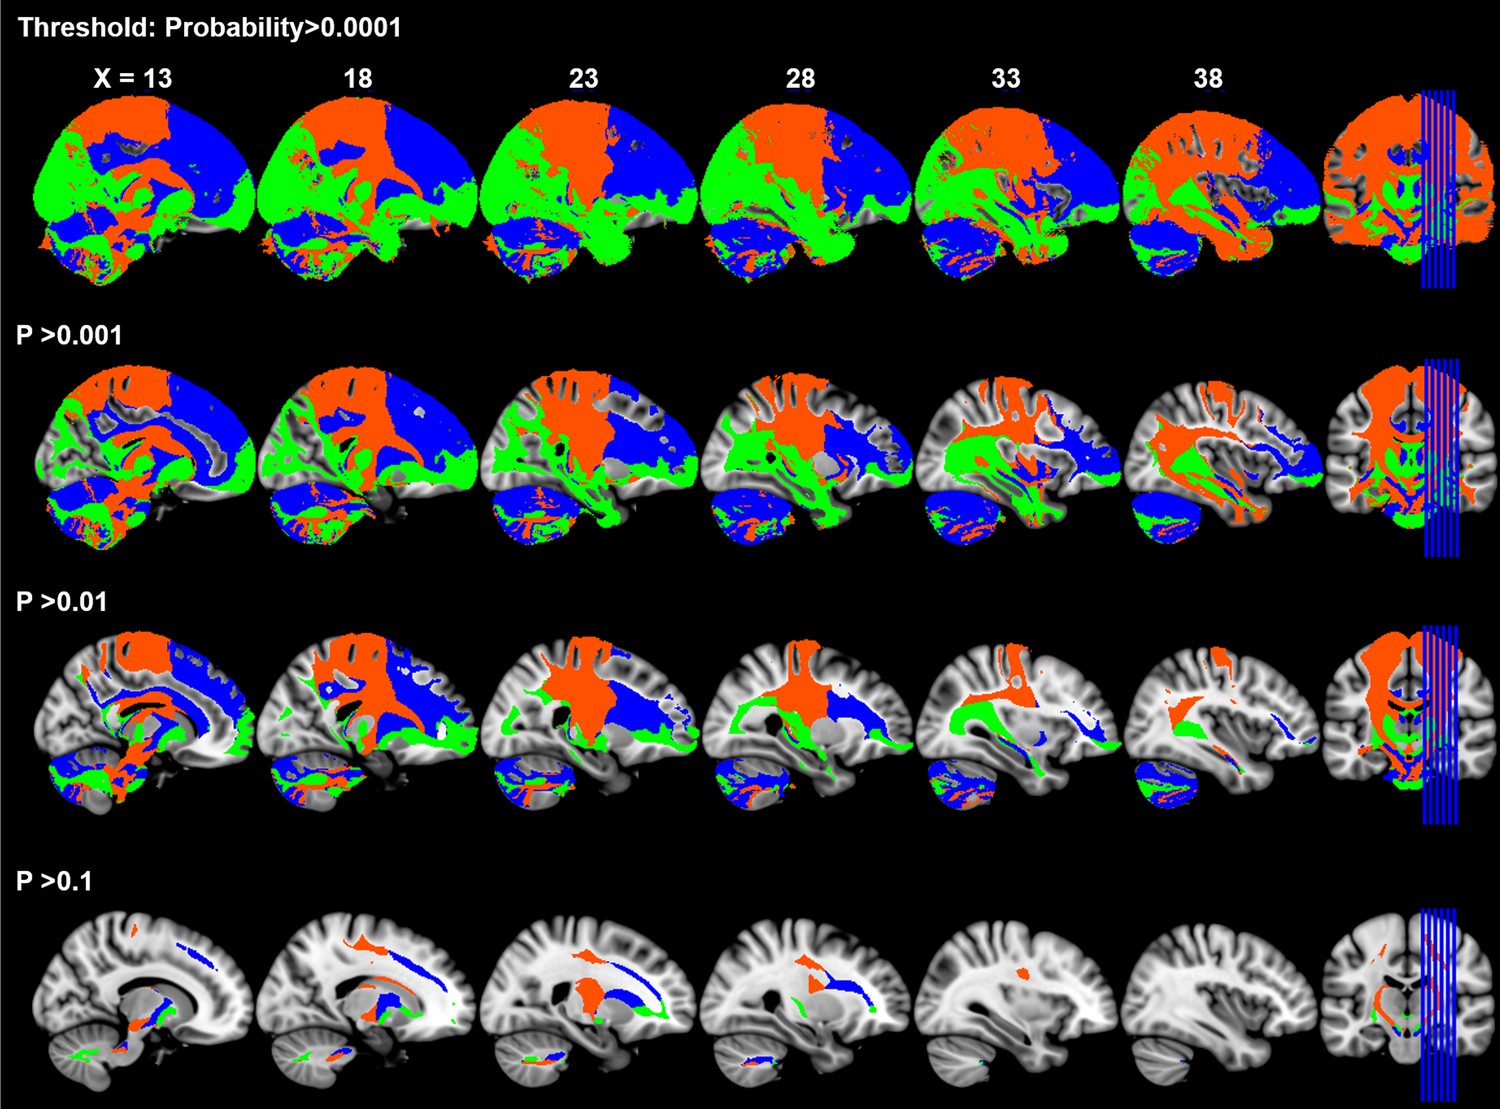
Maximum Probability Map of tractograms from SN subdivisions under different thresholds of tractography probability.
The limbic-cognitive-motor topology of SN projections was consistently revealed at different levels of probability thresholds. As the threshold increases, the tractographic MPM shrinks into the skeleton of major fiber tracts but the organizational pattern remains.
Figure 4—figure supplement 2
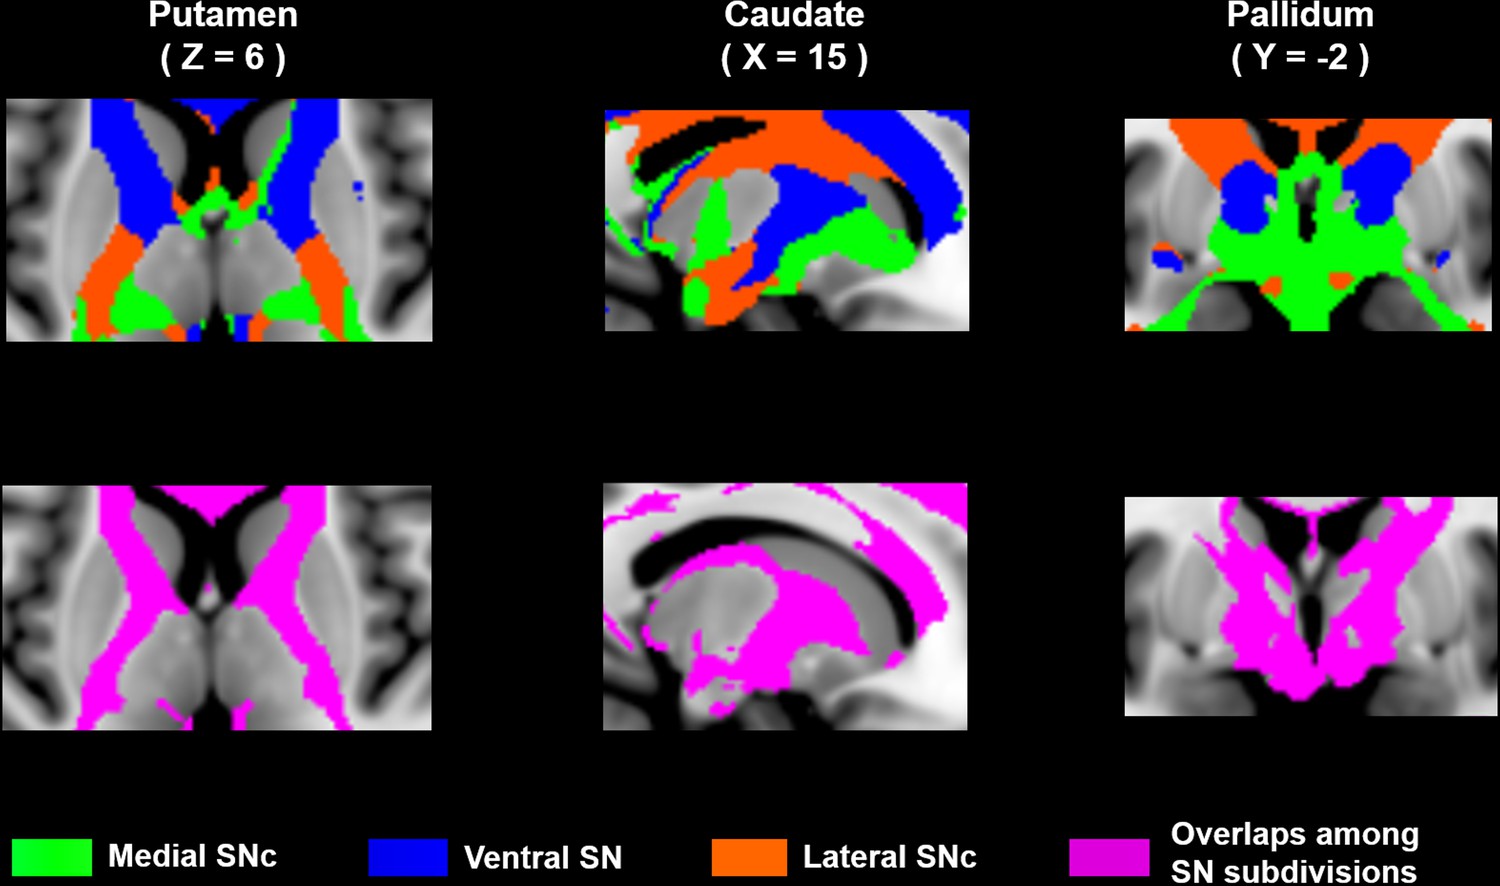
Distinct and overlapping projections of SN subdivisions in basal ganglia.
The first row shows the distinct connectivity patterns of SN subdivisions in striatum and pallidum, adapted from Figure 4B. The second row indicates the overlaps among SN projections.
Figure 5 with 3 supplements

Connectivity fingerprints of the subdivisions of Substantia Nigra.
The connectivity fingerprints of SN subdivisions were calculated based on a whole-brain atlas (Fan et al., 2016). The relative connectivity strength between each target (i.e. parcels in the brain atlas) and each SN subdivision is plotted. An organizational topography of SN projections emerges with vSN mostly connected to prefrontal cortex, lateral SNc to sensorimotor cortex, and medial SNc to limbic regions. The naming convention is based on Fan et al. (2016). The atlas is available at http://atlas.brainnetome.org/.
Figure 5—figure supplement 1
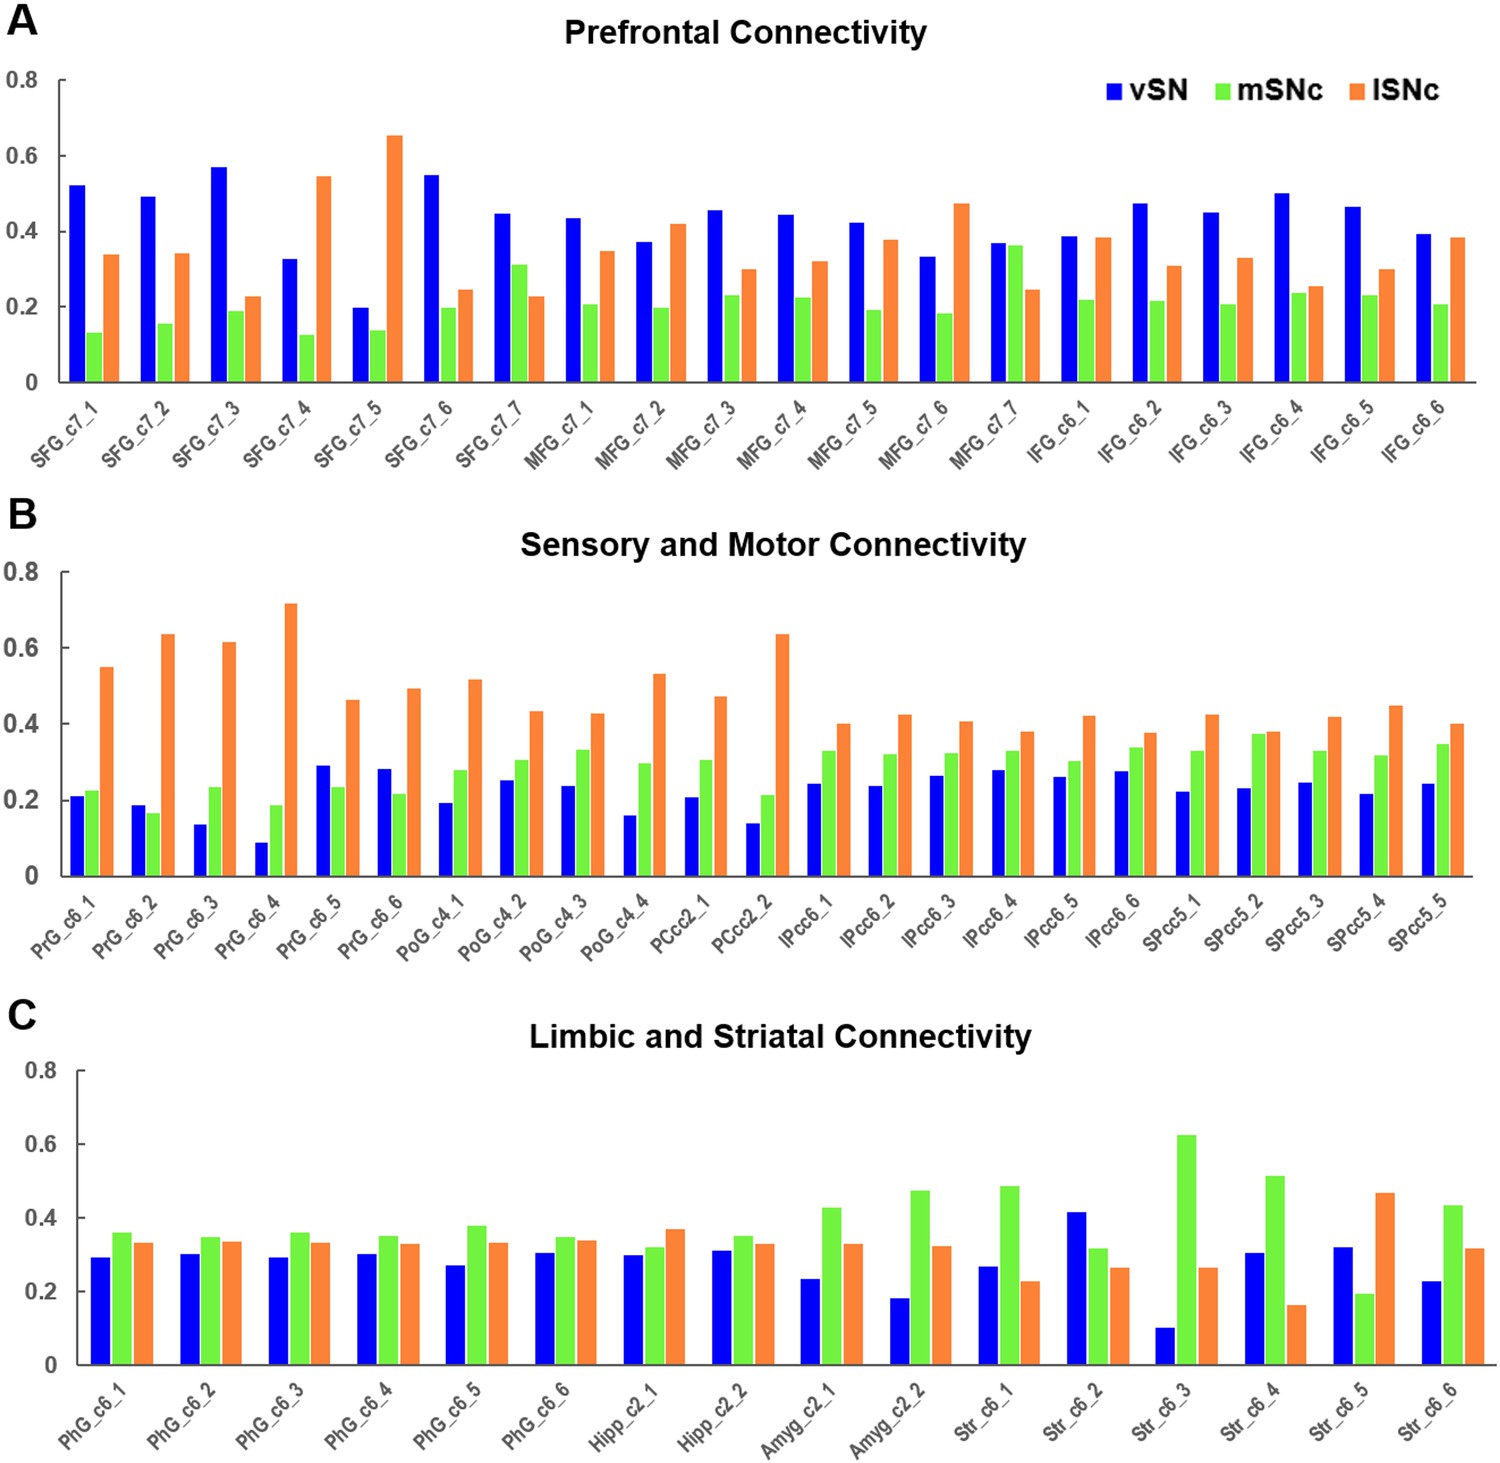
Connectivity profiles of SN subdivisions in prefrontal, motor and limbic systems.
Organizational topography of SN projections showing that vSN preferentially connects with prefrontal cortex (A), lateral SNc with sensorimotor cortex (B), and medial SNc with limbic regions (C). Regions derived from the whole-brain atlas of (Fan et al., 2016).
Figure 5—figure supplement 2
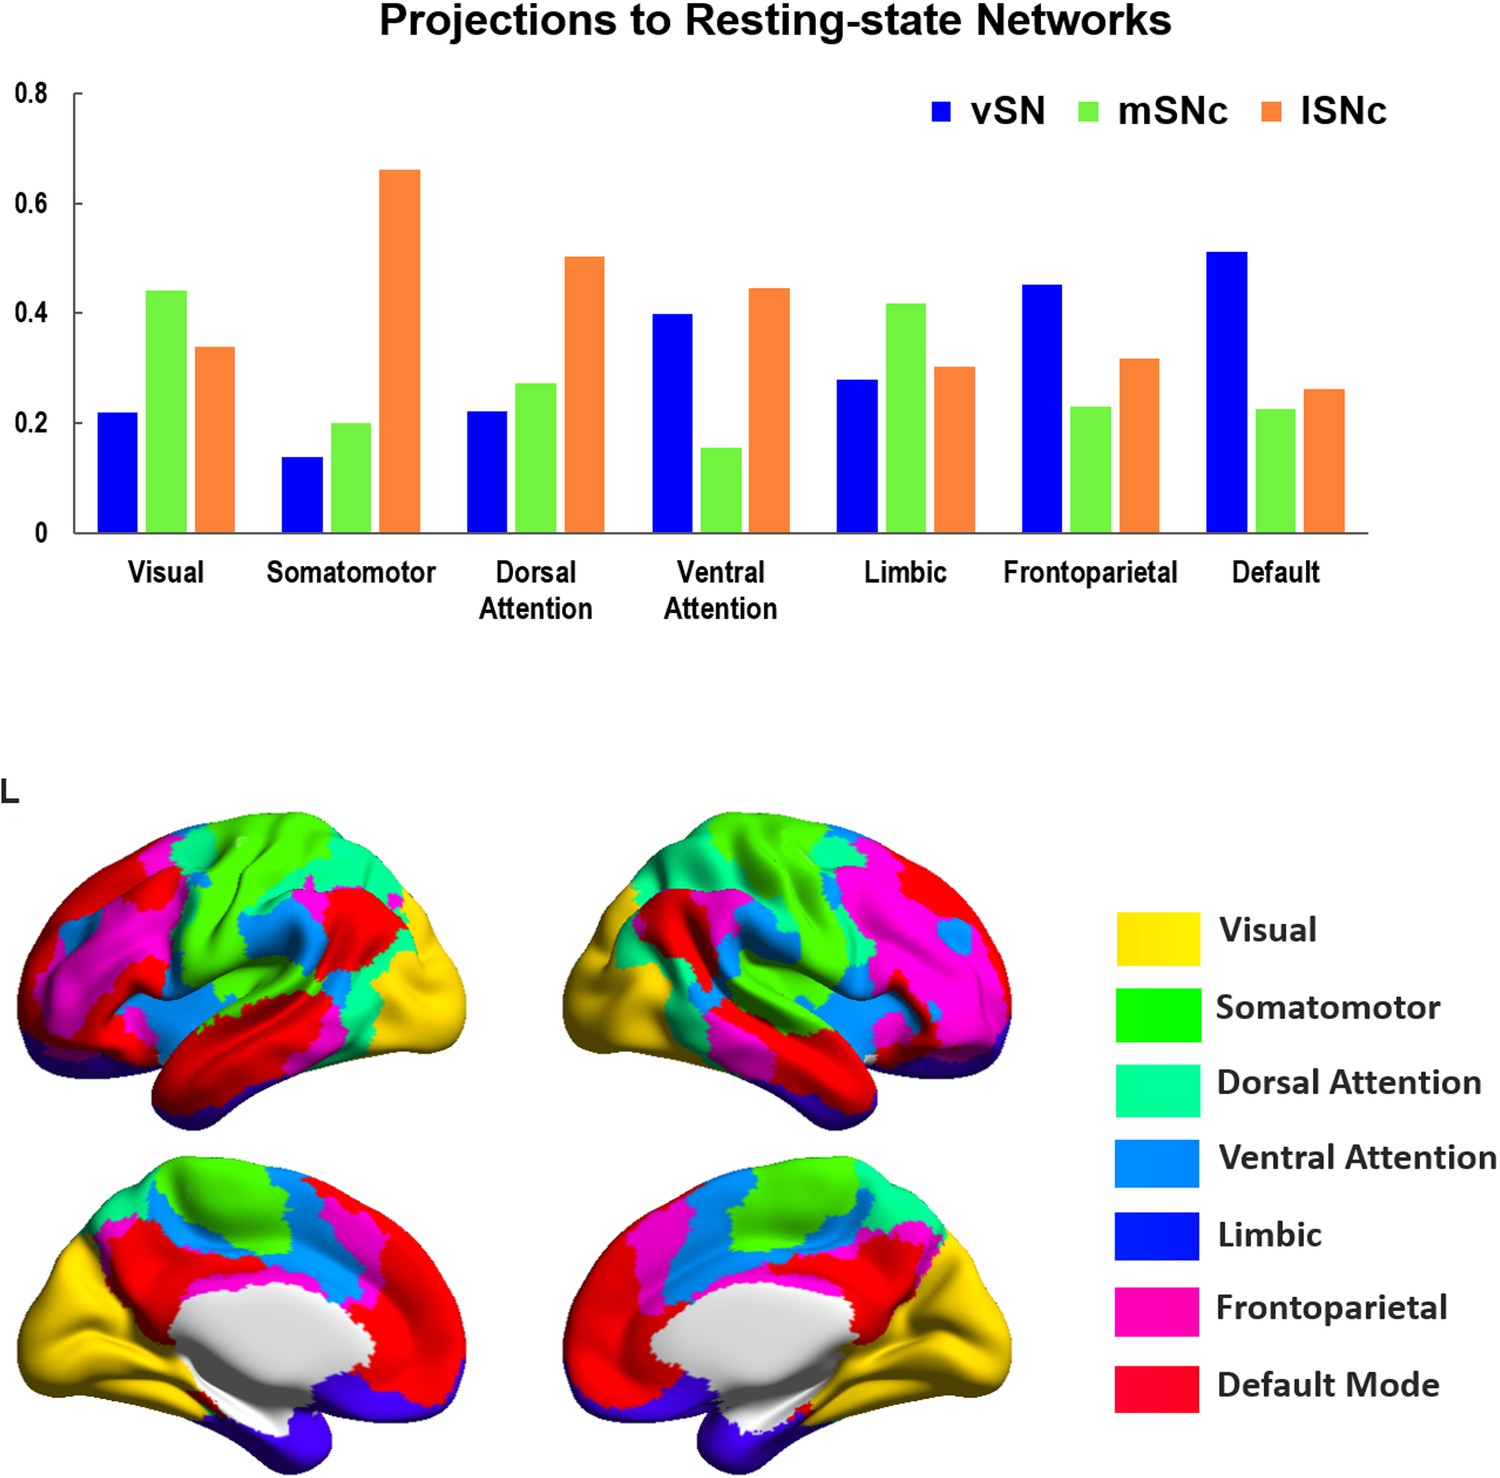
Connectivity profiles of SN subdivisions to seven resting-state functional networks.
Organizational pattern of SN connections with seven canonical resting-sate networks (Yeo et al., 2011). A limbic-cognitive-motor topography was shown, where lSNc preferentially connects to somatomotor cortex and dorsal attention network; mSNc dominantly connects to limbic and visual cortex; vSN mainly connects with frontoparietal and default-mode networks. Bottom panel shows the cortical mapping of the seven resting-state networks by using BrainNetViewer (https://www.nitrc.org/projects/bnv).
Figure 5—figure supplement 3
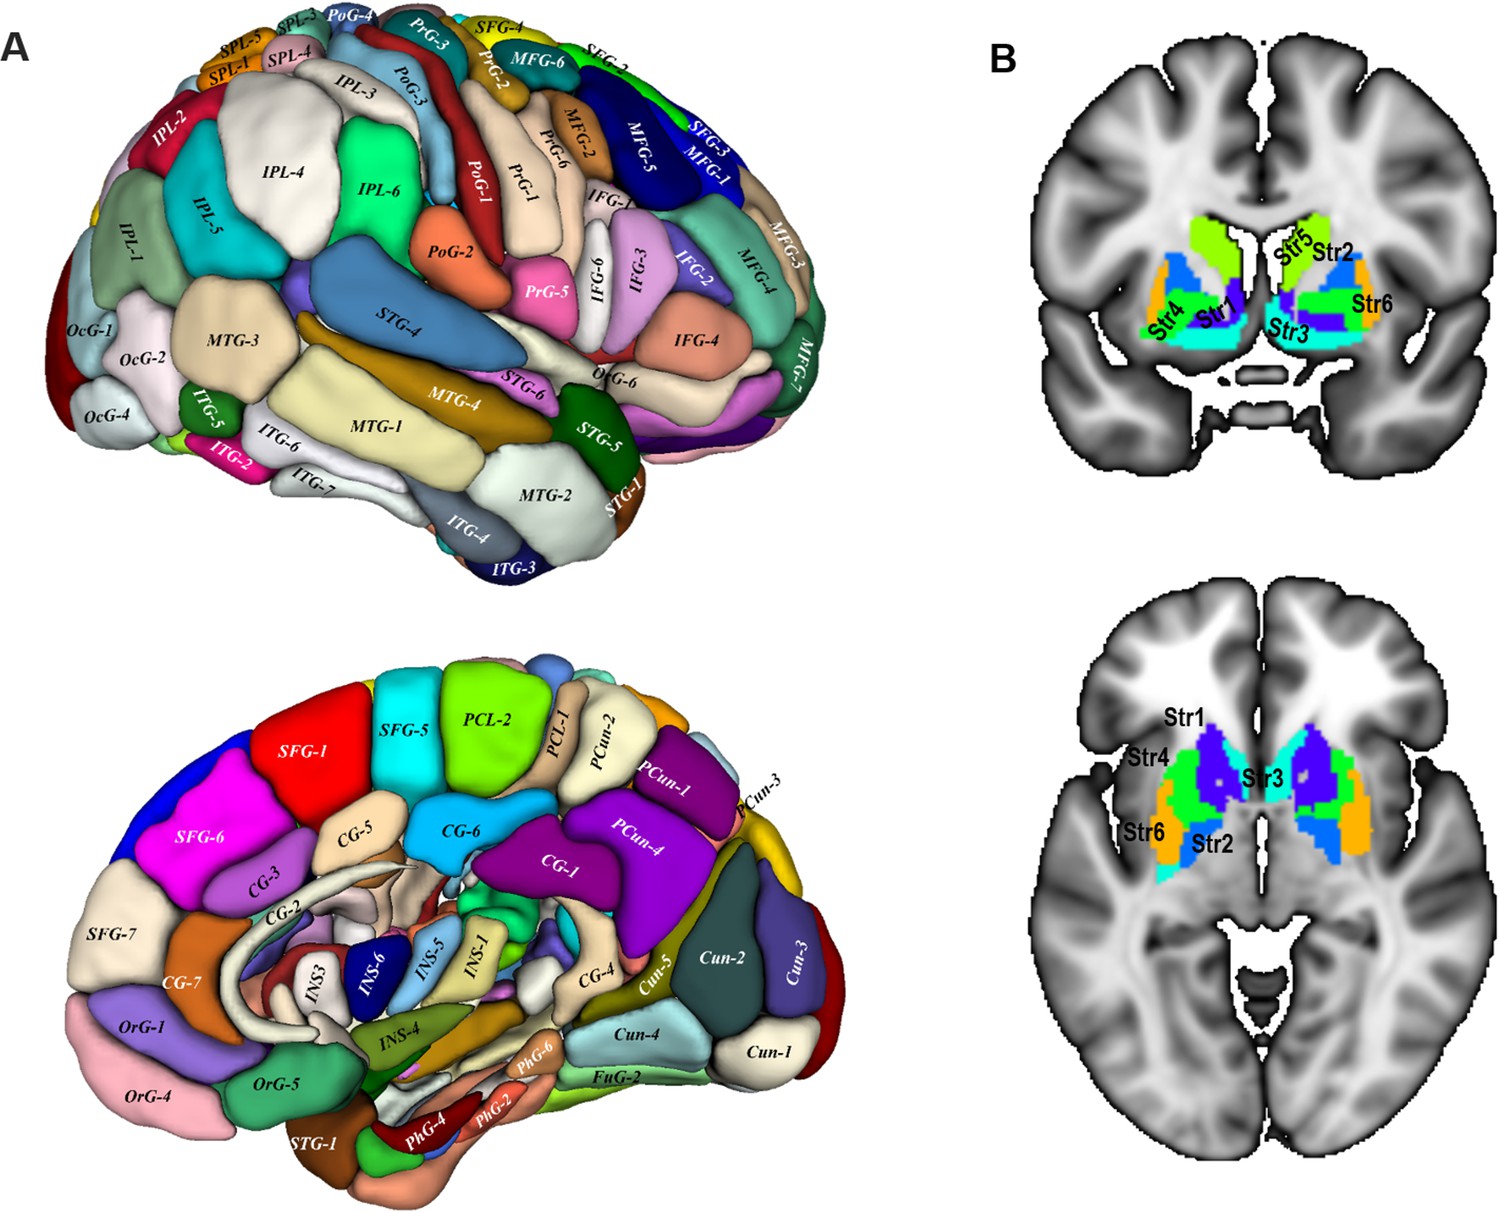
Target regions of the connectivity fingerprints.
We used a whole-brain atlas (Fan et al., 2016) as the target areas to calculate the connectivity fingerprint of SN subdivisions. The surface view of the atlas (A) was adapted from (Fan et al., 2016) with permission from the authors. The slice views (B) depict the basal ganglia regions from the atlas. These are: Str1: ventral caudate, Str2: globus pallidus, Str3: nucleus accumbens; Str4: ventromedial putamen, Str5: dorsal caudate nucleus, Str6: dorsolateral putamen. This atlas is available at http://atlas.brainnetome.org/.
Figure 6 with 3 supplements
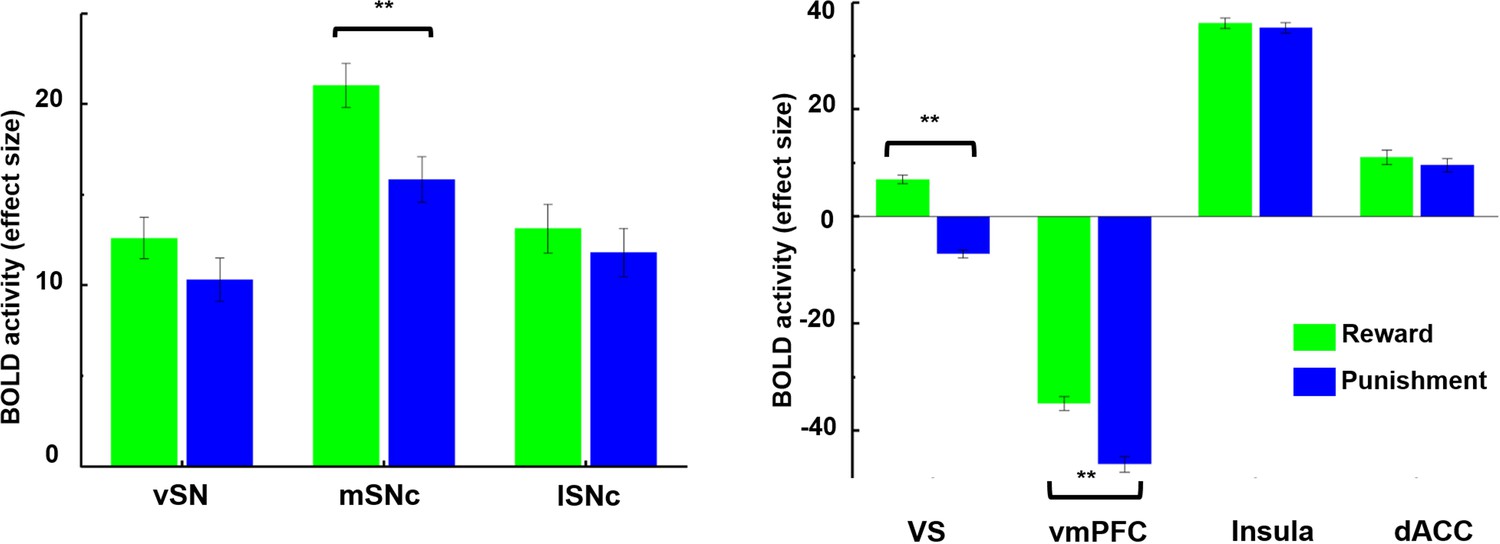
Brain activity in response to rewarding and aversive outcomes in the fMRI gambling task.
Among SN subdivisions, only medial SNc showed a significant difference in response to reward and punishment (p<0.001). The ventral striatum (VS) and ventromedial prefrontal cortex (vmPFC) also responded differently to reward and punishment, with greater BOLD activity to rewarding than aversive stimuli (p<0.001). Meanwhile, anterior insula and dorsal anterior cingulate cortex (dACC) showed no difference in response to reward and punishment.
Figure 6—figure supplement 1
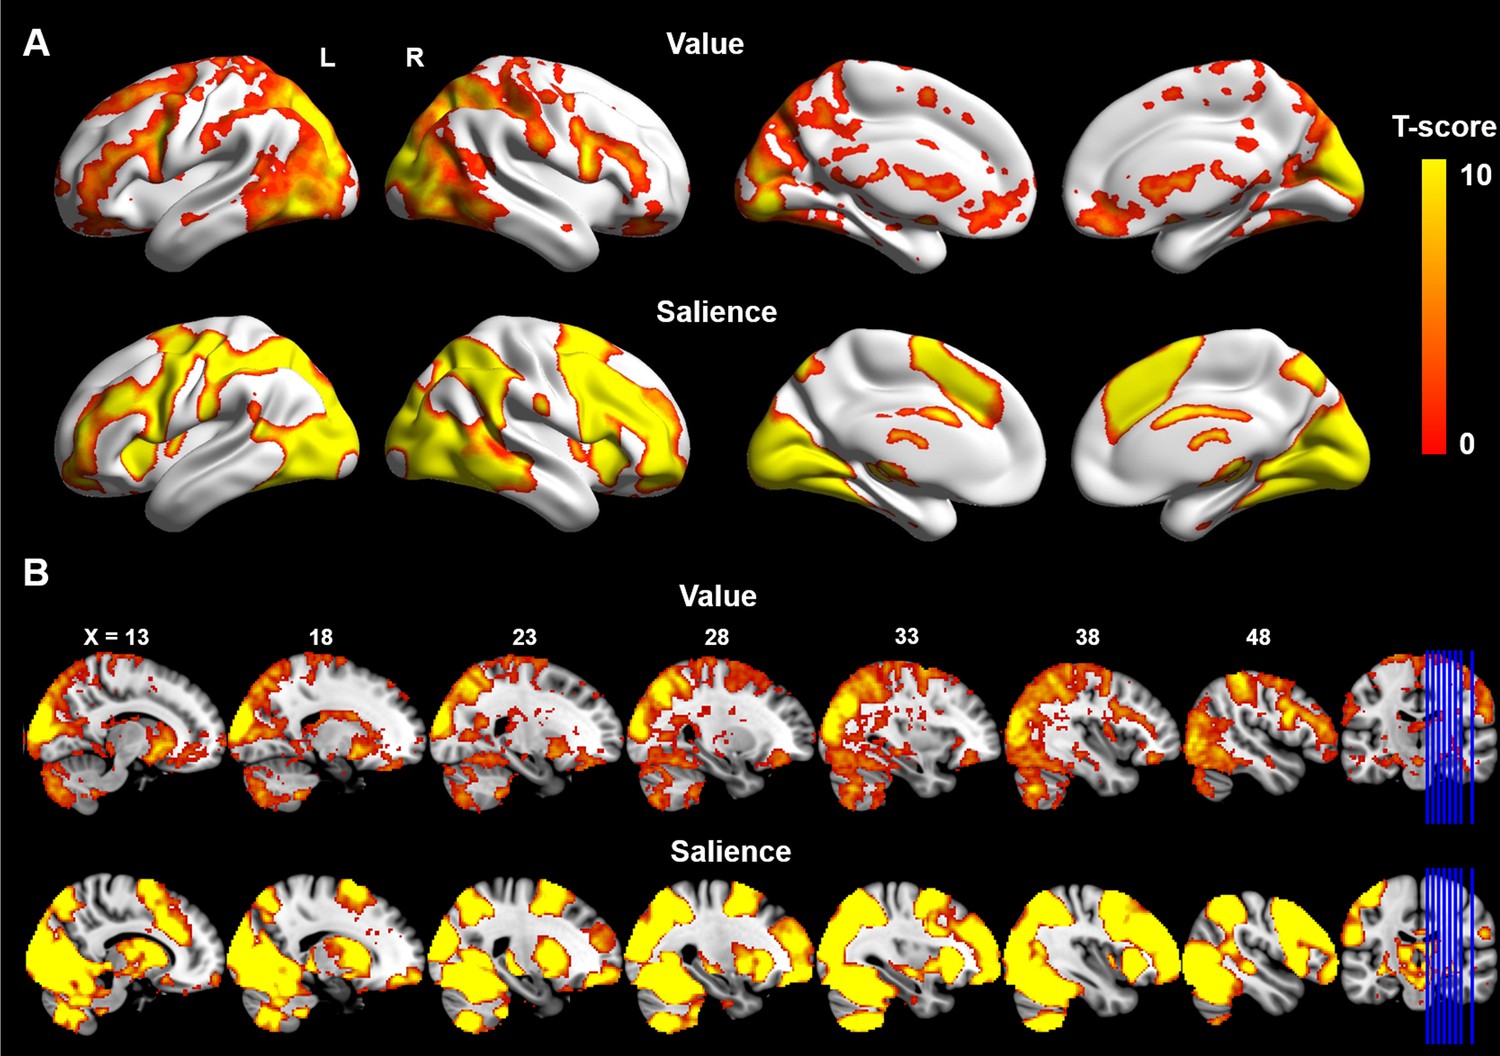
Whole-brain analysis of BOLD response to value-coding and salience-coding.
One sample t-test was applied in FSL using the randomise function. Significant BOLD activity encoding value signals (top row; difference in response to reward and punishment) was detected in ventral medial prefrontal cortex and ventral striatum. Meanwhile, BOLD response to salience (second row; averaged response to reward and punishment) was found in anterior insula, dorsal ACC and dorsal striatum. A Threshold-Free Cluster Enhancement (TFCE) method (Smith and Nichols, 2009) was used to correct for multiple comparisons (FWE corrected p=0.01). A) Surface views generated using BrainNetViewer (https://www.nitrc.org/projects/bnv). (B) Multi-slice views generated using MRIcron (http://people.cas.sc.edu/rorden/mricron/index.html) on the ICBM152 brain template.
Figure 6—figure Supplement 2
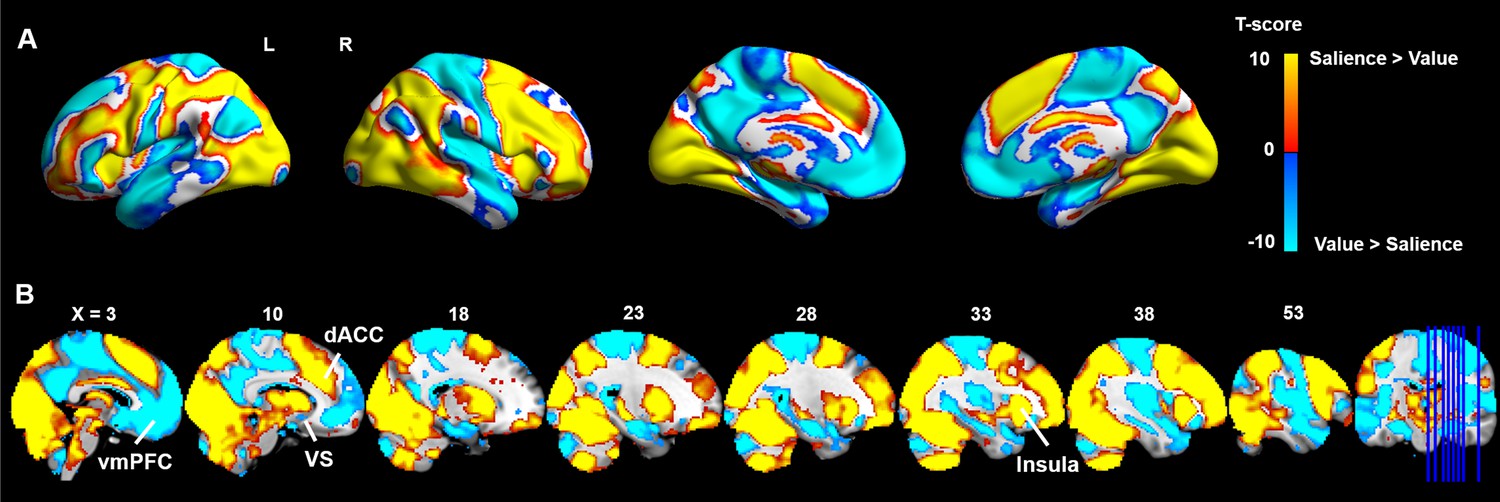
Contrast between value- and salience-related BOLD responses.
Paired t-test was used to directly compare the contrasts of value and salience, correcting for multiple comparisons using the Threshold-Free Cluster Enhancement (TFCE) method (Smith and Nichols, 2009). Greater BOLD response to value (colored in blue) was observed in vmPFC, precuneus, hippocampus and ventral striatum. Greater BOLD response to salience (colored in yellow) was found in dorsal medial and lateral prefrontal, dorsal cingulate cortex, anterior insula and dorsal striatum.
Figure 6—figure supplement 3

Brain activity in response to value and salience.
Among the subdivisions of SN, only medial SNc significantly responded to value (gains > losses), and this was significantly greater than the other two subdivisions (p<0.001). However, all three subregions showed a significant response to salience (gains + losses) (p<0.0001). Ventral striatum and vmPFC both significantly responded to value (p<0.0001), but only vmPFC was deactivated by salience. Meanwhile, anterior insula and dorsal anterior cingulate cortex only significantly responded to salience. Overall, only mSNc, VS and vmPFC showed significant BOLD response to value, while all regions except VS responded to salience.
Figure 7 with 1 supplement
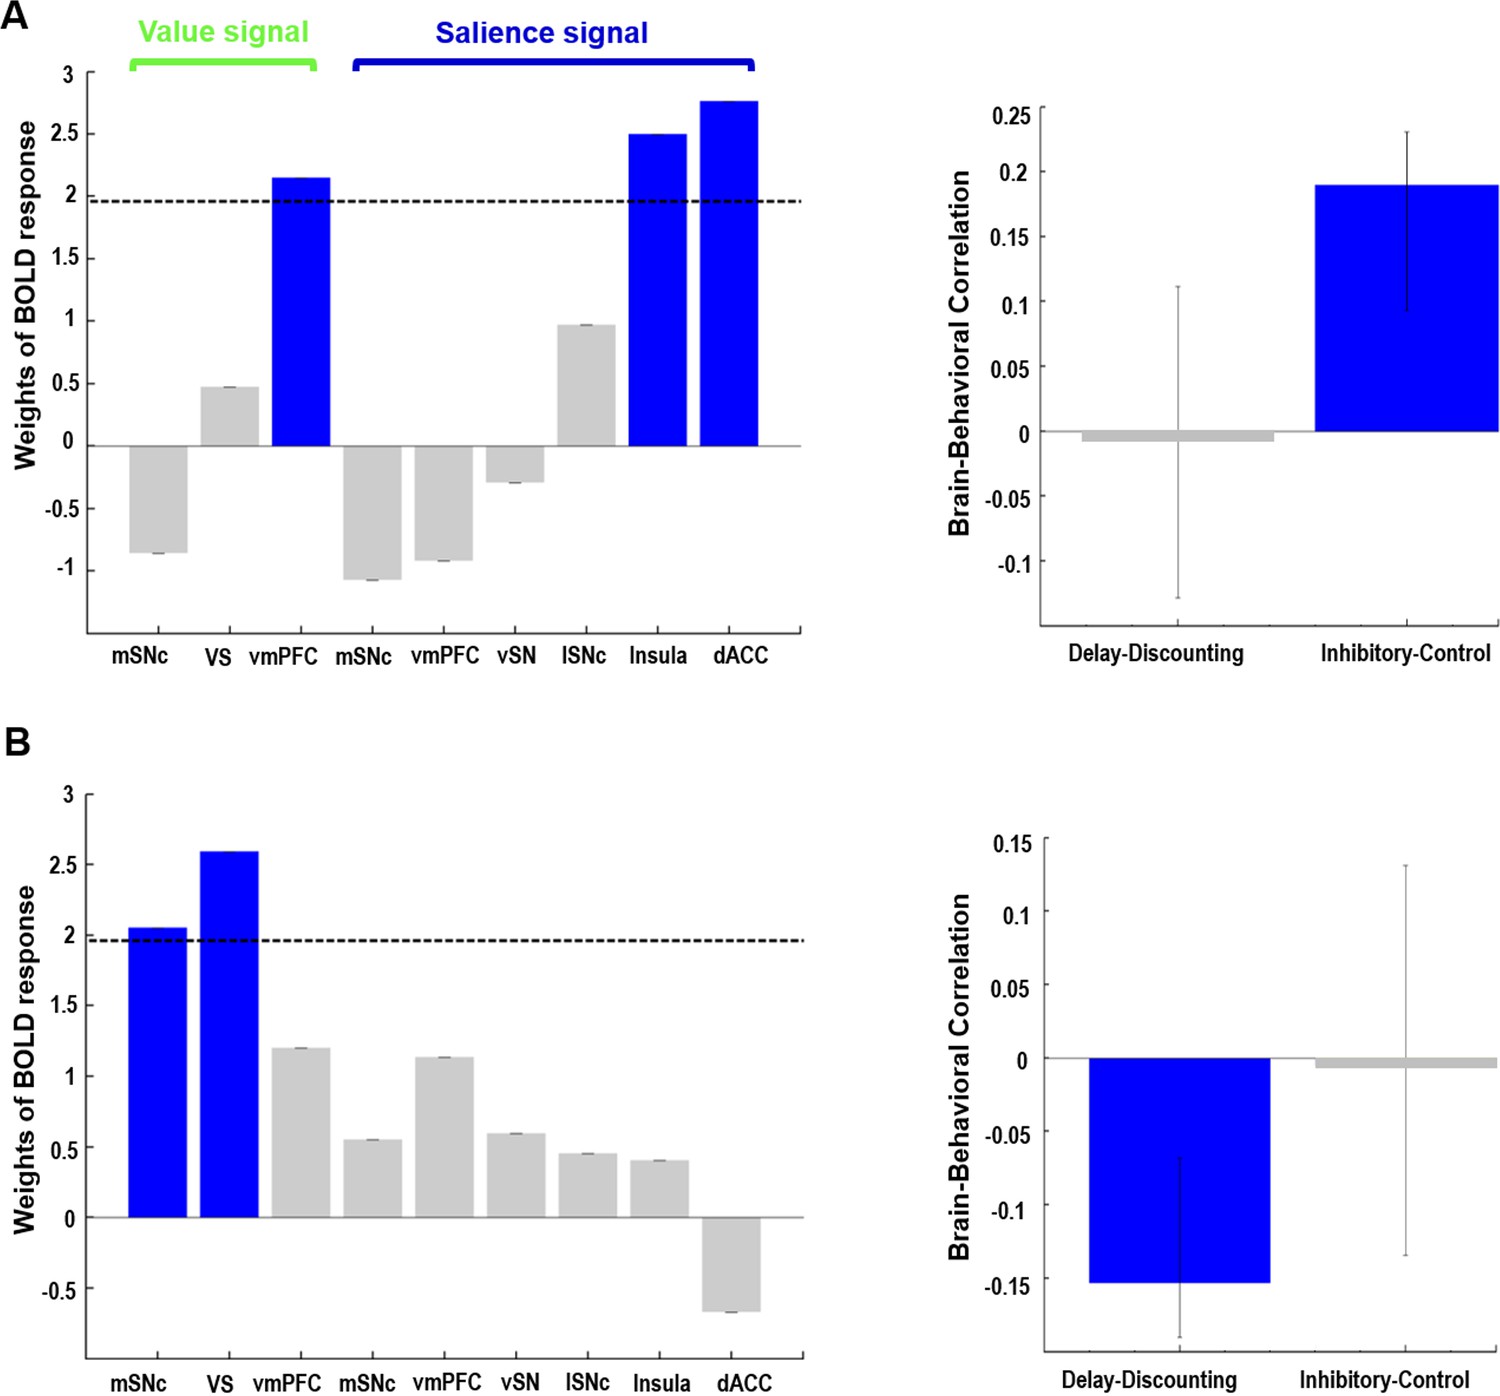
Behavioral PLS analysis on value- and salience-coding BOLD response and two measures of impulsivity.
Two orthogonal components were identified. The first component (A) captured the relationship between value signal from vmPFC, salience signals from anterior insula and dACC, and inhibitory control scores on the Flanker task. The second component (B) captured the relationship between value signals from mSNc and VS, and the AUC measure of delay discounting. Value and salience BOLD signals were derived from the gambling task. Note: for delay-discounting lower AUC indicates greater impulsivity. (AUC: area under the curve). In the leftmost panel, blue color of the bars indicates a reliable contribution (z > 1.96) as determined by the bootstrap procedure. Error bars in the middle panel represent 95% confidence intervals derived from bootstrap resampling. See text for abbreviations.
Figure 7—figure supplement 1

Correlation analysis between value and salience BOLD response and two measures of impulsivity.
Decisional impulsivity (A) measured by AUC of Delay-Discounting task was associated with value-related BOLD response in medial SNc and VS. Motor impulsivity (B) measured by Flanker Inhibitory control task was correlated with salience-related BOLD response in anterior Insula and dACC. The red stars indicate significant correlations after Holm–Bonferroni multiple comparison correction using a p-value=0.05.
Author response image 1
T atlas of Basal ganglia illustrating the location of Substantia Nigra.
Figure adapted from the Keuken and Forstmann (2015) atlas.
Tables
Table 1
Regions of interest used in this study and their BOLD activity during the gambling task.
https://doi.org/10.7554/eLife.26653.009| Brain regions | X | Y | Z | Brain Activity (T-score) | ||
|---|---|---|---|---|---|---|
| Reward | Punishment | RPE | ||||
| SN subdivisions | ||||||
| vSN | 9 | −13 | −12 | 11.12 ** | 8.63 ** | 1.85 |
| medial SNc | 8 | −16 | −12 | 17.45 ** | 12.48 ** | 3.96 ** |
| lateral SNc | 12 | −17 | -9 | 9.72 ** | 8.87 ** | 0.93 |
| Ventral Striatum | 12 | 15 | -6 | 8.91 ** | - 9.33 ** | 16.25 ** |
| vmPFC | 6 | 45 | -9 | - 26.72 ** | - 32.37 ** | 8.75 ** |
| Anterior insula | 32 | 22 | -6 | 35.54 ** | 36.62 ** | 1.07 |
| dACC | 4 | 40 | 24 | 8.43 ** | 7.64 ** | 1.37 |
-
Notes: **p-value<0.01; *p-value<0.05 with FDR correction
SN: substantia nigra; vSN: ventral subregion of SN; SNc: SN pars compacta; vmPFC: ventral medial prefrontal cortex; dACC: dorsal anterior cingulate cortex; RPE: reward prediction error
Additional files
-
Transparent reporting form
- https://doi.org/10.7554/eLife.26653.026
Download links
A two-part list of links to download the article, or parts of the article, in various formats.
Downloads (link to download the article as PDF)
Open citations (links to open the citations from this article in various online reference manager services)
Cite this article (links to download the citations from this article in formats compatible with various reference manager tools)
Anatomical and functional organization of the human substantia nigra and its connections
eLife 6:e26653.
https://doi.org/10.7554/eLife.26653


