BLADE-ON-PETIOLE proteins act in an E3 ubiquitin ligase complex to regulate PHYTOCHROME INTERACTING FACTOR 4 abundance
- Swedish University of Agricultural Sciences, Sweden
- University of Lausanne, Switzerland
- Umeå University, Sweden
Figures
Figure 1 with 3 supplements
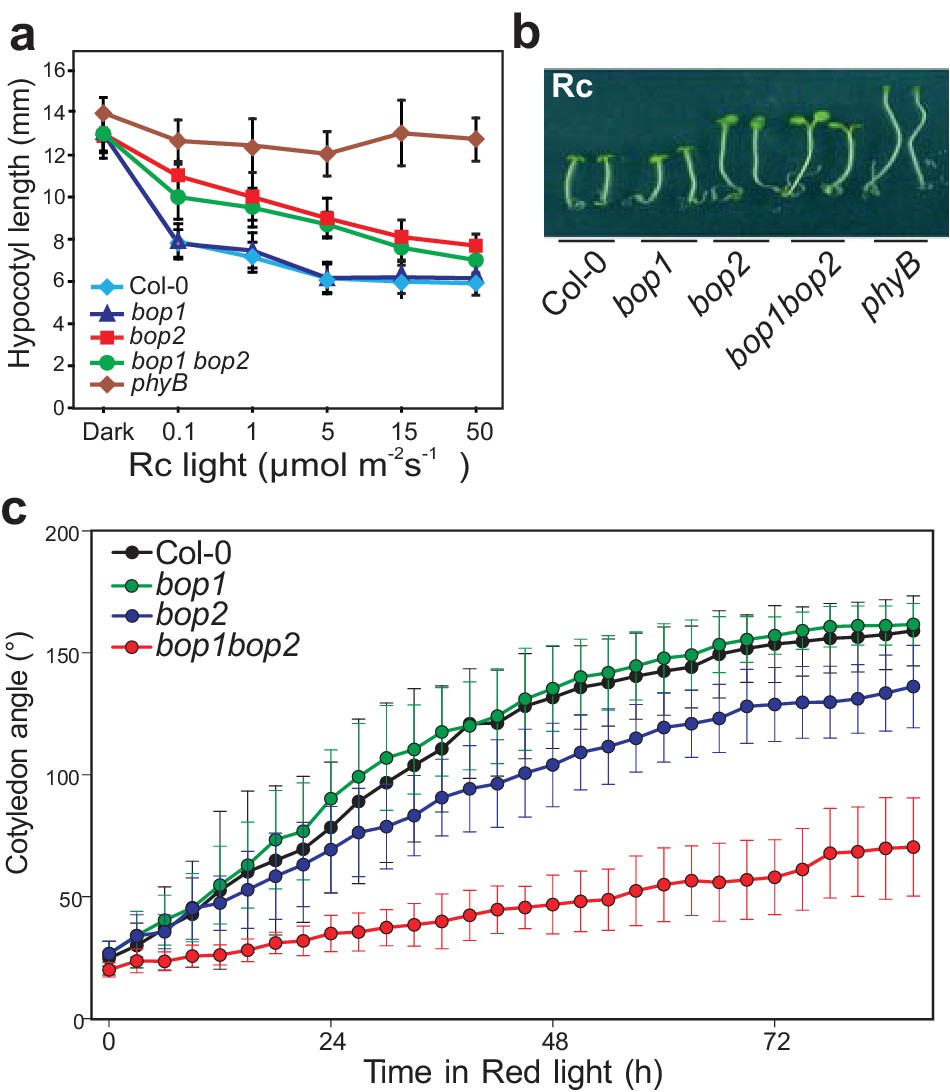
BOP2 promotes photomorphogenesis in red light.
(a) Hypocotyl lengths of 5-day-old Col-0, bop1, bop2, and bop1 bop2 seedlings grown in constant red light (Rc) of different fluence rates with phyB mutants included as controls. (b) Hypocotyl phenotypes of indicated seedlings in 2 μmol·m−2·s−1 red light. (c) Kinematic analysis of cotyledon angles for Col-0, bop1, bop2, and bop1 bop2 plants. Seedlings were firstly grown in dark for 3 days then switched to 6 μmol·m−2·s−1 red light. Quantitative data are shown as means ± s.d., n = 25 in (a) and n = 9–14 in (c). The experiments were repeated three times with similar results.
Figure 1—figure supplement 1
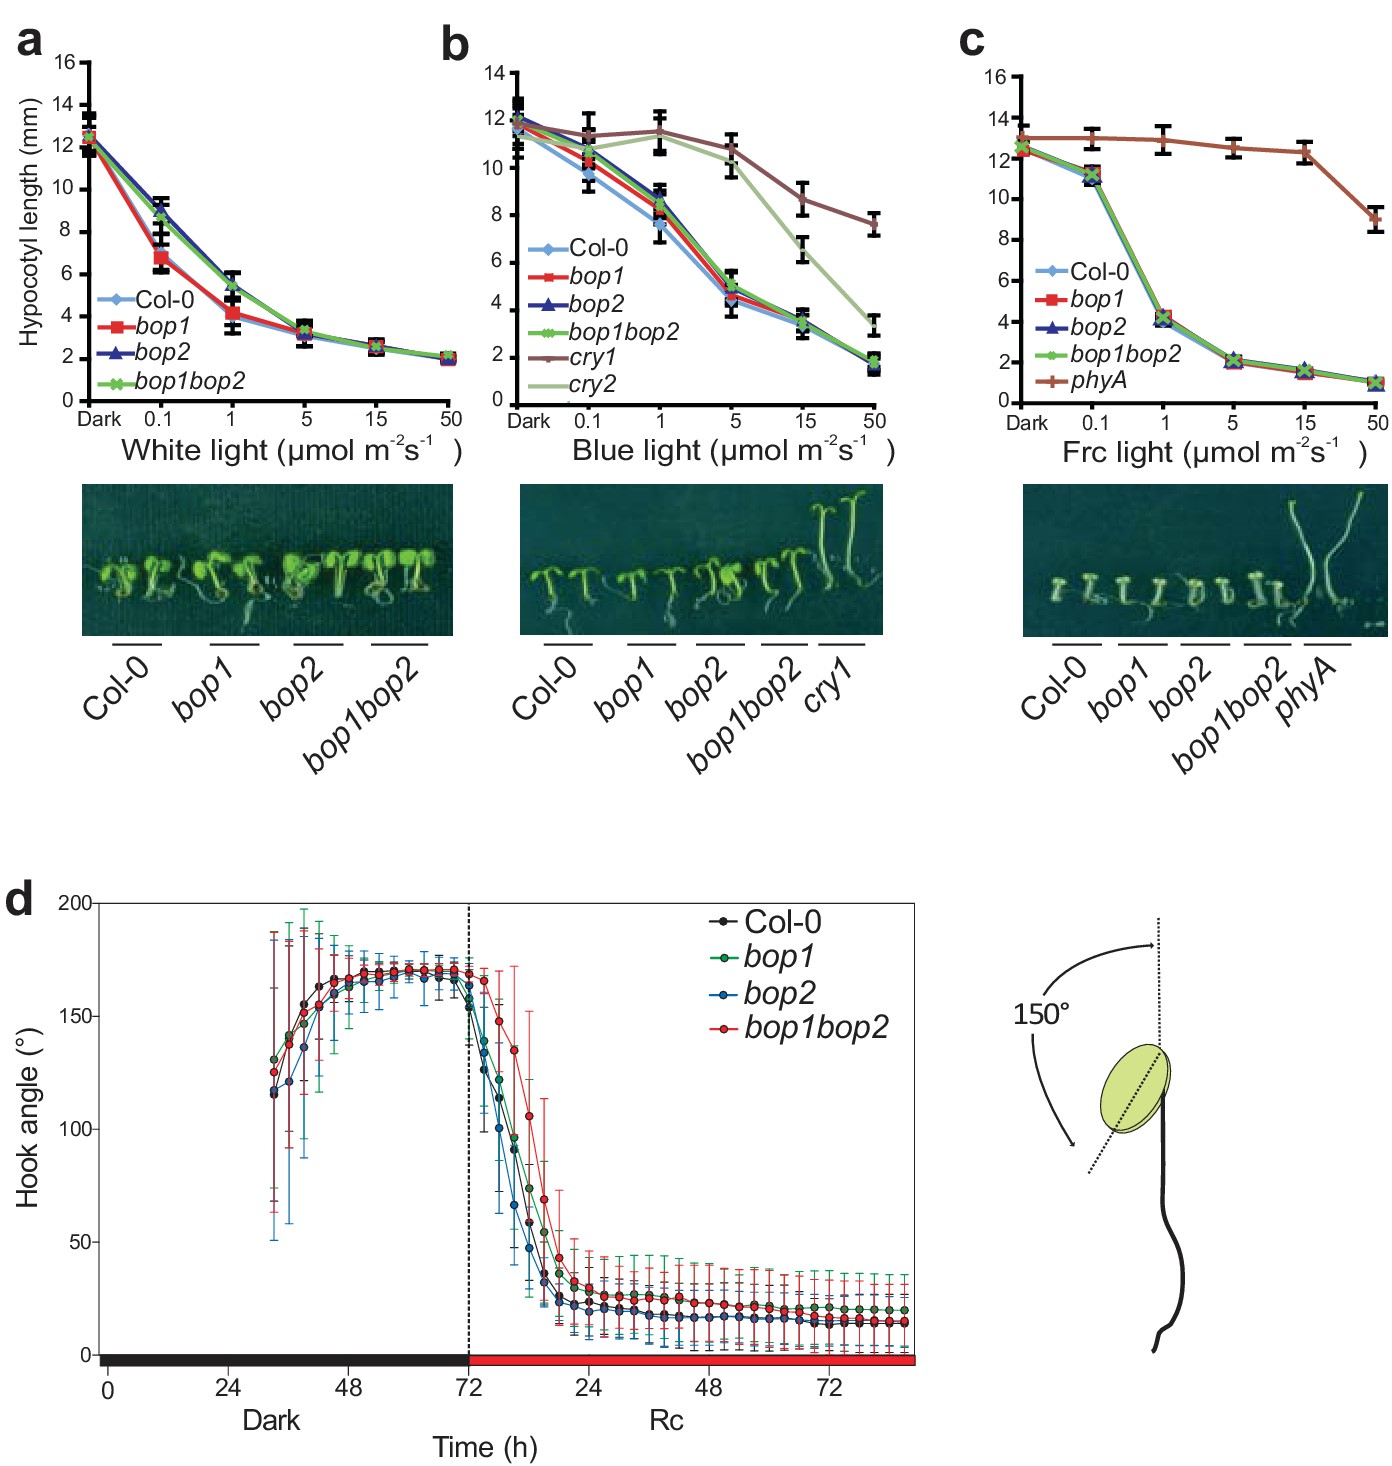
Hypocotyl lengths and hook angles of BOP mutants in response to white light and monochromatic light.
(a–c) Hypocotyl lengths of 5-day-old Col-0, bop1, bop2, and bop1 bop2 seedlings grown in constant white light (a), blue light (b), and far-red light (c) of different fluence rates, using cry1, cry2, and phyA as negative controls. (d) kinematic analysis of hook angles in response to red light for Col-0, bop1, bop2, and bop1 bop2 plants. Seedlings were firstly grown in dark for 3 days then transferred to 6 μmol·m−2·s−1 red light. The scheme at the right panel indicates the angel that was measured. Quantitative data are shown as means ± s.d., n = 25 in (a, b, c) and n = 7–13 in (d).
Figure 1—figure supplement 2
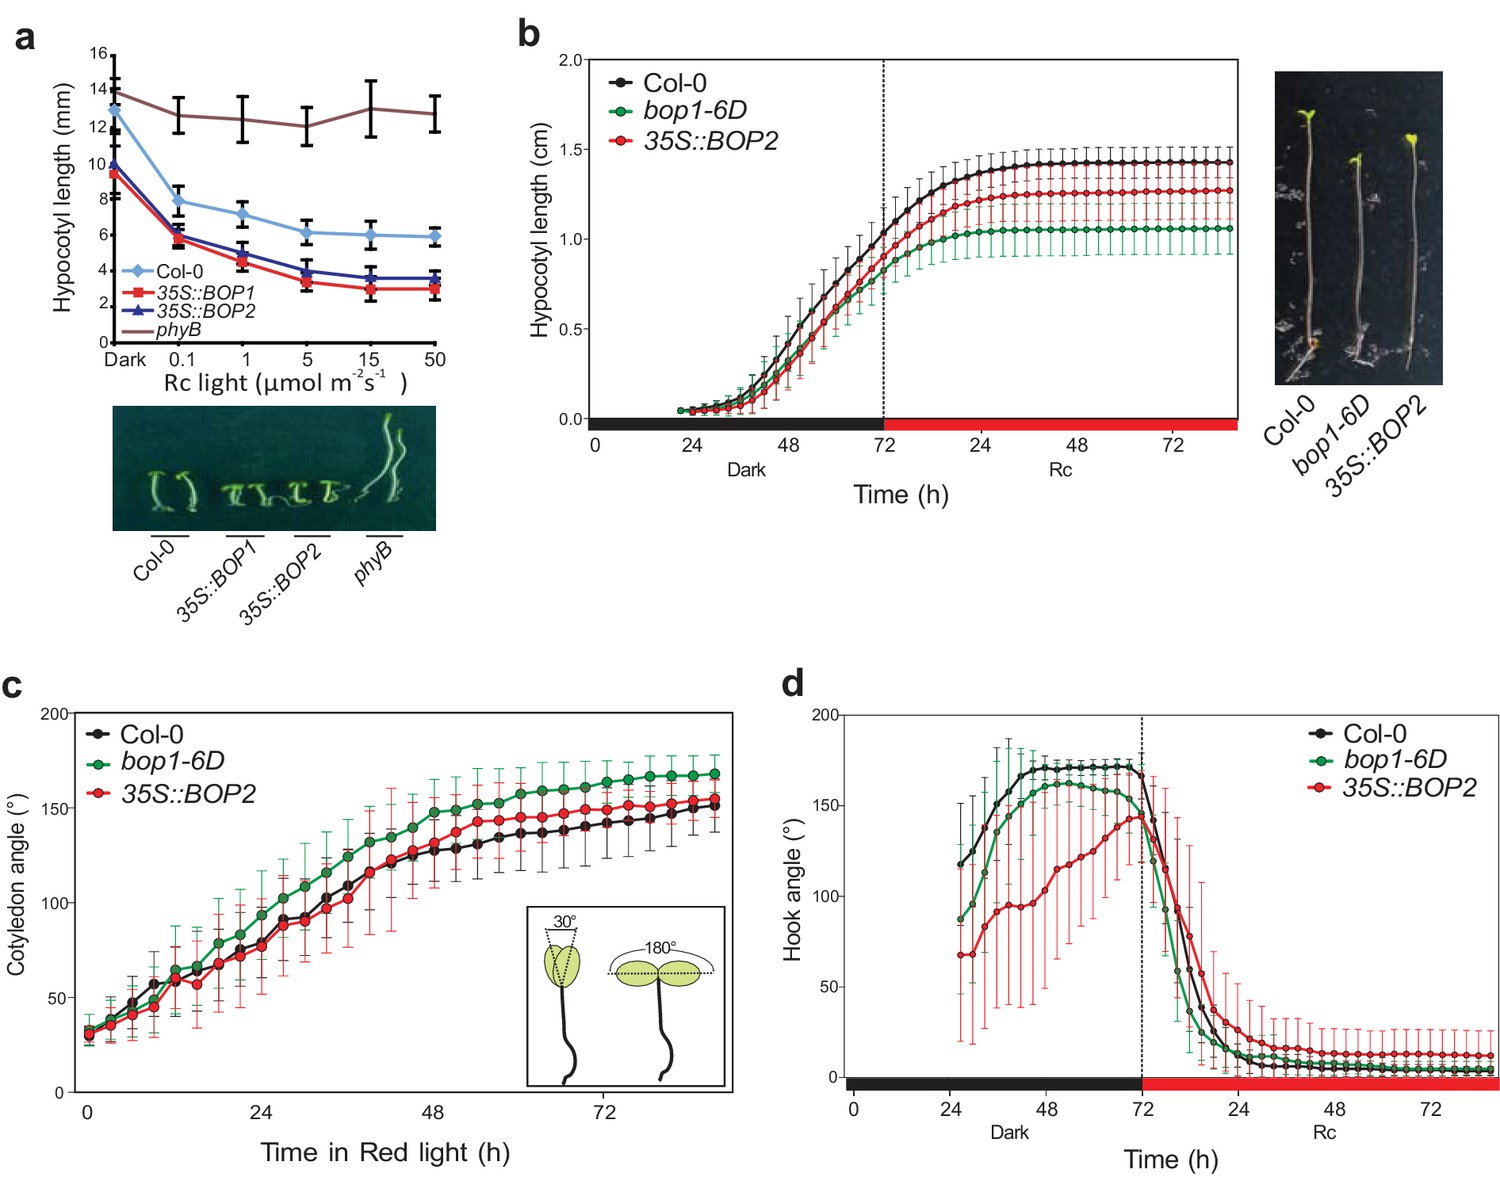
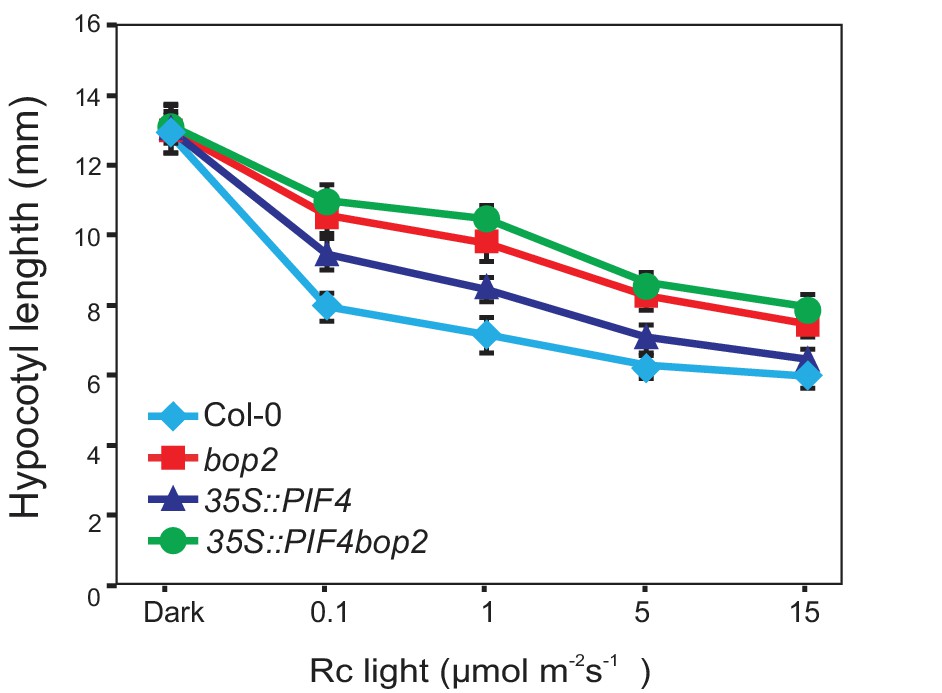
Hypocotyl lengths, cotyledon angles, and hook angles of BOP1 and BOP2 overexpressing lines in response to red light.
(a) Hypocotyl lengths of Col-0, 35S::BOP1 and 35S::BOP2 seedlings grown in constant red light (Rc) of different fluence rates with phyB mutant included as controls. Lower panel shows the hypocotyl length phenotype of indicated lines. (b–d) kinematic analysis of hypocotyl lengths (b), cotyledon angles (c), the scheme in the smaller frame indicates the angel that was measured.), and hook angles (d) in response to red light for Col-0, bop1-6D and 35S::BOP2 seedlings. Seedlings were firstly grown in dark for 3 days then switched to 6 μmol·m−2·s−1 red light. Quantitative data are shown as means ± s.d., n = 25 in (a), n = 16–18 in (b), n = 7–11 in (c), n = 13–18 (d).
Figure 1—figure supplement 3
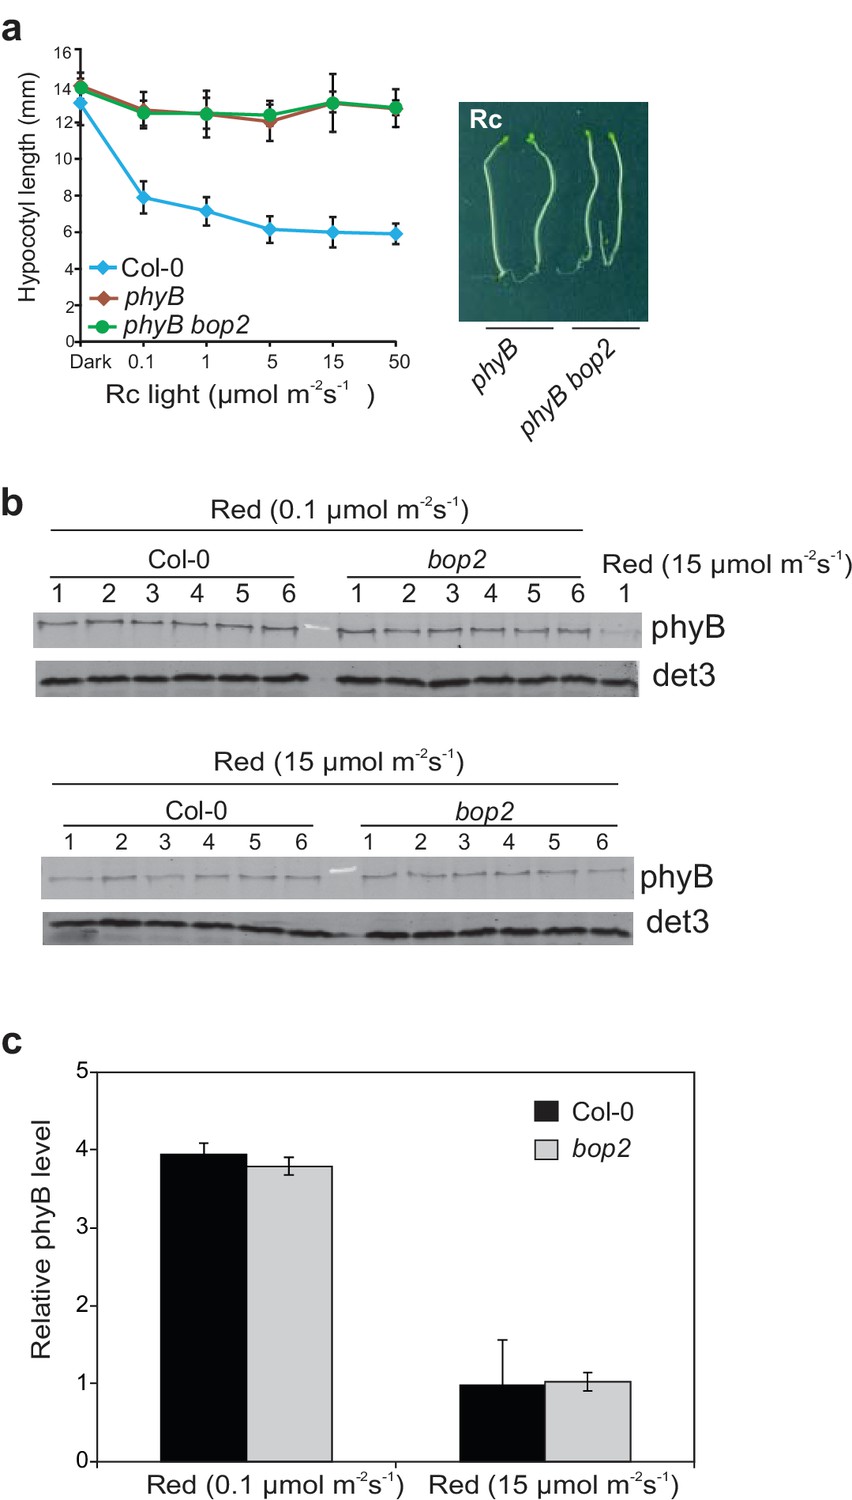
bop2-2 shows wild-type accumulation of phyB levels in 5 day-old seedlings grown in constant red light.
(a) Hypocotyl lengths of Col-0, phyB and phyB bop2 seedlings grown at constant red light (Rc) of different fluence rates. Right panel shows the hypocotyl length phenotype of indicated lines. (b) Western blot analysis of phyB protein level with anti-phyB antibodies using anti-DET3 as loading controls. (c) Quantification of the blots presented in (b) using the method described previously (Franklin and Quail, 2010). Data were normalized with DET3 loading controls. Results represent the mean of 6 replicates and data are expressed as compared to Col-0, sample 1 grown in 0.1 μmol·m−2·s−1 (this sample was loaded on each gel). Quantitative data are shown as means ± s.d., n = 25 in (a) and n = 6 in (c).
Figure 2 with 1 supplement
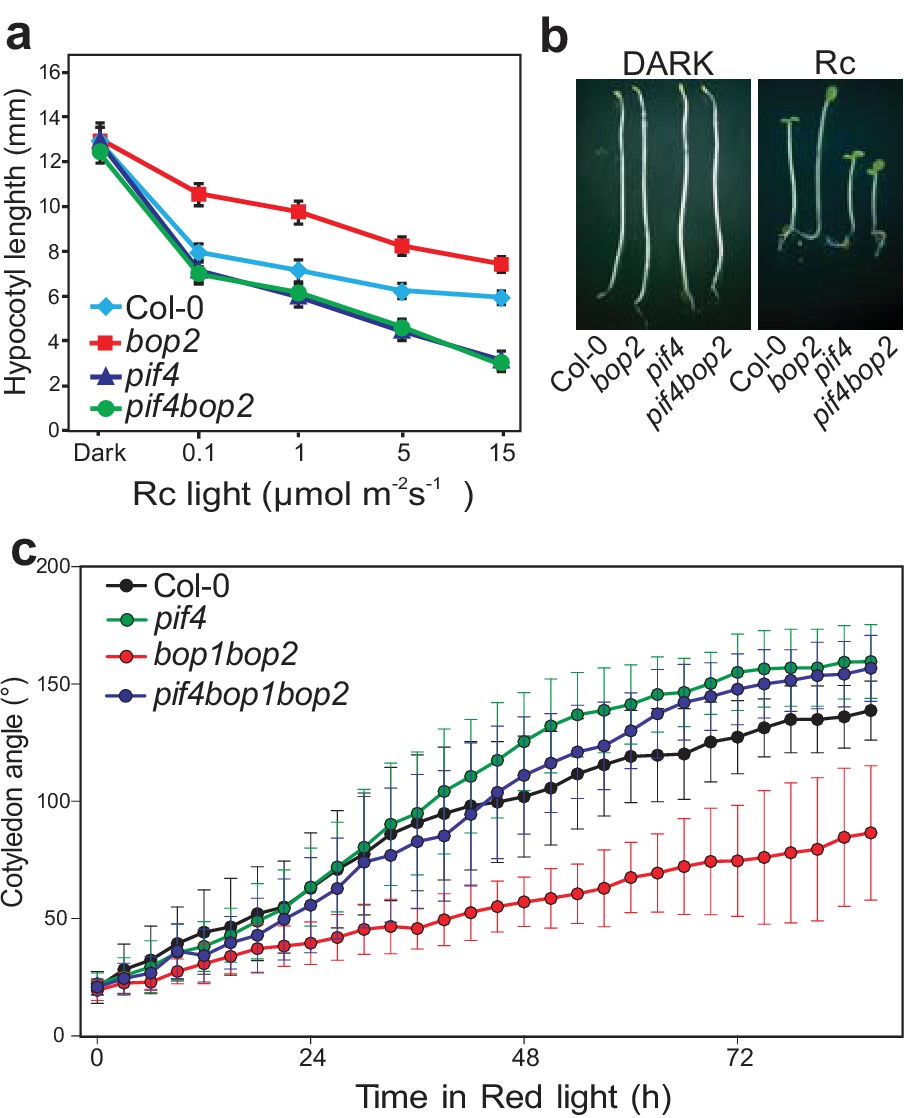
BOP2 genetically interacts with PIF4 in response to red light.
(a) Hypocotyl lengths of 5-day-old Col-0, bop2, pif4, and pif4 bop2 seedlings grown in constant red light (Rc) of different fluence rates. (b) Hypocotyl phenotypes of indicated seedlings in dark and 2 μmol·m−2·s−1 red light. (c) Kinematic analysis of cotyledon angles for Col-0, bop1 bop2, pif4, and pif4 bop1 bop2 plants. Seedlings were first grown in dark for 3 days then switched to 6 μmol·m−2·s−1 red light. Quantitative data are shown as means ± s.d., n = 25 in (a) and n = 9–15 in (c). The experiments were repeated three times with similar results.
Figure 2—figure supplement 1
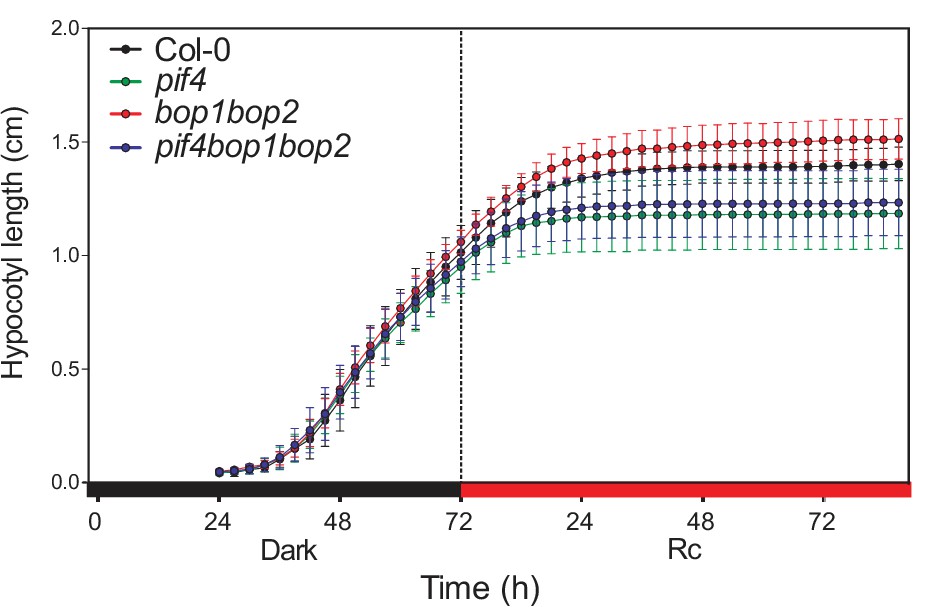
Kinematic analysis of hypocotyl lengths.
Kinematic analysis of hypocotyl lengths in response to red light for Col-0, pif4, bop1 bop2, and pif4 bop1 bop2 seedlings. Seedlings were firstly grown in dark for 3 days then switch to 6 μmol·m−2·s−1 red light. Quantitative data are shown as means ± s.d., n = 9–13.
Figure 3 with 1 supplement

BOP2 promotes degradation of PIF4 in response to red light.
(a) Hypocotyl lengths of 5-day-old Col-0, pif4, pif4 bop2, pif4;PIF4p::PIF4-HA, and pif4 bop2;PIF4p::PIF4-HA seedlings grown in constant red light (Rc) of different fluence rates. The data are shown as means ± s.d., n = 10. (b) Hypocotyl phenotypes of indicated seedlings in dark and 6 μmol·m−2·s−1 red light. (c) Western blot of 3-day-old dark grown seedlings upon red light treatment using an anti-HA antibody for detection of PIF4-HA and anti-tubulin antibody as loading controls. (d) Quantification of PIF4-HA protein levels relative to tubulin in 3-day-old dark grown seedlings at indicated time points of 6 μmol·m−2·s−1 red light treatment. Data were normalized to the Time 0 for each line. (e) Quantification of PIF4-HA mRNA levels relative to PP2A in 3-day-old dark grown seedlings at indicated time points of 6 μmol·m−2·s−1 red light treatment. Quantitative data in (d) and (e) are shown as means ± s.e.m., n = 3.
Figure 3—figure supplement 1
Hypocotyl lengths of 35S::PIF4-HA and 35S::PIF4-HA bop2 plants.
Hypocotyl lengths of 5-day-old Col-0, bop2, 35S::PIF4-HA, and 35S::PIF4-HA bop2 seedlings grown in constant red light (Rc) of different fluence rates. Quantitative data are shown as means ± s.d., n = 25.
Figure 4 with 1 supplement
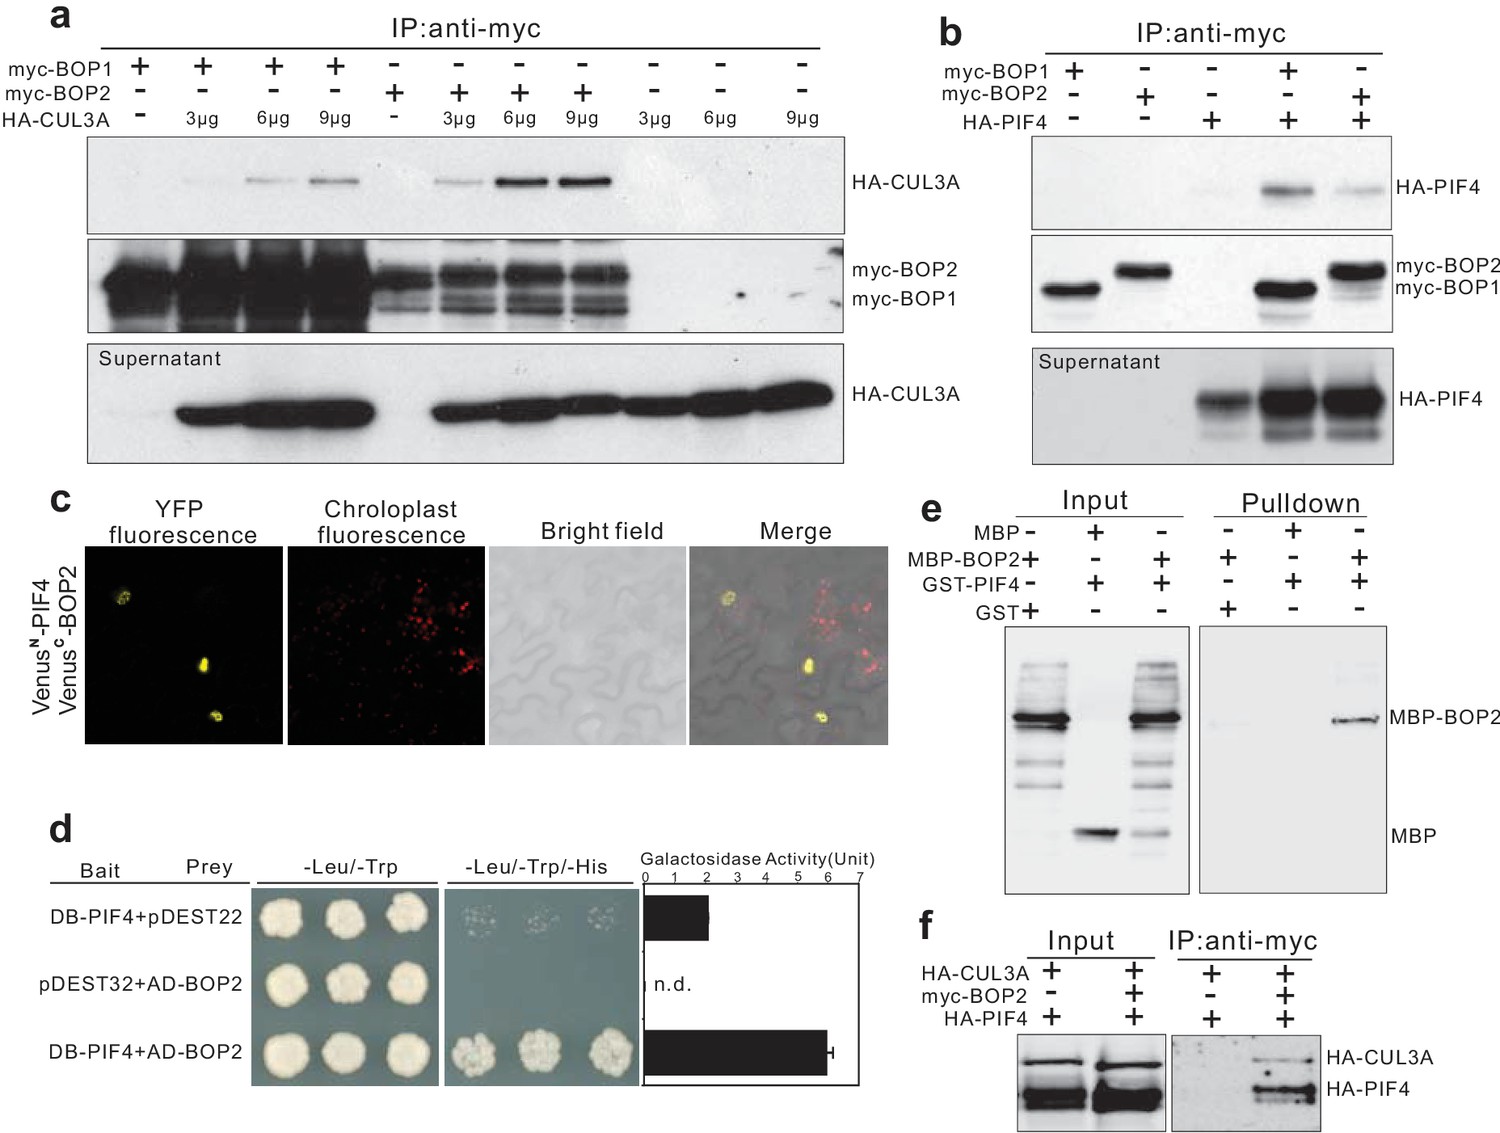
BOP1 and BOP2 interact with CUL3 and PIF4.
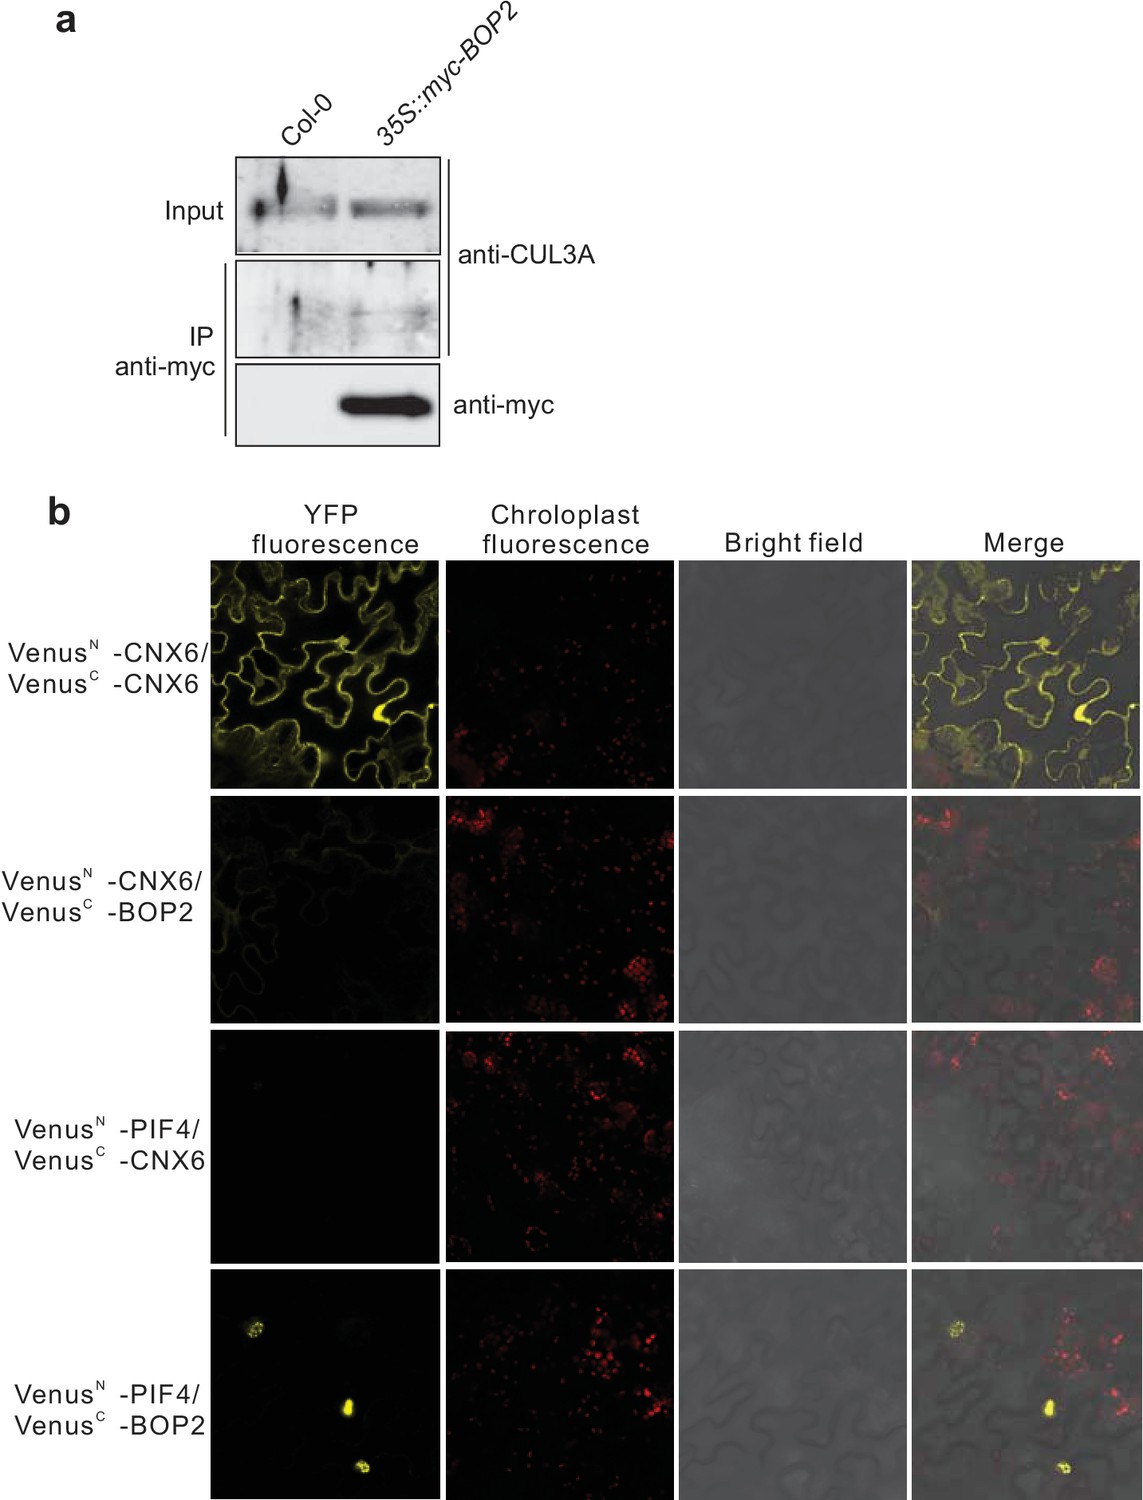
(a) Co-immunoprecipitation assays of CUIL3A and BOP1/2 interaction in Arabidopsis protoplasts. Co-immunoprecipitated HA-CUL3A was detected by western blotting using anti-HA antibodies, after immunoprecipitation of myc-BOP1 or myc-BOP2 by anti-myc antibodies. Precipitate probed with anti-myc antibodies and supernatant probed with anti-HA antibodies are shown as controls. 3–9 µg of HA-CUL3A input vector was used. (b) Co-immunoprecipitation assays of PIF4 and BOP1/2 interaction in Arabidopsis protoplast as done in (a). (c) BiFC assays of BOP2 and PIF4 interaction in Nicotiana benthamiana. VenusN, N-terminal part of Venus (aa 1–173); VenusC, C-terminal part of Venus (aa 156–239). Further controls to show that the interaction is specific are shown in Figure 4—figure supplement 1b. (d) Yeast two-hybrid assays of BOP2 and PIF4 interaction. The indicated combinations of plasmids were co-transformed into the yeast reporter strain, and interactions between the encoded proteins were assessed by growth on plates with yeast growth media lacking Leu, Trp, and His (-Leu/-Trp/-His). Yeast growth on plates lacking Leu and Trp (-Leu/-Trp) shows the presence of the bait and prey vectors. The strength of activation of the second reporter gene (β-galactosidase) is shown in the chart to the right. Negative controls are represented by the vector combinations containing one of the empty vectors, pDEST22 or pDEST32. Quantitative data are shown as means ± s.e.m, n = 3. (e) In vitro pulldown assays of BOP2 and PIF4 interaction. MBP-BOP2 or MBP recombinant proteins were pulled down by GST or GST-PIF4 recombinant proteins immobilized on glutathione Sepharose 4B beads, then analyzed by western blotting using anti-MBP antibodies. (f) Co-immunoprecipitation assays of CUIL3A, PIF4, and BOP2 interactions in Arabidopsis protoplast. Co-immunoprecipitated HA-CUL3A and HA-PIF4 were simultaneously detected by western blotting using anti-HA antibodies, after immunoprecipitation of myc-BOP2 by anti-myc antibodies.
Figure 4—figure supplement 1
Protein-protein interaction analysis.
(a) Co-immunoprecipitation analysis of CUL3A and BOP2 interaction in a 35S::myc-BOP2 transgenic line. Co-immunoprecipitated CUL3A was detected by western blotting using anti-CUL3A antibodies (Enzo Life Science, Inc.), after immunoprecipitation of myc-BOP2 by anti-myc antibodies. The precipitate was probed with anti-myc antibodies and input samples probed with anti-CUL3A antibodies are shown as controls. Col-0 was used as a negative control. (b) BiFC assay of BOP2 and PIF4 interaction. Co-expression of VenusN-CNX6 and VenusC-CNX6 serves as a positive control (Devlin et al., 1998). Co-expression of VenusN-CNX6 and VenusC-BOP2, VenusN-PIF4 and VenusC-CNX6 serve as negative controls. VenusN, N-terminal part of Venus (aa 1–173); VenusC, C-terminal part of Venus (aa 156–239).
Figure 5 with 1 supplement
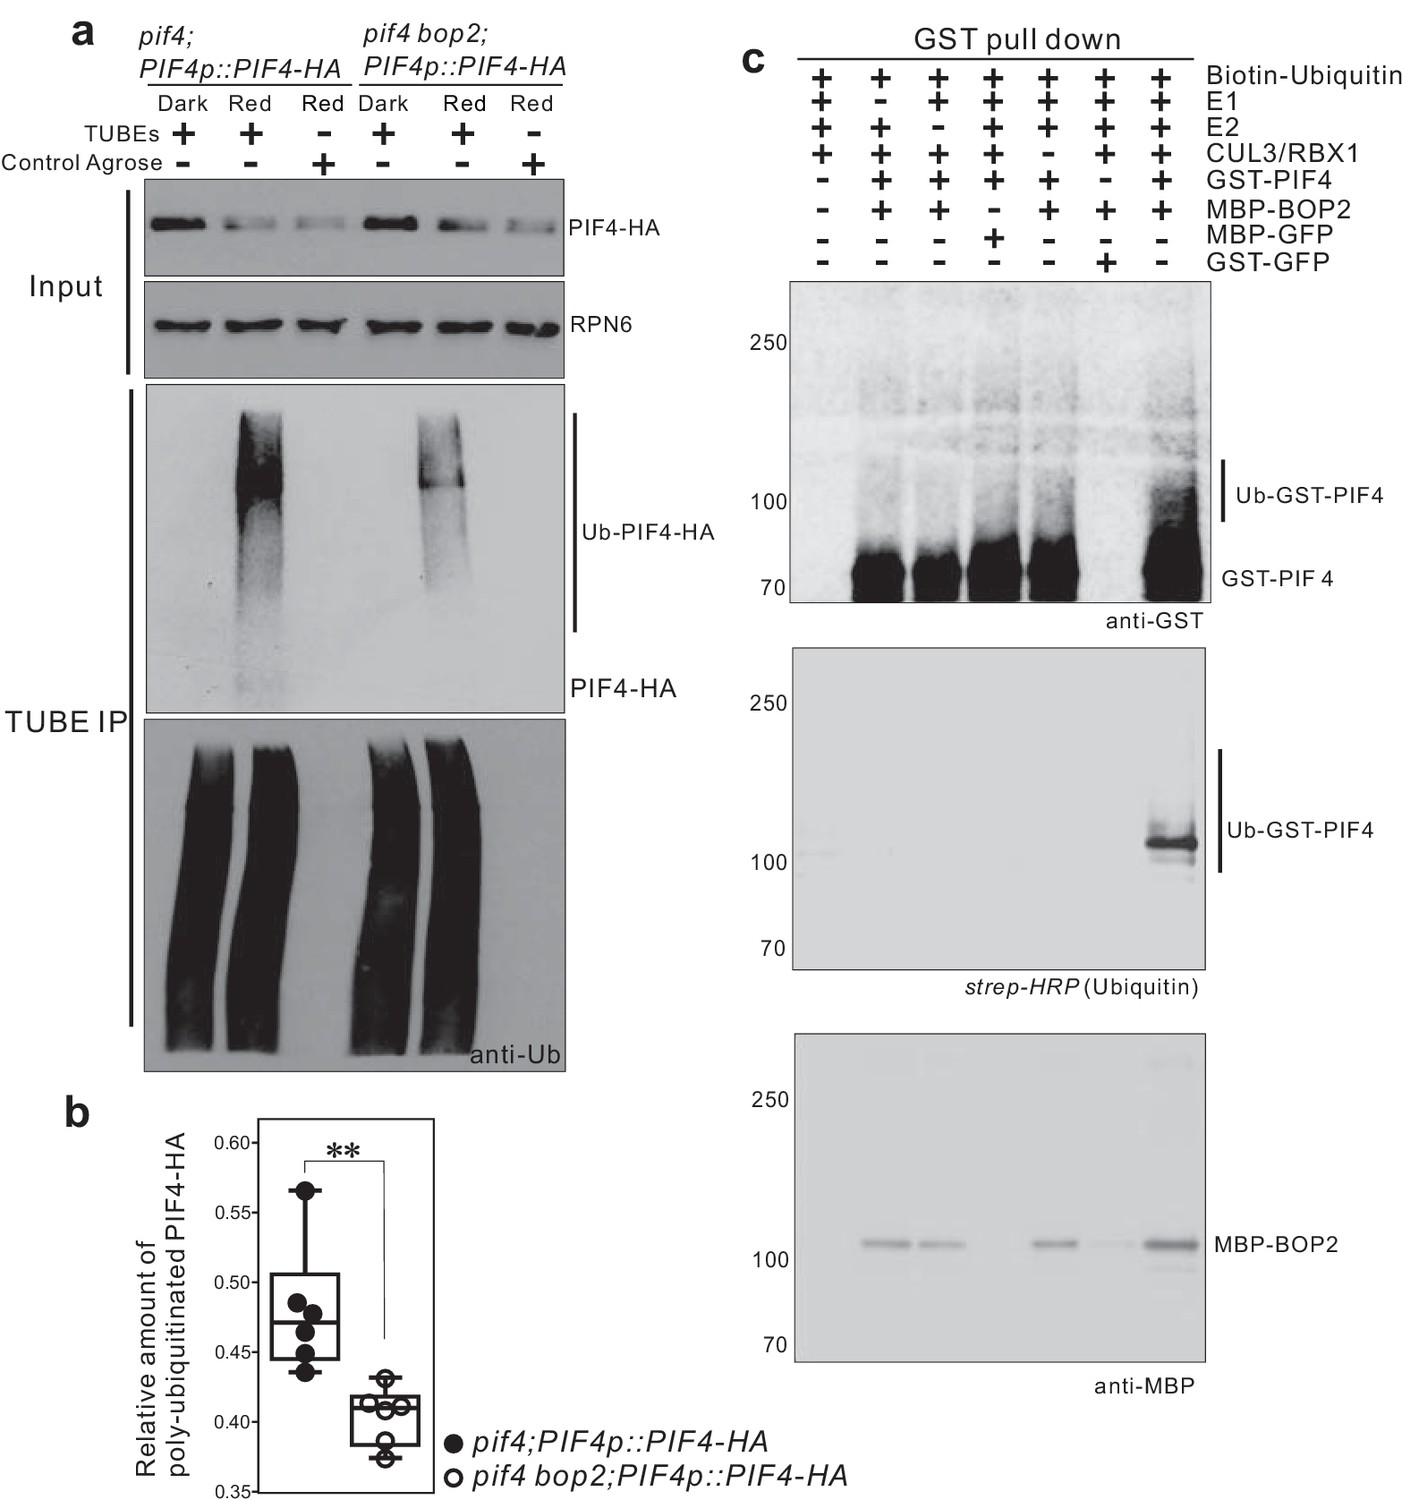
CUL3-BOP complex mediates the polyubiquitination of PIF4.
(a) TUBEs (tandem ubiquitin binding entities) assays of ubiquitinated proteins in dark and red light treated pif4;PIF4p::PIF4-HA and pif4bop2;PIF4p::PIF4-HA seedlings. 3-day-old dark-grown seedlings were irradiated with 6 μmol·m−2·s−1 red light for 2 min followed by 8 min in the dark before harvesting. Total ubiquitinated proteins from dark and red light treated samples were immunoprecipitated with argrose-TUBE2, then analyzed by western blotting with anti-HA antibodies for detection PIF4-HA and anti-ubiquitin antibodies as loading controls. Control agarose that were not TUBEs conjugated were used as negative controls. Anti-RPN6 antibodies were used as loading controls for input samples. (b) Quantification of ubiquitinated PIF4-HA protein levels relative to total ubiquitinated proteins. Result is shown in a box-and-whiskers plot. Statistical significance was determined using the Student’s t test (two-sided) between pif4;PIF4p::PIF4-HA and pif4 bop2;PIF4p::PIF4-HA lines. Circles represent each measured sample from six independent experiments, **p<0.01. (c) In vitro ubiquitiniation assays. A Cullin3 E3 ubiquitin ligase complex was assembled with recombinant MBP-BOP2 and incubated with GST-PIF4. The reactions were then pulled down with Glutathione Sepharose 4B beads followed by Western blotting analysis using anti-GST and anti-MBP antibodies. Streptavidin-HRP were used for detection of biotin-labeled ubiquitinated protein. MBP-GFP and GST-GFP were used as negative controls.
-
Figure 5—source data 1
Quantification of ubiquitinated PIF4-HA protein levels relative to total ubiquitinated proteins from TUBEs assays.
- https://doi.org/10.7554/eLife.26759.014
Figure 5—figure supplement 1
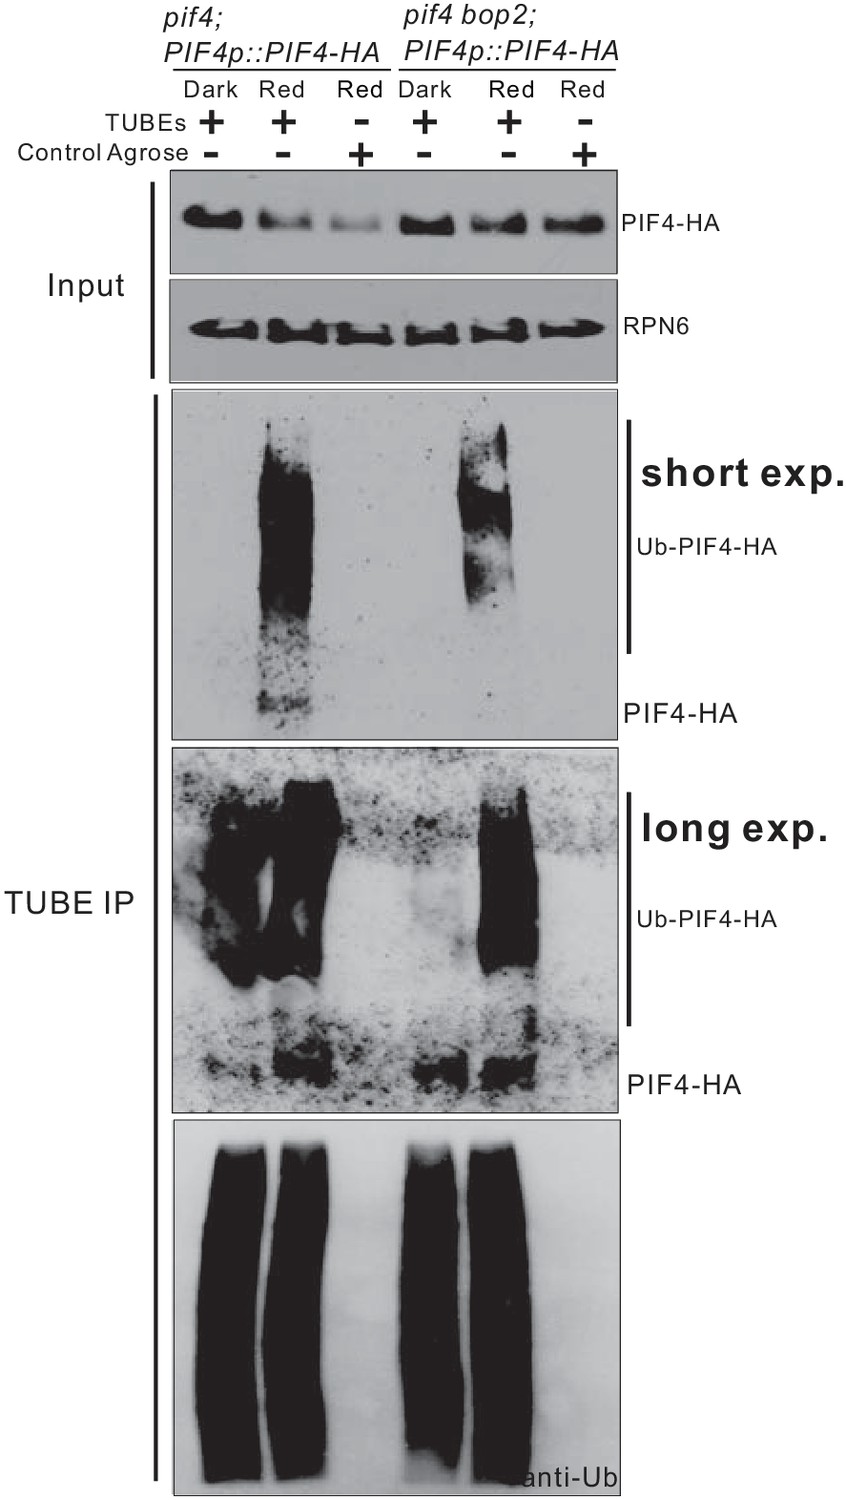
BOP2 mediates ubiquitination of PIF4-HA also in darkness.
3-day-old dark-grown pif4;PIF4p::PIF4-HA and pif4bop2;PIF4p::PIF4-HA seedlings were irradiated with 6 μmol·m−2·s−1 red light for 2 min followed by 8 min in the dark before harvesting. Total ubiquitinated proteins from dark and red light treated samples were immunoprecipitated with argrose-TUBE2, then analyzed by western blotting with anti-HA antibodies for detection PIF4-HA and anti-ubiquitin antibodies as loading controls. A longer exposure was included to detect polyubiquitination in the dark-grown seedlings. Control agarose that were not TUBEs conjugated were used as negative controls. Anti-RPN6 antibodies were used as loading controls for input samples.
Figure 6 with 2 supplements
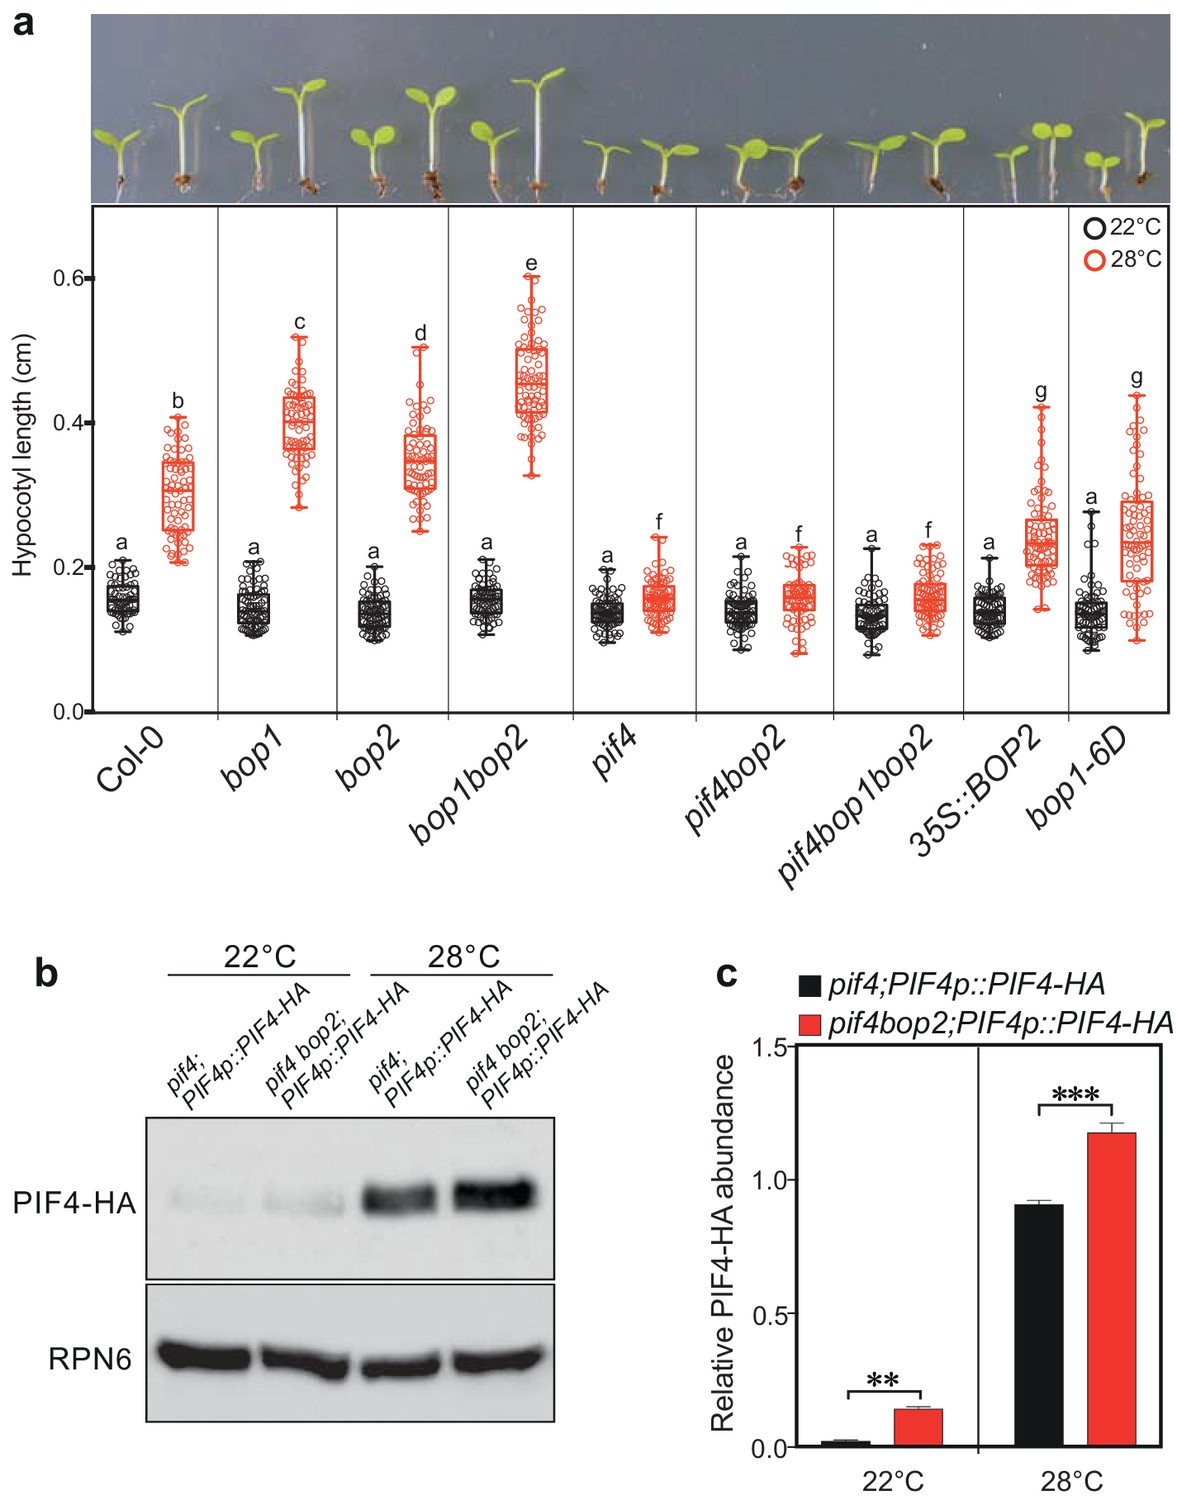
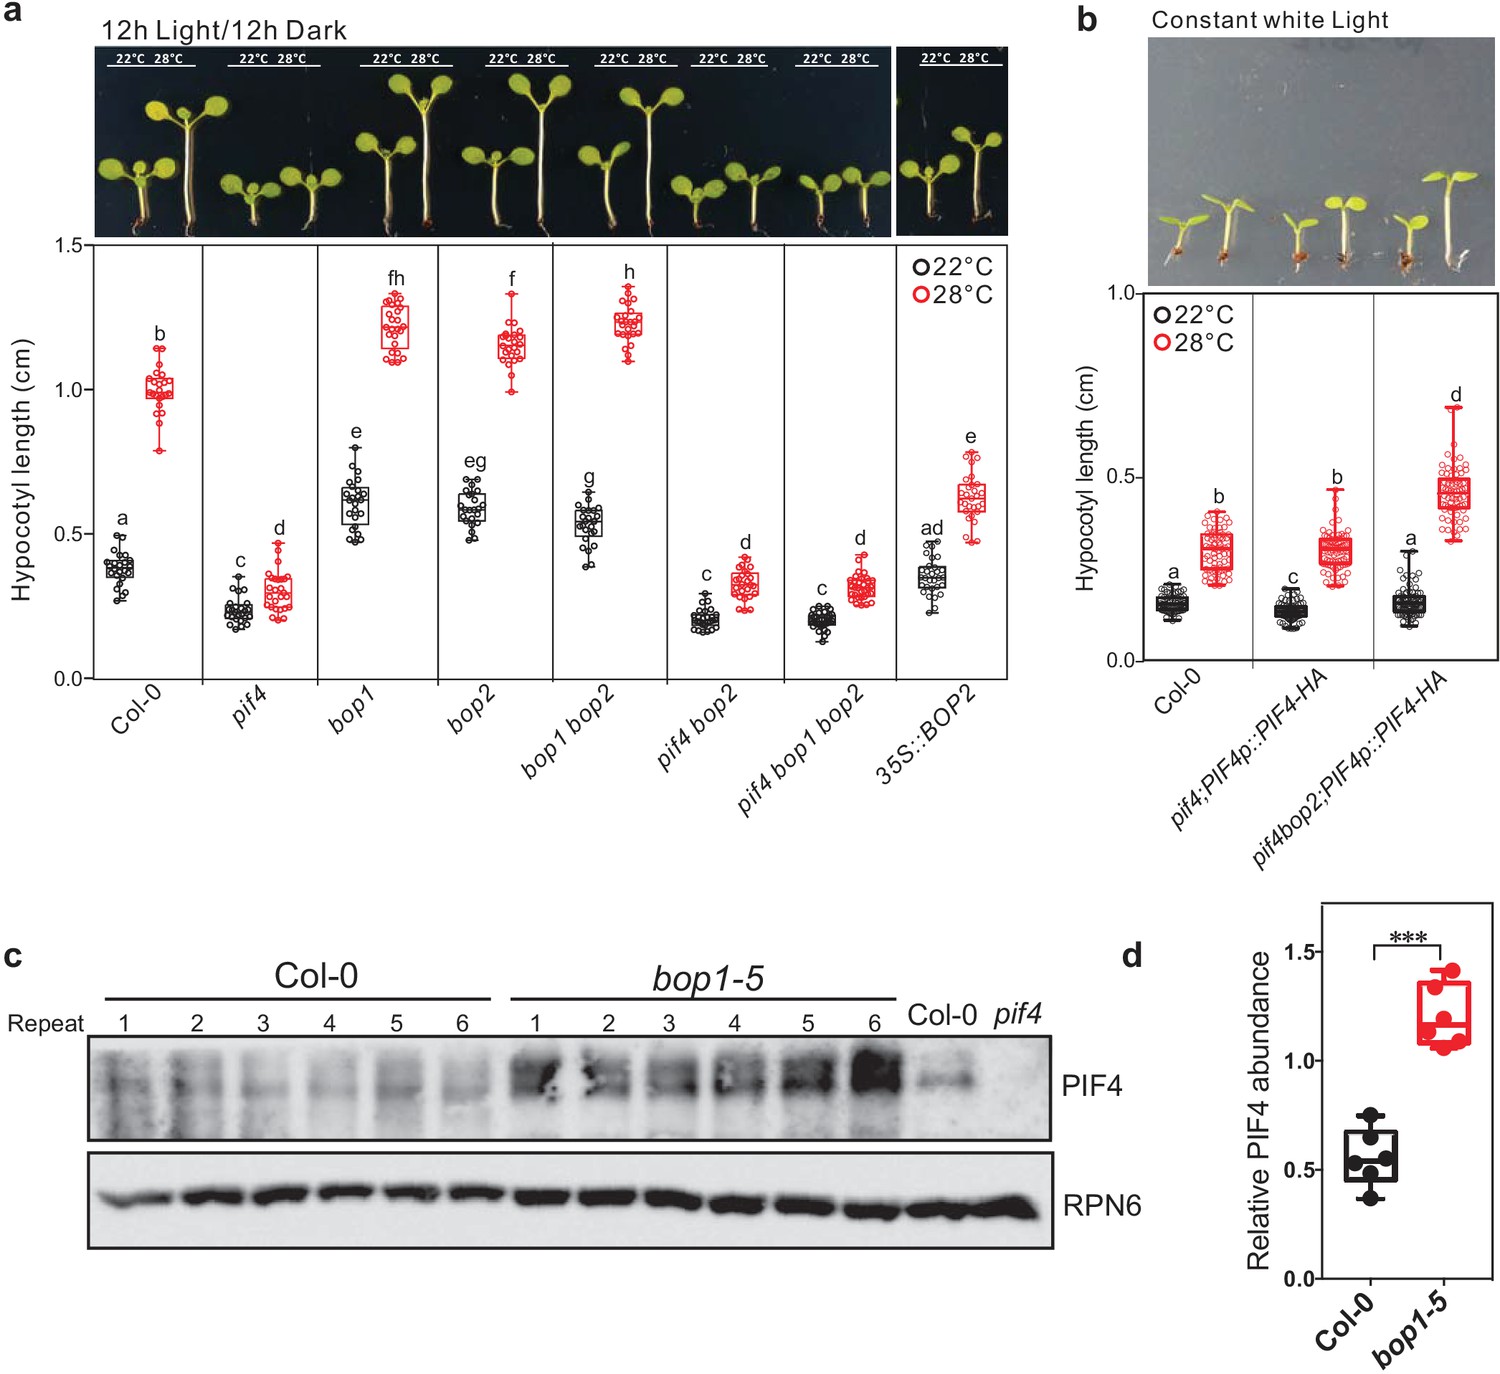
BOP2 modulates the PIF4 abundance in temperature response.
(a) Hypocotyl lengths of indicated seedlings in response to the temperature of 28°C. Seedlings were grown firstly at 22°C in constant white light for 4 days then transferred to 28°C or kept in 22°C for another 4 days. The upper panel shows the hypocotyl length phenotypes of indicated lines. The lower panel shows a box-and-whiskers plot of the data. Multiple comparison was performed in a post ANOVA Fisher’s test and lines that do not share any letters are significantly different from each other. Circles represent each measured individual, n > 60, p<0.01. (b) Western blot of 6-day-old seedlings in response to high temperature using an anti-HA antibody for detection of PIF4-HA and anti-RPN6 antibody as loading control. Seedlings of pif4;PIF4p::PIF4-HA and pif4bop2;PIF4p::PIF4-HA were firstly grown in constant white light at 22°C for 4 days, then transferred to 28°C or kept at 22°C for another 2 days. (c) Quantification of PIF4-HA protein levels relative to RPN6 of the samples from (b). Statistical significance was determined using the Student’s t test (two-sided). Quantitative data in (d) and (e) are shown as means ± s.e.m. n = 3, **p<0.01, ***p<0.001.
Figure 6—figure supplement 1
Hypocotyl lengths of indicated seedlings in response to different temperatures.
Hypocotyl lengths of indicated seedlings in response to the temperature of 28°C in 12 hr light/12 hr dark condition (a) and in constant white light (b). Seedlings were grown firstly at 22°C for 4 days then transferred to 28°C or kept in 22°C for another 4 days. The upper panel shows the hypocotyl length of indicated lines. The lower panel shows a box-and-whiskers plot of the data. Multiple comparison was performed in a post ANOVA Fisher’s test and lines that do not share any letters are significantly different from each other. Circles represent each measured individual. Error bars represent s.d. n > 20 in (a), n > 60 in (b), p<0.01. (c) Western blot of 8-day-old seedlings of Col-0 and bop1-5 grown at 22°C from (a) using PIF4 antibody (Agrisera) and anti-RPN6 antibody as loading control. (d) Quantification of PIF4 protein levels relative to RPN6 of the samples from (c). Result is shown in a box-and-whiskers plot. Statistical significance was determined using the Student’s t test (two-sided) between Col-0 and bop1-5. Circles represent each measured sample from six biological replicates, ***p<0.001.
Figure 6—figure supplement 2
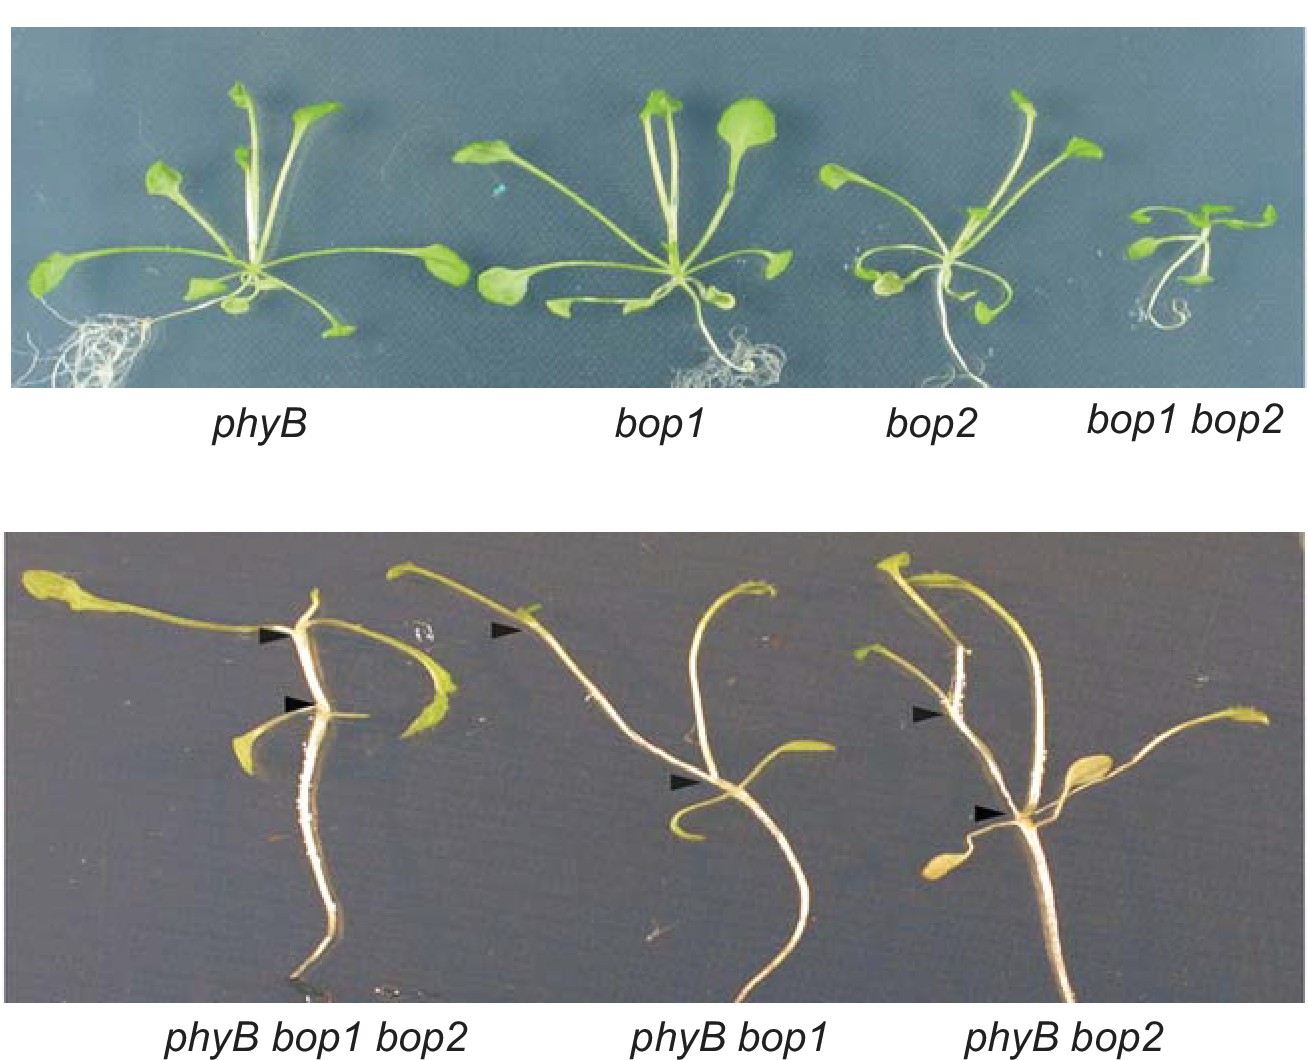
Genetic interactions between bop1, bop2 and phyB.
Plants were grown for 20 days in constant red light. The two arrow heads delimit one rosette internode.
Additional files
-
Supplementary file 1
All primer sequences used in this study.
- https://doi.org/10.7554/eLife.26759.018
-
Transparent reporting form
- https://doi.org/10.7554/eLife.26759.019
Download links
A two-part list of links to download the article, or parts of the article, in various formats.
Downloads (link to download the article as PDF)
Open citations (links to open the citations from this article in various online reference manager services)
Cite this article (links to download the citations from this article in formats compatible with various reference manager tools)
BLADE-ON-PETIOLE proteins act in an E3 ubiquitin ligase complex to regulate PHYTOCHROME INTERACTING FACTOR 4 abundance
eLife 6:e26759.
https://doi.org/10.7554/eLife.26759


