ATP sensing in living plant cells reveals tissue gradients and stress dynamics of energy physiology
- University of Bonn, Germany
- University of Udine, Italy
- University of Hong Kong, China
- Politecnico di Milano, Italy
- University of Oxford, United Kingdom
- University of Tübingen, Germany
- Aarhus University, Denmark
- Chinese University of Hong Kong, China
- Forschungszentrum Jülich, Germany
- Università degli Studi di Milano, Italy
Figures
Figure 1 with 4 supplements
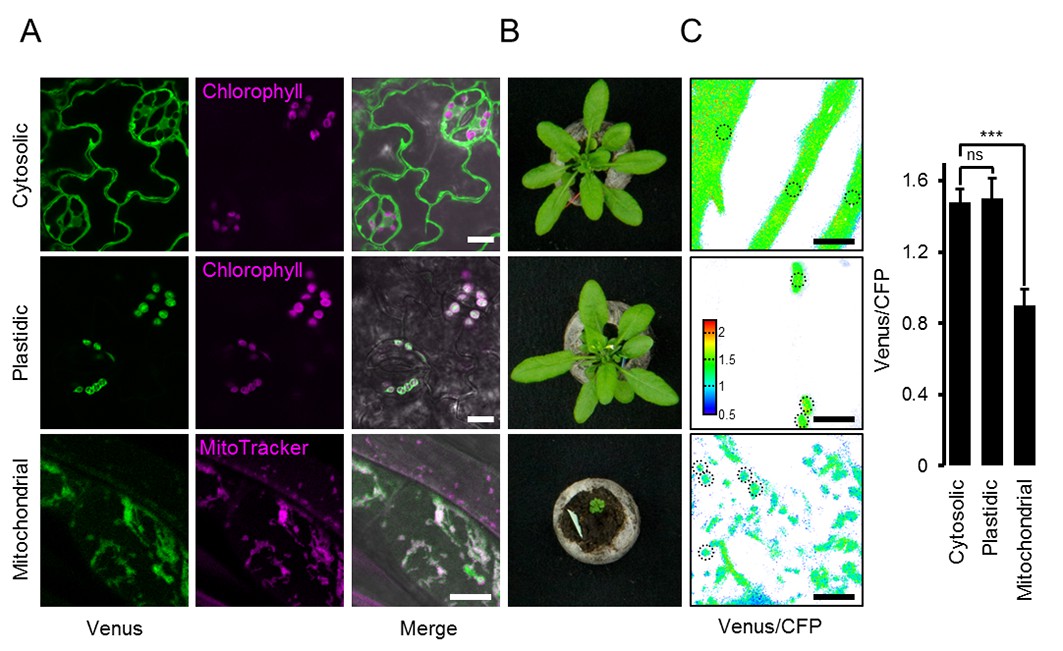
ATeam expression in stable Arabidopsis lines.
ATeam1.03-nD/nA was expressed under the control of a 35S promoter as unfused protein for localisation in the cytosol, as a fusion with the transketolase target peptide (TkTp) for plastid targeting or fused to the Nicotiana plumbaginifolia β-ATPase for mitochondrial targeting. (A) Five-day-old seedlings grown vertically on half-strength MS +1% (w/v) sucrose medium plates were used for CLSM. Venus (green) fluorescence was recorded alongside the chlorophyll fluorescence in cotelydon cells or the mitochondrial marker MitoTracker Orange in cells of the hypocotyl. The merge image shows both fluorescence channels projected on the respective bright field image. (B) Phenotypes of multiple independent lines per construct were compared and a representative image is shown after growth for five weeks on soil. (C) For a ratiometric analysis, fluorescence of Venus and CFP was assessed in hypocotyl cells of five-day-old seedlings grown as in (A) with power of the 458 nm laser set to 10% (cytosolic and plastidic) and 30% (mitochondrial) of maximal power. Regions of interest (ROIs) of similar size, indicated by dotted lines, were defined to calculate the Venus/CFP ratio shown in the graph. n = 36 (cytosol/plastid) or 105 (mitochondria) ROIs in 12 (cytosol/plastid) or 22 (mitochondria) images from 4 (cytosol/plastid) or 6 (mitochondria) individual plants; error bars = SD. ns: p>0.05, ***p≤0.001 (t test). Scale bar (all panels) = 10 µm.
Figure 1—figure supplement 1
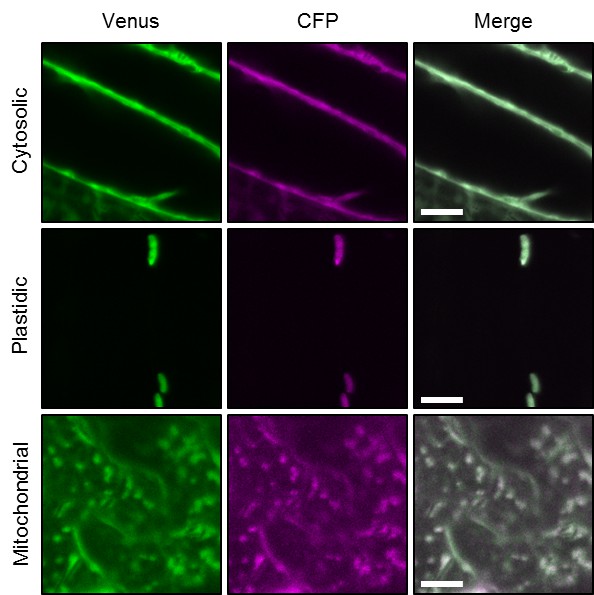
Ratiometric imaging of ATeam in cellular compartments of Arabidopsis seedlings.
Five-day-old seedlings grown vertically on half-strength MS +1% (w/v) sucrose were imaged by CLSM. Fluorescence of Venus (green) and CFP (magenta) was assessed in hypocotyl cells using the same settings except for power of the 458 nm laser, which was set to 10% of maximal power for the nuclear-cytosolic and plastidic and 30% for the mitochondrial line. Scale bar = 10 µm. The ratiometric analysis of the images is shown in Figure 1C.
Figure 1—figure supplement 2
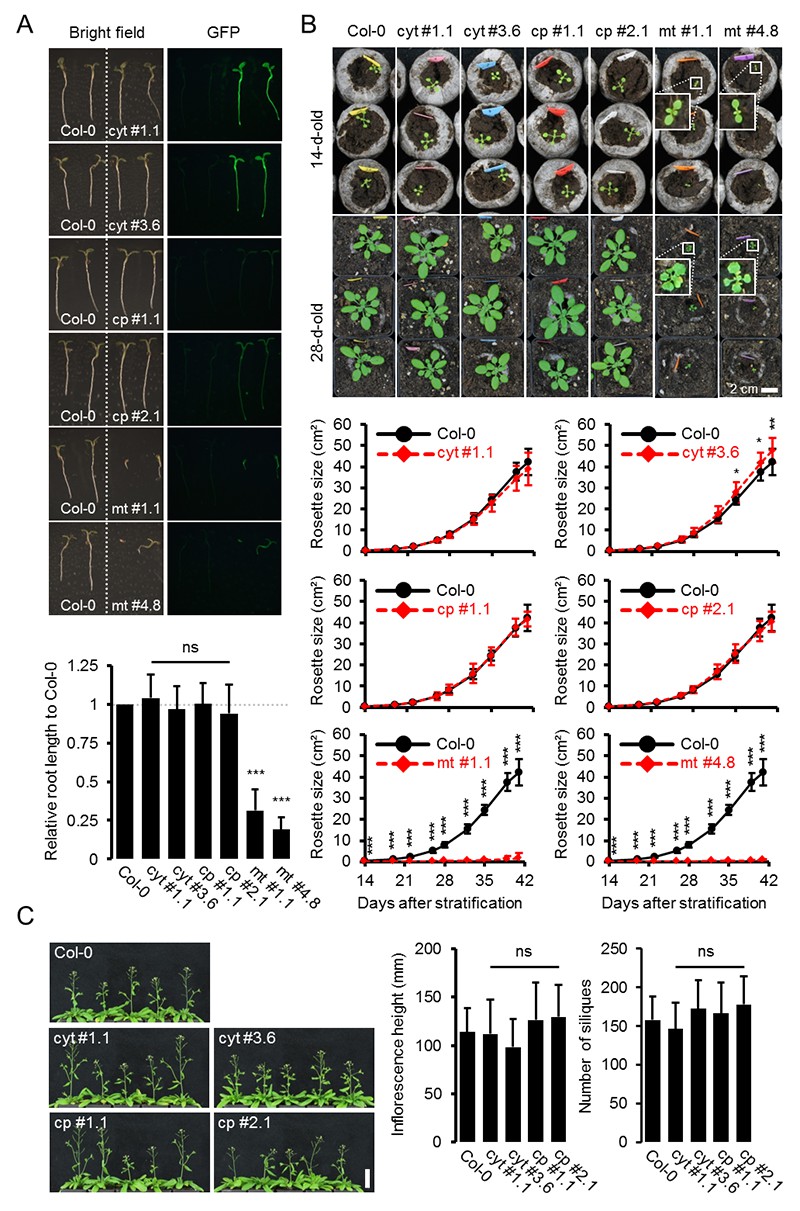
Whole plant phenotyping of homozygous ATeam lines.
(A) Plants homozygously expressing ATeam in the cytosol (cyt), plastids (cp) or mitochondria (mt) were grown vertically for 5 days on solidified half-strength MS medium side by side with wild-type Col-0. Fluorescence of plant material was checked with an epifluorescence microscope equipped with a GFP filter. Primary root length of 35 ATeam and 35 Col-0 plants per independent sensor line was quantified 5 days after stratification and statistical difference from Col-0 was tested with a one-way ANOVA followed by the Dunnett test. ns: p>0.05, ***p≤0.001; error bars = SD. (B) 20 (Col-0, cyt, cp) and 12 (mt) randomly selected plants shown in (A) were transferred to soil and grown in long-day growth chambers. Rosette development was documented photographically and the leaf rosette area was analysed until the majority of plants developed first open flowers. Growth curves for each sensor line are plotted against the same set of Col-0 plants and statistical differences were assessed for individual timepoints separately with a one-way ANOVA, followed by the Dunnett test. *p≤0.05, ***p≤0.001; error bars = SD. (C) Primary inflorescence height of 46-d-old plants was captured photographically and quantified. Siliques of 61-d-old plants were manually counted. n = 20; error bars = SD; ns: p>0.05 (one-way ANOVA with Dunnett test to compare sensor lines with Col-0). Scale bar = 50 mm. Plants expressing mitochondrial ATeam did not bolt until day 61 and were therefore not included in the analysis.
Figure 1—figure supplement 3
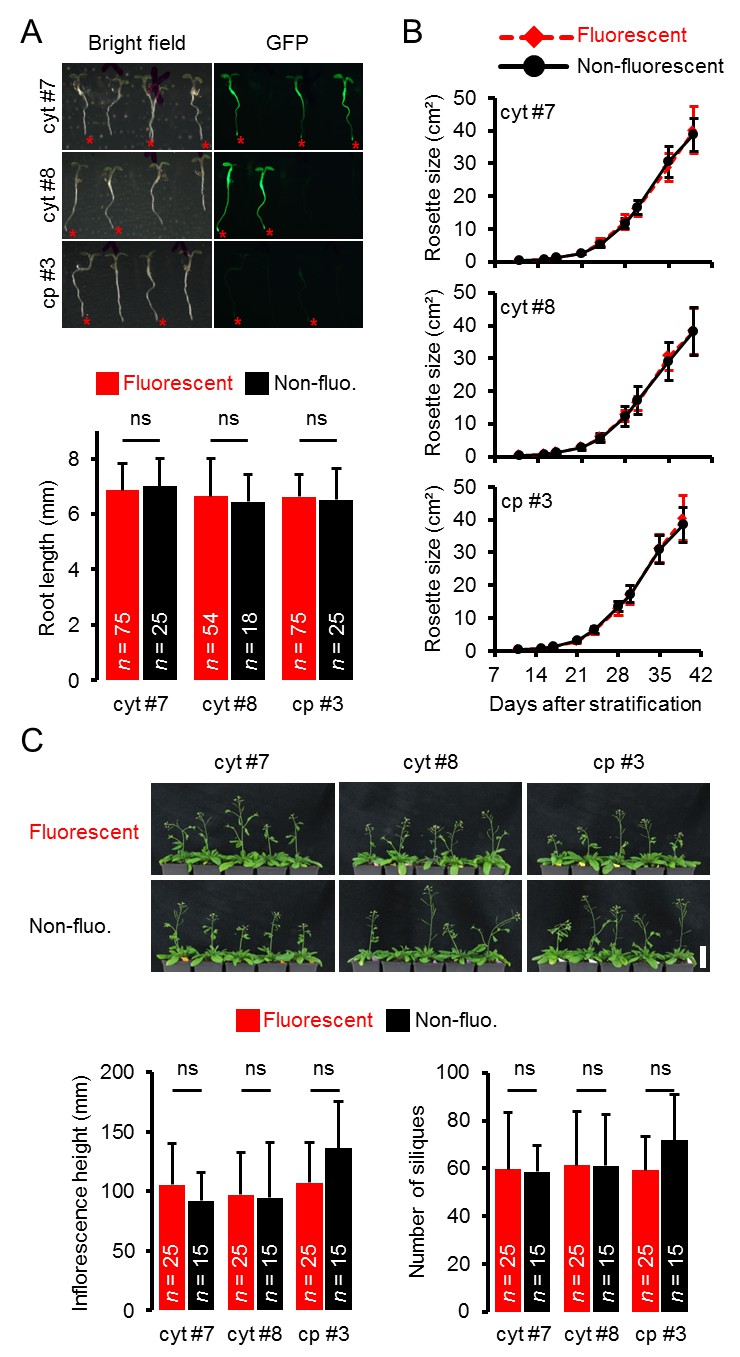
Whole plant phenotyping of heterozygous ATeam lines.
(A) Plants heterozygously expressing ATeam in the cytosol (cyt) or plastids (cp) were grown vertically for 5 days on solidified half-strength MS medium. Fluorescence of plant material was checked with an epifluorescence microscope equipped with a GFP filter. Fluorescent individuals are marked by a red asterisk. Primary root length of fluorescent and non-fluorescent plants in a 3:1 ratio was quantified 4 days after stratification and statistical difference was tested with a one-way ANOVA followed by the Tukey test. ns: p>0.05; error bars = SD. (B) 25 fluorescent and 15 non-fluorescent plants per independent line were randomly selected, transferred to soil and grown in long-day growth chambers. Rosette development was documented photographically and the leaf rosette area was analysed until the majority of plants developed first open flowers. Growth curves of fluorescent and non-fluorescent individual are plotted for each line and no statistical differences at any time point were found with a one-way ANOVA, followed by the Tukey test. (C) Primary inflorescence height of 43-d-old plants was captured photographically and quantified. Siliques of 56-d-old plants were manually counted. ns: p>0.05 (one-way ANOVA with Tukey test); error bars = SD. Scale bar = 50 mm. Plants expressing mitochondrial ATeam did not bolt until day 56 and were therefore not included in the analysis.
Figure 1—figure supplement 4

Phenotyping of Arabidopsis expressing mitochondrial sensor proteins.
Plants homozygously expressing mitochondrial ATeam, YC3.6 and roGFP2-Grx1 (n = 5 for each independent line) constitutively under a CaMV 35S promoter were grown vertically for 5 days on solidified half-strength MS medium, transferred to soil and grown under long-day conditions. Total rosette size was quantified 35 days after stratification and compared with the same set of wild-type Col-0 plants as shown in Figure 1—figure supplement 2 (n = 20). Three representative plants of each line were selected for the shown lower photograph 46 days after stratification which was additionally used to quantify the rosette area (lower graph). Statistical difference from Col-0 was tested with a one-way ANOVA followed by the Dunnett test. **p≤0.01, ***p≤0.001; error bars = SD. Scale bar = 5 cm.
Figure 2 with 1 supplement
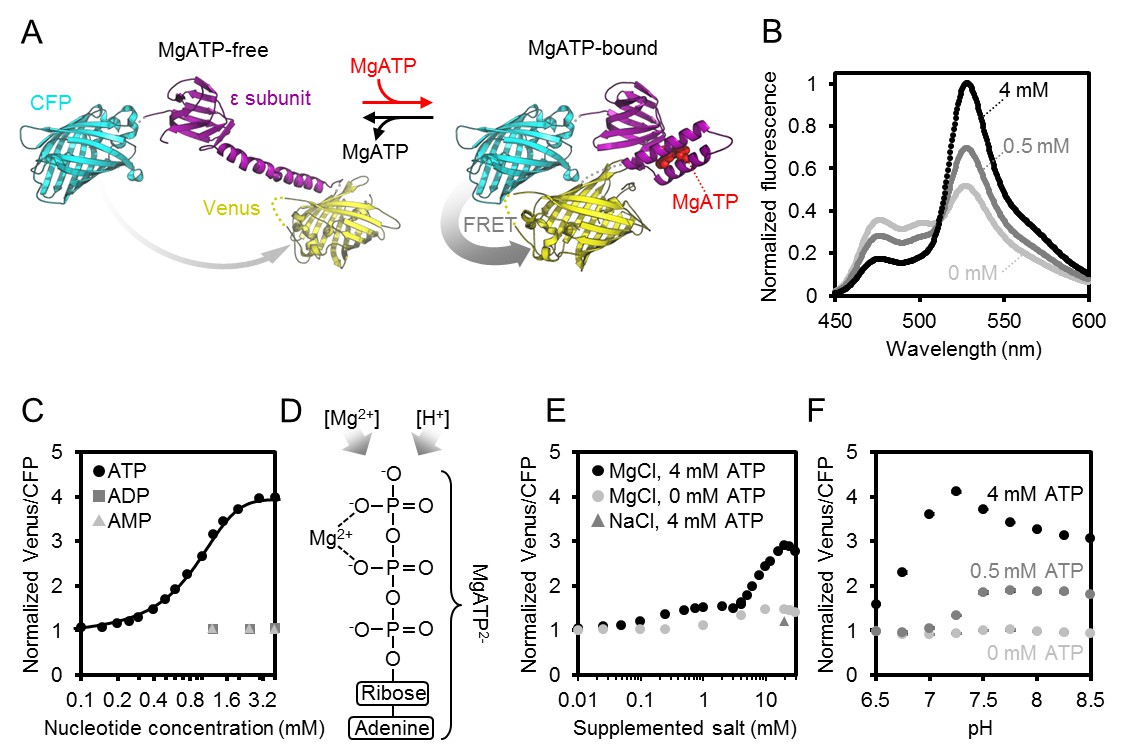
Characteristics of purified ATeam1.03-nD/nA.
(A) A cyan fluorescent protein (CFP, PDB: 2WSN) and a variant of the yellow fluorescent protein (Venus, PDB: 3EKJ) were manually linked by the ε-subunit of Bacillus subtilis ATP synthase in the MgATP2--bound (PDB: 2E5Y) and MgATP2--free (PDB: 4XD7) state to generate a hypothetical structural model of ATeam. FRET efficiency in the absence or presence of MgATP2- is indicated by a grey arrow. (B) Normalised ATeam emission spectra (excitation at 435 ± 5 nm) in the presence of increasing ATP concentrations and an excess in Mg2+ by 2 mM. (C) ATeam was excited at 435 ± 5 nm and the ratio of emission at 527 nm (cp173-Venus) and 475 nm (mseCFP) at 25°C in the presence of adenine nucleotides is plotted. The Boltzmann function was used to fit MgATP2--binding data. (D) Structure of MgATP2-. Its stability depends on pH and on the free Mg2+ concentration. (E) ATeam Venus/CFP ratios in 4 mM ATP (black points) and 0 mM ATP (grey points) titrated with increasing concentrations of MgCl2. The grey triangle shows the Venus/CFP ratio in the presence of 4 mM ATP and 20 mM NaCl. (F) ATeam Venus/CFP ratios at different pH and in the presence of 0 (light grey), 0.5 (dark grey) and 4 mM (black) MgATP. Data in (B), (C) and (F) is averaged from four technical replicates and error bars are represented as SD, but too small to be displayed.
Figure 2—figure supplement 1

Characteristics of purified ATeam1.03-nD/nA.
(A) Freshly purified ATeam was stored for one day (1d) or one week (1w) at temperatures between −86°C and 37°C. The dynamic range (DR) of stored protein represents the ratio of Venus/CFP at zero and saturating ATP (4 mM in the presence of Mg2+ in excess) and was normalised to freshly purified protein. n (technical replicates) = 4; error bars = SD. Protein degradation in these samples was analysed by SDS-PAGE. The expected molecular mass of intact 6×His-ATeam1.03-nD/nA is 70.1 kDa. (B) Fluorescence emission intensity (excitation at 435 ± 5 nm) of the individual fluorescent proteins mseCFP and cp173-Venus at variable pH and 0 or 4 (saturating) mM ATP. Data are averaged from four technical replicates and error bars represent SD but are too small to be displayed.
Figure 3
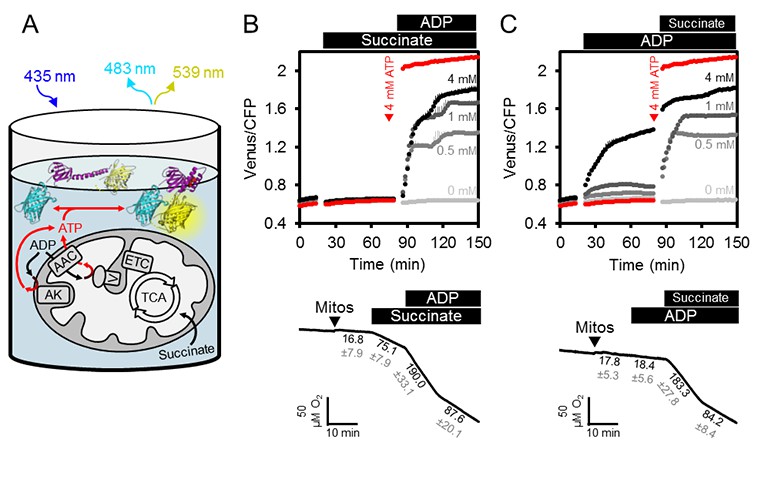
ATP fluxes in isolated Arabidopsis mitochondria.
(A) Pure intact mitochondria isolated from two-week-old Arabidopsis seedlings were mixed with basic incubation medium and purified ATeam in 96-well microtiter plates. Mitochondria were fed with succinate as a respiratory substrate to fuel the tricarboxylic acid (TCA) cycle and the electron transport chain (ETC). ATP, chemiosmotically generated by ATP synthase (complex V) in the matrix, is exchanged for ADP through the ADP/ATP carrier (AAC), while ATP generated by adenylate kinase (AK) in the intermembrane space does not require transport across the inner mitochondrial membrane. Extramitochondrial ATP exported from the mitochondria is sensed by ATeam in the medium as MgATP2-. (B, C) ATeam was used as shown in (A) and 10 mM succinate was added either before (B) or after (C) ADP at concentrations between 0 and 4 mM. ATP was added to 4 mM as reference at the indicated time point (red traces). n (technical replicates) = 4; error bars = SD. Lower panels show polarographic oxygen consumption assays performed with a Clark-type electrode in parallel. Mitochondria, succinate and ADP were added to the basic incubation medium as indicated. A representative trace from an individual experiment is shown and oxygen consumption rates (nmol min−1 mg−1 protein) for each respiratory state are given as mean ± SD from three technical replicates.
Figure 4
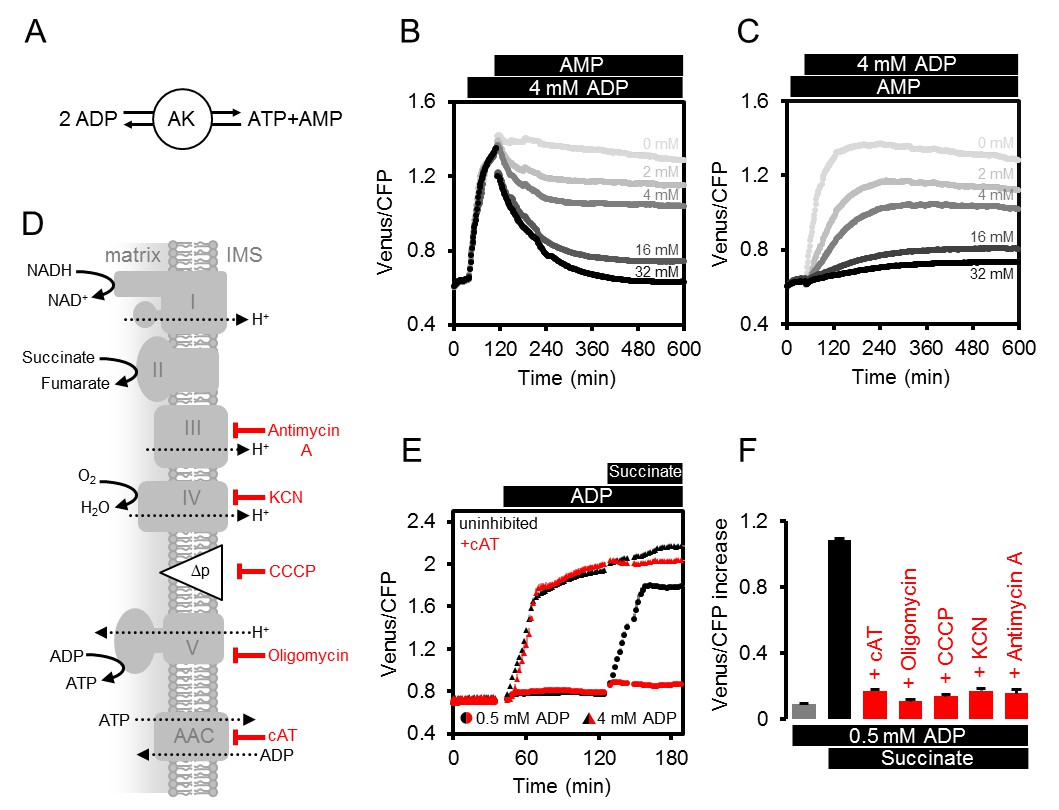
Modulating the ATP production in isolated Arabidopsis mitochondria.
(A) Reaction catalysed by adenylate kinase (AK). (B, C) ATeam was used in a setup as shown in Figure 3A. Isolated mitochondria and purified ATeam were mixed with AMP between 0 (light grey) and 32 (black) mM either after (B) or before (C) the addition of 4 mM ADP and the ATeam Venus/CFP ratio was recorded. n (technical replicates) = 4. (D) Representation of the mitochondrial electron transport chain (complexes I-IV) that generates a proton motive force (Δp) used by the ATP synthase (complex V) to produce ATP. The ADP/ATP carrier (AAC) transports ATP from the mitochondrial matrix to the intermembrane space (IMS) in exchange for ADP. Treatments that diminish mitochondrial ATP production or transport and their site of action are indicated. (E) Untreated mitochondria (black symbols) or mitochondria treated with 10 µM cAT (red symbols) were fed with ADP at 0.5 mM (circles) or 4 mM (triangles) followed by 10 mM succinate. (F) The inhibitory effect of treatments summarised in (F) on mitochondrial ATP production was calculated through the Venus/CFP increase after addition of ADP (grey), ADP and succinate (black) or ADP and succinate under inhibition (red). cAT, carboxyatractyloside; CCCP, carbonyl cyanide m-chlorophenyl hydrazone; KCN, potassium cyanide. E and F show the mean of three technical replicates; error bars = SD.
Figure 5 with 3 supplements
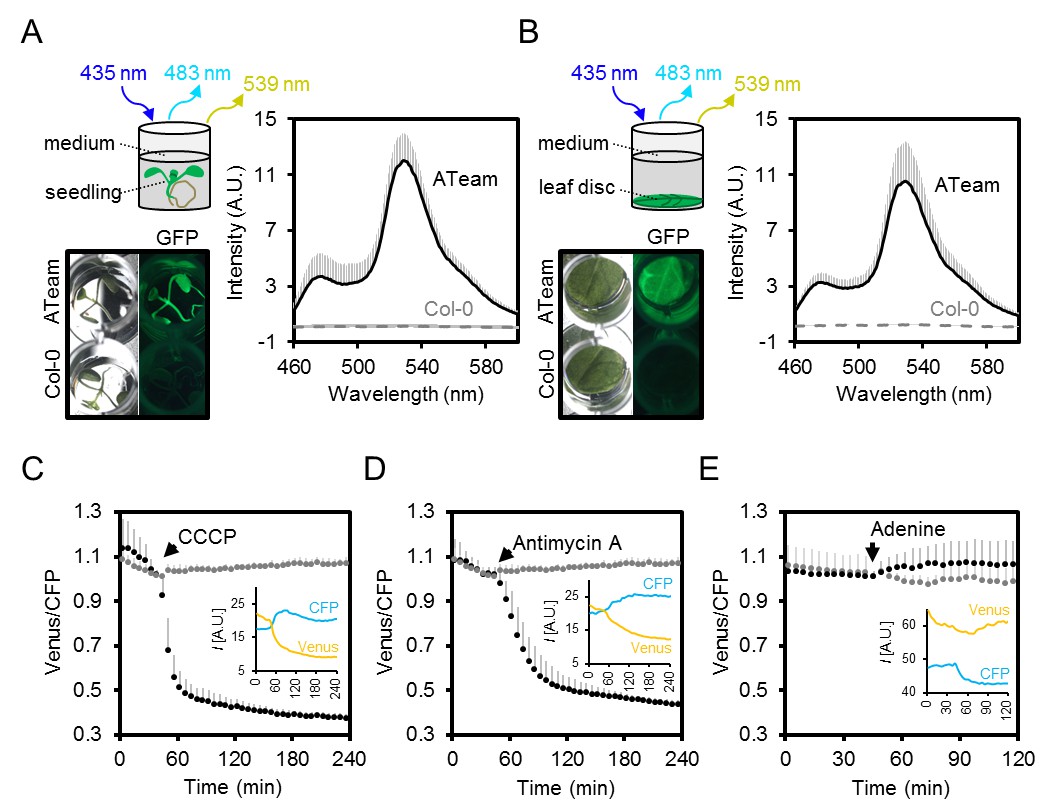
Fluorimetry setup to monitor MgATP2- dynamics in planta.
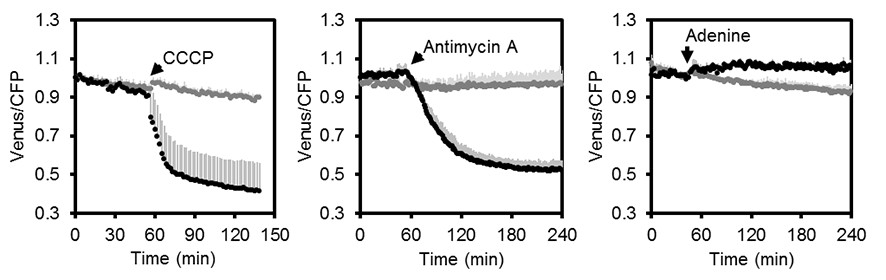
(A,B) Seven-day-old Arabidopsis seedlings (two per well; A) or leaf discs of individual four-week-old plants (B) were submerged in imaging medium on 96-well microtiter plates. Fluorescence of plant material stably expressing cytosolic ATeam was checked with an epifluorescence microscope equipped with a GFP filter and compared to wild-type Col-0. Fluorescence emission spectra between 460 and 600 nm were recorded using a plate reader and an excitation wavelength of 435 ± 10 nm. n = 5; error bars = SD. (C–E) Per well, two seven-day-old Arabidopsis seedlings expressing no sensor (Col-0) or cytosolic ATeam were excited at 435 ± 10 nm and the emission at 483 ± 9 nm (mseCFP) and 539 ± 6.5 nm (cp173-Venus) was recorded. CCCP (100 µM), antimycin A (100 µM) or adenine (10 mM) were added where indicated (black data points) while control plants were left untreated (grey data points). Emission in wells with Col-0 plants was averaged and subtracted from that of ATeam-expressing plants to correct for background fluorescence. Data shown and used for background subtraction is the average of 3–4 wells and error bars are SD. Insets show the fluorescence emission intensity (I) of Venus and CFP in representative individual wells.
Figure 5—figure supplement 1
Fluorometric readings of MgATP2- dynamics in Arabidopsis seedlings.
Independent repetition of experiments shown in Figure 5C–E. Per well, two seven-day-old Arabidopsis seedlings expressing no sensor (Col-0) or cytosolic ATeam were excited at 435 ± 10 nm and the emission at 483 ± 9 nm (mseCFP) and 539 ± 6.5 nm (cp173-Venus) was recorded. CCCP (100 µM), antimycin A (50 µM) or adenine (10 mM) were added where indicated (black data points) while control plants were left untreated (grey data points). Emission in wells with Col-0 plants was averaged and subtracted from that of ATeam-expressing plants to correct for background fluorescence. Data shown and used for background subtraction is the average of 3–4 wells and error bars are SD.
Figure 5—figure supplement 2
Impact of chlorophyll fluorescence on the ATeam signal.
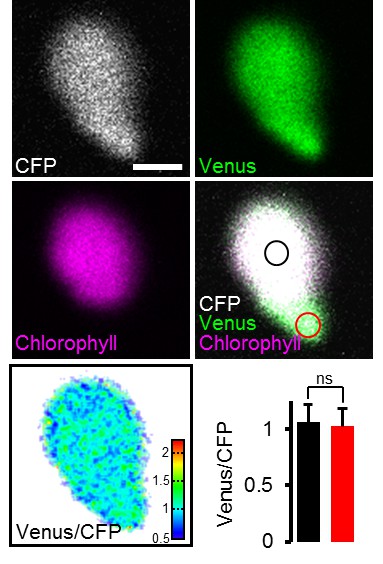
Hypocotyl of five-day-old Arabidopsis seedlings expressing plastidic ATeam-TkTp imaged by CLSM. Venus signal, green; chlorophyll fluorescence, magenta; CFP signal, white; Venus/CFP ratio, ratiometric false-color scale. Regions of interest were defined for chloroplast centers where chlorophyll signal was present (black circle) and stromules where no chlorophyll signal was detected (red circle). The bar graph shows Venus/CFP ratios for chloroplast centers (black) and stromules (red). n = 11 plastids from three individual plants; error bars = SD. ns: p>0.5 (t test). Scale bar = 2 µm.
Figure 5—figure supplement 3
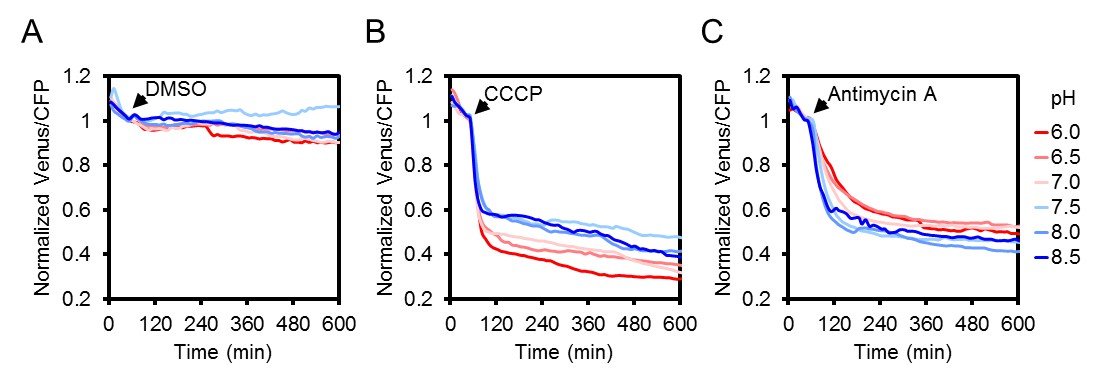
The effect of CCCP and antimycin A treatments on the ATeam response at different medium pH.
Two seven-day-old Arabidopsis seedlings per well, expressing no sensor (Col-0) or cytosolic ATeam were excited at 435 ± 10 nm and the emission at 483 ± 9 nm (mseCFP) and 539 ± 6.5 nm (cp173-Venus) was recorded in imaging medium at pH values between 6.0 (red) and 8.5 (blue). DMSO as a control (A), 100 µM CCCP (B) or 100 µM antimycin A (C) were added at indicated time points. Emission in wells with Col-0 plants was averaged and subtracted from that of ATeam-expressing plants to correct for background fluorescence. Data shown and used for background subtraction are the mean of three wells.
Figure 6 with 2 supplements
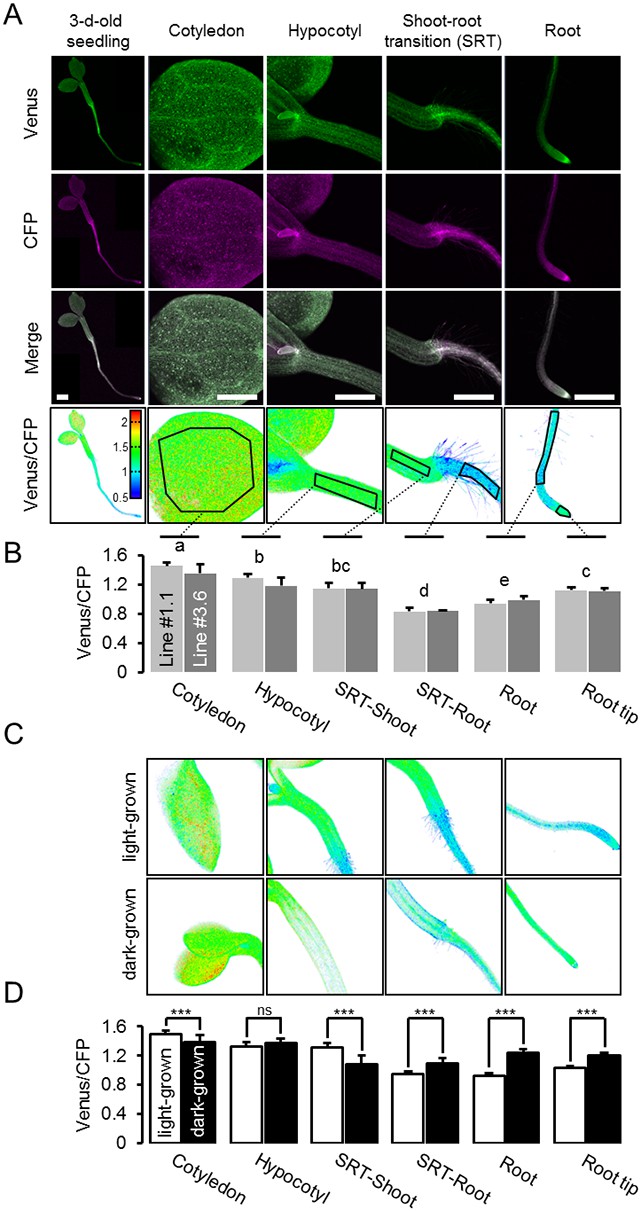
A MgATP2- map of the Arabidopsis seedling.
(A) To map the MgATP2- levels in tissues of Arabidopsis seedlings, three-day-old (whole seedling) or five-day-old (close-ups) plants expressing cytosolic ATeam were analysed by CLSM. Fluorescence of Venus (green) and CFP (magenta) was recorded and the ratio is plotted as a false-color image where high Venus/CFP values (red) correspond to high MgATP2- levels. In the close-ups, Venus/CFP ratios were analysed in the indicated regions of interest. Scale bar = 500 µm. (B) Graphs represent data from two independent lines. n (per line) = 6; error bars = SD. Data from both lines were pooled for a statistical analysis with a one-way ANOVA followed by the Tukey test (p≤0.05) and different letters indicate significant differences. The experiment was repeated two times with consistent results. (C, D) CLSM analysis of five-day-old seedlings either grown in the light or etiolated in the dark. SRT, shoot-root transition. n (seedlings per condition) = 11; error bars = SD. ns: p>0.05, ***p≤0.001 (two-way ANOVA followed by the Tukey test).
Figure 6—figure supplement 1

A MgATP2- map of the Arabidopsis seedling.
Independent repetition of experiments shown in Figure 6A,B. (A) Five-day-old Arabidopsis seedlings expressing cytosolic ATeam (line #1.1) were analysed by CLSM. Fluorescence of Venus (green) and CFP (magenta) was recorded, and the ratio is plotted as a false-color image where high Venus/CFP values (red) correspond to high ATP levels. Venus/CFP ratios were analysed in the indicated regions of interest. Scale bar = 200 µm. (B) Graphs represent data from 24 individual plants; error bars = SD. Different letters indicate significant differences in a one-way ANOVA followed by the Tukey test (p≤0.05).
Figure 6—figure supplement 2
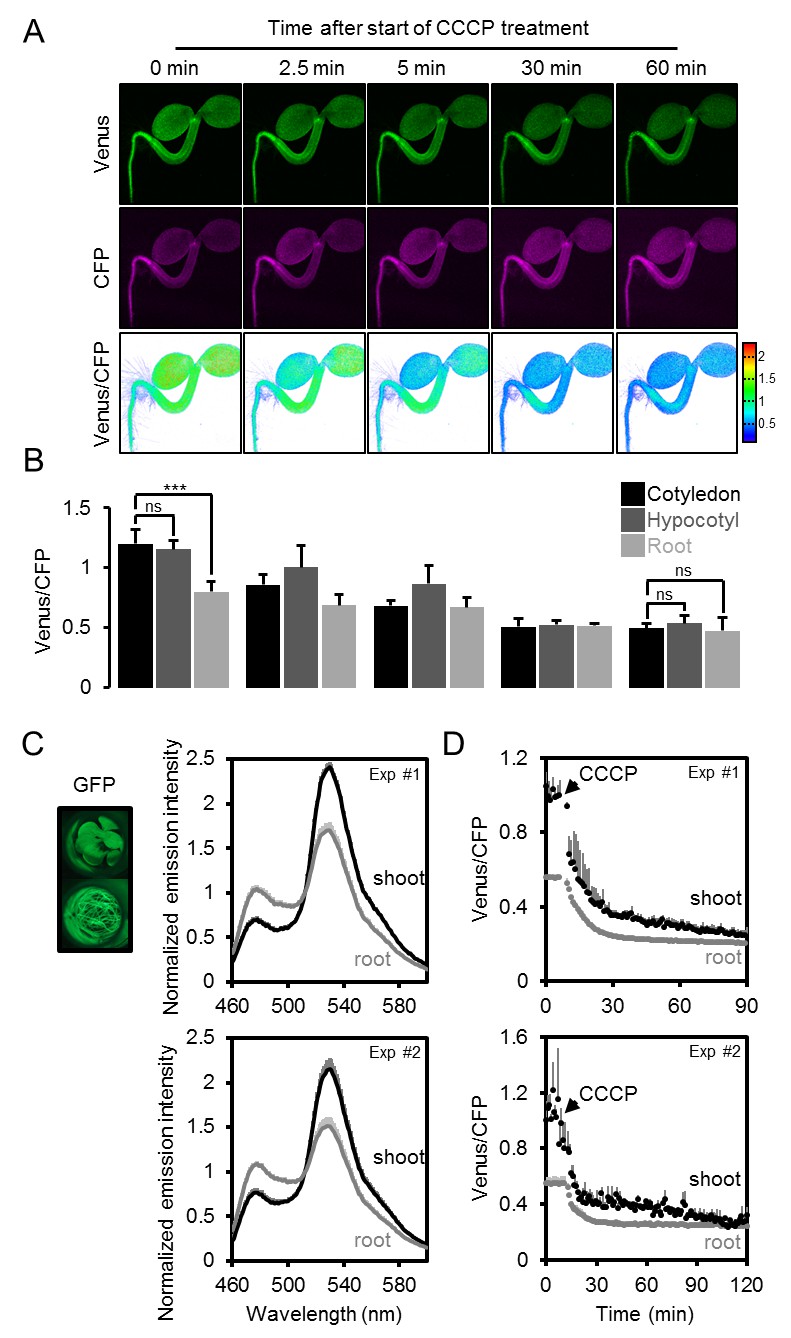
The effect of CCCP on the ATeam response in different Arabidopsis seedling tissues.
(A) Five-day-old Arabidopsis seedlings expressing cytosolic ATeam were immersed in 100 µM CCCP at pH 7.5 and analysed by CLSM. Fluorescence of Venus (green) and CFP (magenta) was recorded and the ratio is plotted as a false-color image where high Venus/CFP values (red) correspond to high MgATP2- levels. (B) Venus/CFP ratios at each time point after CCCP treatment were quantified in the cotyledons, hypocotyl and the upper root. n = 3 individual seedlings; error bars = SD. ns: p>0.05, ***p≤0.001 (two-way ANOVA followed by the Tukey test). (C) Ten-day-old seedlings expressing no sensor (Col-0) or cytosolic ATeam were cut with a scalpel to separate shoots and roots that were individually submerged in imaging medium on 96-well microtiter plates. Fluorescence of plant material was checked with an epifluorescence microscope equipped with a GFP filter. Fluorescence emission spectra between 460 and 600 nm were recorded using a plate reader and an excitation wavelength of 435 ± 10 nm. The graphs show spectra of plant parts expressing cytosolic ATeam after subtraction of Col-0 fluorescence in two independent experiments (Exp #1/2). n = 5 wells each; error bars = SD. (D) Shoots (pooled from three seedlings per well) and roots (pooled from 10 to 15 seedlings per well) were excited at 435 ± 10 nm and the emission at 483 ± 9 nm (mseCFP) and 539 ± 6.5 nm (cp173-Venus) was recorded. CCCP at 100 µM was added at the indicated time point and data were plotted after subtracting fluorescence of Col-0 plant parts that were equally treated. n = 5 and 3 wells per tissue type in independent experiment Exp #1 and Exp #2, respectively; error bars = SD.
Figure 7

Local MgATP2- heterogeneity in Arabidopsis seedling cells and tissues.
Fluorescence of Venus (green) and CFP (magenta) from cytosolic ATeam was recorded by CLSM in five-day-old Arabidopsis seedlings. The ratio is plotted as a false-color image where high Venus/CFP values (red) correspond to high MgATP2- levels. (A) Venus/CFP ratios were assessed in indicated regions of interest to compare guard cells and pavement cells of the cotyledon epidermis. n = 24 pairs of pavement and guard cell from five individual plants; error bars = SD. ns: p>0.05 (t test). Scale bar = 20 µm. (B) Venus/CFP ratios were assessed in indicated cell layers at the shoot–root transition. Region of interest analysis of successive cell layers is indicated in grey scale. n = 11; error bars = SD. Different letters indicate statistical differences in a one-way ANOVA followed by the Tukey test (p≤0.05). Scale bar = 100 µm. (C) Cotyledons were wounded with a needle and Venus/CFP ratios were assessed in the indicated regions of interest representing wounded or unwounded tissue. n = 5; error bars = SD, ***p≤0.001 (t test). Scale bar = 500 µm. (D) The Venus/CFP ratio was assessed in two regions of interest at the root tip. n = 12; error bars = SD, ***p≤0.001 (t test). Scale bar = 100 µm.
Figure 8

Light sheet fluorescence microscopy (LSFM) analysis of MgATP2- levels in growing root hair cells.
Hair cell growth on roots from six-day-old seedlings expressing cytosolic ATeam was followed for 10 min by LSFM. (A) Maximum projection of the Venus signal in the elongation and lower maturation zone generated from 4D in vivo imaging data of the growing Arabidopsis root. Scale bar = 100 µm. (B) Representative root area with hair cells in different developmental stages. Fluorescence of Venus (green) and CFP (magenta) was recorded and the ratio is plotted as false-color images over three time points. Scale bars = 100 µm. Five times magnified image sections exemplify (1) a slow-growing and (2) a fast-growing hair cell. (C) Hair cells in the top and bottom 20% quantile interval of growth speed and (D) the corresponding cytosolic ATeam FRET ratio measured in the tip of the same cells. n = 48 hair cells from six roots; error bars = SD, *p≤0.05, ***p≤0.001 (t test). (E) Growth speed of individual hair cells as function of their cytosolic ATeam FRET ratio. Values of the slowest and fastest growing cells as included in (C) and (D) are indicated in red and blue; line indicates linear regression. Significance of correlation, expressed as a p-value determined by an F test, and the coefficient of determination (R²) based on all data points are provided.
Figure 9
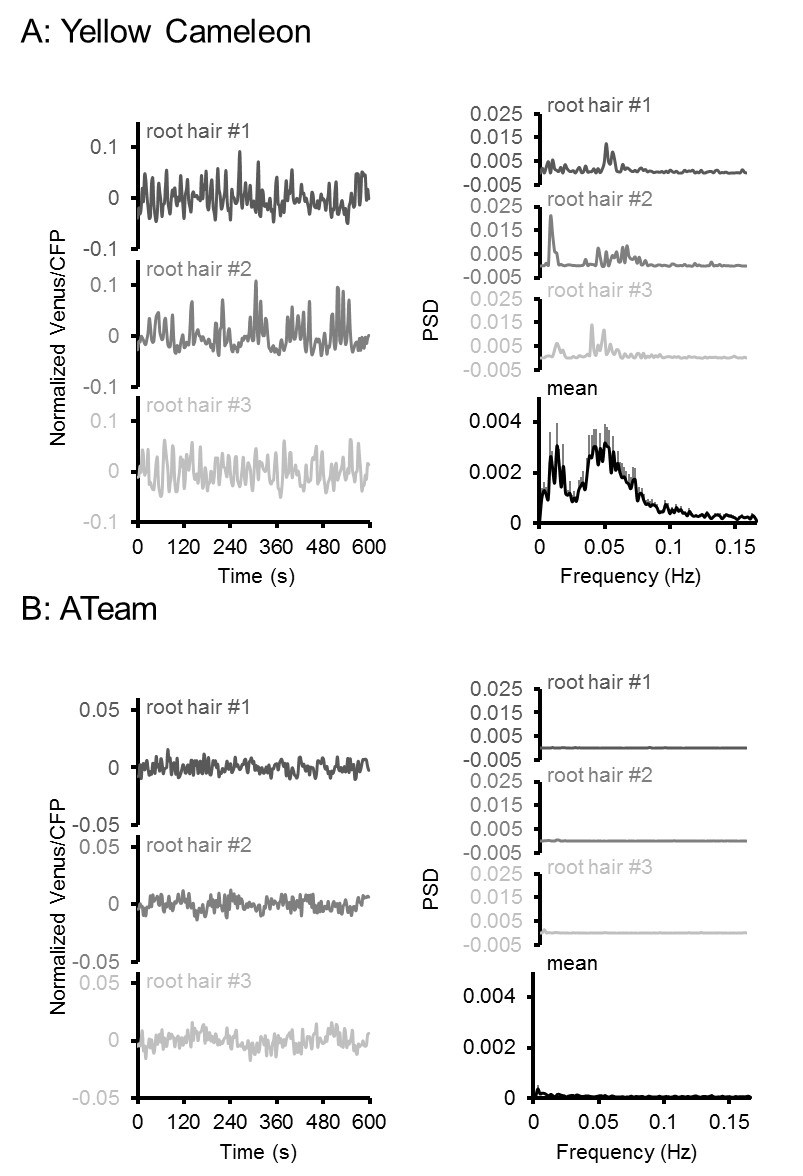
Oscillation analysis in root hair cells.
FRET analyses in root hair tips of six-day-old seedlings expressing (A) NES-Yellow Cameleon 3.6 and (B) cytosolic ATeam1.03-nD/nA by LSFM. Oscillations of three representative root hairs are shown as normalised Venus/CFP ratios and power spectral density (PSD) spectra by Fourier analysis. The mean PSD spectra represent 22 root hairs each. Error bars = SEM. Note the presence of typical Ca2+ oscillations around 0.05 Hz in the Cameleon dataset, which were absent in the ATeam dataset.
Figure 10 with 1 supplement
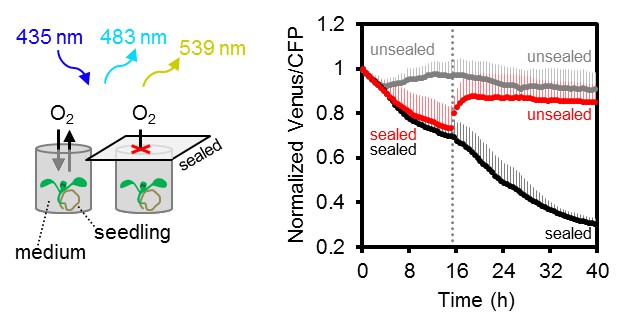
Arabidopsis MgATP2- dynamics under low oxygen.
Ten-day-old Arabidopsis seedlings, grown vertically on plates, were submerged in imaging medium on 96-well microtiter plates. Per well, three seedlings expressing no sensor (Col-0) or cytosolic ATeam were excited at 435 ± 10 nm, and the emission at 483 ± 9 nm (mseCFP) and 539 ± 6.5 nm (cp173-Venus) was recorded. Wells were either left open (grey), sealed with an oxygen-proof, transparent qPCR film (black) or sealed for 15.5 hr before the film was removed to reoxygenate the samples (red). Emission in wells with Col-0 plants was averaged and subtracted from that of ATeam-expressing plants to correct for background fluorescence. Data shown and used for background subtraction is the mean of 9–12 wells and error bars are SD.
Figure 10—figure supplement 1
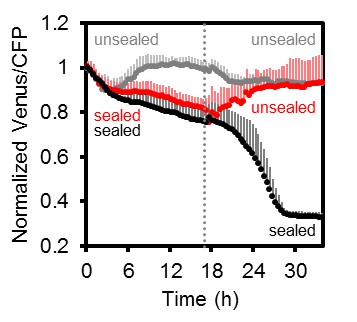
Arabidopsis MgATP2- dynamics under low oxygen.
Independent repetition of experiments shown in Figure 10 but using seven-day-old Arabidopsis seedlings, grown in hydroponic culture. Seedlings were submerged in imaging medium on 96-well microtiter plates. Per well, two seedlings expressing no sensor (Col-0) or cytosolic ATeam were excited at 435 ± 10 nm and the emission at 483 ± 9 nm (mseCFP) and 539 ± 6.5 nm (cp173-Venus) was recorded. Wells were either left open (grey), sealed with an oxygen-proof, transparent qPCR film (black) or sealed for 17.5 hr before the film was removed to reoxygenate the samples (red). Emission in wells with Col-0 plants was averaged and subtracted from that of ATeam-expressing plants to correct for background fluorescence. Data shown and used for background subtraction is the mean of 6–10 wells and error bars are SD.
Additional files
-
Supplementary file 1
Oligonucleotides for generation of expression constructs
- https://doi.org/10.7554/eLife.26770.023
Download links
A two-part list of links to download the article, or parts of the article, in various formats.
Downloads (link to download the article as PDF)
Open citations (links to open the citations from this article in various online reference manager services)
Cite this article (links to download the citations from this article in formats compatible with various reference manager tools)
ATP sensing in living plant cells reveals tissue gradients and stress dynamics of energy physiology
eLife 6:e26770.
https://doi.org/10.7554/eLife.26770


