Live calcium and mitochondrial imaging in the enteric nervous system of Parkinson patients and controls
- University of Leuven, Belgium
- University Hospitals Leuven, Belgium
Figures
Figure 1
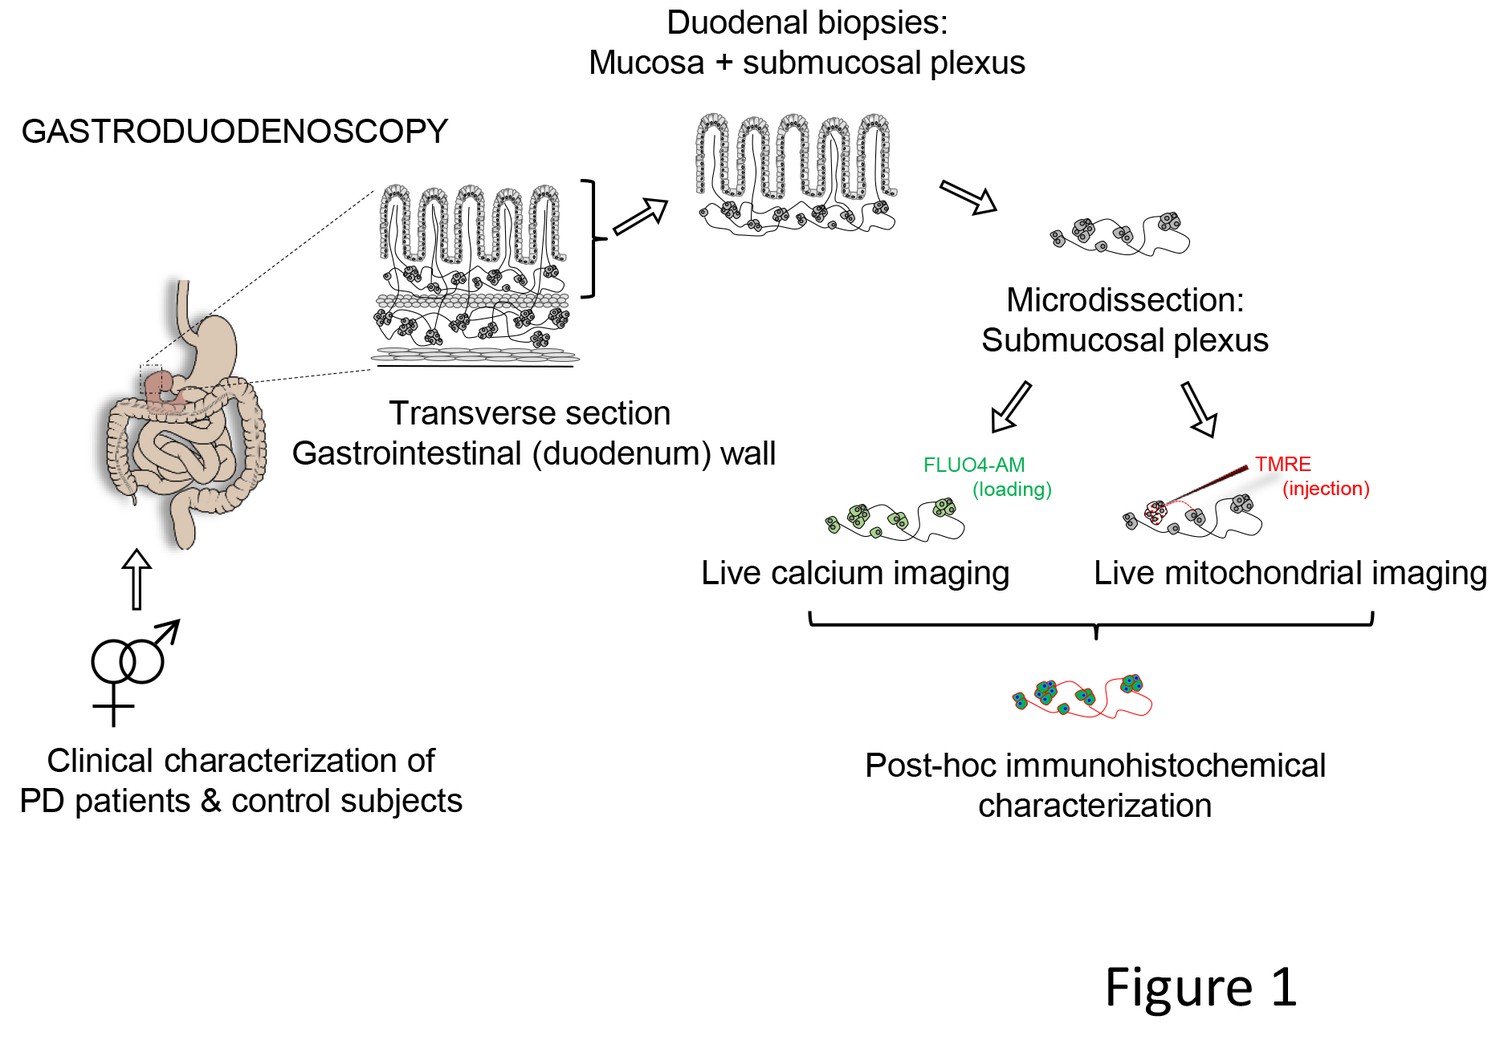
Schematic representation of the experimental strategy.
Gastroduodenoscopy was performed on clinically well-characterized PD patients and their healthy partners, and 8 biopsies of the duodenum were taken per subject. The submucous plexus was peeled away from the mucosal epithelium and was used for live imaging techniques (Ca2+ or mitochondrial imaging) followed by post-hoc immunohistochemistry for confirmation of neuronal identity. In addition, the submucous plexus was isolated from 3 fresh biopsies per subject and immediately processed for immunohistochemistry (without live imaging) and numbers of neurons and ganglia were counted per biopsy (not indicated in the schematic).
Figure 2
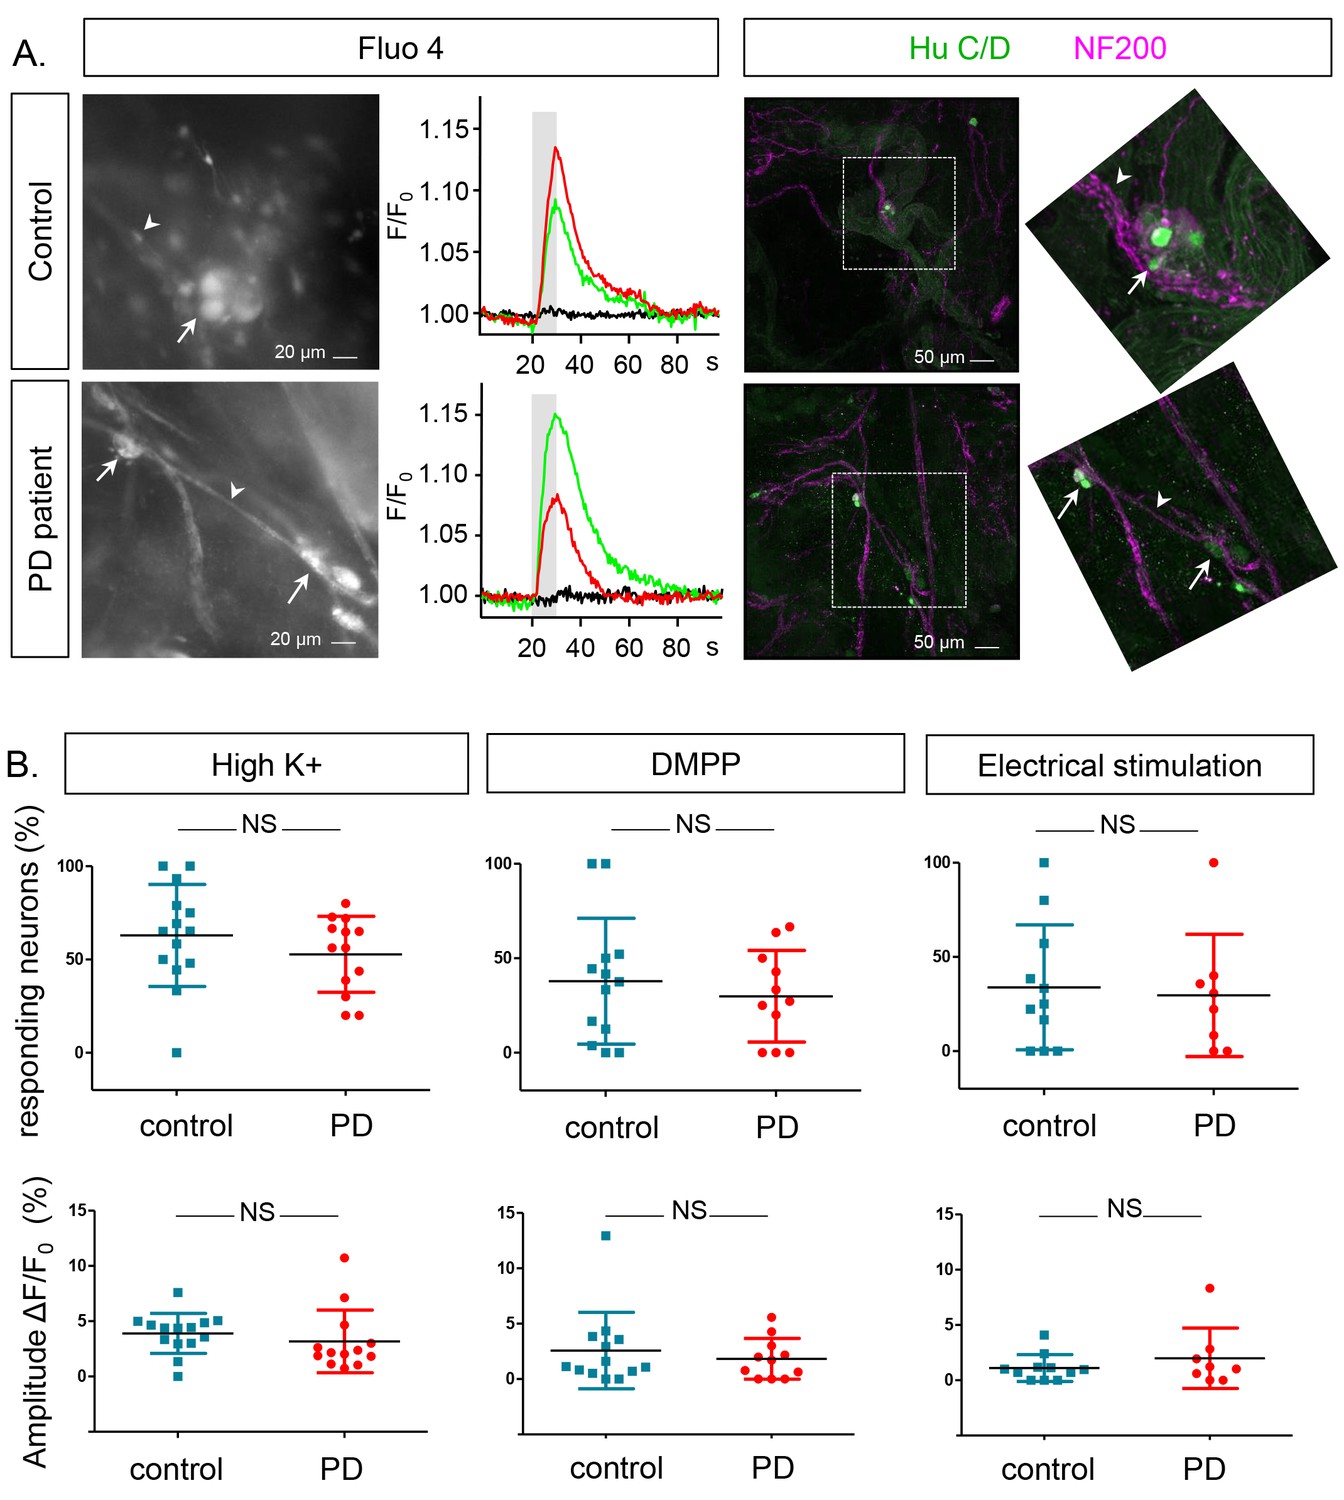
Ca2+signalling in submucous neurons in biopsies from PD patients and controls.
(A.) Representative examples calcium imaging (left) and posthoc immunohistochemical staining (right). A typical example of submucous ganglia (PD and control) loaded with Fluo-4 is shown (left) as well as typical Ca2+ traces (normalized to the fluorescence at time zero F/F0) of single submucous neurons depolarized with a high K+ stimulus (represented as grey bar). The green and red traces are 2 random examples, the black trace is the background value. The panels on the right show the correlated post-hoc immunostaining for enteric neuronal markers (Green: HuCD (neuronal cell bodies); Magenta: NF200 (intermediate neurofilament 200: neuronal fibers). The inset shows a magnification of the selected ganglion (dashed square). The arrow (neuronal cell bodies) and arrowheads (neuronal fibers) point to the same structures in both immunohistochemical and corresponding Fluo-4 images (left). (B.) Summary data plots showing the percentage of responding neurons (top row) and maximum peak amplitude ∆F/F0 (%) (bottom row) for high K+, DMPP and electrical stimulation. The individual data points represent a patient or control for which all individual neuronal responses were averaged. (NS, not significantly different, non-parametric Wilcoxon T-test; p-values: % of responders; High K+=0.23, DMPP = 0.88, ES = 0.99 | amplitudes: High K+=0.57, DMPP = 0.99, ES = 0.81).
-
Figure 2—source data 1
Calcium imaging % responders.
GraphPad file with the corresponding values and graphs of the % of responders from the calcium imaging for the different stimuli HighK+, DMPP and electrical field stimulation (panel B, top graphs).
- https://doi.org/10.7554/eLife.26850.005
-
Figure 2—source data 2
Calcium imaging amplitude.
GraphPad file with the corresponding values and graphs of the amplitude from the calcium imaging for the different stimuli HighK+, DMPP and electrical field stimulation. (panel B, lower graphs).
- https://doi.org/10.7554/eLife.26850.006
Figure 3 with 1 supplement
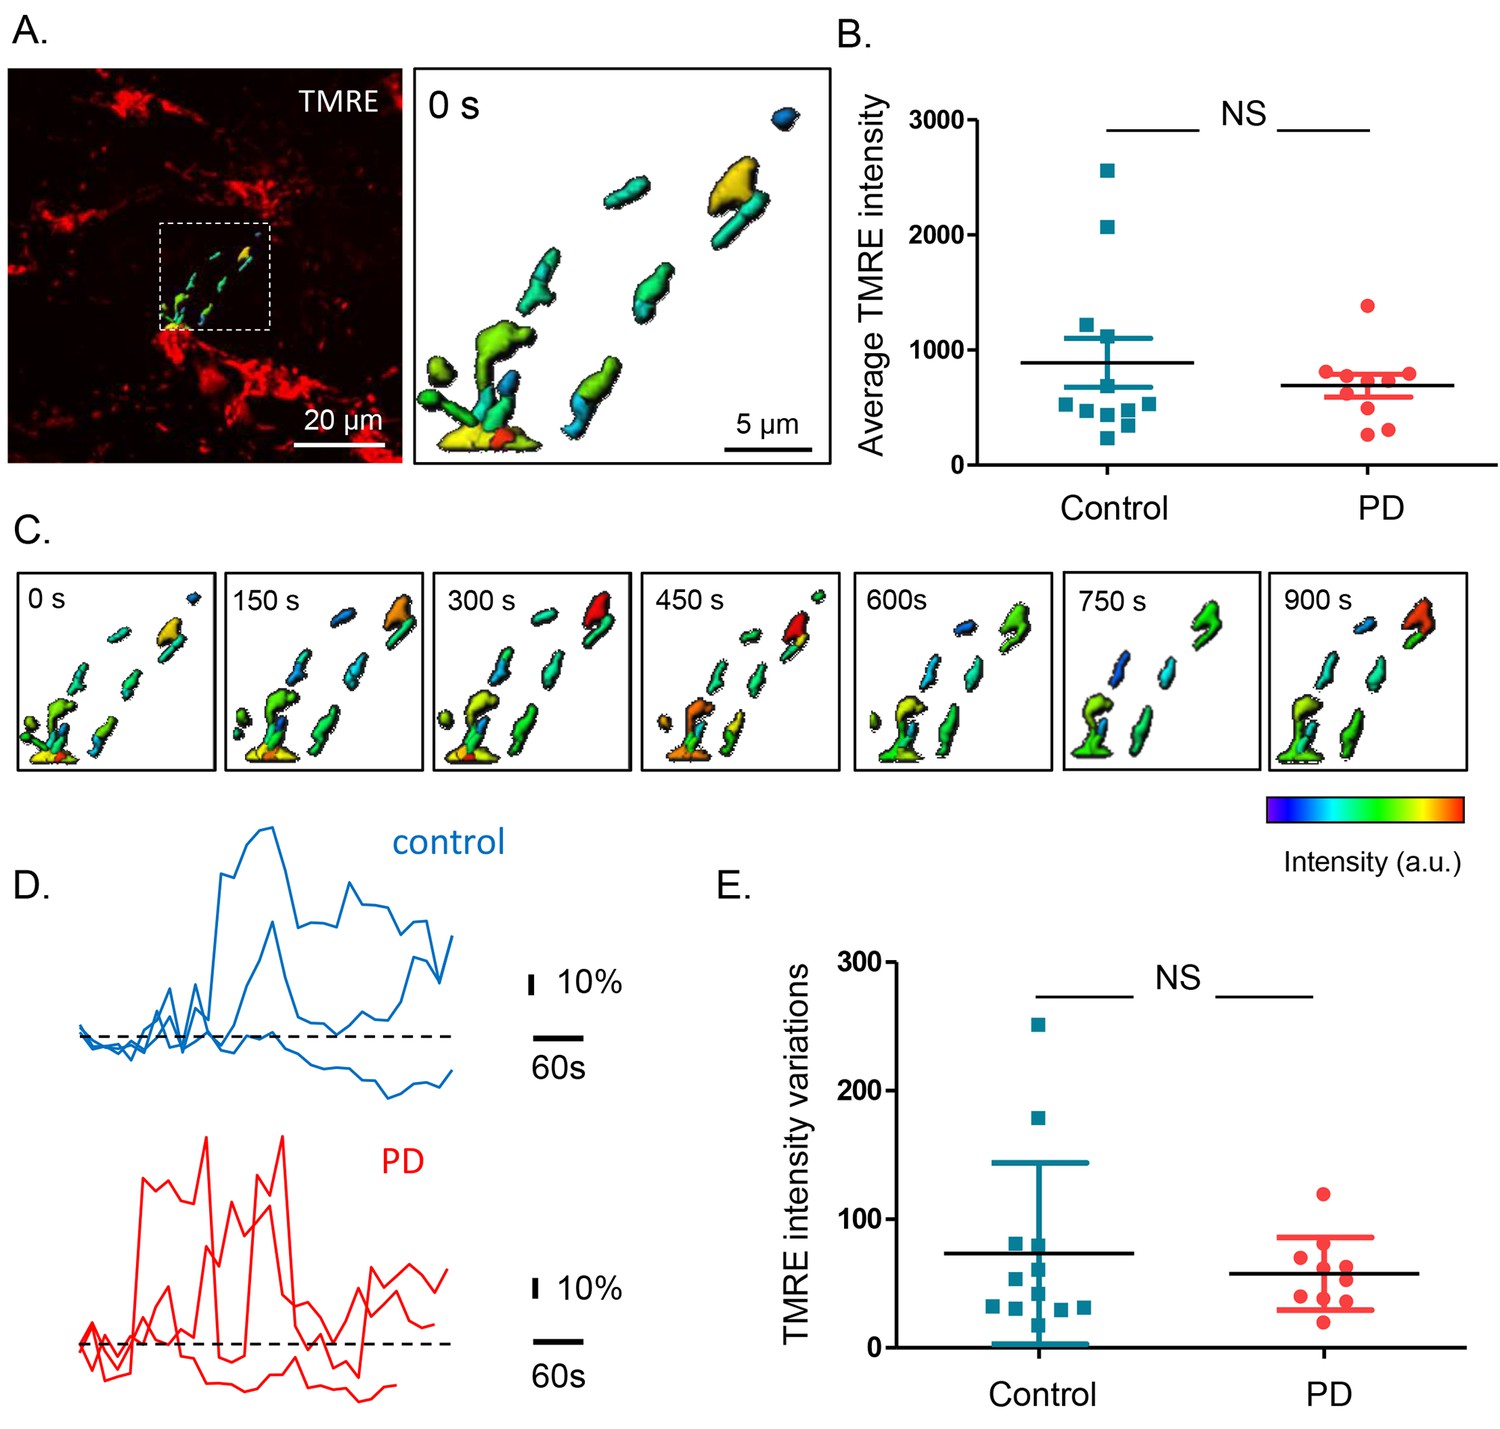
Mitochondrial membrane potential measurements in the submucous plexus of PD patients and controls.
(A.) Representative example of a TMRE injection in the submucous plexus of a control subject. A subset of mitochondria was selected to show the TMRE intensity differences (as color-coded) in individual mitochondria. (B.) Summary data plot of the TMRE intensity in mitochondria of patients and controls (NS, not significantly different, p-value=0.49 (non-parametric Wilcoxon T-test). (C.) Example of a time series (900 s) of color-coded TMRE intensity fluctuations in individual mitochondria (see selection in A.). (D.) Graphs showing TMRE intensity variations (%) over time of three individual mitochondria of control and PD patient, suggesting similar dynamics in patients and controls. (E.) Summary data plot of the average TMRE intensity fluctuations for controls and PD patients. (NS, not significantly different, p-value=0.99, non-parametric Wilcoxon T-test).
-
Figure 3—source data 1
Mitochondrial membrane potential measurements.
GraphPad file with the corresponding values and graphs of the mitochondrial membrane potential measurements (panel B and E).
- https://doi.org/10.7554/eLife.26850.012
Figure 3—figure supplement 1
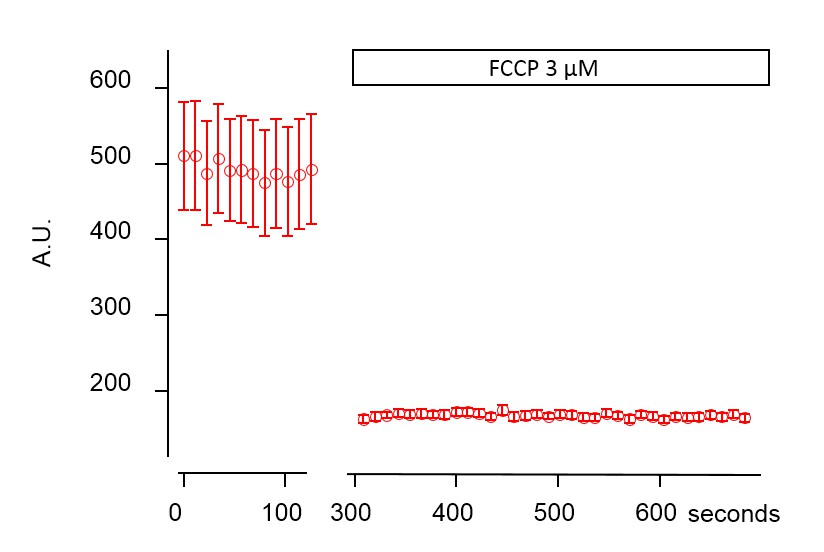
Mitochondrial TMRE destaining in the submucous plexus after addition of FCCP.
Representative graph showing the average intensity in arbitrary units (A.U.) of 16 mitochondria labeled with TMRE and imaged at 37°C before and after addition of 3 µM FCCP. The complete destaining in the presence of FCCP indicates that TMRE specifically labeled mitochondria.
Figure 4
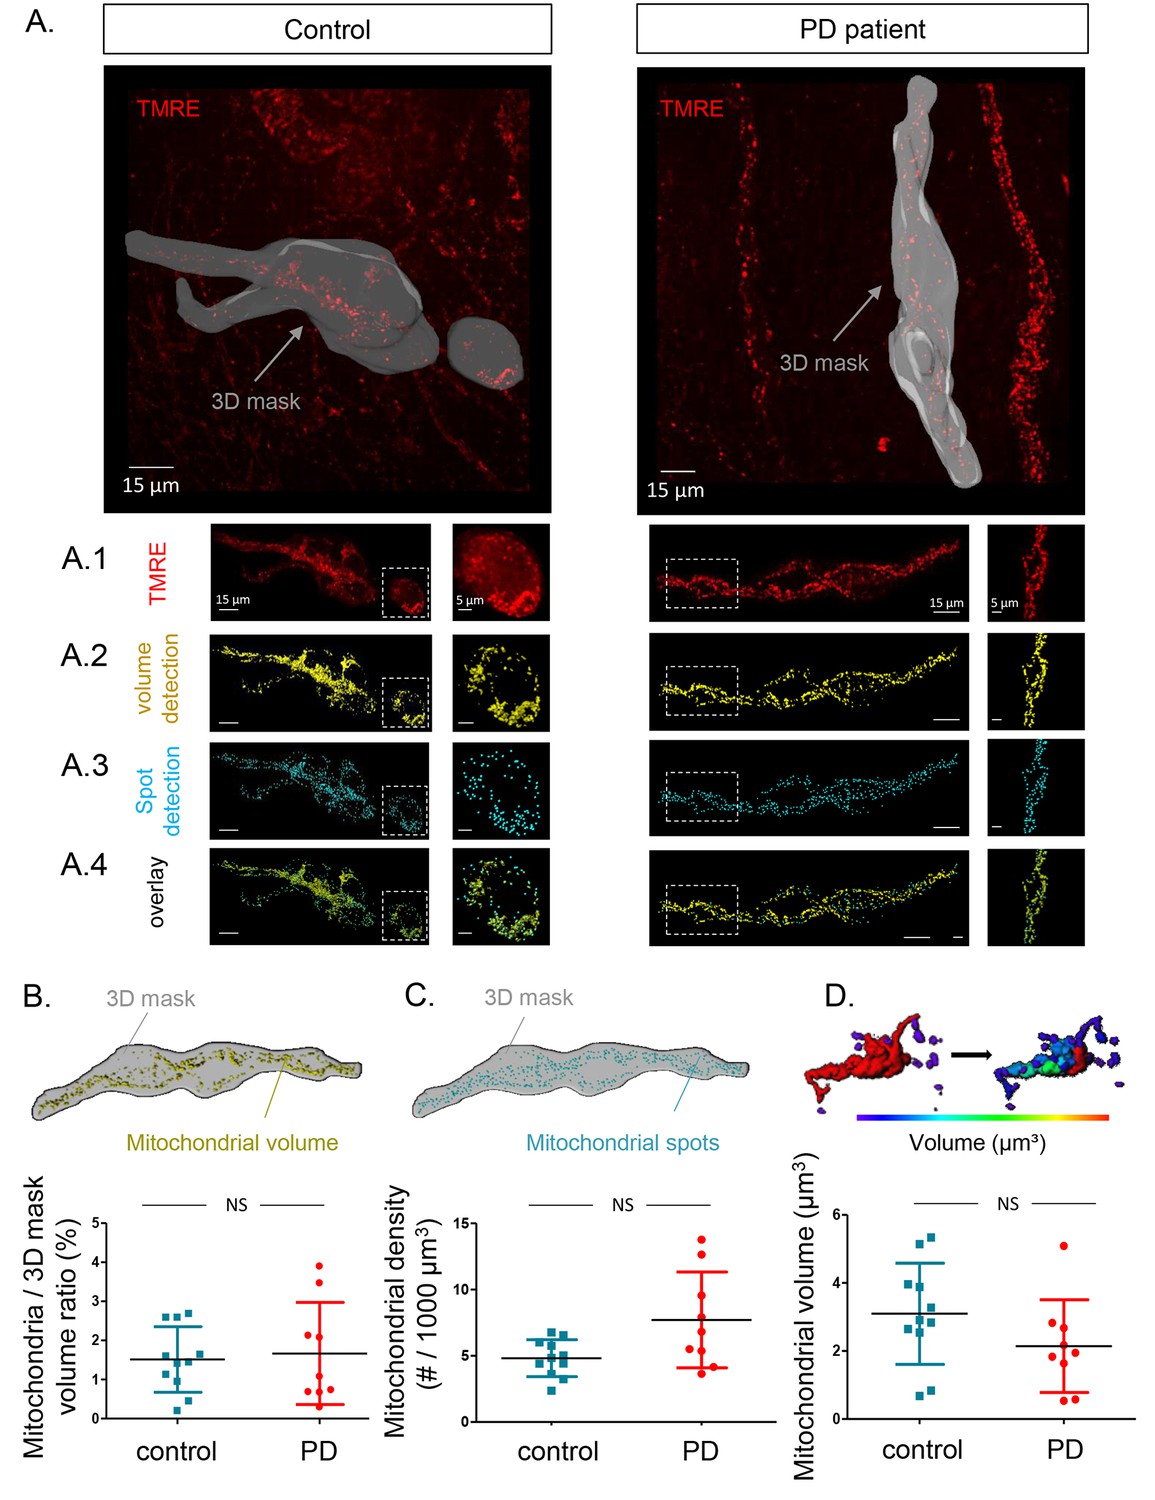
Mitochondrial number and volume in the submucous plexus of PD patients and controls.
(A.) Representative example of a submucous plexus injected with TMRE for a control (left) and PD patient (right). The 3D mask drawn around the injected ganglion is shown in grey. The inside of this volume is enlarged in panels A1-4 with an additional magnification of a selected subset (dashed square). Panels A1-4 represent an example of mitochondrial volume detection (A2), mitochondrial spot detection (A3) and overlay of both (A4). (B.) Schematic representation of the total mitochondrial volume detection within the 3D mask and summary data plot of the volume (mitochondrial/3D mask) ratio quantification. (C.) Schematic representation of mitochondrial spot detection and summary data plot of the quantification (mitochondrial density (#/1000 µm³). (D.) Schematic representation of the segmentation process (color-coded for mitochondrial size) to quantify the average volume (µm³) of single mitochondria and a summary data plot of the quantification in controls versus patients. (NS, not significantly different, p-values (non-parametric Wilcoxon T-test); mitochondrial volume ratio = 0.65, mitochondrial density = 0.00.16, mitochondrial volume = 0.30).
-
Figure 4—source data 1
Mitochondrial ratio.
GraphPad file with the corresponding values and graph of mitochondrial ratio measurements (panel B).
- https://doi.org/10.7554/eLife.26850.015
-
Figure 4—source data 2
Mitochondrial density.
GraphPad file with the corresponding values and graph of mitochondrial density measurements (panel C).
- https://doi.org/10.7554/eLife.26850.016
-
Figure 4—source data 3
Mitochondrial volume.
GraphPad file with the corresponding values and graph of mitochondrial volume measurements (panel D).
- https://doi.org/10.7554/eLife.26850.017
Figure 5
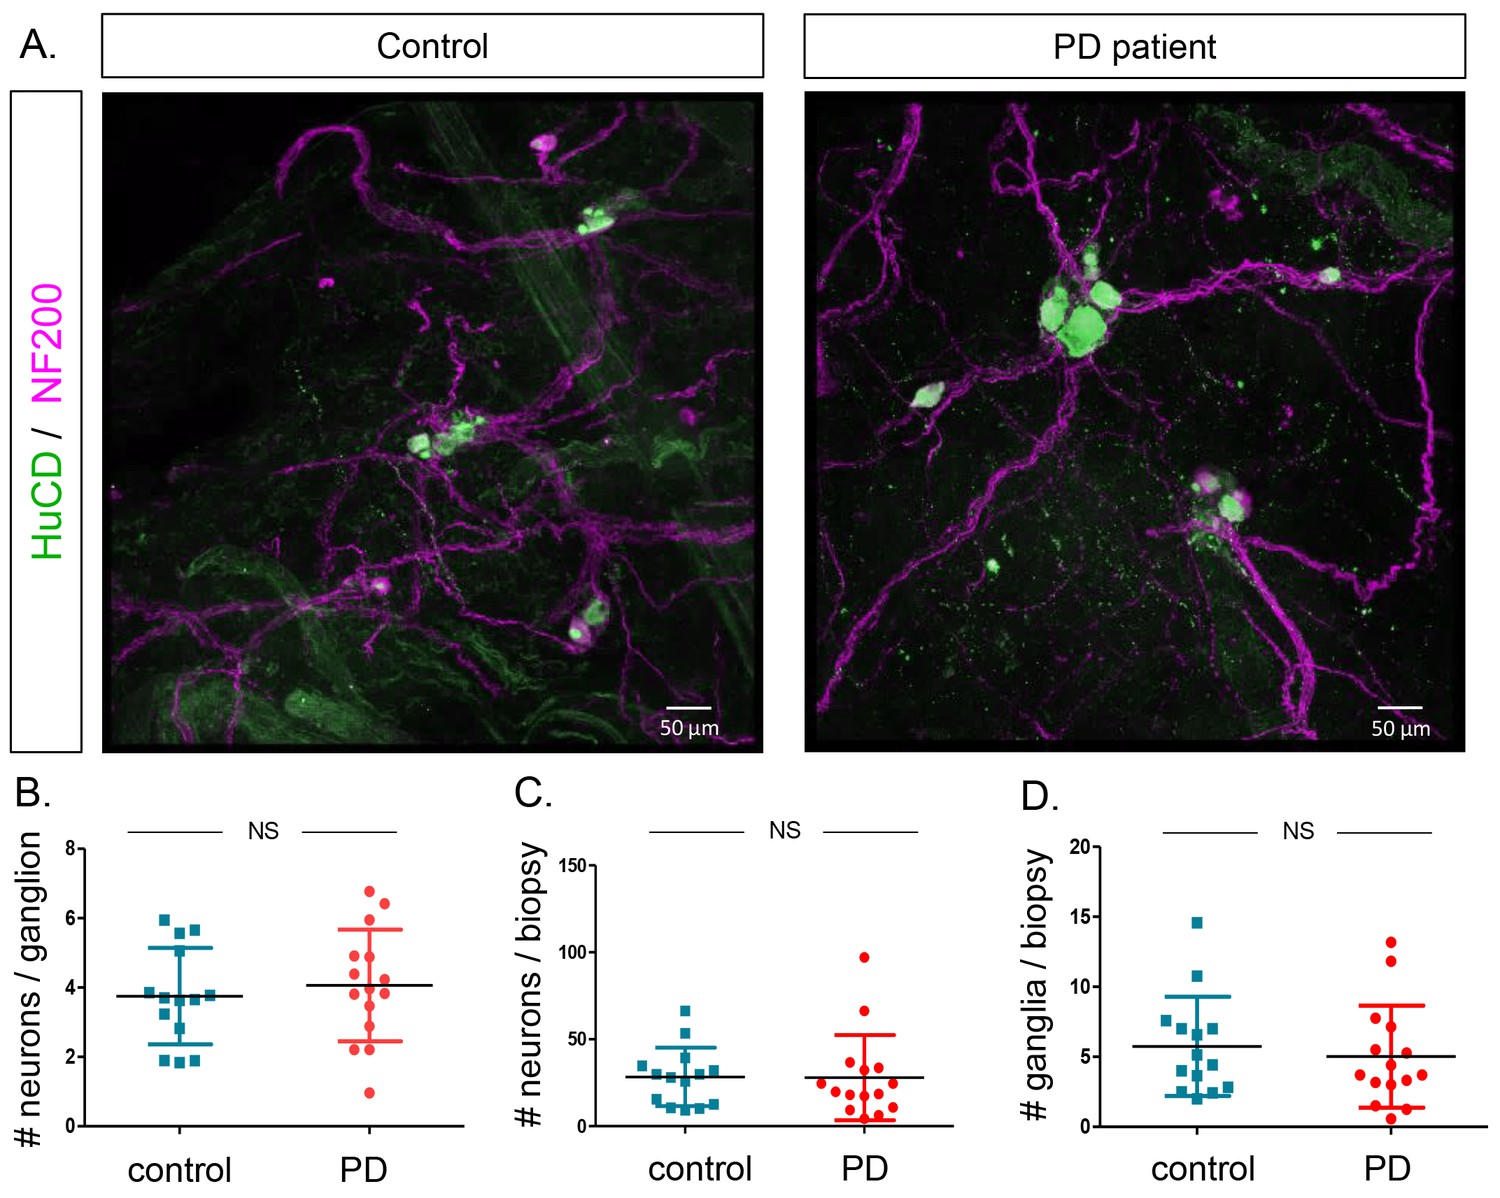
Quantification of neuron and ganglia numbers in the submucous plexus of PD patients and controls.
(A.) Representative immunofluorescent staining of submucous plexus of a control and PD patient stained for the pan-neuronal marker HuCD (green) and neuronal filament marker NF200 (Magenta). Bars: 50 μm. (B.) Graph showing quantification of number of neurons per ganglion. (C.) Graph showing quantification of total number of neurons per biopsy. (D.) Graph showing quantification of number of ganglia per biopsy. (NS, not significantly different (non-parametric Wilcoxon T-test), p-values; # neurons/ganglion = 0.86, # neurons/biopsy = 0.17 (non-parametric Wilcoxson T-test), # ganglia/biopsy = 0.24).
-
Figure 5—source data 1
Number of neurons per ganglia.
GraphPad file with the corresponding values and graph of number of neurons per ganglia (panel B).
- https://doi.org/10.7554/eLife.26850.019
-
Figure 5—source data 2
Number of neurons per biopsy.
GraphPad file with the corresponding values and graph of number of neurons per biopsy (panel C).
- https://doi.org/10.7554/eLife.26850.020
-
Figure 5—source data 3
Number of ganglia per biopsy.
GraphPad file with the corresponding values and graph of number of neurons per biopsy (panel D).
- https://doi.org/10.7554/eLife.26850.021
Figure 6
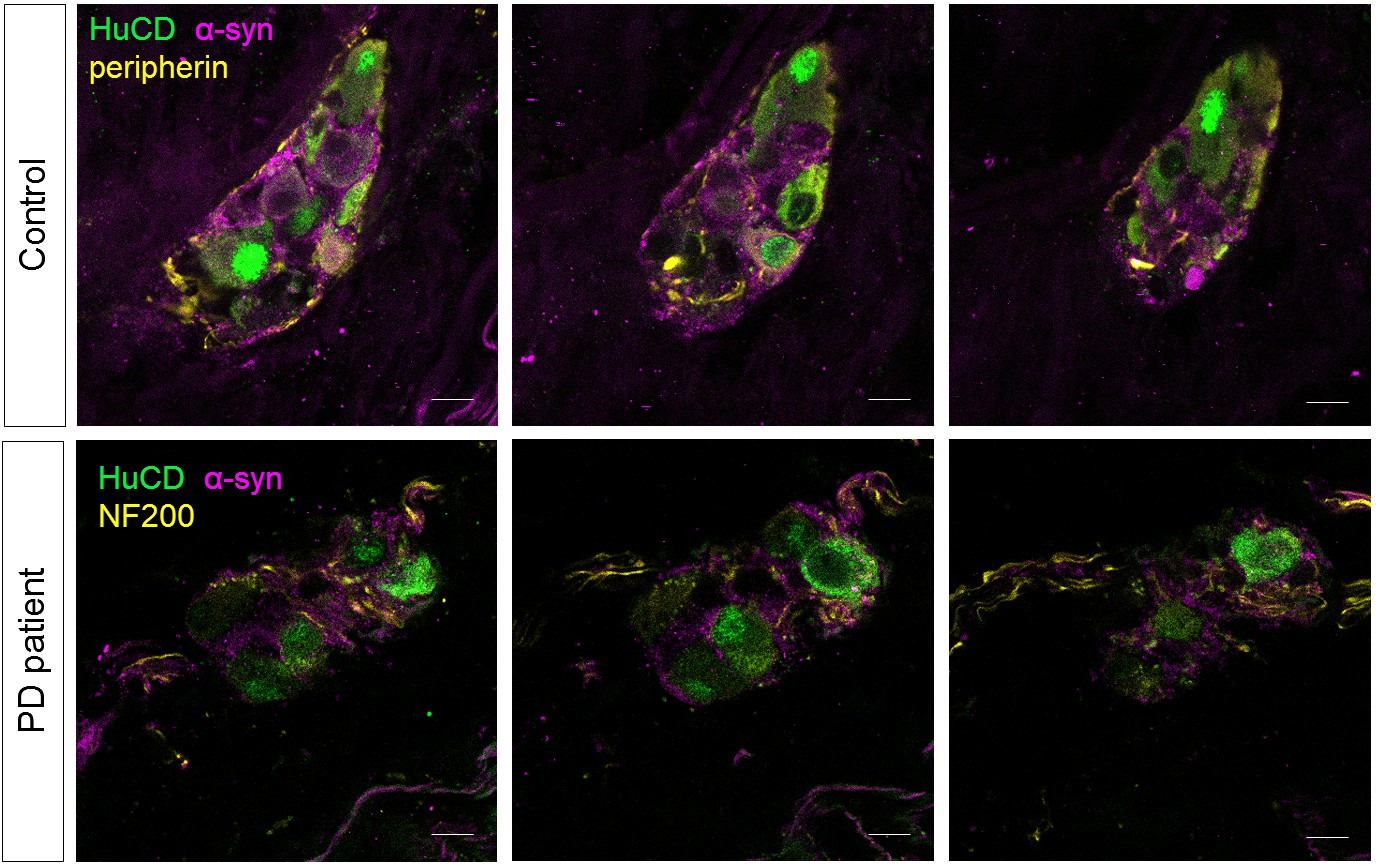
α-synuclein staining in the submucous plexus of PD patients and controls.
Top and bottom rows show three single slice confocal and deconvolved images of a representative immunofluorescent staining in the submucous plexus of a control (top) and PD patient (bottom) stained for the pan-neuronal marker HuCD (green) and α-synuclein (magenta). A neuronal fiber staining (yellow: NF200 in bottom and peripherin in top row) was added to help delineating the submucous ganglion. No differences in α-synuclein staining patterns in PD patients and controls could be detected. Bars: 10 µm.
Author response image 1
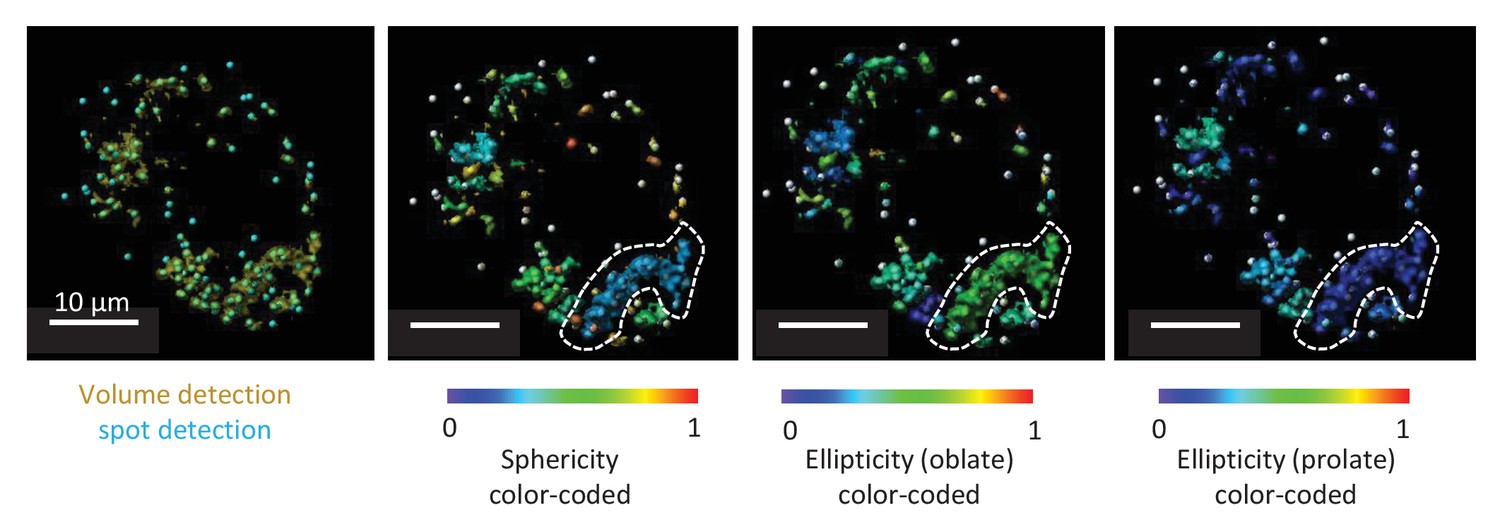
Representative TMRE volume detection in the submucosal plexus.
The first panel shows the typical volume detection (yellow) with additional spot detection (blue). The second picture is showing a color-coded image specific for sphericity. Within the white dotted line a cluster of mitochondria can be seen even if multiple spots were detected in this volume. Due to resolution limits, this cluster of mitochondria cannot be separated in individual mitochondria, not even after deconvolution. As seen from the color code, sphericity of this cluster is not representative for the sphericity of one mitochondrion. The third and fourth picture represent the same structure, representatively color-coded for ellipticity (oblate) and ellipticity (prolate).
Videos
Video 1
Calcium imaging in human submucous neurons.
This movie shows a representative recording of Fluo-4 intensity changes in 2 human submucous ganglia (the ganglion on the right holds 2, while the one the left contains 5 neurons) during high K+ stimulation (10 s). The movie, which is representative for both groups (patients and controls) was taken from a PD patient sample. The original recording was deconvolved using Huygens software and movies generated using IGOR pro and ImageJ.
Video 2
Mitochondrial imaging in the human submucous plexus.
TMRE-labeled mitochondria in a submucous ganglion of a control subject are shown as well as the selection of mitochondria that are color-coded for intensity (see also Figure 3A).
Video 3
Mitochondrial imaging in the human submucous plexus.
Movie of TMRE-labeled mitochondria in a submucous ganglion of a PD patient. The TMRE intensity variations over time are shown as well as the 3D mask (in green, appearing half way in the movie) that is used to calculate the mitochondrial density in ganglia (see also Figure 4A).
Video 4
Mitochondrial imaging in the human submucous plexus.
Movie of TMRE-labeled mitochondria in a submucous ganglion of a control subject, showing TMRE fluctuations, selection of the ganglionic volume (3D mask) and mitochondrial volume detection (yellow) and spot detection (cyan) (see also Figure 4 panels A1-4).
Tables
Table 1
Demographic and clinical characterization of PD patients and controls Mean ± SD are shown with associated p-value (non-parametric Wilcoxon T-testa | Wilcoxson T-test b | Chi squared test c).
| Control subjects (n = 15) | PD patients (n = 15) | p-value | |
|---|---|---|---|
| Gender (M:F) | 4: 11 | 11: 4 | 0.01 (*) C |
| Age | 57.8 ± 2.6 (range: 44–76) | 58.9 ± 9.2 (range: 45–71) | 0.40 a |
| SCOPA total | 5.6 ± 2.7 (range: 2–10) | 12.3 ± 9.2 (range: 2–32) | 0.03 (*) a |
| SCOPA GI | 0.9 ± 0.80 (range: 0–2) | 2.7 ± 2.29 (range: 0–8) | 0.02 (*) b |
| Disease duration (years) | - | 7.8 ± 3.9 (range: 2–17) | |
| UPDRS III off (disease severity) | - | 23.3 ± 10.0 (range: 12–46) | |
| Age at onset (years) | - | 51.1 ± 9.4 (range: 36–69) | |
| Hoehn-Yahr (off) | - | 2 (IQR: 2–5) | |
| LED (mg) | - | 684.1 ± 388.5 (range: 205–1740) | |
| MMSE | - | 29.6 ± 0.9 |
-
(*indicates a statistical difference p<0.05). For Hoehn-Yahr scores, median and interquartile range are shown.
Additional files
-
Supplementary file 1
Clinical characteristics of individual PD patients.
Clinical data of individual PD patients. SCOPA total, *Patient six entered ‘not applicable’ for the 2 SCOPA items related to sexual function. Mean ± SD are shown. For Hoehn-Yahr scores, median and interquartile range are shown instead of average and SD.
- https://doi.org/10.7554/eLife.26850.023
-
Supplementary file 2
Correlation between Ca2+ imaging data and PD characteristics
Spearman R-values of correlations between Ca2+ imaging parameters and clinical characteristics of PD patients (gray shaded rows) and where applicable (age, SCOPA) of controls (white rows).
- https://doi.org/10.7554/eLife.26850.024
-
Supplementary file 3
Correlations between mitochondrial imaging data and PD characteristics
Spearman R-values of correlations between mitochondrial imaging parameters and clinical characteristics of PD patients (gray shaded rows) and where applicable (age, SCOPA) of controls (white rows).
- https://doi.org/10.7554/eLife.26850.025
-
Supplementary file 4
Correlations between immunohistochemical data and PD characteristics
Spearman R-values of immunofluorescent counting correlated with clinical characteristics of the PD patients (gray shaded rows) and where applicable (age, SCOPA) of controls (white rows).
- https://doi.org/10.7554/eLife.26850.026
Download links
A two-part list of links to download the article, or parts of the article, in various formats.
Downloads (link to download the article as PDF)
Open citations (links to open the citations from this article in various online reference manager services)
Cite this article (links to download the citations from this article in formats compatible with various reference manager tools)
Live calcium and mitochondrial imaging in the enteric nervous system of Parkinson patients and controls
eLife 6:e26850.
https://doi.org/10.7554/eLife.26850


