Estrogen receptor coregulator binding modulators (ERXs) effectively target estrogen receptor positive human breast cancers
- University of Texas Southwestern Medical Center at Dallas, United States
- University of Texas Health Science Center, United States
- University of Texas Health Cancer Center, United States
- University of Texas at Dallas, United States
- University of Texas Southwestern Medical Center, United States
Figures
Figure 1 with 3 supplements
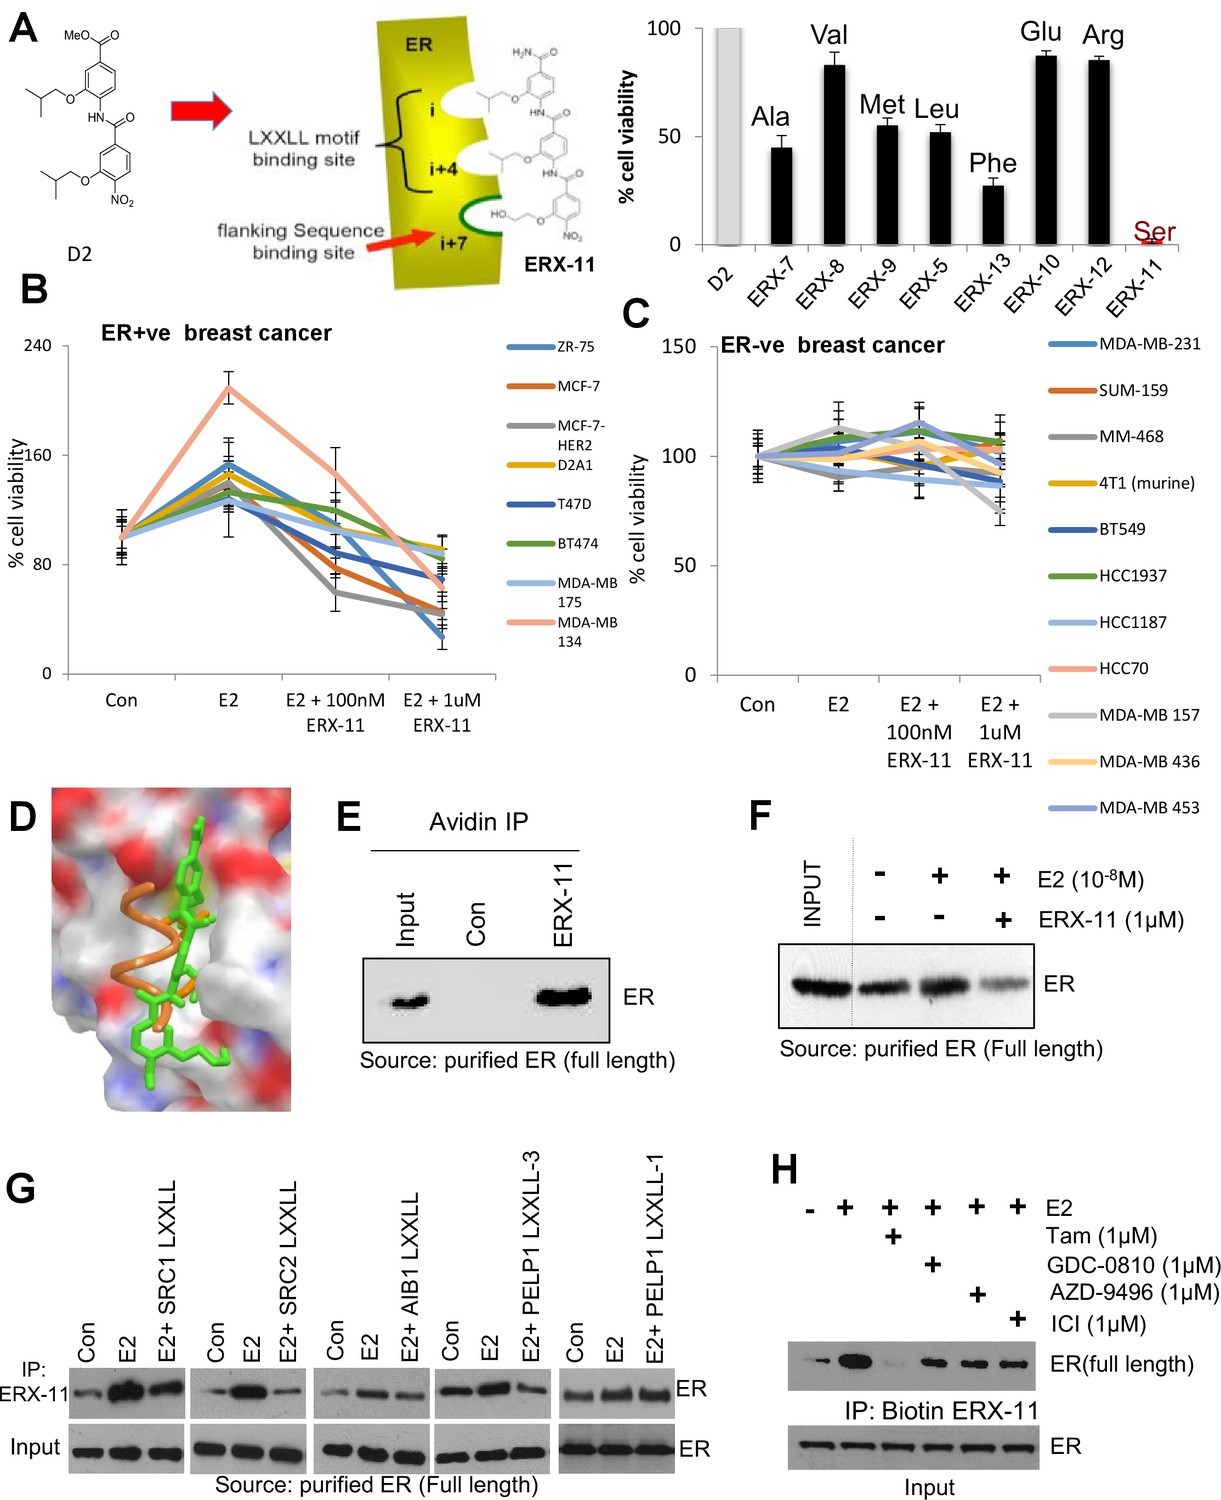
Derivation and characterization of ERX-11.
Structure of ERX-11, as a derivative of the D2 peptidomimetic with a hydroxyethyl moiety in the flanking position to mimic a Serine (A, left panel). Effect of 500 nM of each peptidomimetic on the growth of MCF-7 cells using MTT cell viability assay is shown as percentage inhibition of the growth of E2-treated control cells (A, right panel). Effect of increasing doses of ERX-11 on the cell viability of ER-positive (B) and ER-negative (C) breast cancer cells using the MTT cell viability assay. Molecular docking studies on the interactions between ERX-11 and ER using AutoDock Vina. Superimposition of the docked ERX-11 (green) on the crystal structure (PDB code 1L2I) of the LXXLL motif (orange) (D). Purified full-length ER was incubated with biotin-control or biotin-ERX-11 in the presence of E2. ERX-11 interaction with purified ER was analyzed using avidin bead pulldown and western blotting (E). Purified full-length ER was incubated with biotin-ERX-11 in the presence of E2 ± free ERX-11 (1 µM). ERX-11 ability to compete with the binding of biotin ERX-11 with ER was analyzed using avidin pulldown assay (F). Purified full-length ER was incubated with biotin-ERX-11 in the presence of E2 ±LXXLL peptides (1 µM) from various coregulators SRC1, SRC2, AIB1, and PELP1. LXXLL peptides ability to compete with the binding of biotin ERX-11 with ER was analyzed using avidin pulldown assay (G). Purified full-length ER was incubated with biotin-ERX-11 in the presence of E2 ± GDC0810, AZD-9496, ICI, and Tam (1 µM) and their ability to compete with the binding of biotin ERX-11 with ER was analyzed using avidin pulldown assay (H).
Figure 1—figure supplement 1
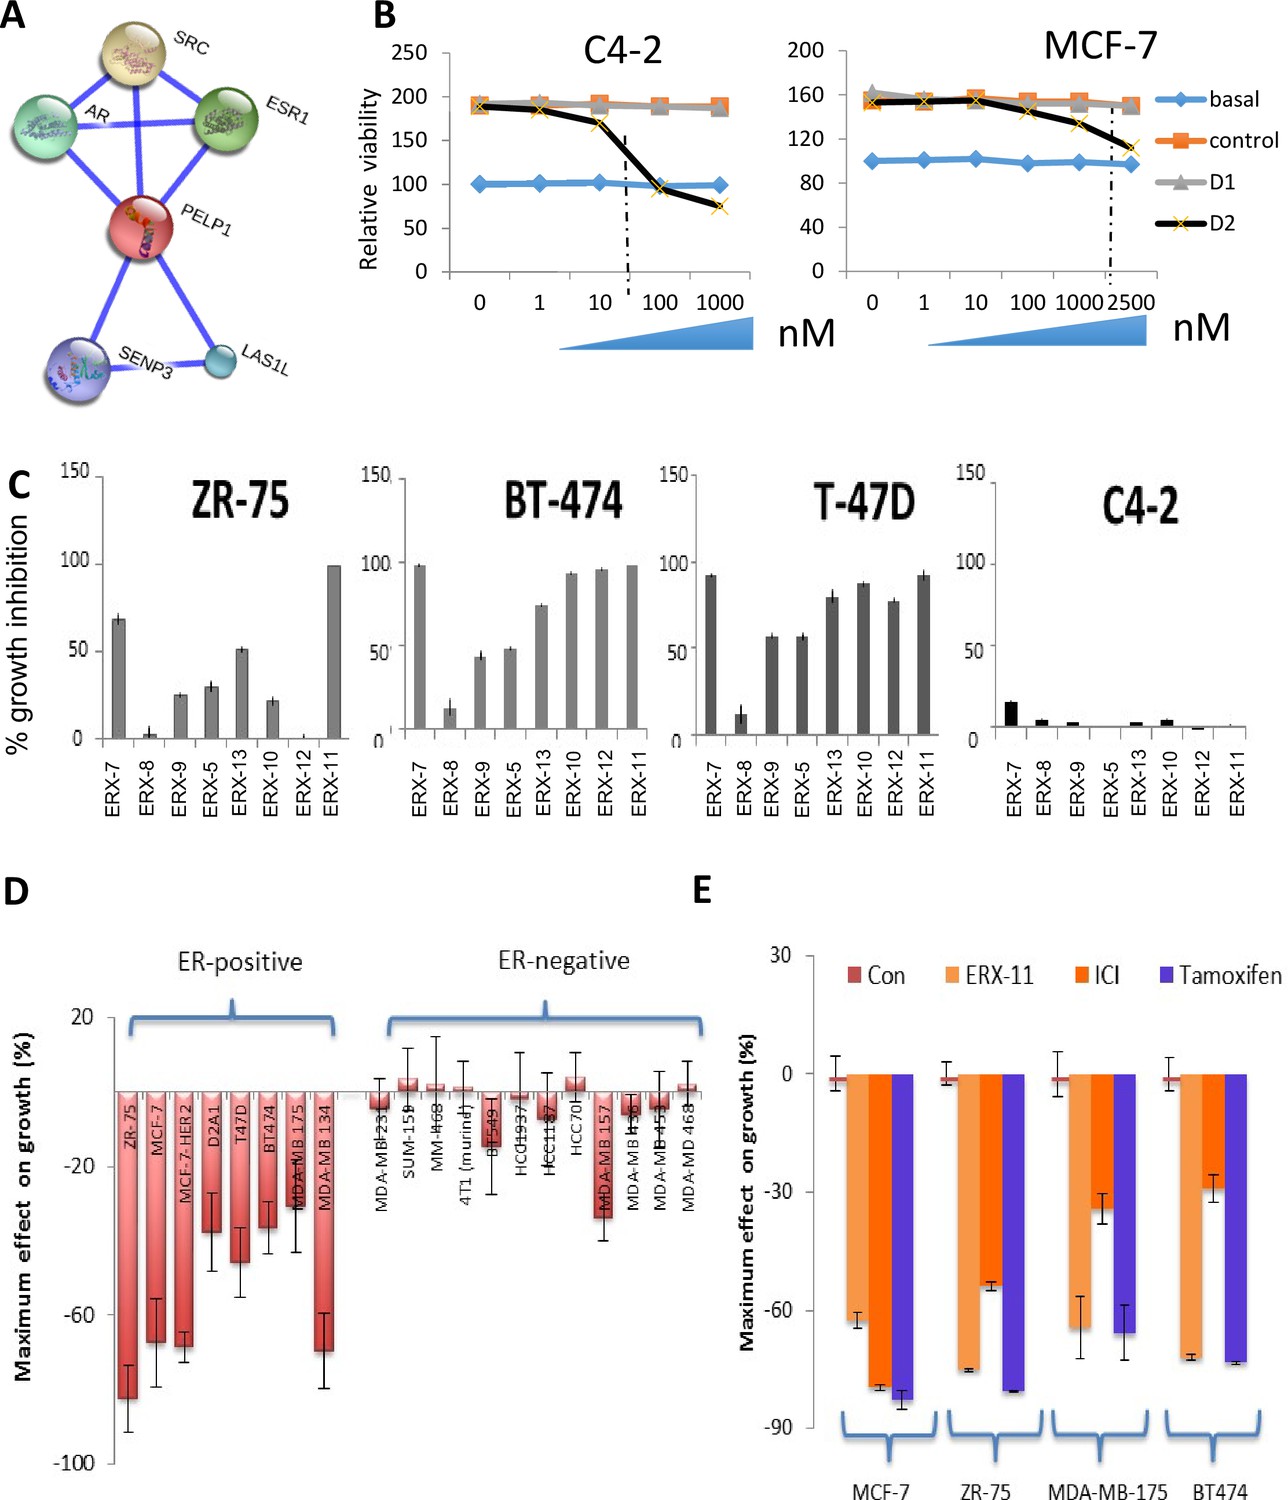
Derivation of the α-helix mimetic ERX-11 and structural design, synthesis and activity of the α-helix mimetic.
(A) String analyses depicting the interactome of PELP1, especially with ER and AR using string-db.org software v 10.4. (B) Effect of increasing concentrations of D1 and D2 peptidomimetic on the cell viability of C4-2 prostate cancer cells and MCF-7 breast cancer cells. (C) Effect of ERXs on the growth inhibition of ZR-75, BT474, T47D and C4-2. (D) Waterfall graph displaying the effect on growth by 1 μM ERX-11 in a number of ER-positive and ER-negative cell lines. (E) Waterfall graph comparing the activity of ERX-11 in ER-positive cell lines to fulvestrant (ICI) or tamoxifen.
Figure 1—figure supplement 2
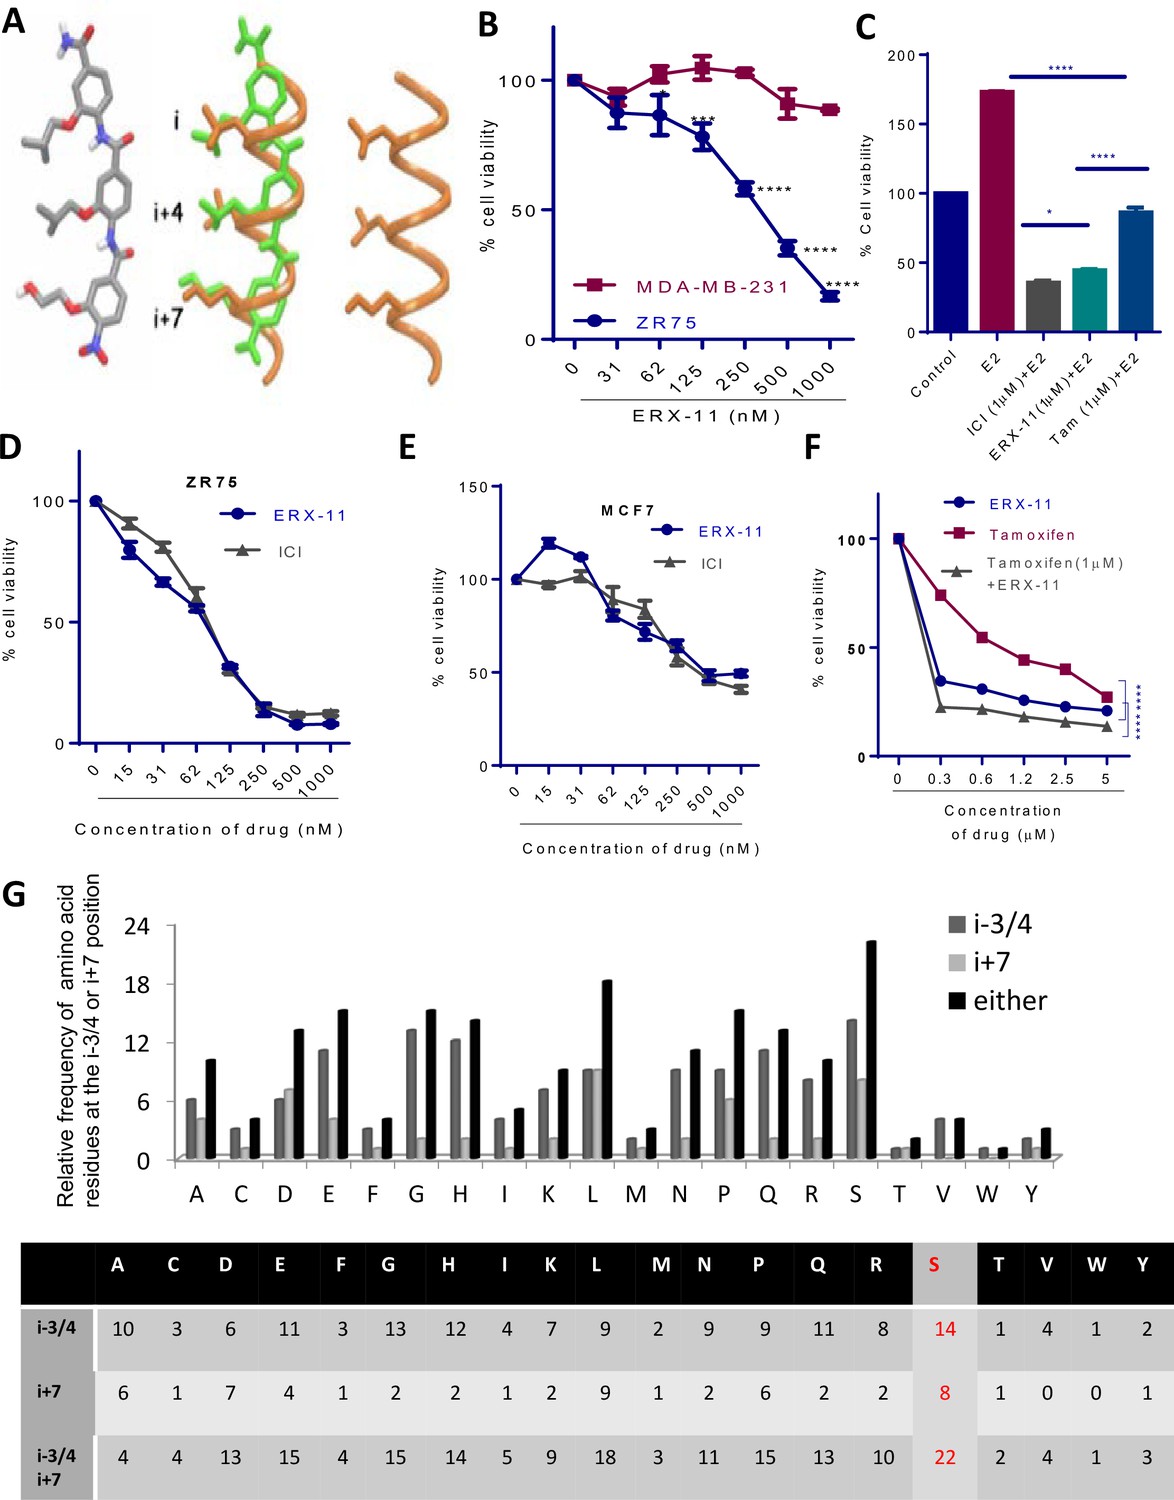
Characterization of ERX-11 activity.
(A) The lowest energy conformation of ERX-11 (left), Superimposition of the energy-minimized ERX-11 (green) on an α-helix (orange) (middle) and an α-helical LXXLL motif containing a Ser at its flanking sequence (orange) (right). (B) Effect of increasing doses of ERX-11 on the cell viability of MDA-MB-231 and ZR-75 cell lines in the presence of E2. (C) ZR-75 cells were stimulated with E2 (10−8M) for 7 days in the presence of ERX-11 (1 µM) or tamoxifen (1 µM) or ICI (1 µM) and cell viability was measured by MTT assay. (*p<0.05, ****p<0.0001). (D, E) ZR-75 and MCF-7 cells were stimulated with E2 (10−8M) for 7 days in the presence of indicated concentrations of ICI or ERX-11 and cell viability was measured by MTT assay. (F) ZR-75 cells were stimulated with E2 (10−8M) for 7 days in the presence of indicated concentrations of ERX-11 or tamoxifen or in combination and cell viability was measured by MTT assay (****p<0.0001). (G) Relative frequency of various amino acid residues at the i-3/4 or i + 7 position flanking the core LXXLL domain in a large number of proteins with known LXXLL domains.
Figure 1—figure supplement 3
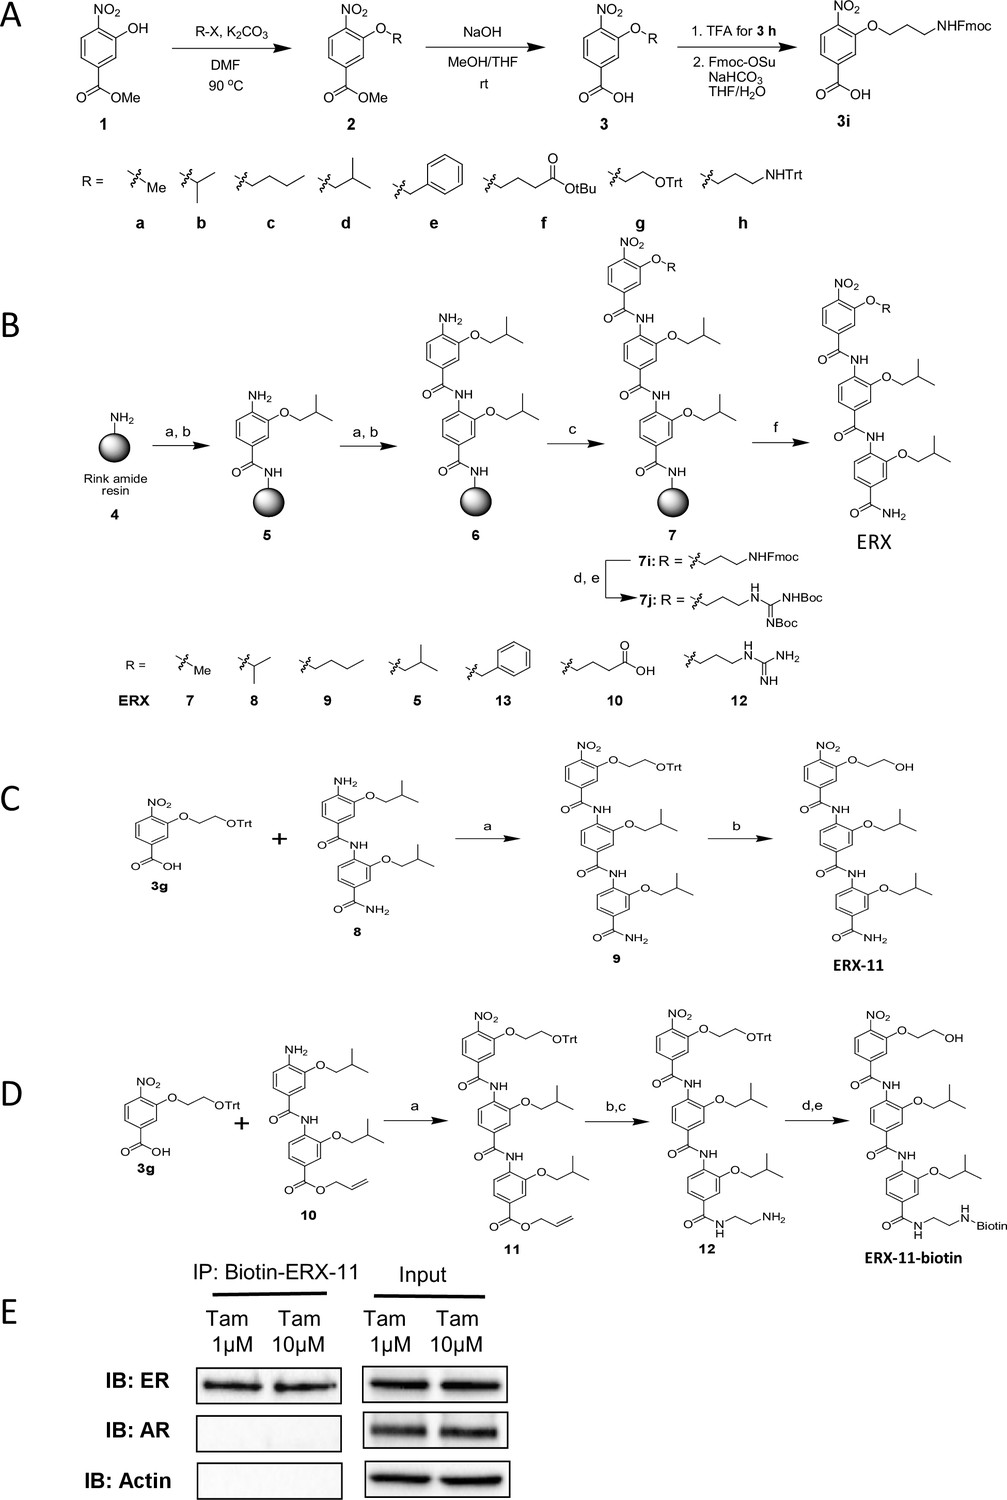
Derivation of the α-helix mimetic ERX-11 and synthesis of tris-benzamide peptidomimetics.
(A) Synthesis of 3-alkoxy-4-nitrobenzoic acids. (B) Solid-phase synthesis of tris-benzamdies (Reagents and conditions: (a) 3d, HATU, DIEA, DMF, rt, 24 hr; (b) SnCl2⋅2H2O, AcOH/HCl/THF, rt, 24 hr; (c) 3, HATU, DIEA, DMF, rt, 24 hr; (d) Piperidine for 7i; (e) N,N-Di-Boc-1H-pyrazole-1-carboxamide, DIEA, DMF, rt, 12 hr for 7 j; (f) TFA/TIS/H2O (95:2.5:2.5), rt, 1 hr). (c) Synthesis of ERX-11 (Reagents and conditions: (a) HATU, DIEA, DMF, rt, 24 hr; (b) TFA, rt, 30 min) (D) Synthesis of biotinylated ERX-11. (E) Pull down of ER from Tamoxifen-resistant MCF-7 cells using biotinylated ERX-11 was not affected by the presence of Tamoxifen.
Figure 2 with 7 supplements
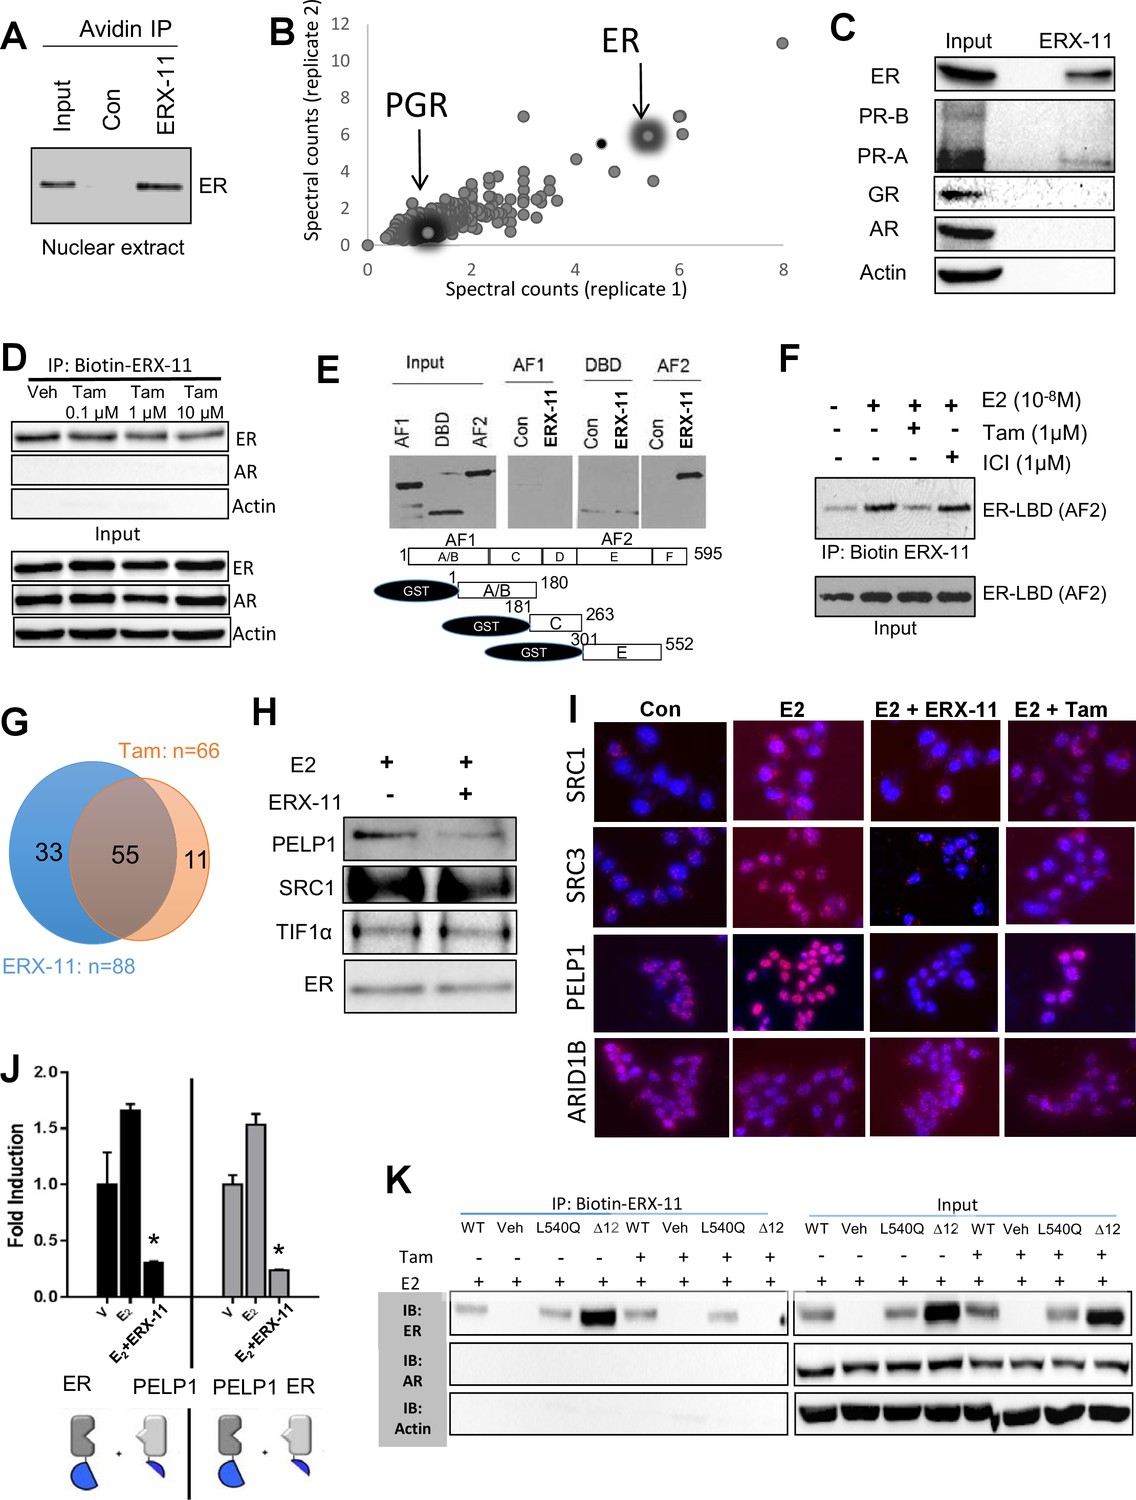
ERX-11 interacts with ER and blocks its interactome.
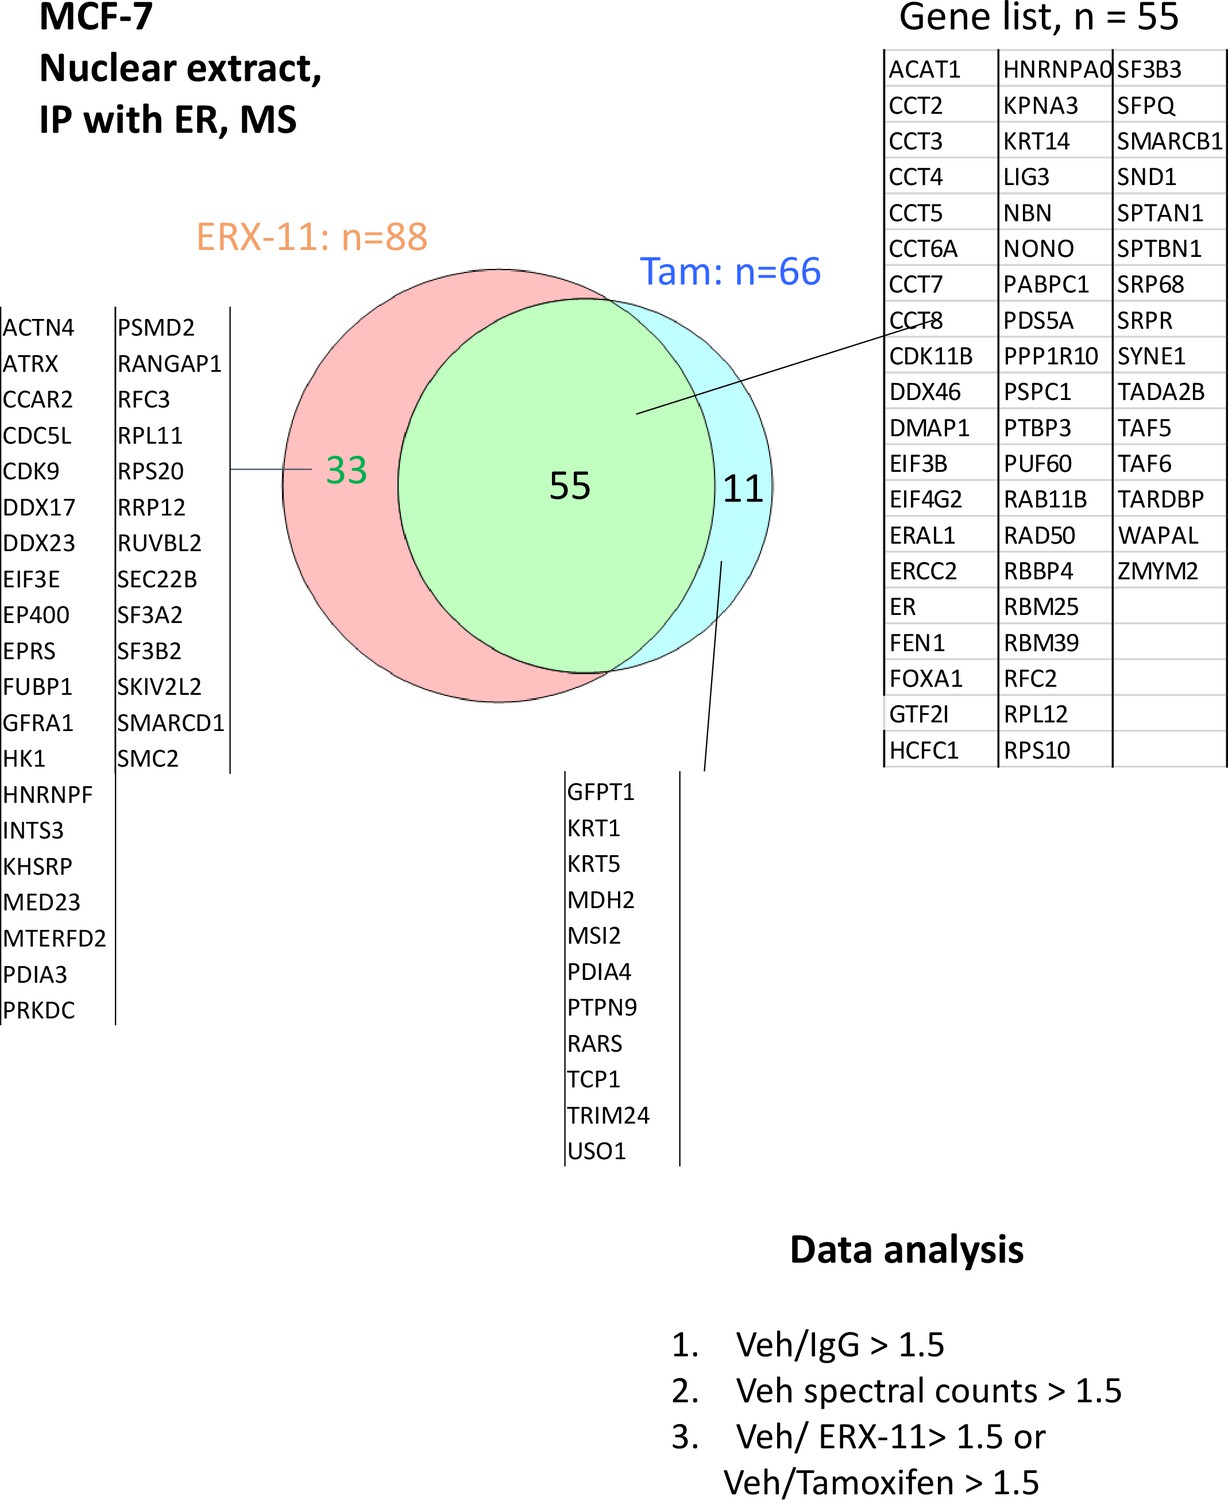
Interaction with endogenous ER was evaluated in nuclear lysates prepared from ZR-75 cells stimulated with E2, incubated with biotin-control or biotin-ERX-11 and analyzed by avidin pull-down assay (A). Nuclear lysates from MCF-7 cells were incubated with biotinylated ERX-11 for 2 hr and then subject to a streptavidin column. The bound proteins were eluted and subjected to analyses by mass spectroscopy. The fold-enrichment in binding over basal is depicted for two independent replicates (x axis = replicate one and y axis = replicate 2). Relative binding of ER and PGR are shown (B). MCF-7 nuclear lysates were incubated with biotinylated ERX-11 and then subject to a streptavidin column. The bound proteins were eluted and evaluated by western blotting compared to equivalent amount of input (C). ZR-75 cells were incubated with tamoxifen and its ability to interfere ERX-11 binding to ER was analyzed by immunoprecipitation followed by western blotting (D). To confirm ERX-11 binding to ER-ligand-binding domain (AF2), a GST pull-down assay was performed. Biotinylated ERX-11 interacted with the GST-AF2 domain of ER but not with the GST-AF1- or GST- DNA-binding domain of ER (E). Purified ER-AF2 domain was incubated with biotin-ERX-11 in the presence of E2 ±ICI or tamoxifen (1 µM). ICI and tamoxifen ability to compete with binding of biotin ERX-11 with ER-AF2 domain was analyzed using avidin pull-down and western blotting (F). Venn diagram shows the overlap between the ER-binding proteins immunoprecipitated from nuclear lysates from E2-stimulated MCF-7 cells following treatment with vehicle or ERX-11 or tamoxifen (G). Co-immunoprecipitation analyses show the effect of ERX-11 on the interaction of ER with coregulators PELP1, SRC1, TIF1α in MCF-7 cells (H). Proximity ligation assay validated the ability of ERX-11 and tamoxifen to disrupt the interactions between ER and coregulators such as PELP1, SRC1, SRC3/AIB1 and ARID1B in MCF-7 cells (I). NanoBiT assay: expression plasmids were created to express either ER or PELP1 in conjunction with the large bit or the small bit of the NanoBiT luciferase enzyme. If the proteins directly interact within the cell, the two parts of the NanoBiT luciferase enzyme come together and create a quantifiable luminescent signal. The effect of ERX-11 on the interaction between the two sets of ER and PELP1 constructs is shown (J). Validation of the binding of ERX-11 to the ER-AF2 domain was further explored using AF2-domain mutants of ER stably transfected in ER-negative MDA-MB-231 breast cancer cell lines. Biotinylated ERX-11 was then used to pull-down ER from these cell lines (K). Data shown are the means of ±SEM performed in triplicate wells. *p<0.05.
Figure 2—figure supplement 1

Pathways analysis in terms of either biological processes or molecular functions revealed that ERX-11-binding proteins were involved in the activation of multiple pathways leading to transcriptional regulation.
https://doi.org/10.7554/eLife.26857.008
Figure 2—figure supplement 2
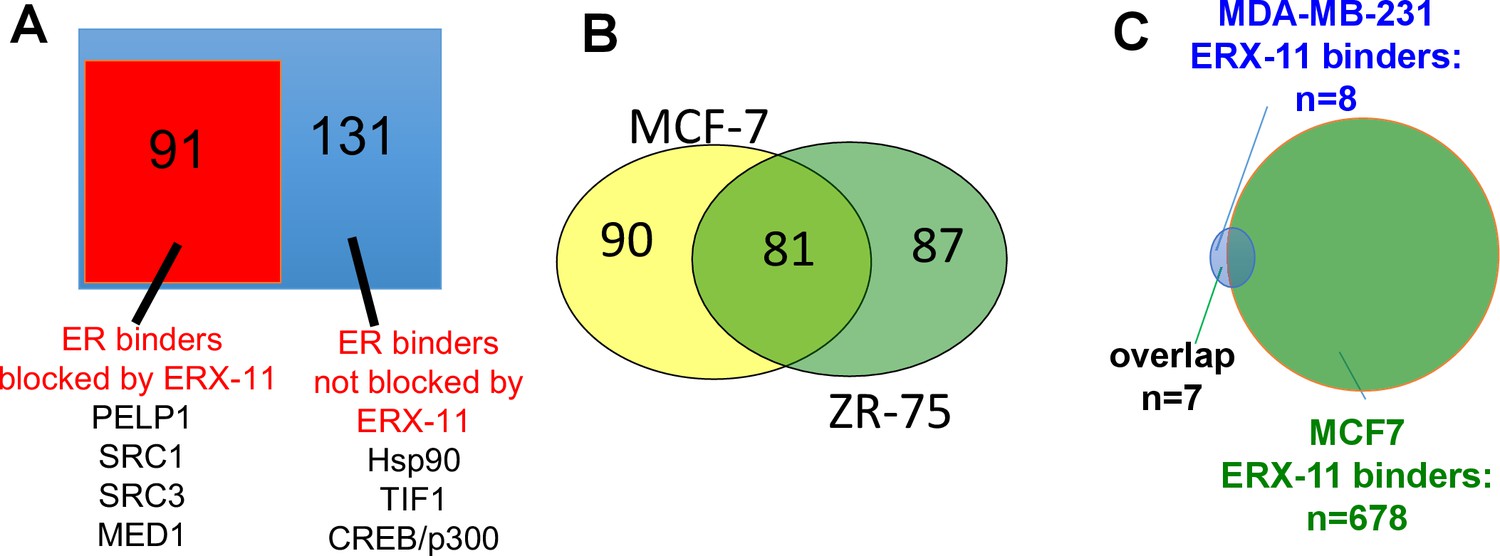
Characterization of ERX-11 interactions with ER.
(A) Nuclear lysates from E2-stimulated MCF-7 cells treated with vehicle or ERX-11 were subjected to immunoprecipitation with ER antibody. The immunoprecipates were analyzed by mass spectroscopy. The blue box represents the 222 proteins bound to ER in MCF-7 cells, whereas the orange box shows the 91 proteins whose binding to ER is disrupted by ERX-11 (B) Venn diagram shows the overlap between proteins binding with biotinylated ERX-11 in MCF-7 and ZR-75 cells. (C) Nuclear lysates from MDA-MB-231 cells treated with vehicle or biotin-ERX-11 were subject to immunoprecipitation using avidin beads. The avidin-biotin-ERX-11 precipitates were analyzed by mass spectroscopy.
Figure 2—figure supplement 3
Analyses of the ER-binding proteins blocked by ERX-11 or Tamoxifen.
https://doi.org/10.7554/eLife.26857.010
Figure 2—figure supplement 4
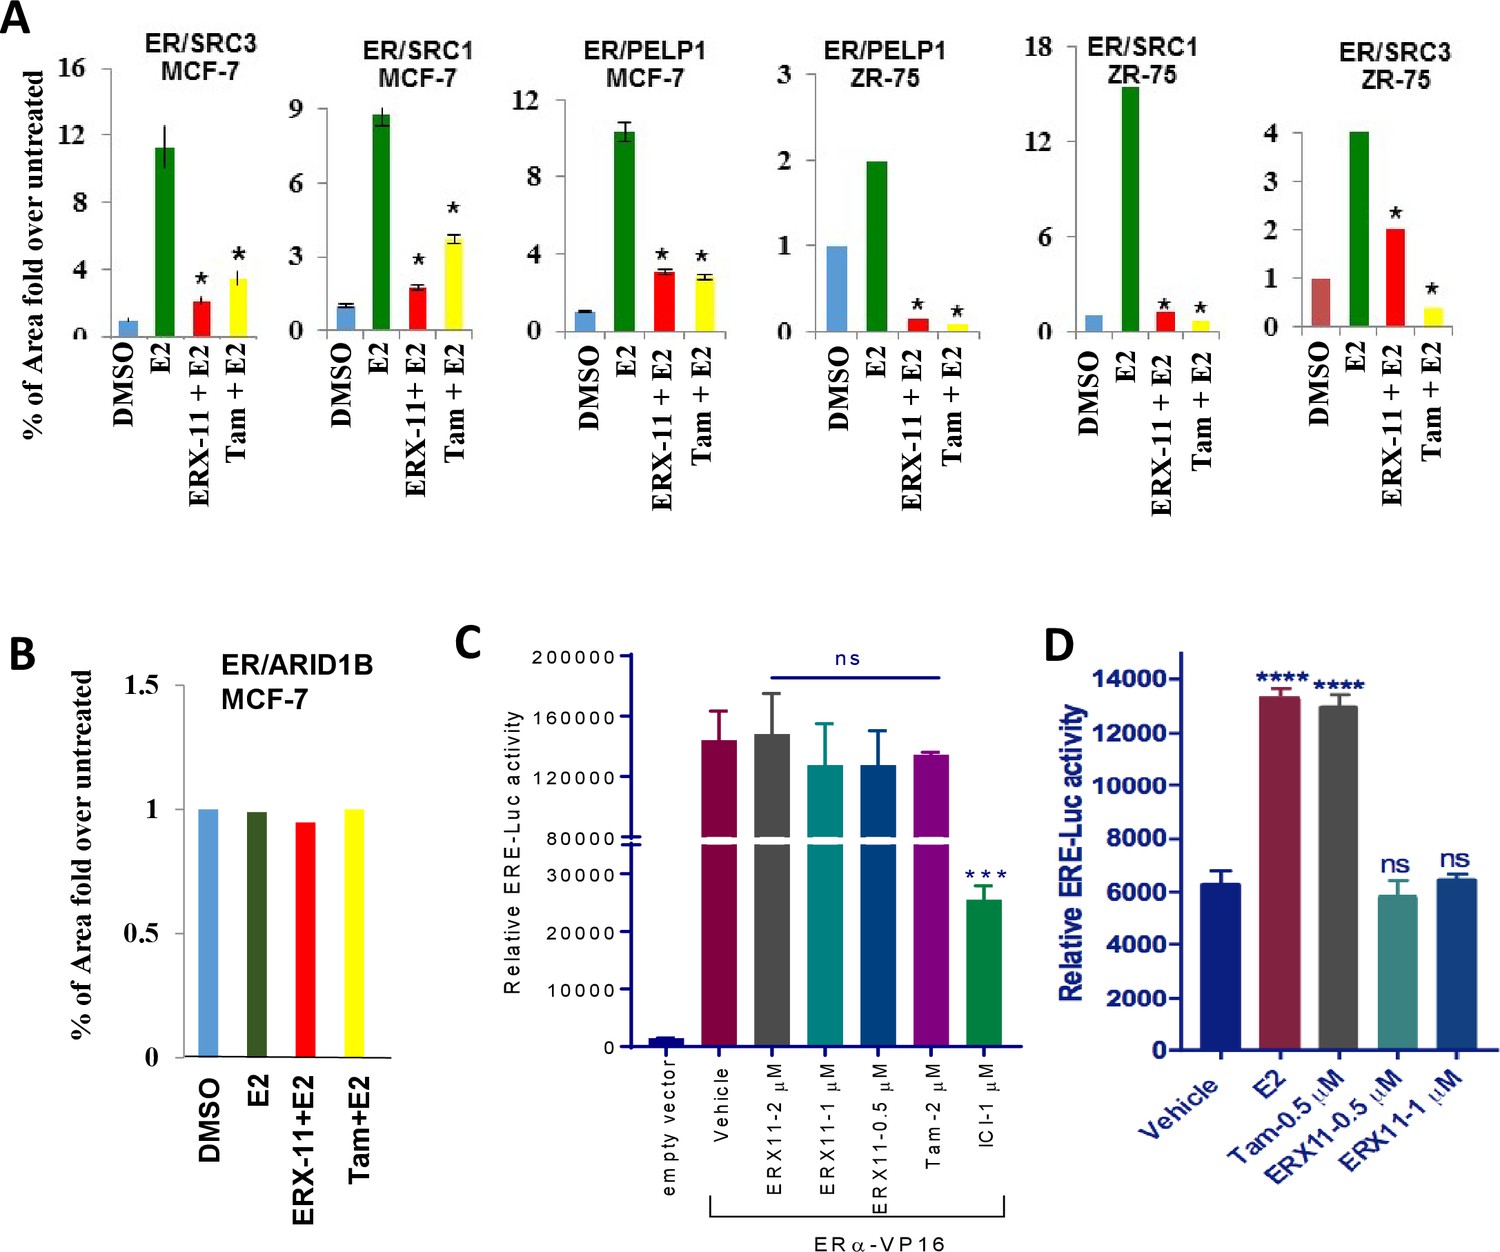
Effect of ERX-11 on inhibition of ER -coregulators interactions.
(A) Quantification of the effect of ERX-11 on the proximity ligation between ER and PELP1 or SRC1 or SRC3 in MCF-7 and ZR-75 cells. (B) Quantification of the effect of ERX-11 on the proximity ligation between ER and ARID1B in MCF-7 cells. (C) ZR-75 cells were co-transfected with ERα-VP16 and ERE-Luc reporter constructs. After 24 hr, cells were treated with vehicle or ERX-11 or Tam or ICI and ERE-Luc activity was measured. (D) Ishikawa cells were transfected with ERα and ERE-Luc reporter constructs and after 24 hr treated with indicated concentrations of E2, Tam or ERX-11. After 24 hr, reporter activity was measured.
Figure 2—figure supplement 5
Effect of SERDs or tamoxifen on ERX-11 interactions with ER.
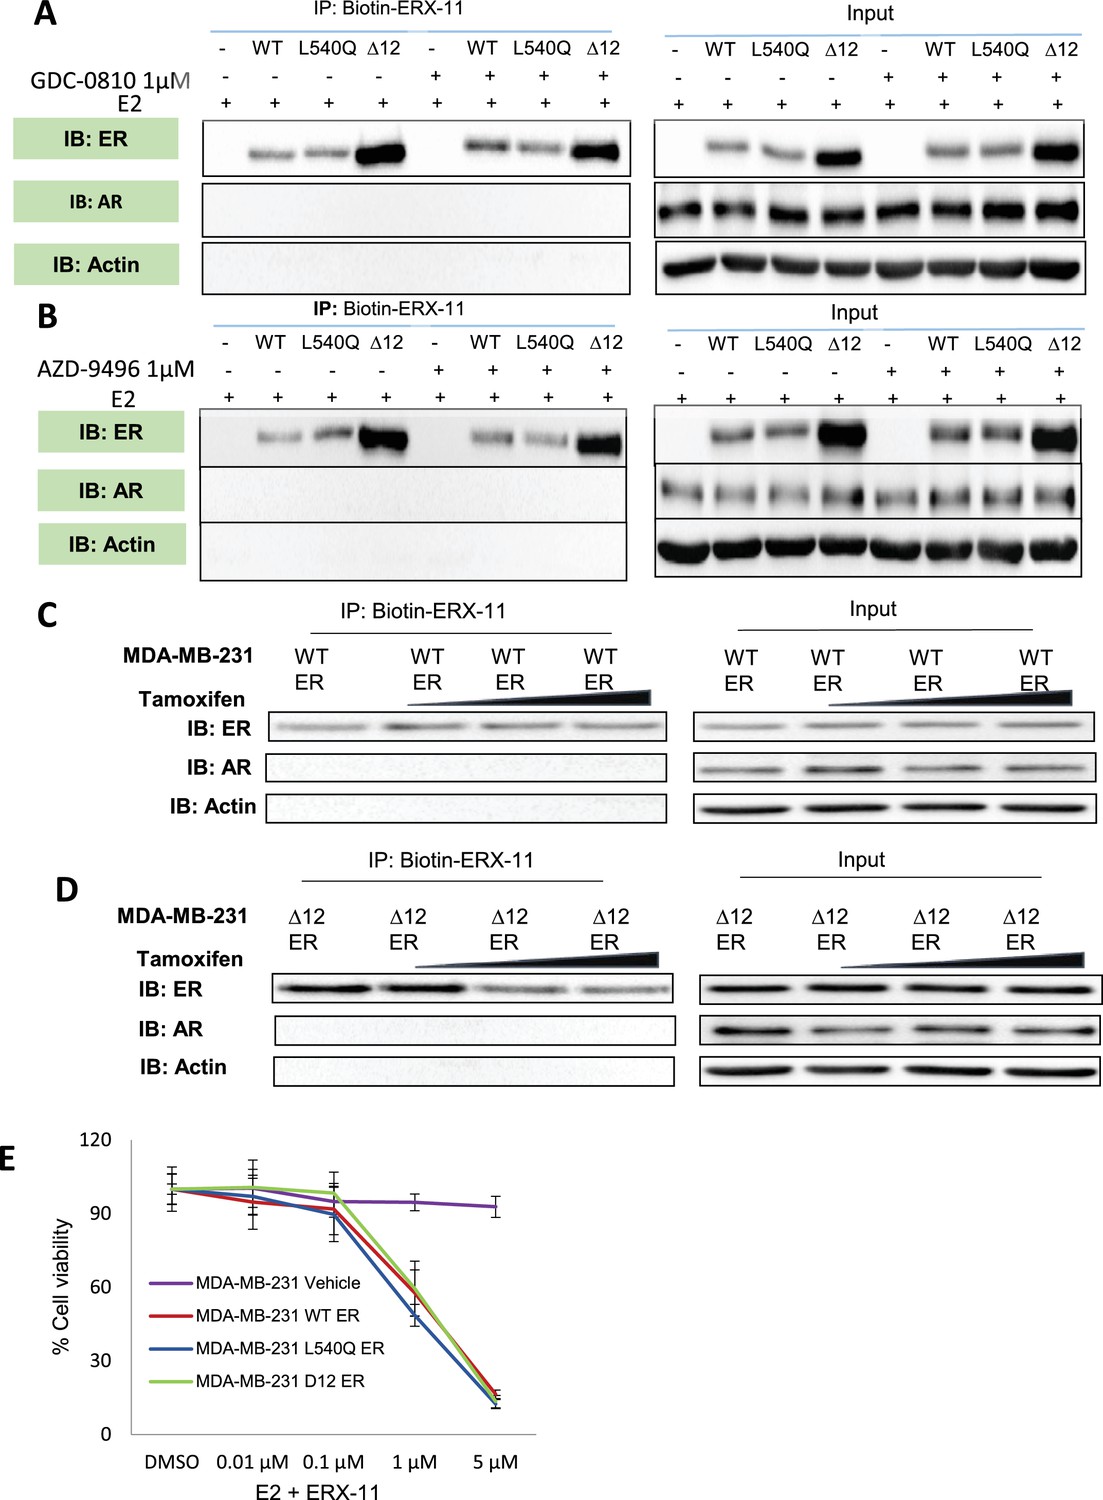
(A) Effect of 1 μM of a SERD, GDC-0810, on the ability of ERX-11 to pulldown ER in MDA-MB-231 cells stably transfected with WT-ER, L540Q ER or ▲12 ER. Input is shown on the right. (B) Effect of 1 μM of a SERD, AZD-9496, on the ability of ERX-11 to pulldown ER in MDA-MB-231 cells stably transfected with WT-ER, L540QER or ▲12 ER. Input is shown on the right. (C, D) MDA-MB-231-expressing WT-ER or ▲12 ER were treated with tamoxifen 1 µM, 5 µM, 10 µM for 30 min, E2 (1 nM) for 90 min, and subjected to biotin-ERX-11 pull down followed by western blotting. (E) ER was introduced into ER-negative breast cancer model MDA-MB-231 by transfecting WT-ER, or L540QER, or ▲12ER and treated with ERX-11 and cell viability was measured using MTT assays.
Figure 2—figure supplement 6
Models showing the putative interactions of ERX-11 with residues in the ER protein.
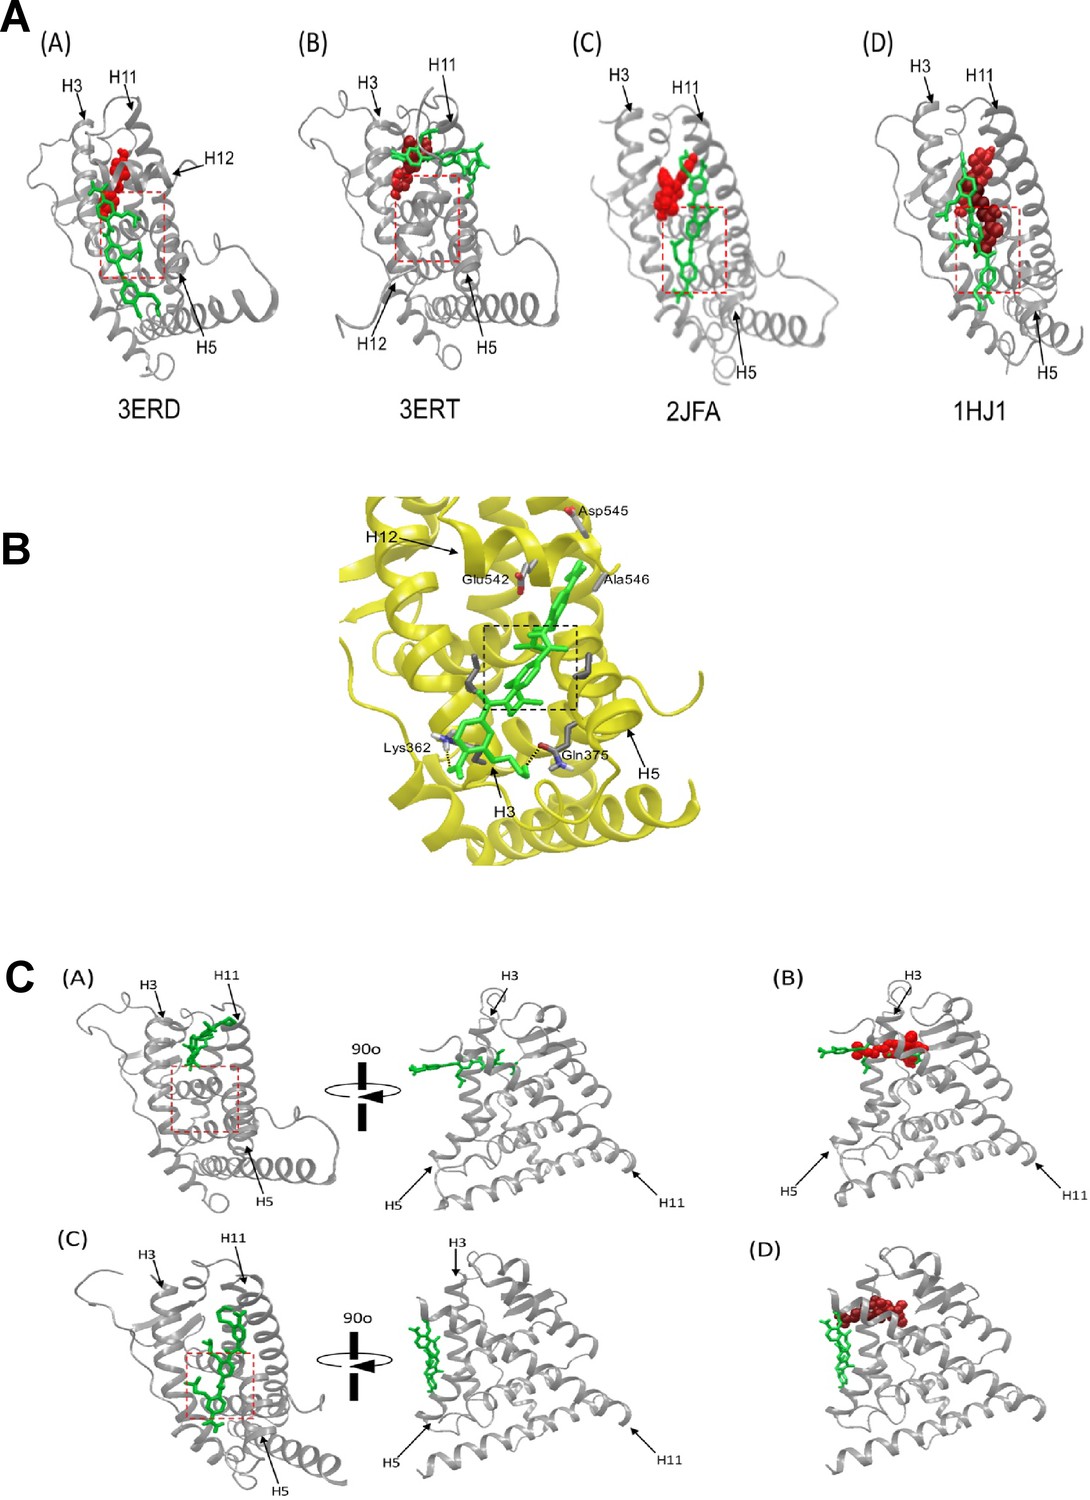
(A) Docking studies of ERX-11 on different ER crystal structures shows that ERX-11 (green) can interact with ER, either in the presence of agonist diethylstilbesterol (red) (A: 3ERD.pdb), an antagonist, tamoxifen (red) (B: 3ERT.pdb), a corepressor peptide (red) (C: 2JFA.pdb) or a fulvestrant analog (ICI164,384) (red) (D:1HJ1). Importantly, tamoxifen displaces ERX-11 from its preferred binding site on ER to a secondary site. The AF2-binding pocket is outlined in the red dotted box. (B) Model showing the side chains and interactions of ERX-11 with residues in the ER protein using 1L2I.pdb structure. (C) Docking structure of ERX-11 on ER crystal structures of 3ERT and 5ACC with the deletion of the helix 12. (A) ERX-11 (green) binds to the tamoxifen-binding site, away from the AF2 domain (boxed in red). (B) Superimposition of ERX-11 (green) and tamoxifen (red) showing the overlap in their binding sites. (C) ERX-11 (green) still binds to the AF2 domain with the deletion of the helix 12 of 5ACC. (D) Superimposition of ERX-11 (green) and SERD (red) showing no overlap in their binding sites.
Figure 2—figure supplement 7

Model describing interaction between ER (purple) and ERX-11 (green) in presence of agonist (yellow) (A), SERD (orange) (B) or tamoxifen (red)(C).
Note that in the presence of tamoxifen, ERX-11 binds to a secondary weaker affinity site on ER. Similarly, the interaction between ER▲12 (blue) and ERX-11 is modeled in the absence of agonist (D), SERD (E) or tamoxifen (F). Note that in the presence of tamoxifen, ERX-11 does not bind to a secondary site on ER▲12.
Figure 3 with 1 supplement
ERX-11 globally disrupts ER-mediated transcriptome.
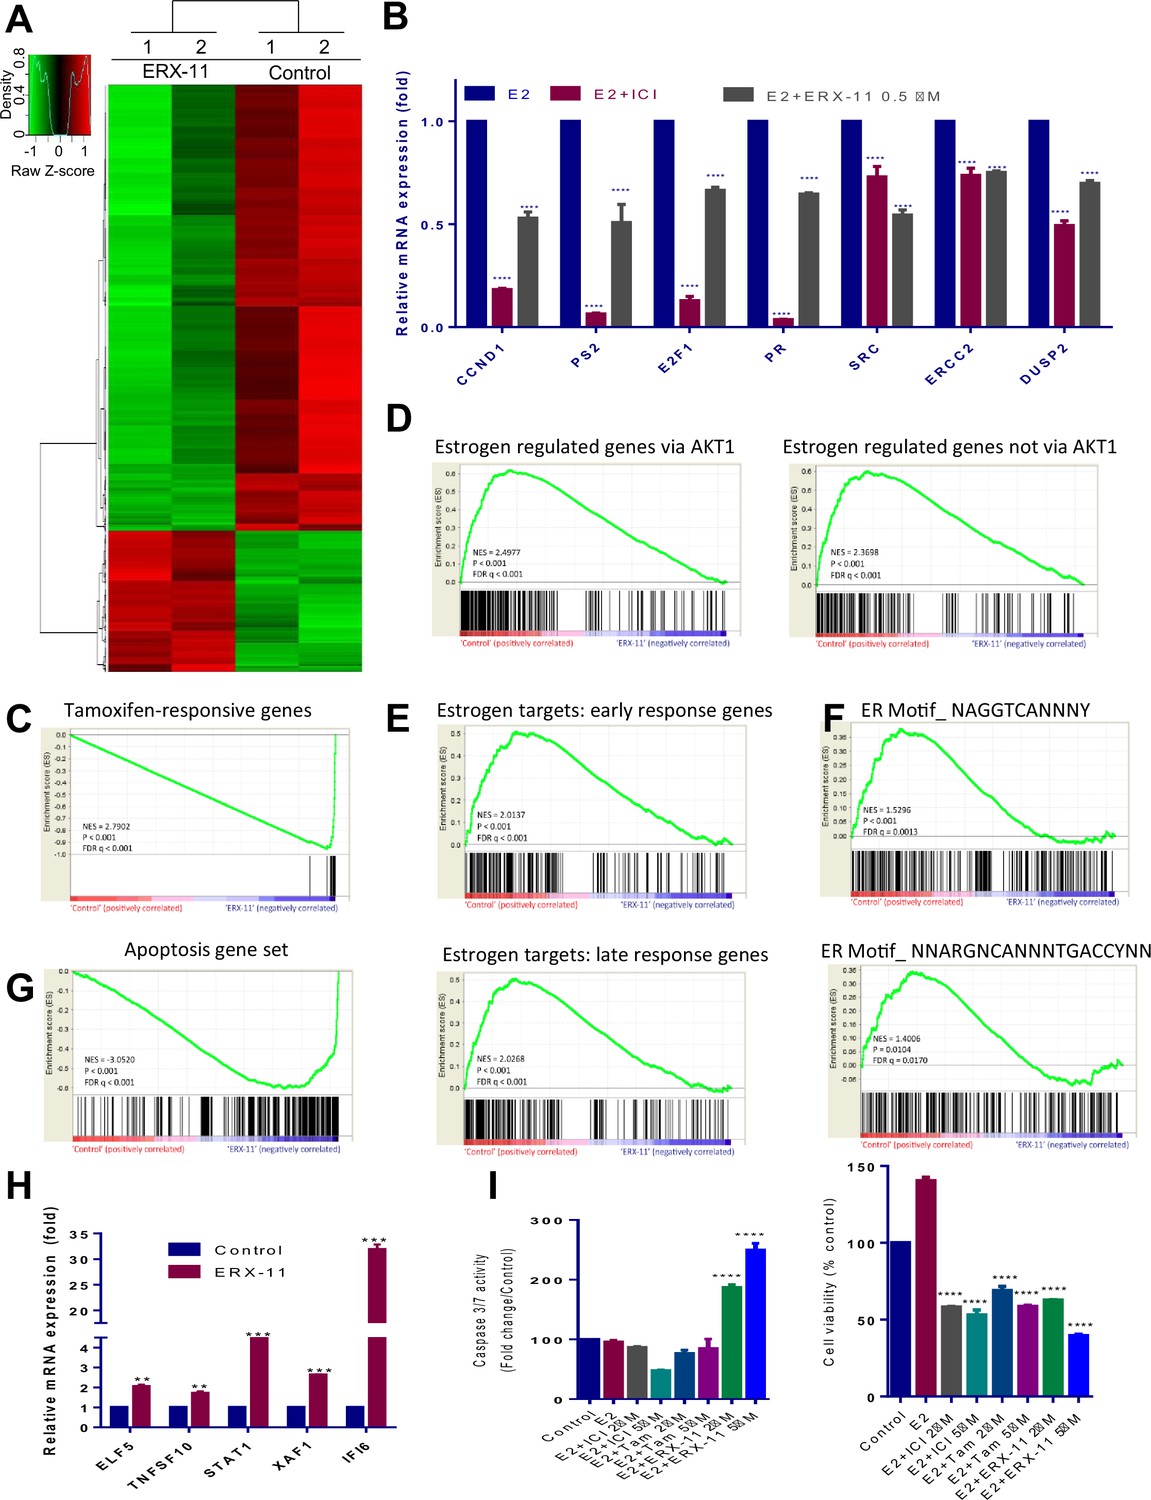
Total RNA was isolated from the ZR-75 cells that were treated with either vehicle or ERX-11 for 48 hr and subjected to RNA sequencing. The heat map of differentially expressed genes between vehicle and ERX-11 is shown (A). ZR-75 cells were treated with either vehicle or ERX-11 for 48 hr, and the selective genes representing each pathway were validated using RTqPCR (B). Gene set enrichment analysis (GSEA) testing correlation between ERX-11–regulated gene and both the tamoxifen-responsive (M3283) and estradiol-responsive genes set (M2234 and M2230) (C, D). GSEA analysis testing the correlation of ERX-11-regulated genes with signatures of early (M5906) and late (M5907) response estrogen targets as well as genes driven by consensus ER motifs (M17968 and M6101) (E, F). GSEA analysis of correlation of ERX-11 regulated gene set with an apoptotic gene set (M15912) (G). ERX-11 upregulated apoptotic genes were validated by RT-qPCR analyses (H). Data are represented as mean ±SEM. **p<0.01; ***p<0.001. Effect of indicated doses of Tam, ICI and ERX-11 on cell viability (CellTiter-Gloassay, Promega) and caspase3/7 activity (Caspase-Glo 3/7 Assay, Promega) in ZR-75cells (I). Data shown are the means of ±SEM performed in triplicate wells. ****p<0.0001.
Figure 3—figure supplement 1
ERX-11 treatment has potential to promote apoptosis.
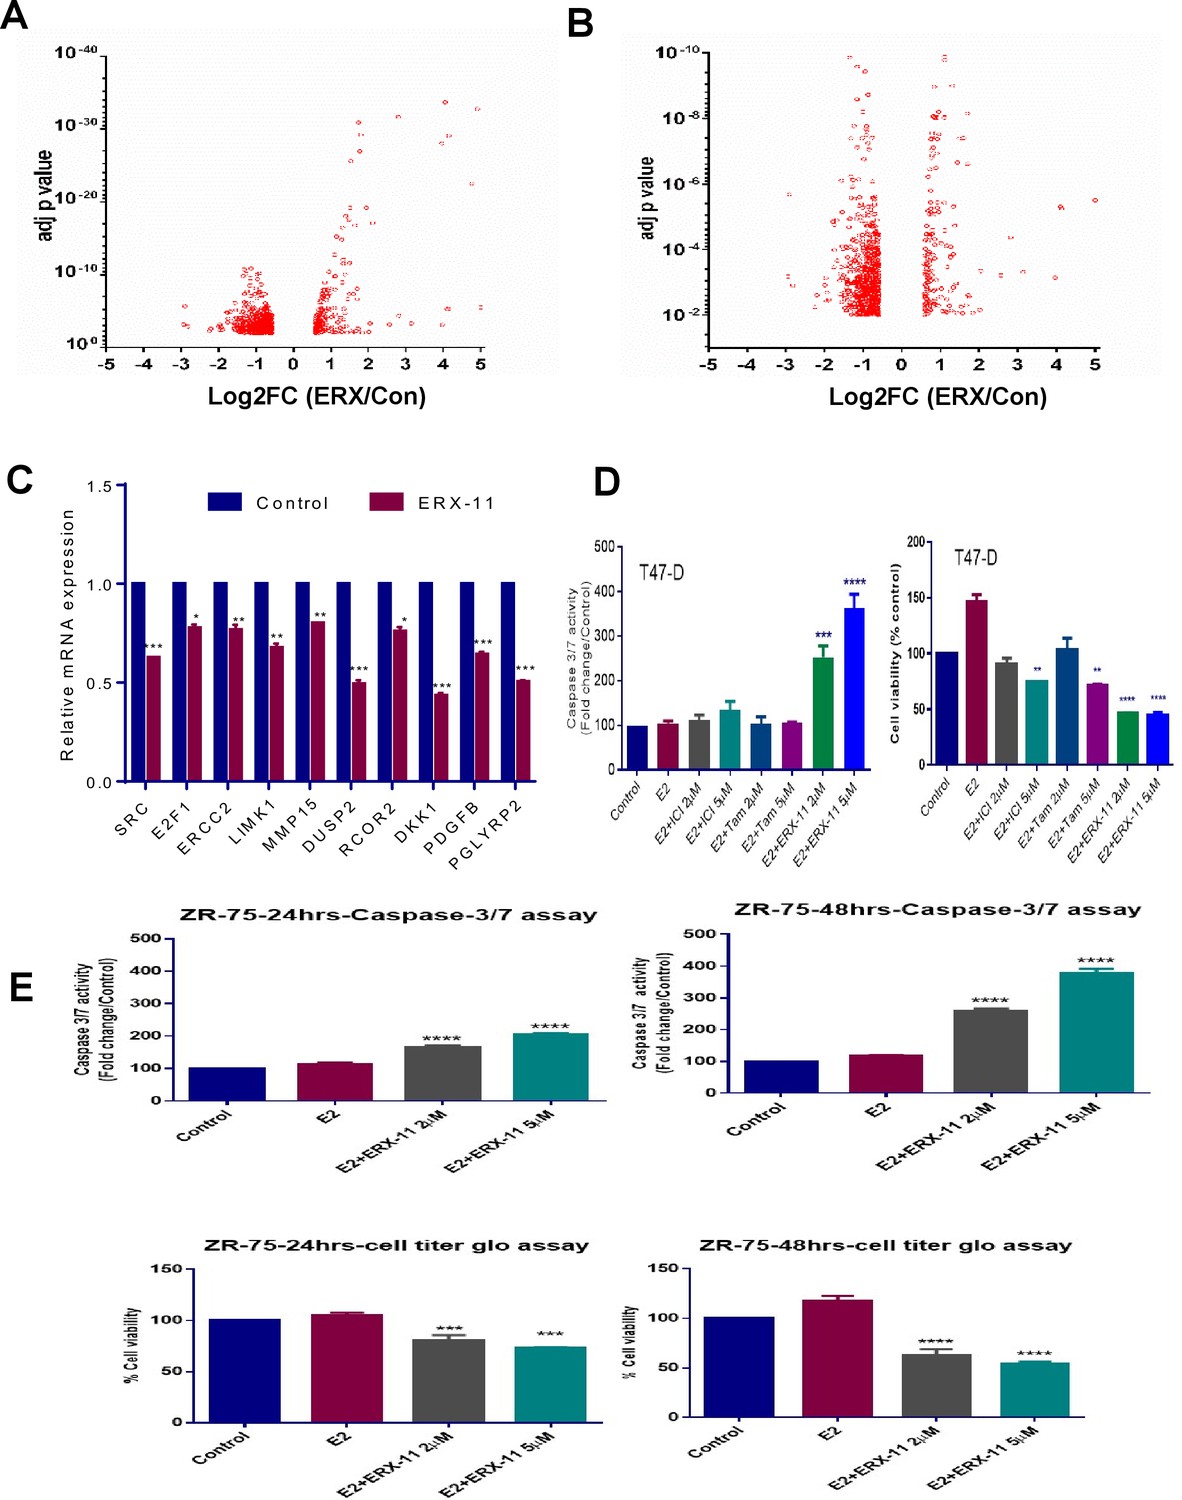
(A) Volcano plot of statistical significance (adjusted p value) against RPKM fold-change (FC) between vehicle and ERX-11 treated ZR-75 cells. Only significantly changed genes (p<0.01 and FC > 1.5) were shown in the graph. (B) Panel B shows the volcano plot in more detail. (C) RT-qPCR validation of the expression of some of the top down regulated genes by ERX-11 treatment (*p<0.05; **p<0.01; ***p<0.001). (D) Effect of indicated doses of Tam, ICI, ERX-11 on cell viability (right panel) and caspase 3/7 activity (Caspase-Glo 3/7 Assay, Promega) in T-47D cells (left panel). (E) Effect of ERX-11 treatment (24 hr, 48 hr) on cell viability (bottom panel) and caspase 3/7 activity in ZR-75 cells (upper panel).p<1***p<0.001****p<0.0001).
Figure 4 with 1 supplement
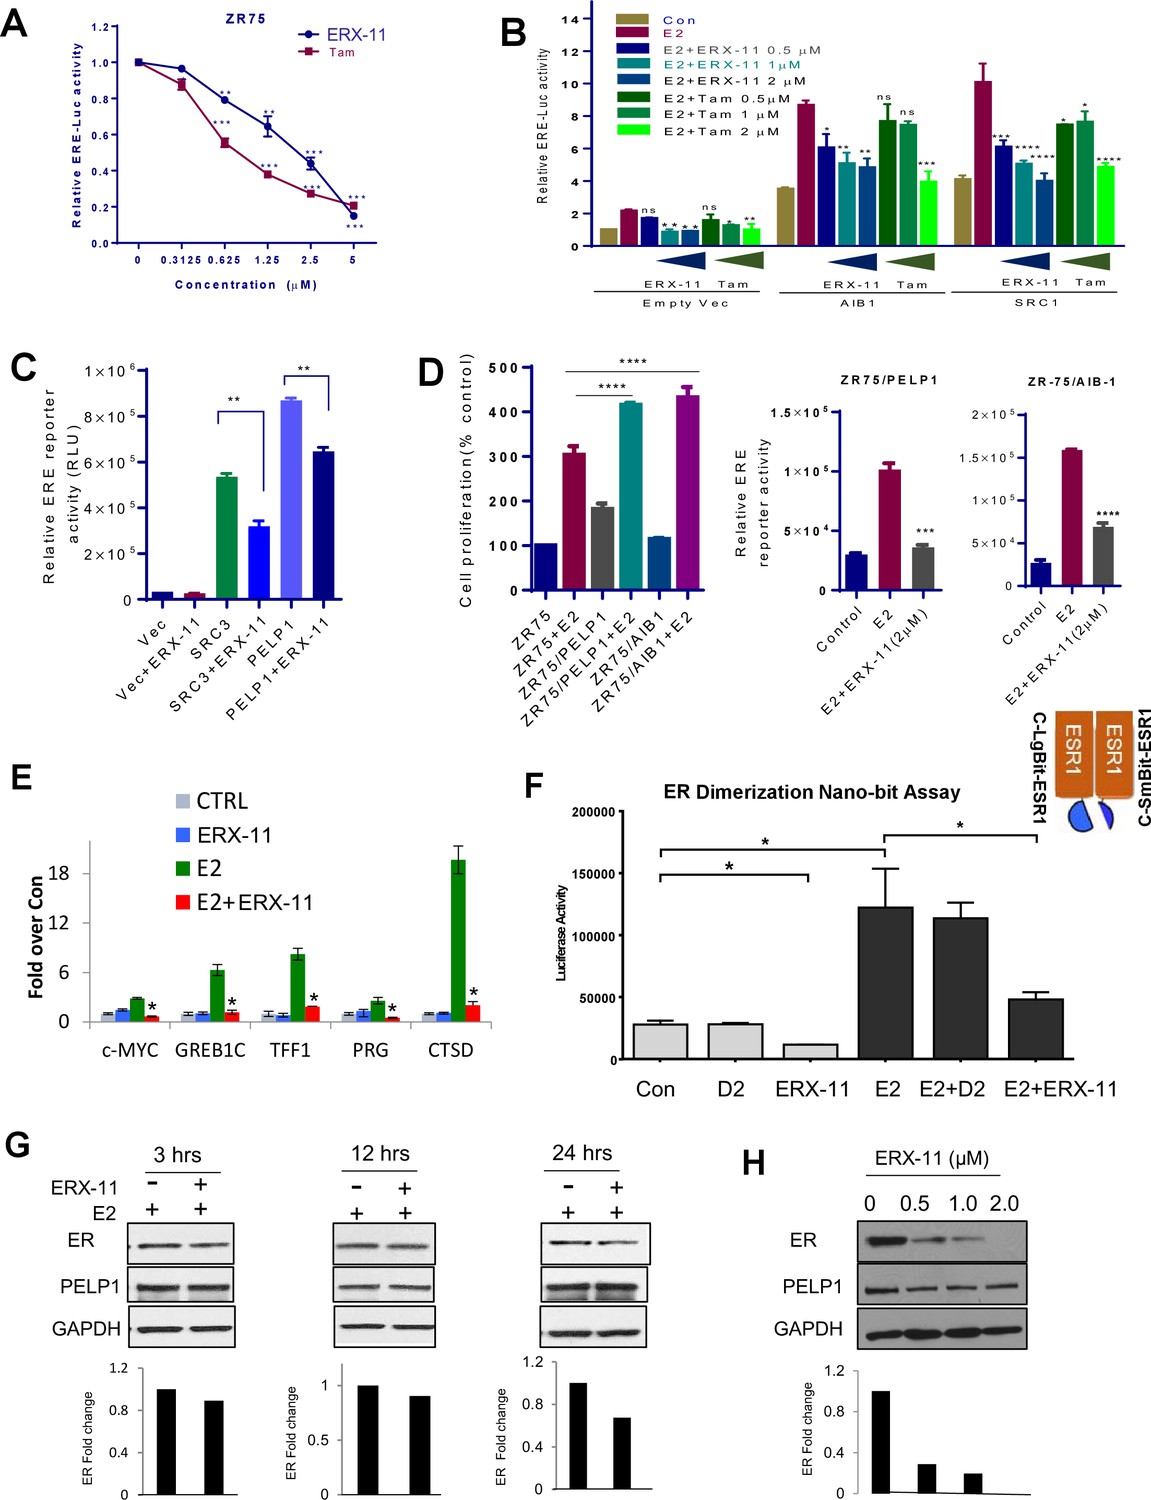
ERX-11 affects ER ligand-dependent and independent transcriptional activity.
ZR-75 cells stably transfected with ER and ERE-Luc vectors were treated with E2 (10−8M) in the presence of indicated concentrations of ERX-11 or tamoxifen. After 24 hr, the reporter gene activity was measured (A). HEK-293T cells stably transfected with ERE-Luc vector were transiently transfected with control or coregulator-expressing vector along with ER expression vector and after 24 hr treated with indicated doses of ERX-11 or tamoxifen along with E2 (10−8M). After 24 hr, the reporter gene activity was measured (B). HEK-293T cells stably transfected with ERE-Luc vector were transiently transfected with control or coregulator-expressing vectors along with ER expression vector and after 24 hr treated with ERX-11. After 24 hr, the reporter gene activity was measured (C). Cell proliferation of ZR-75 model cells stably expressing PELP1 or AIB1 was measured using Cell Titer Glo assay (D, left panel). ZR-75 model cells stably expressing PELP1 or AIB1 were transfected with ERE-Luc reporter vector. After 48 hr, the cells were treated with ERX-11 and the reporter activity was measured 24 hr later (D right panel). The effects of ERX-11 on ER recruitment at ER target genes were examined using a ChIP assay in MCF-7 cells (E). The effect of ERX-11 on ER dimerization as evaluated by the NanoBiT luciferase assay is shown (F). ZR-75 cells were treated with E2 with or without ERX-11 (1 µM) for the indicated time, and the stability of ER was determined using western blotting. Quantitation of ER levels compared to control (E2-treated cells) was shown after normalizing to the levels of GAPDH (G). ZR-75 cells were treated with ERX-11 for 5 days, and the status of ER was determined using Western blotting (H). Data shown are the means of ±SEM performed in triplicate wells. *p<0.05; **p<0.01; ***p<0.001; ****p<0.0001.
Figure 4—figure supplement 1
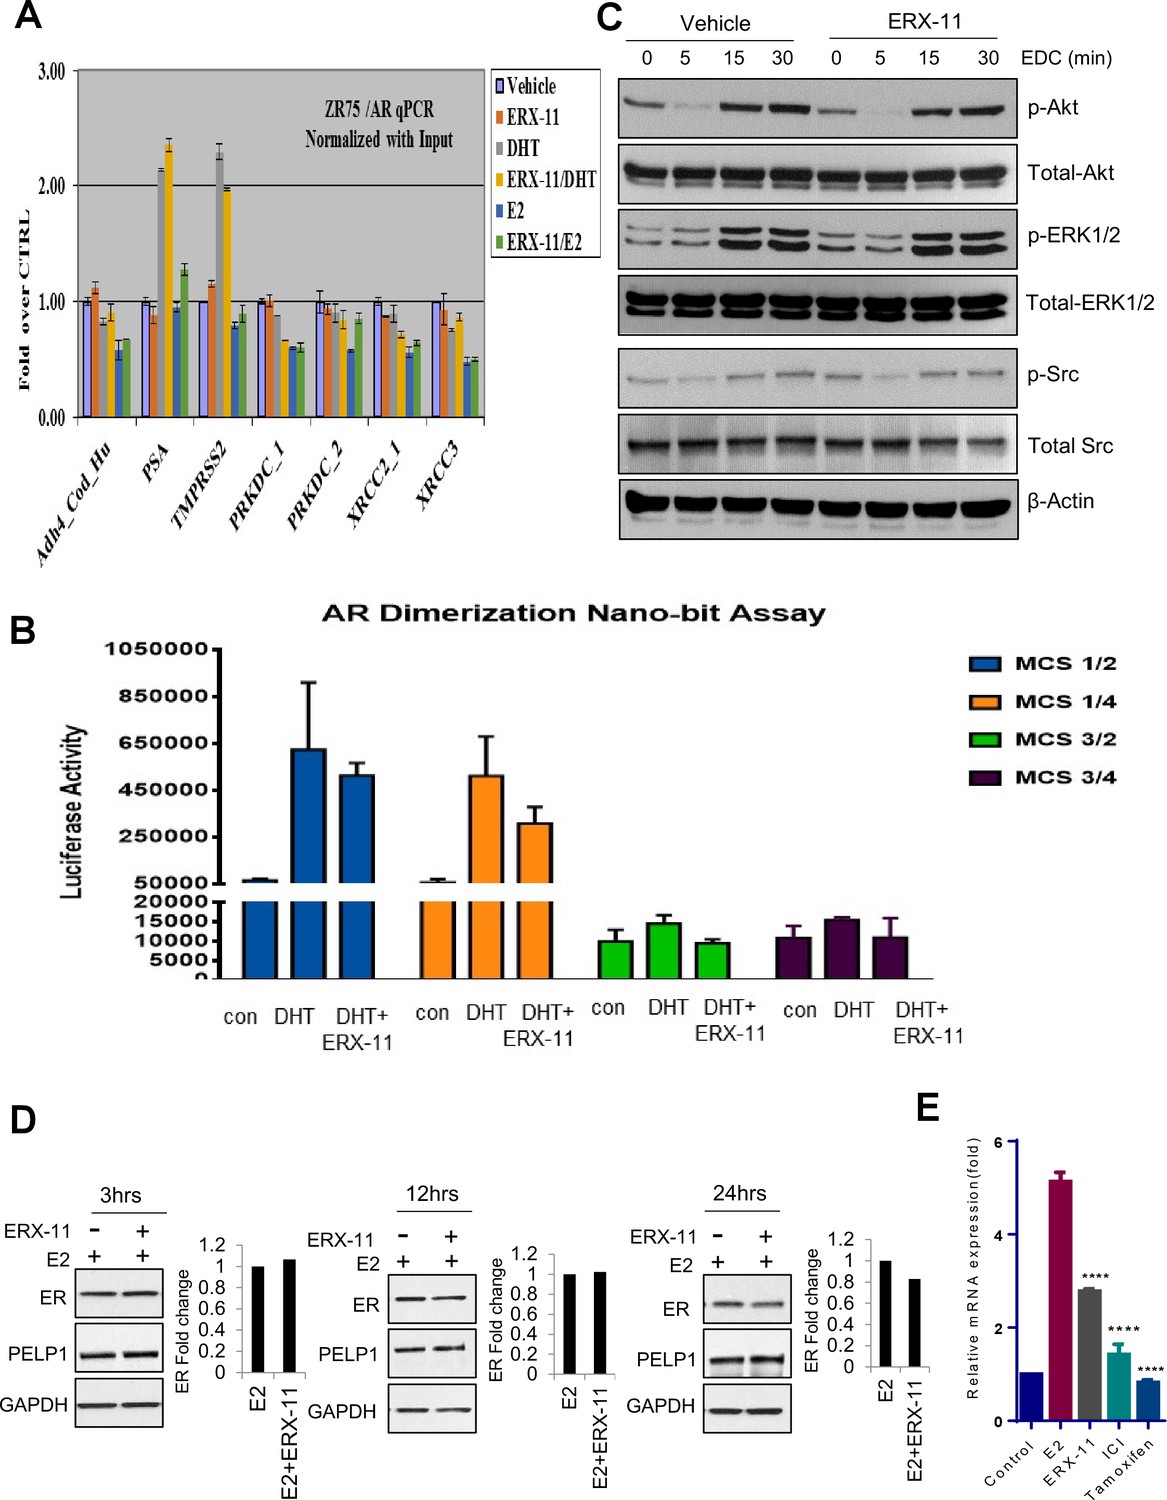
Effect of ERX-11 on AR functions, E2 mediated non-genomic actions and ER stability.
(A) Evaluation of the effect of ERX-11 on AR DNA binding to its target sequences. (B) The effect of ERX-11 on AR dimerization as evaluated by the NanoBiT luciferase assay. (C) Evaluation of the effect of ERX-11 on estrogen dendrimer conjugates (EDCs, that uniquely localize in the cytoplasm) on the activation of estrogen-mediated non-genomic signaling. (D) T-47D cells were treated with E2 with or without ERX-11 for indicated times and the stability of ER was determined using western blotting. Quantitation of ER fold change over control (E2 treated) was shown and is normalized with GAPDH. (E) T-47D cells were treated with ERX-11 or Tam or ICI for seven days and level of ESR1 was measured using RTqPCR.
Figure 5 with 2 supplements
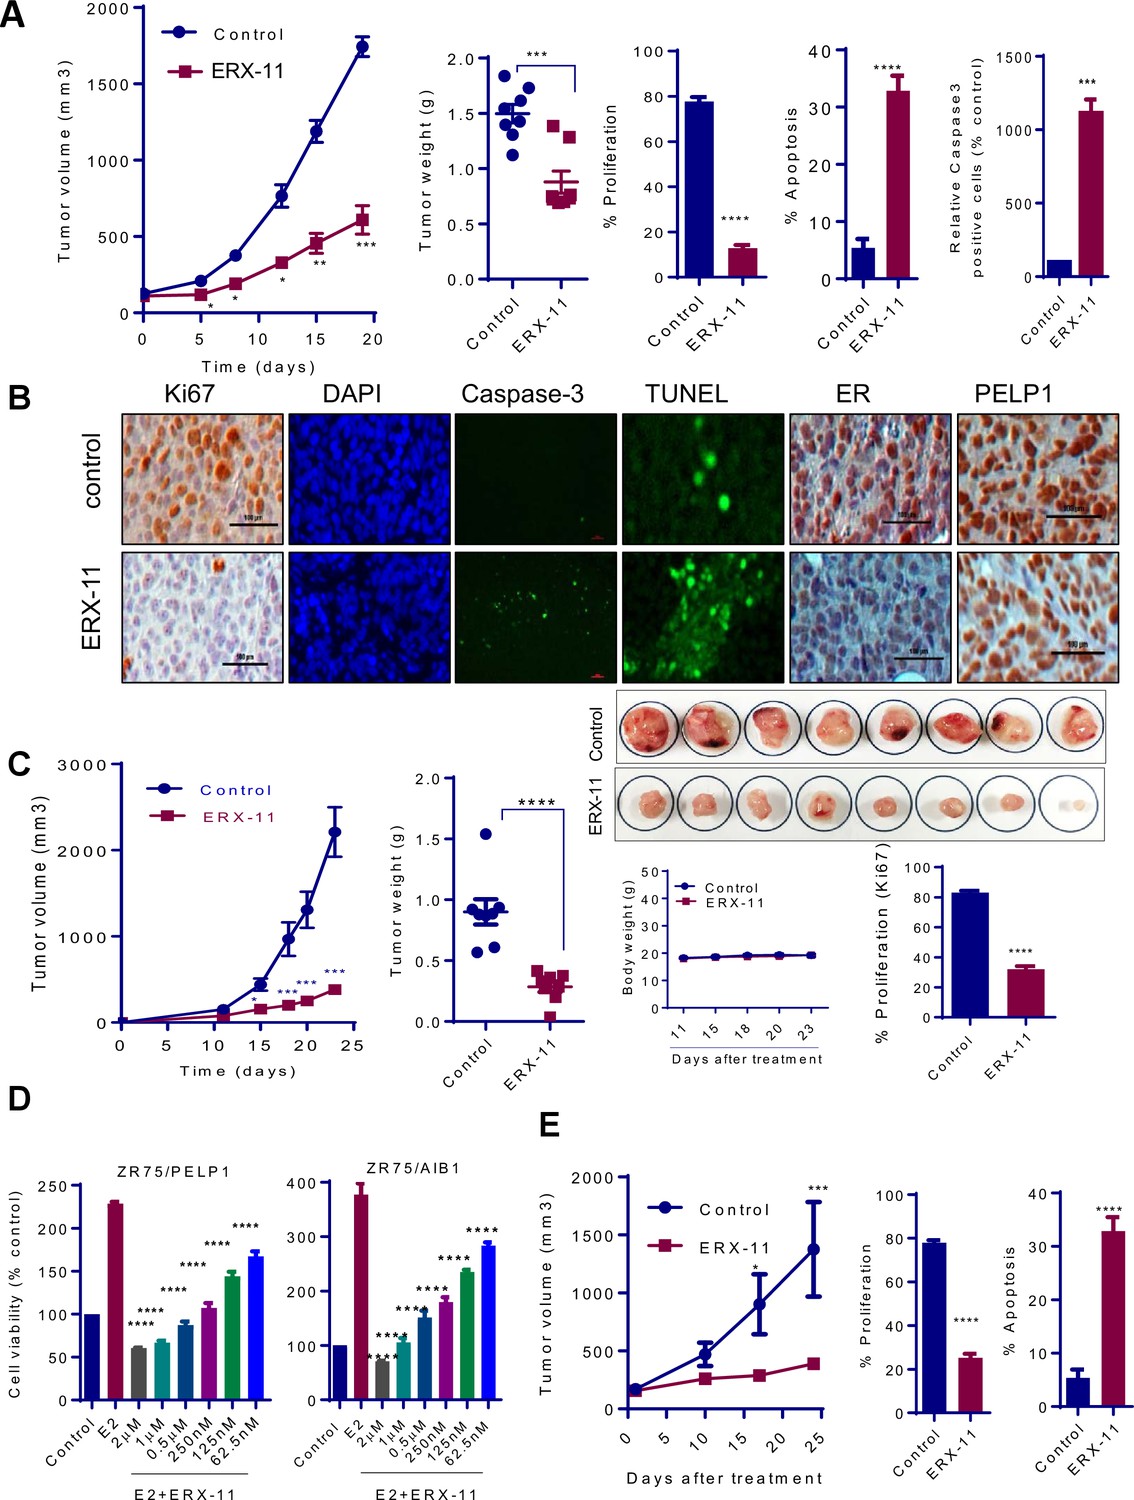
ERX-11 inhibits the growth of ER-positive, syngeneic and coregulator-driven breast tumors in vivo.
ER-positive ZR-75 cells were injected into the mammary fat pads of nude mice implanted subcutaneously with E2 pellet. After 2 weeks, mice with xenografts were treated with vehicle or 10 mg/kg/day of ERX-11 (n = 8) by oral gavage. Tumor growth was measured at the indicated time points. Tumor volume is shown in the graph (A). The weights of the control or ERX-11-treated tumors at the time of necropsy are shown. Ki-67 expression as a marker of proliferation was analyzed by IHC and quantitated. Apoptosis was measured using Caspase3 activation and by using TUNEL assay, and the number of TUNEL-positive and cleaved caspase 3 cells were counted in five different fields and plotted as histogram. DAPI was used to visualize the nuclei (A, B). Representative IHC analysis of ER and PELP1 performed on xenograft tumors that were treated with or without ERX-11 (B). Effect of ERX-11 on the growth of ER-positive D2A1 syngeneic tumors. Small pieces of D2A1 syngeneic tumors were implanted subcutaneously into the BALB/c mice. After 1 week, mice (n = 8) were treated with vehicle or ERX-11 (20 mg/kg/day). Tumor growth was measured at indicated time points. The body weights and extirpated tumor weights are shown. Ki-67 expression was analyzed by IHC and quantitated (C). The effect of ERX-11 on the coregulator-driven cell survival was measured by MTT assay using ZR-75 cells stably expressing SRC3/AIB1 or PELP1 (D). MCF-7-PELP1 cells were injected into the mammary fat pad of nude mice (n = 5) implanted with an estrogen pellet. After 3 weeks, mice were treated with vehicle or ERX-11 (10 mg/kg/day). Tumor volume, status of Ki-67 and apoptosis was shown (E). Data shown are the means of ±SEM. *p<0.05, **p<0.01, ***p<0.001, ****p<0.0001.
Figure 5—figure supplement 1

Characterization of ERX-11 treated tumors.
(A) Body weights of mice implanted with ZR-75 xenograft tumors treated with vehicle or ERX-11. (B) Characterization of D2A1 model cells: (A) Western blot analysis of D2A1 cell lysates. Murine mammary lysate and E0771 lysate was used as positive control. (B) Effect of tamoxifen on the growth of D2A1 cells was measured by MTT assay. (C) IHC analysis of ER on D2A1 xenografts. (C) D2A1 tumors treated with or without ERX-11 were analyzed for Ki-67 expression as a marker of proliferation and apoptosis using TUNEL assay. (D) MCF-7-PELP1 tumors treated with or without ERX-11 were analyzed for Ki-67 expression (as a marker of proliferation) and apoptosis using TUNEL assay.
Figure 5—figure supplement 2
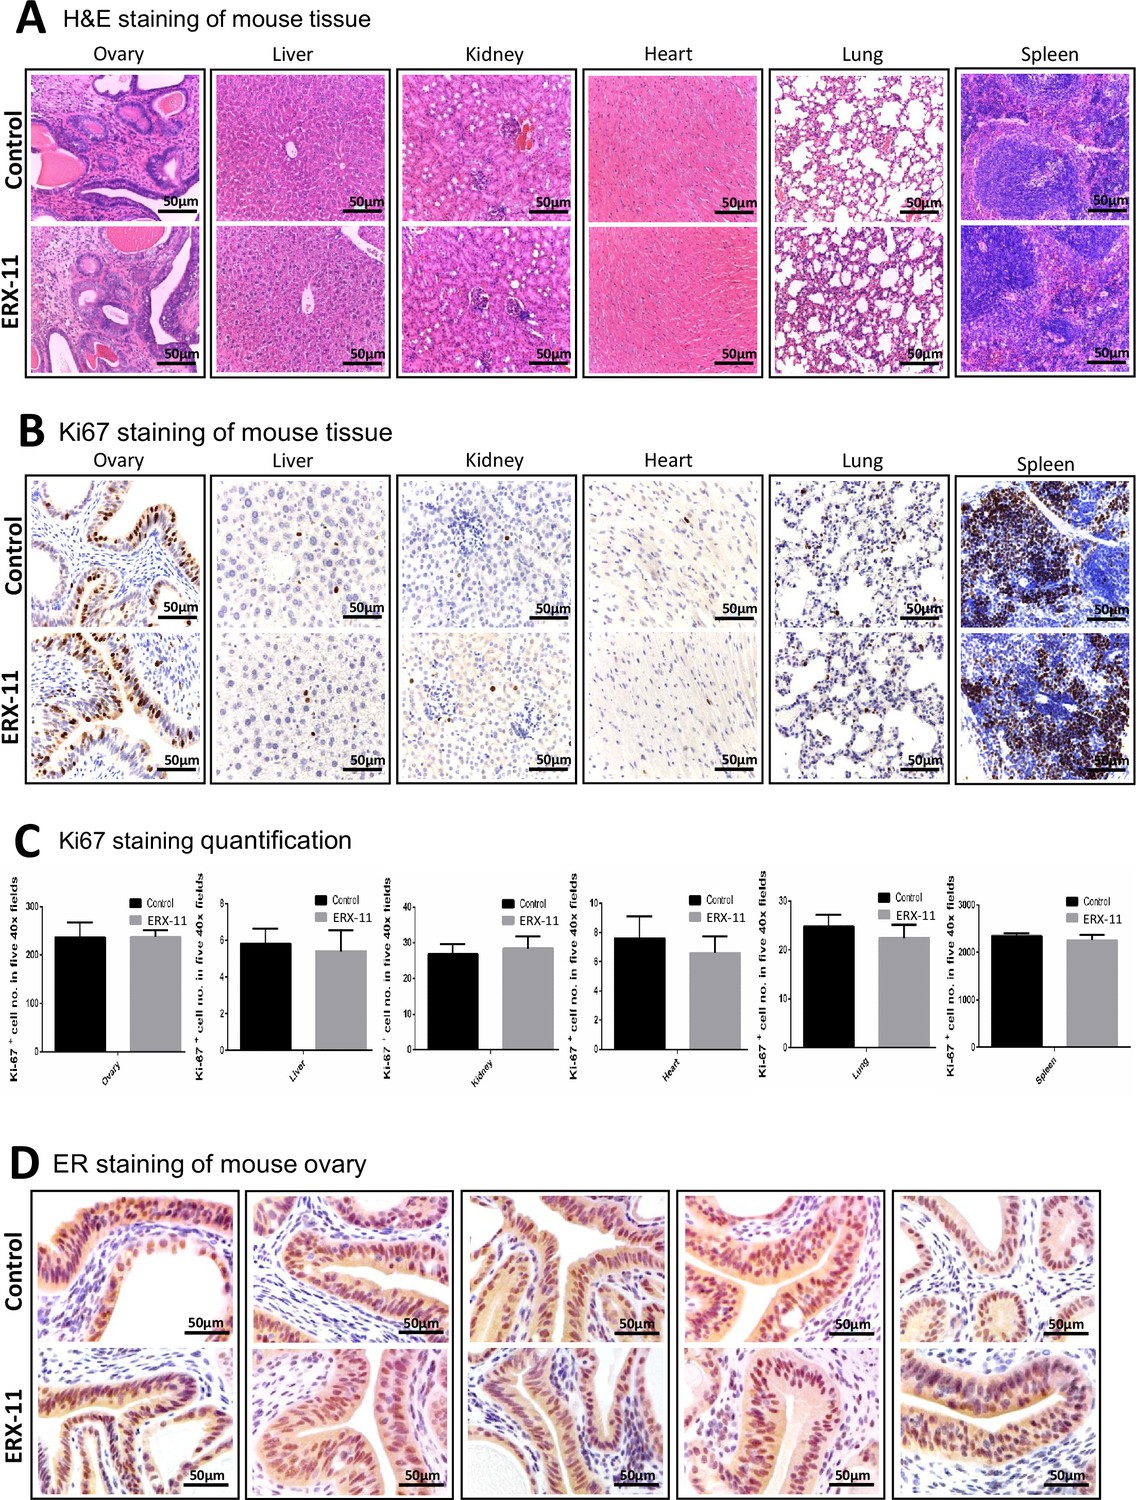
Normal tissues collected from mice that were treated with vehicle or ERX-11 were examined for toxicity.
(A) Effect of ERX-11 on various tissues as seen by H and E. (B) Effect of ERX-11 on Ki67 staining. (C) Effect of ERX-11 on Ki67 with quantitation. (D) Effect of ERX-11 on ER staining in the ovary.
Figure 6 with 1 supplement
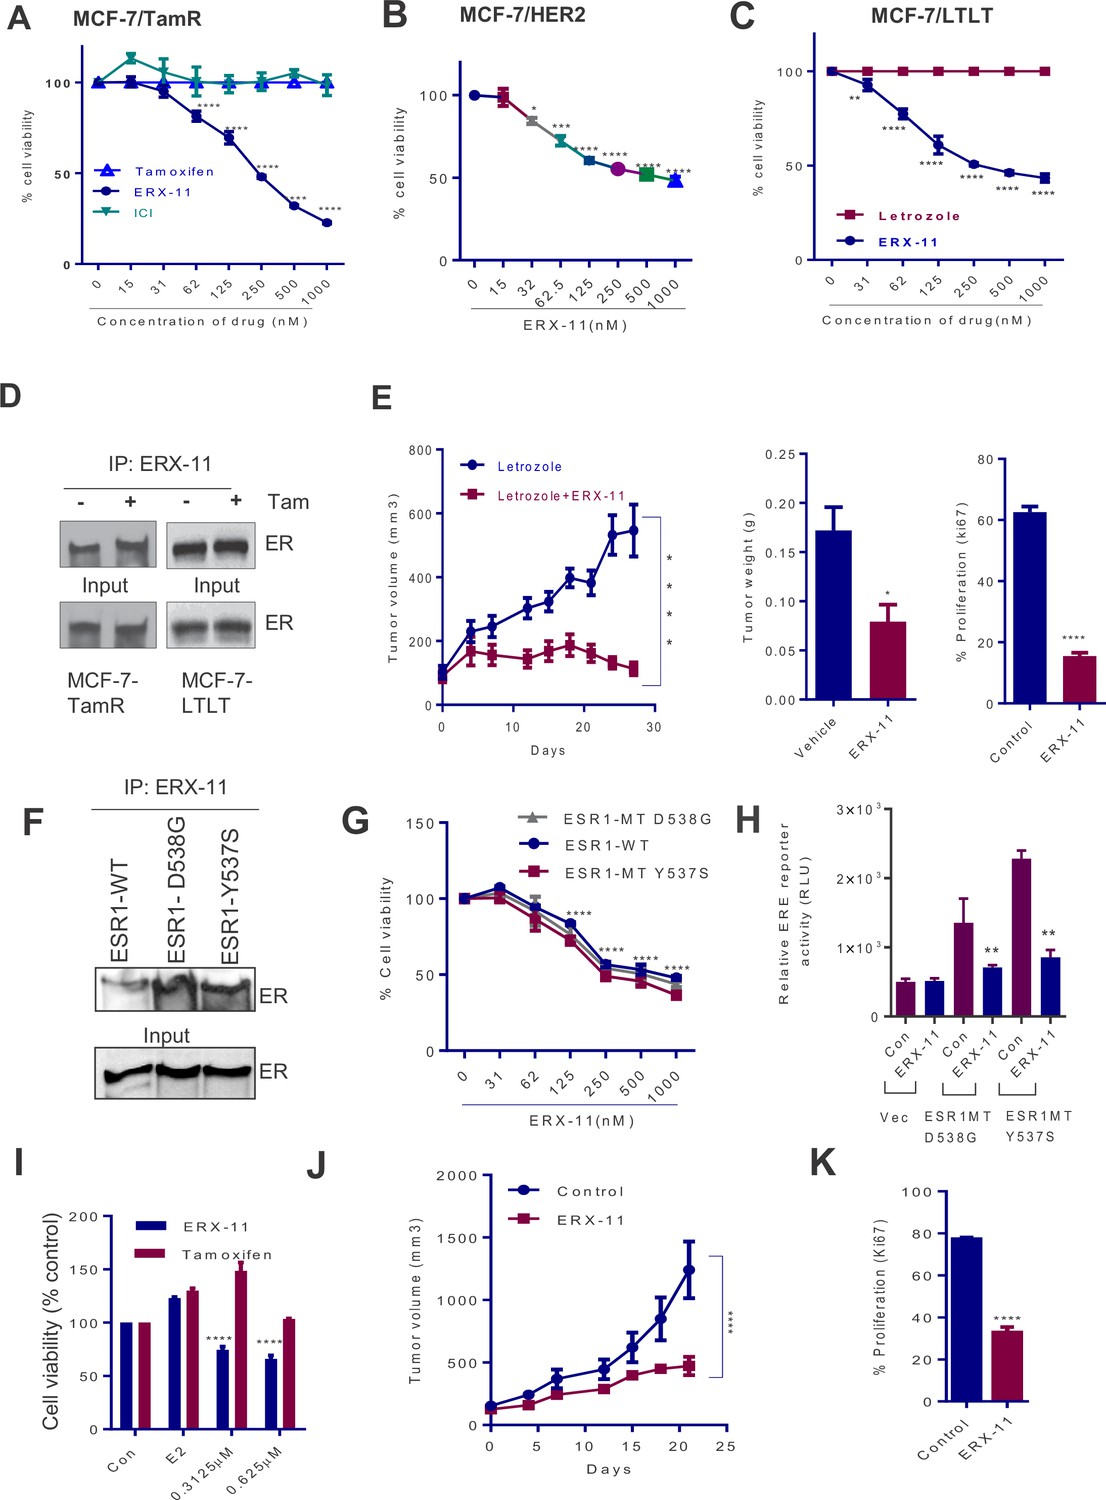
ERX-11 reduces the growth of ER positive and ER-MT endocrine-therapy-resistant tumors.
Cell viability assays evaluated the effect of ERX-11 on Tamoxifen-resistant MCF-7-TamR cells (A), tamoxifen-resistant MCF-7/HER2 cells (B) and letrozole-resistant MCF-7-LTLT cells (C). ICI was used as control. Results are represented as mean ± SEM. *p<0.05; **p<0.01; ***p<0.001; ****p<0.0001. MCF-7-TamR and MCF-7-LTLT cells were cultured in 1 µM tamoxifen or 1 µM letrozole, respectively, and nuclear lysates were subject to biotin-ERX-11 pull down followed by western blotting with ER antibody (D). Following implantation and growth of ER-positive letrozole-resistant xenografts in nude mice (n = 8), mice were treated with control or ERX-11 (20 mg/kg/day). Tumor volume, tumor weight and Ki-67 status of control and treated tumors was shown (E). Nuclear extracts prepared from HEK-293T cells transiently transfected with WT- or MT-ER expression plasmids and analyzed for interaction between WT- and MT-ER to the biotin-ERX-11 using avidin pulldown followed by western blot analysis (F). Effect of ERX-11 on the cell viability of ZR-75 ESR1-KO cells stably expressing ESR1-WT or ESR1-Y537S mutant or ESR1-D538G mutant (G) was measured using MTT assay. ER-negative MDA-MB-231 cells were co-transfected with ERE reporter along with WT-ESR1 and MT-ESR1 plasmids. After 48 hr, the cells were treated with ERX-11 (500 nM) and the reporter activity was measured 24 hr later (H). Effect of ERX-11 and tamoxifen on the cell viability of ZR-75 cells stably expressing ER-Y537S mutant was measured using MTT assays (I). ZR-75 cells stably expressing ER-Y537S mutant were injected into the mammary fat pads of nude mice implanted subcutaneously with an estrogen pellet. After 2 weeks, mice with xenografts were treated with vehicle or ERX-11 (20 mg/kg/day, n = 6). Tumor growth was measured at indicated time points (J). Ki-67 expression was analyzed by IHC and quantitated (K). Data shown are the means of ± SEM. *p<0.05, **p<0.01, ***p<0.001, ****p<0.0001.
Figure 6—figure supplement 1
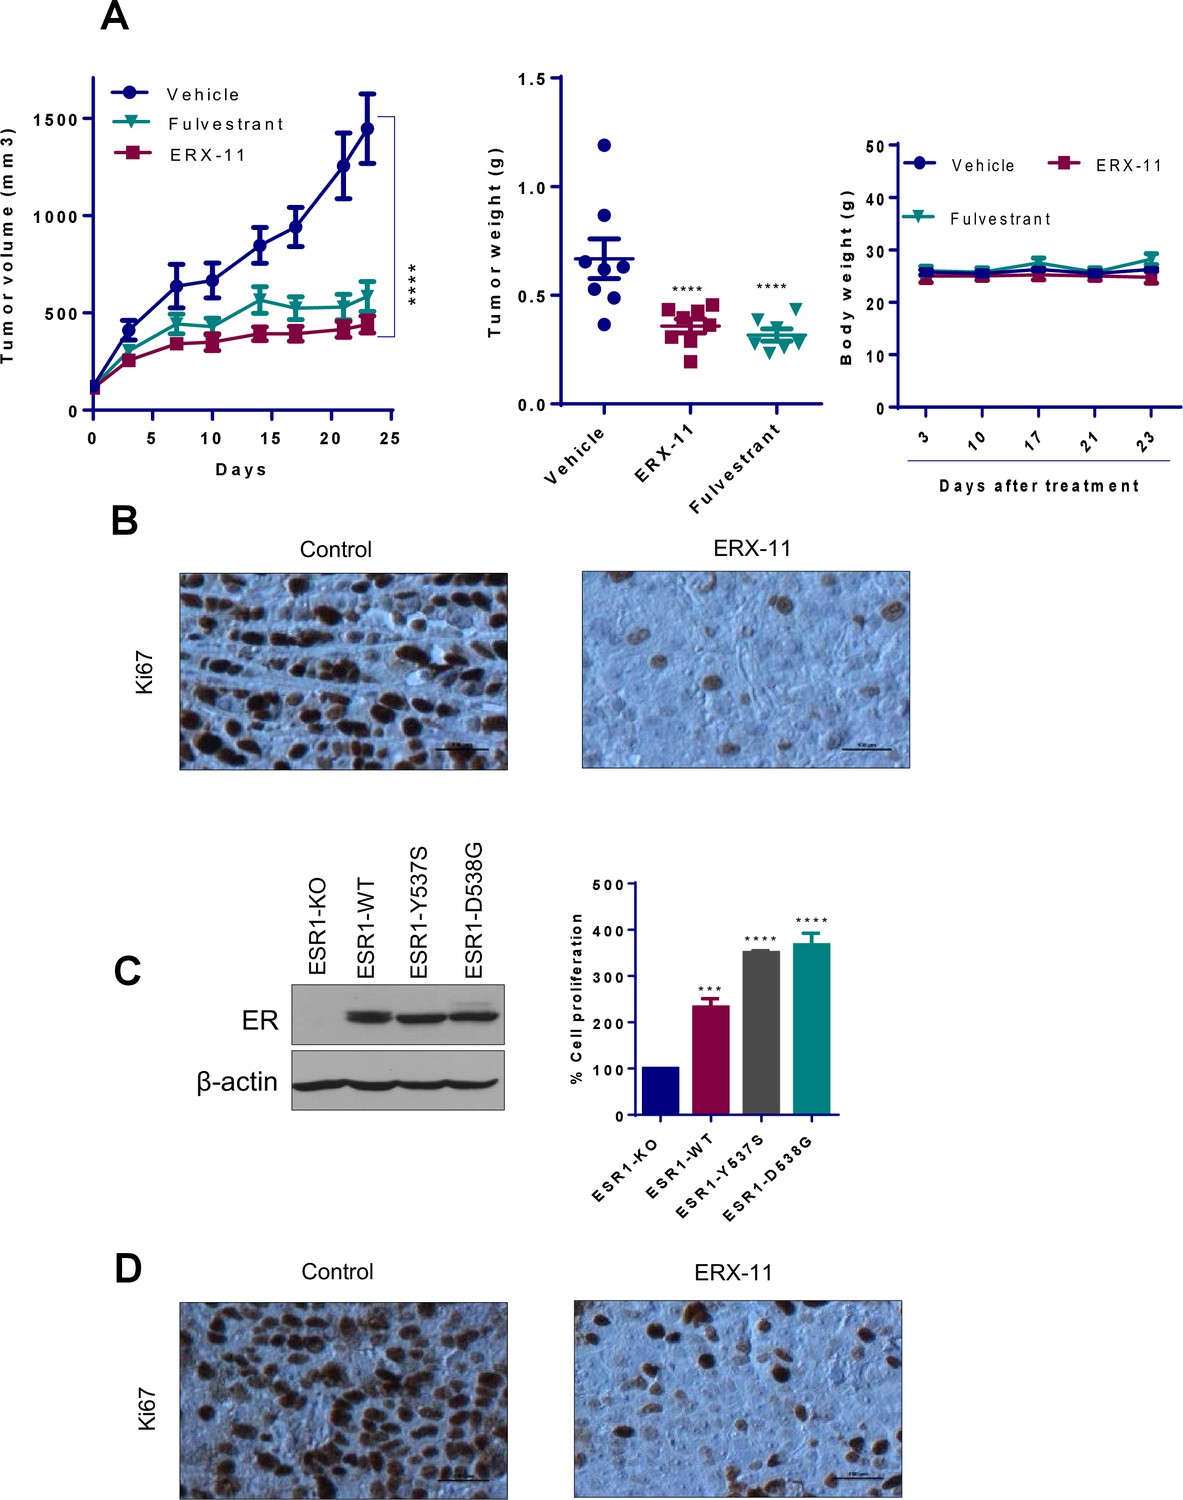
ERX-11 reduces the growth of ER-positive and ER-MT endocrine-therapy-resistant tumors.
(A) MCF-7-LTLT xenografts were treated with vehicle or ERX-11 or Fulvestrant. Tumor volume, tumor weights and body weights are shown****p<0.0001. (B) MCF-7-LTLT tumors treated with or without ERX-11 were analyzed for Ki-67 expression as a marker of proliferation. (C) ESR1 was knocked out in ZR-75 cells using CRISPR/Cas9 system and then stably transfected with WT-ESR1 or MT-ESR1 (537S, and 538G) and cell proliferation was measured ***p<0.001; ****p<0.0001. Mutant-ESR1 expressing cells showed higher rate of proliferation compared to WT-ER expressing cells. Expression of WT and mutant ESR1 in the model cells was analyzed using western analysis. (D) ZR-75-ESR1-MT Y537S tumors treated with vehicle or ERX-11 were analyzed for Ki-67 expression as a marker of proliferation.
Figure 7 with 1 supplement
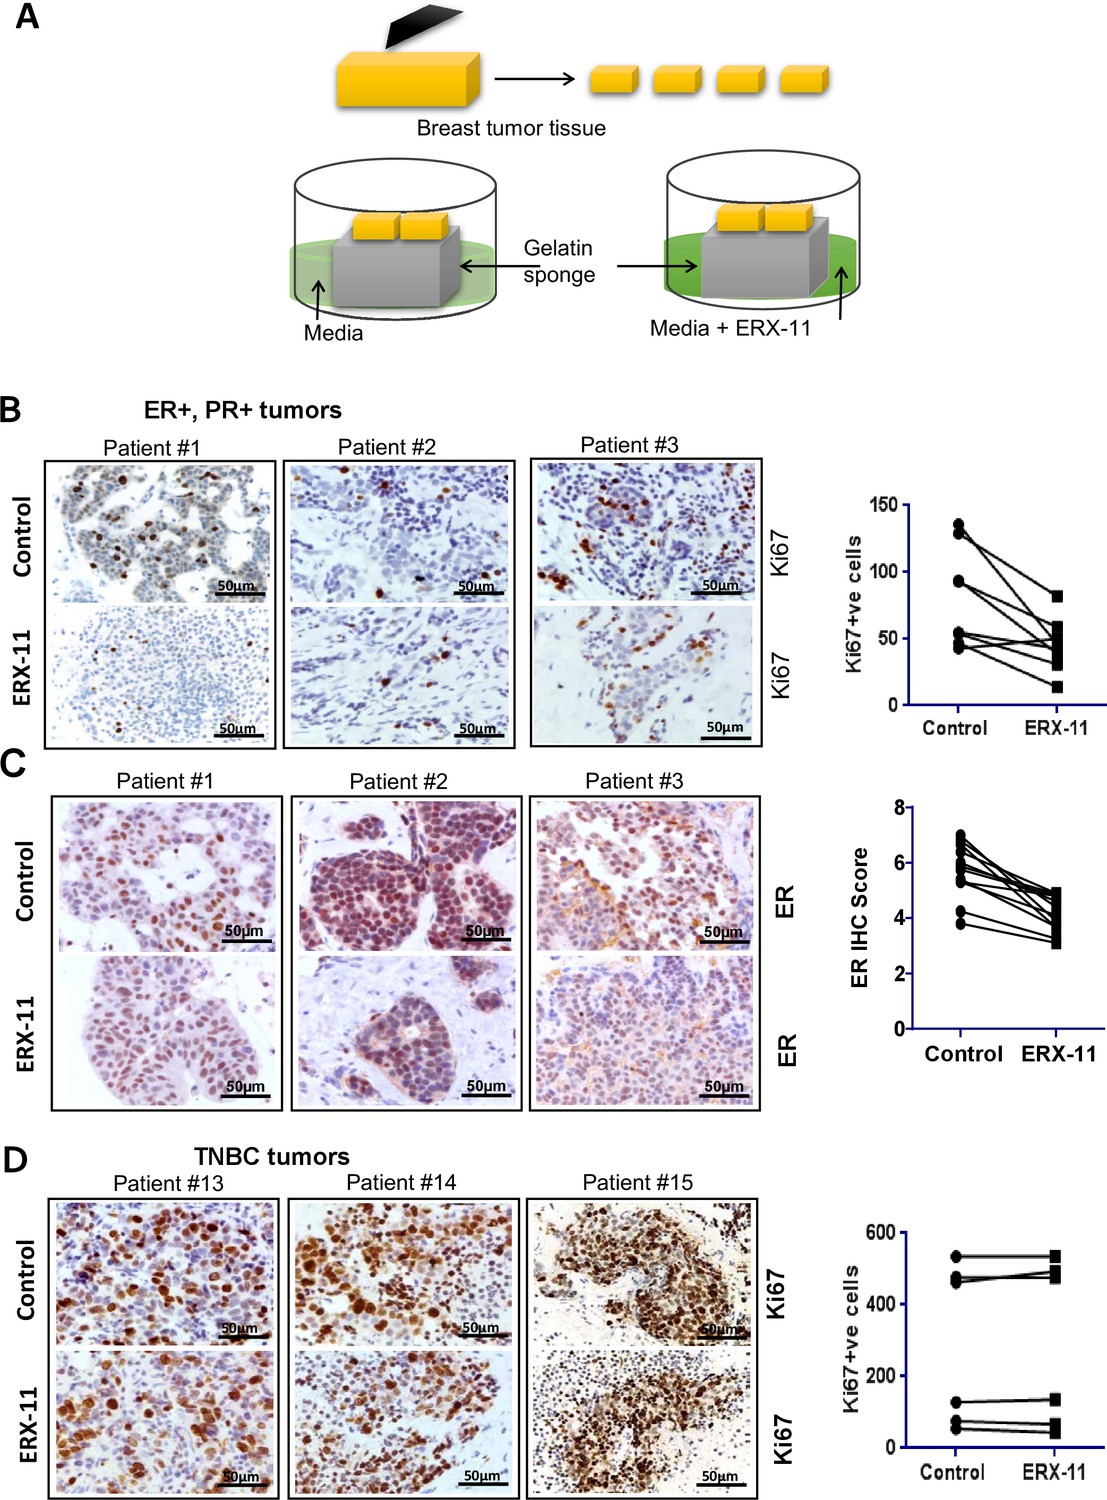
ERX-11 decreases the growth of patient-derived explants (PDEx): Schematic representation of ex vivo culture model is shown.
(A) The explants were treated with ERX-11 for 48 hr. Effect of ERX-11 on Ki67 expression in ER-positive tumors with representative sections from three individual tumors and overall trend are shown (B). Effect of ERX-11 on ER expression in three representative ER-positive tumors is also shown (C). Effect of ERX-11 on Ki67 expression in three representative ER-negative tumors is shown (D).
Figure 7—figure supplement 1
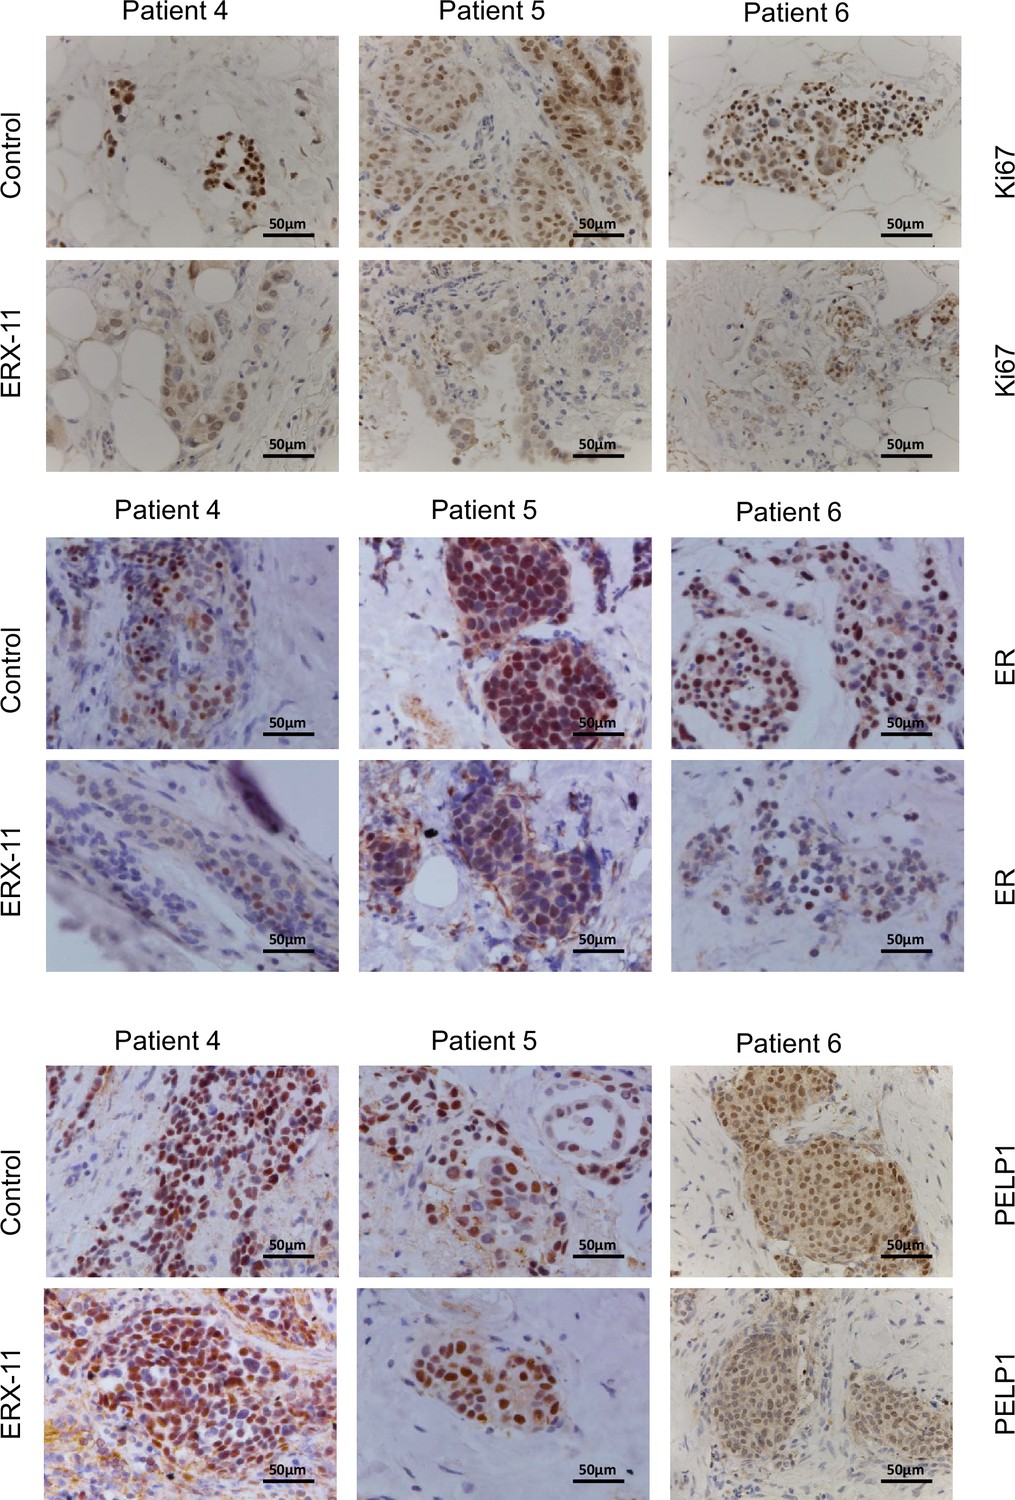
Effect of ERX-11 treatment on the status of ER.
Effect of ERX-11 treatment on ER + PR + patient-derived explants from three individual patients, as assessed by Ki67, ER and PELP1 immunohistochemistry.
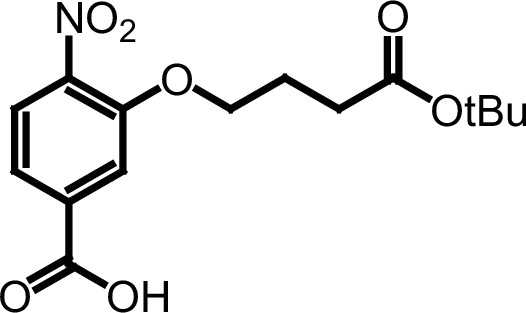
Appendix 1—chemical structure 1
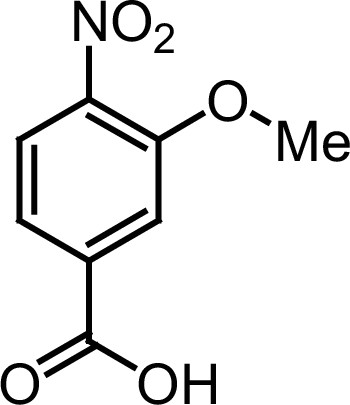
Compound 3a.
https://doi.org/10.7554/eLife.26857.032
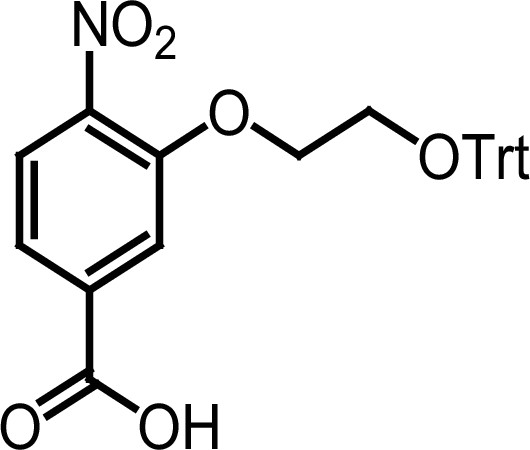
Appendix 1—chemical structure 2
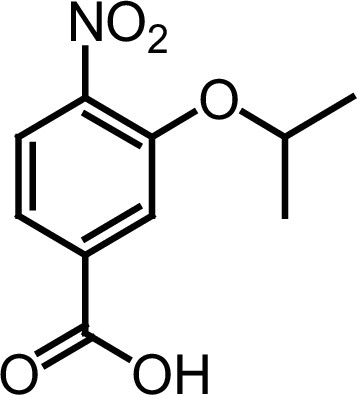
Compound 3b.
https://doi.org/10.7554/eLife.26857.033
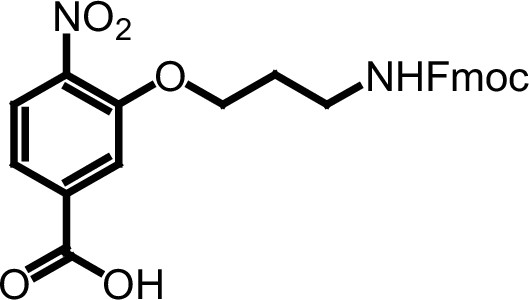
Appendix 1—chemical structure 3
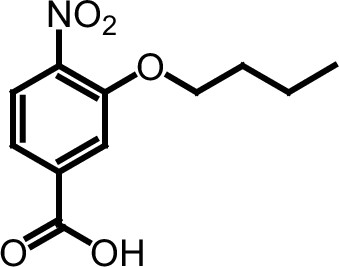
Compound 3c.
https://doi.org/10.7554/eLife.26857.034
Appendix 1—chemical structure 4
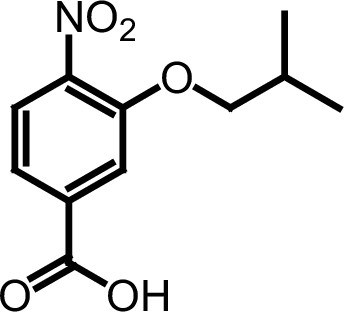
Compound 3d.
https://doi.org/10.7554/eLife.26857.035
Appendix 1—chemical structure 5

Compound 3e.
https://doi.org/10.7554/eLife.26857.036
Appendix 1—chemical structure 6
Compound 3f.
https://doi.org/10.7554/eLife.26857.037
Appendix 1—chemical structure 7
Compound 3g.
https://doi.org/10.7554/eLife.26857.038
Appendix 1—chemical structure 8
Compound 3i.
https://doi.org/10.7554/eLife.26857.039
Appendix 1—chemical structure 9
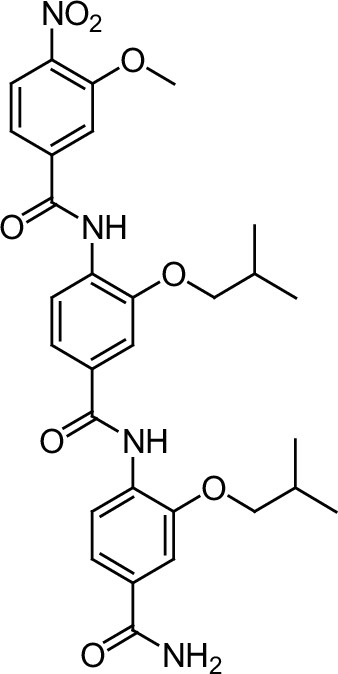
ERX-7.
https://doi.org/10.7554/eLife.26857.040
Appendix 1—chemical structure 10
ERX-8.
https://doi.org/10.7554/eLife.26857.041
Appendix 1—chemical structure 11
ERX-9.
https://doi.org/10.7554/eLife.26857.042
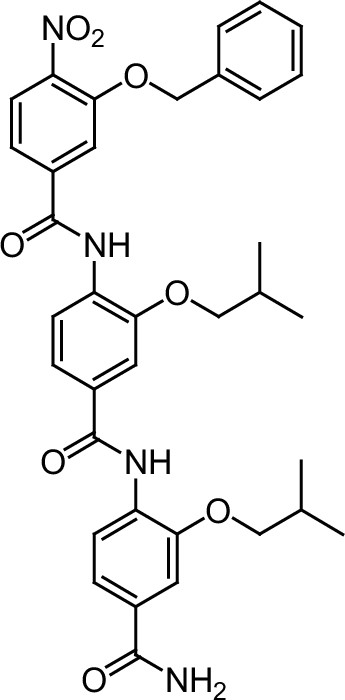
Appendix 1—chemical structure 12
ERX-5.
https://doi.org/10.7554/eLife.26857.043
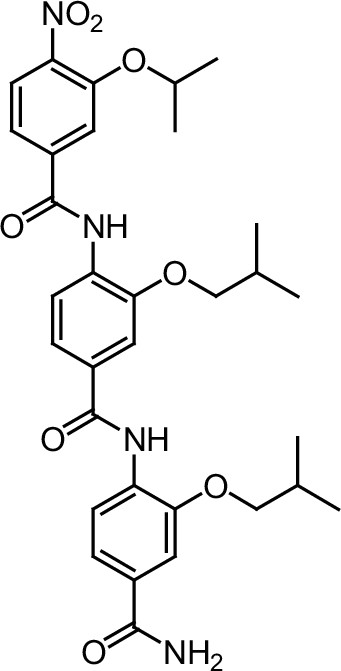
Appendix 1—chemical structure 13
ERX-13.
https://doi.org/10.7554/eLife.26857.044
Appendix 1—chemical structure 14

ERX-10.
https://doi.org/10.7554/eLife.26857.045
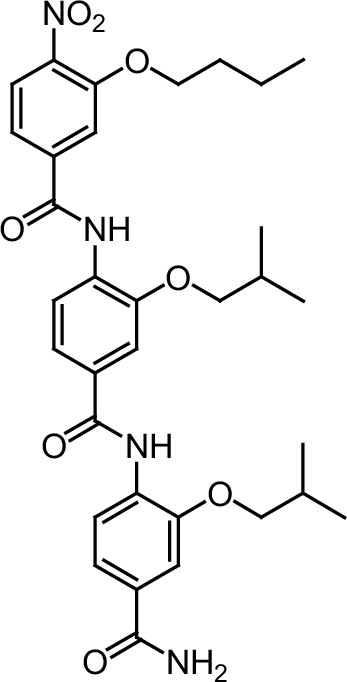
Appendix 1—chemical structure 15

ERX-12.
https://doi.org/10.7554/eLife.26857.046
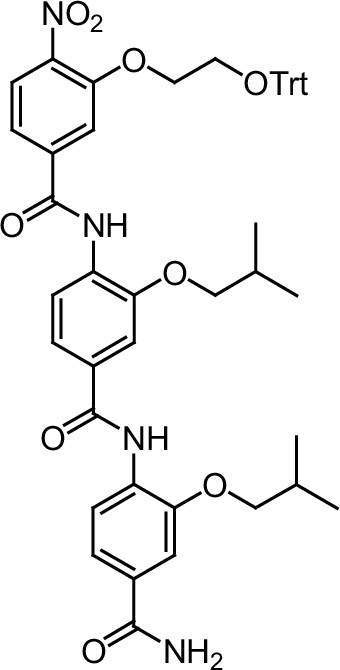
Appendix 1—chemical structure 16
Compound 8.
https://doi.org/10.7554/eLife.26857.047
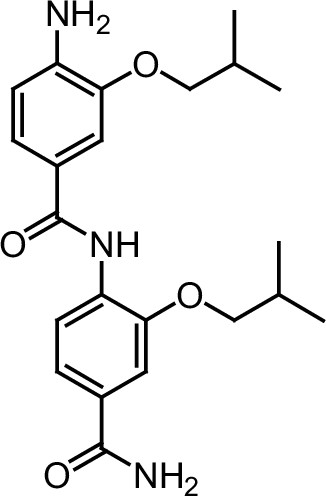
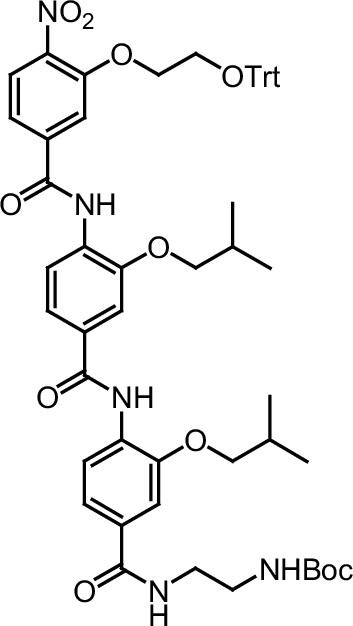
Appendix 1—chemical structure 17
Compound 9.
https://doi.org/10.7554/eLife.26857.048
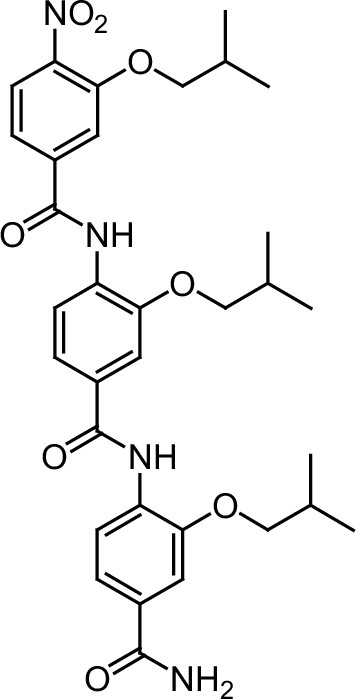
Appendix 1—chemical structure 18
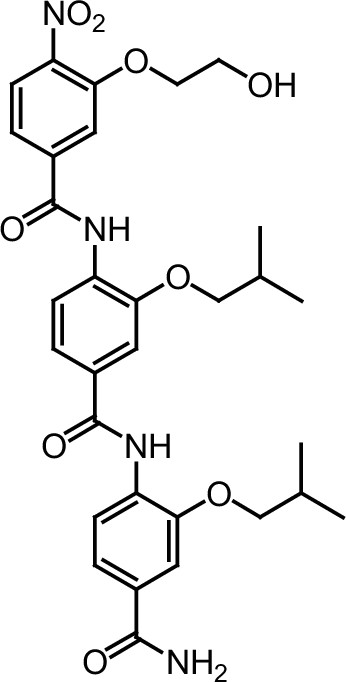
ERX-11.
https://doi.org/10.7554/eLife.26857.049
Appendix 1—chemical structure 19
Compound 10.
https://doi.org/10.7554/eLife.26857.050
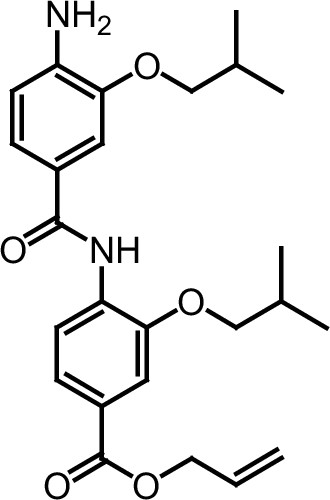
Appendix 1—chemical structure 20

Compound 11.
https://doi.org/10.7554/eLife.26857.051
Appendix 1—chemical structure 21
Compound 12.
https://doi.org/10.7554/eLife.26857.052
Appendix 1—chemical structure 22
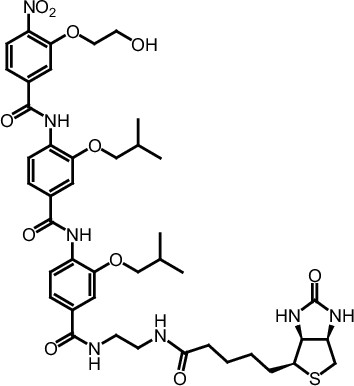
ERX-11-biotin.
https://doi.org/10.7554/eLife.26857.053
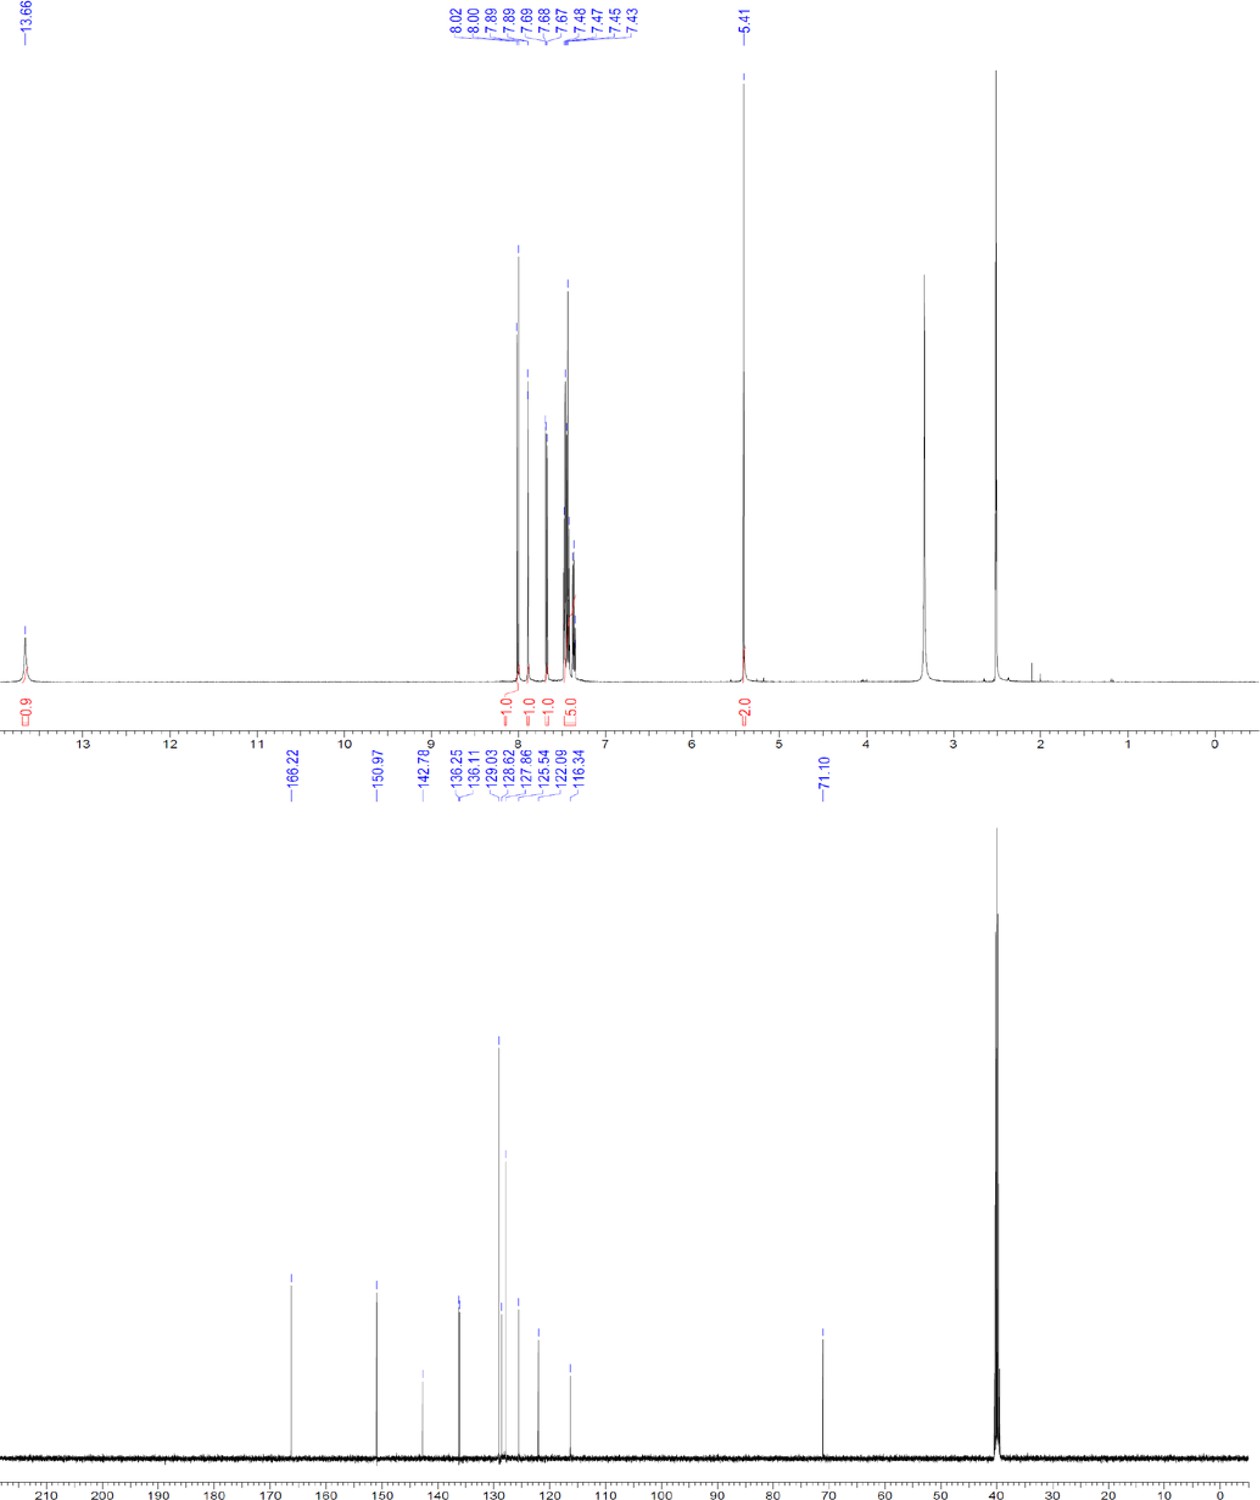
Appendix 1—figure 1
1H and 13C NMR of compound 3a.
https://doi.org/10.7554/eLife.26857.055
Appendix 1—figure 2

1H and 13C NMR of compound 3b.
https://doi.org/10.7554/eLife.26857.056
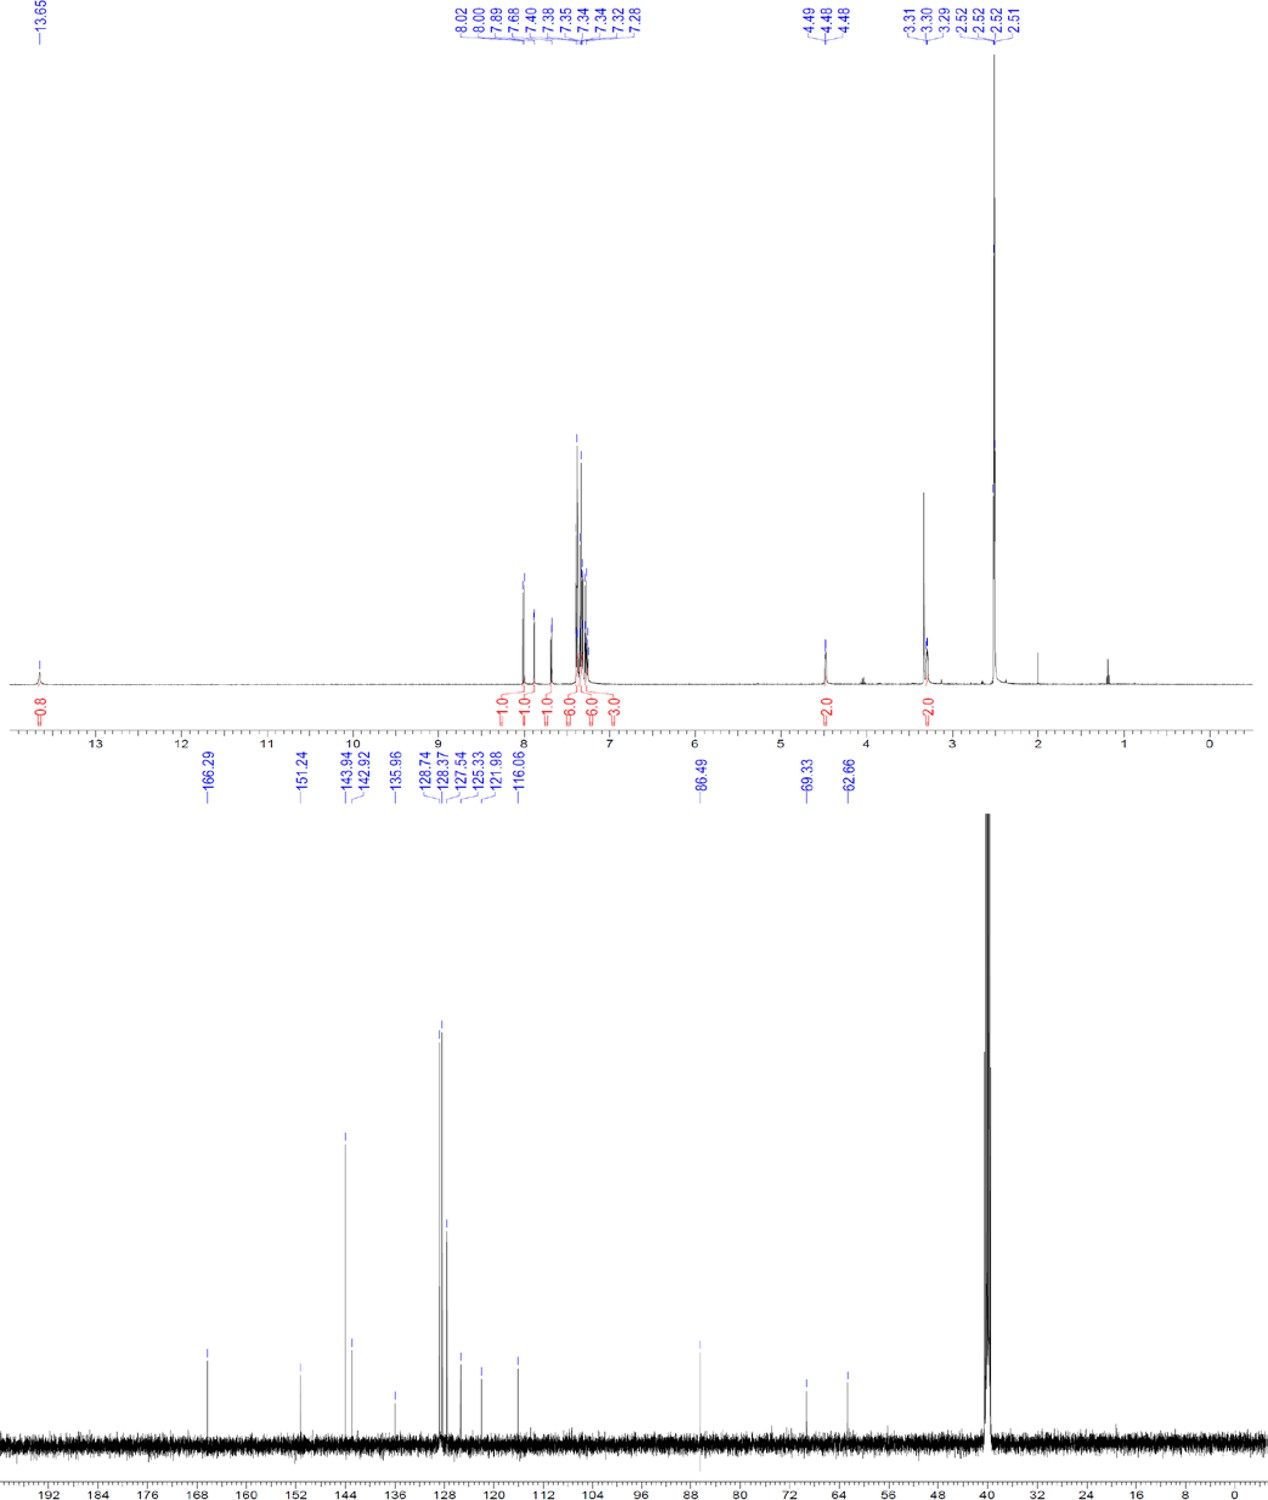
Appendix 1—figure 3
1H and 13C NMR of compound 3c.
https://doi.org/10.7554/eLife.26857.057
Appendix 1—figure 4
1H and 13C NMR of compound 3e.
https://doi.org/10.7554/eLife.26857.058
Appendix 1—figure 5
1H and 13C NMR of compound 3 f.
https://doi.org/10.7554/eLife.26857.059
Appendix 1—figure 6
1H and 13C NMR of compound 3 g.
https://doi.org/10.7554/eLife.26857.060
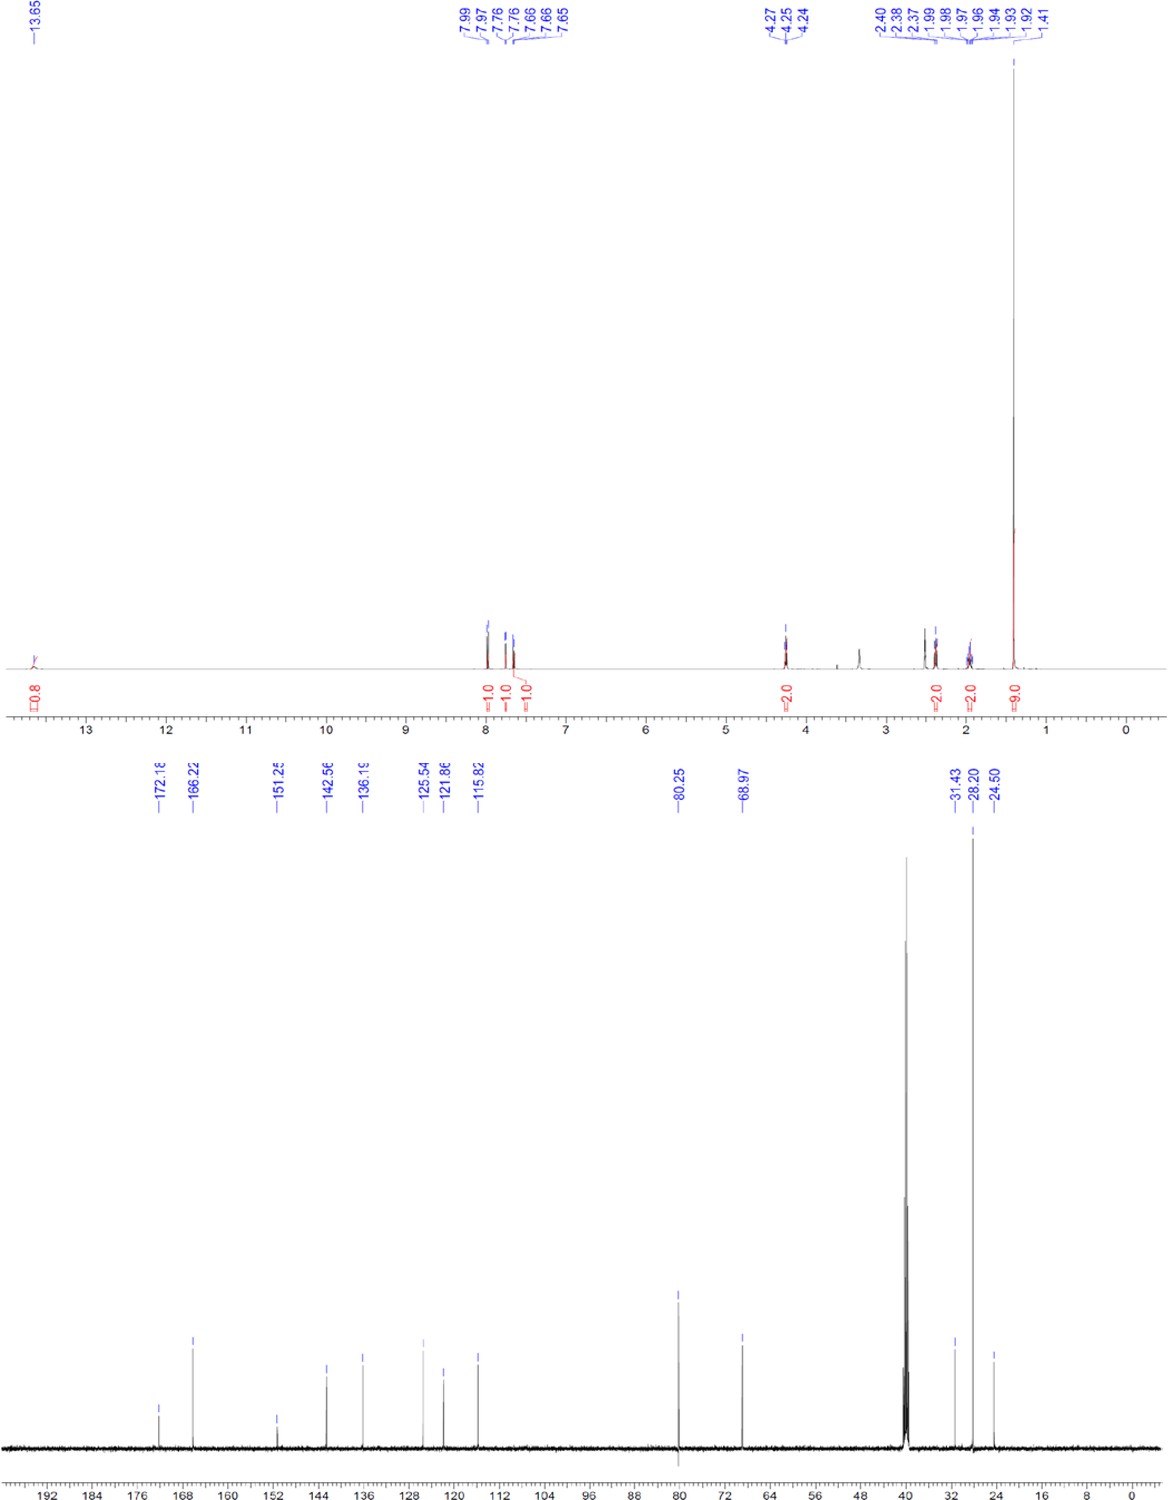
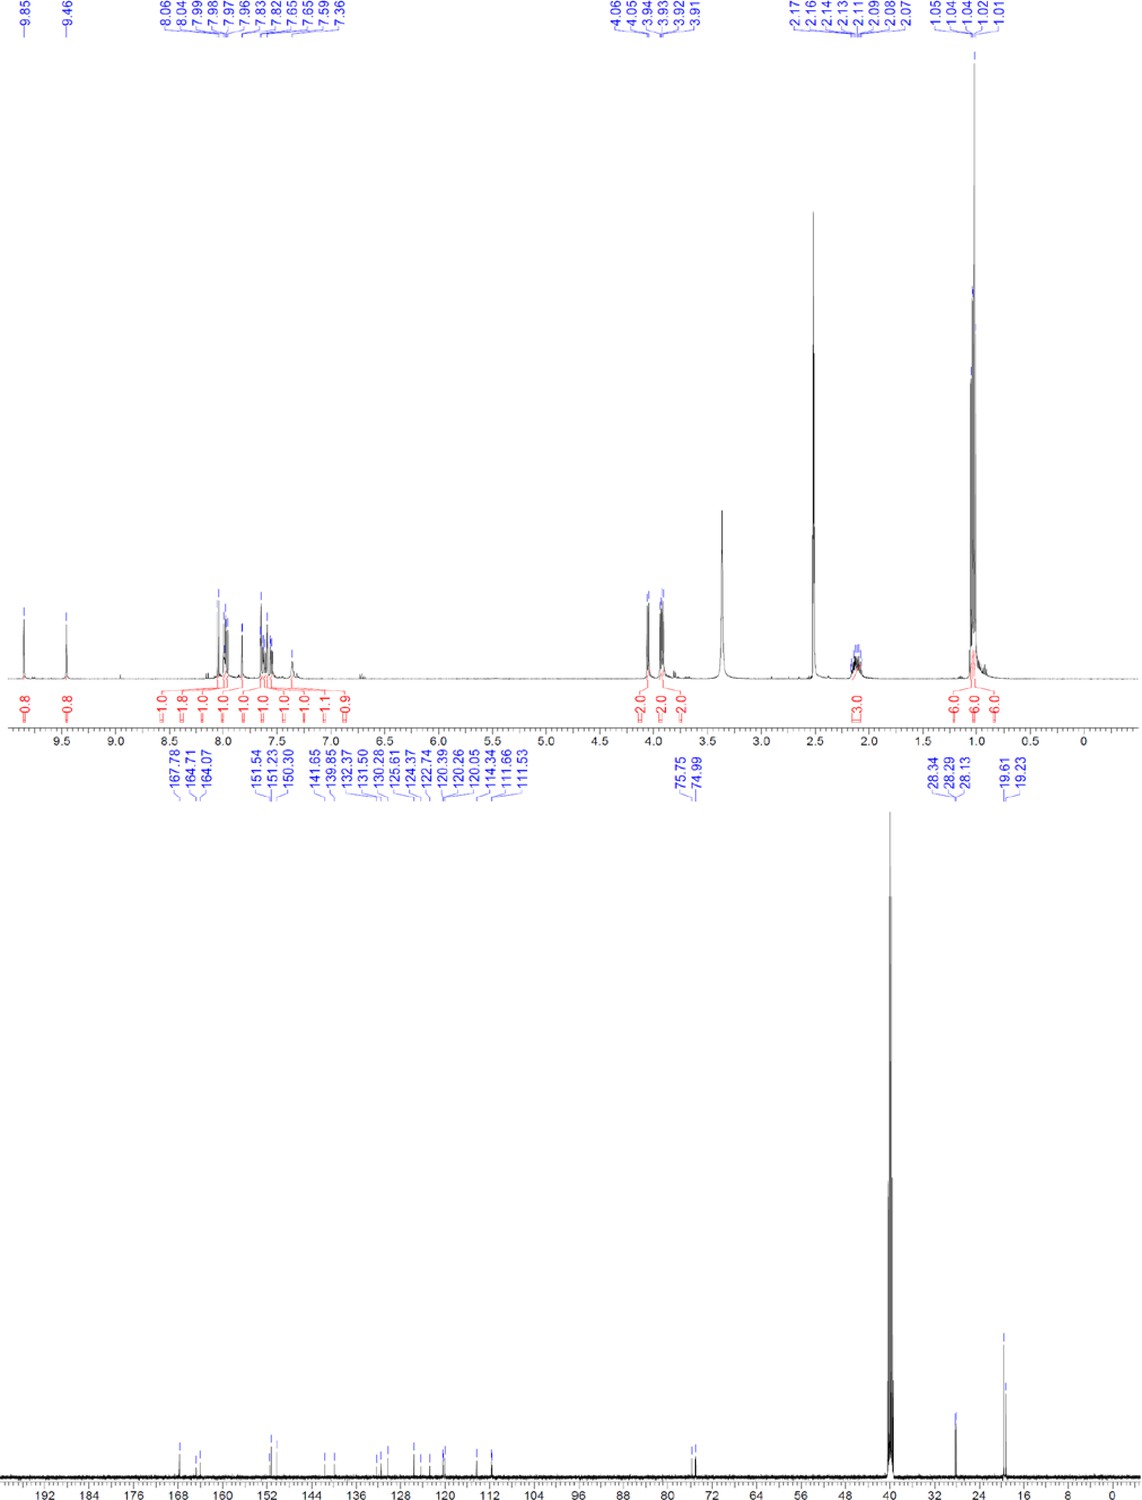
Appendix 1—figure 7
1H and 13C NMR of compound 3i.
https://doi.org/10.7554/eLife.26857.061
Appendix 1—figure 8
1H and 13C NMR of ERX-5.
https://doi.org/10.7554/eLife.26857.062
Appendix 1—figure 9
1H and 13C NMR of ERX-7.
https://doi.org/10.7554/eLife.26857.063
Appendix 1—figure 10
1H and 13C NMR of ERX-8.
https://doi.org/10.7554/eLife.26857.064
Appendix 1—figure 11
1H and 13C NMR of ERX-9.
https://doi.org/10.7554/eLife.26857.065
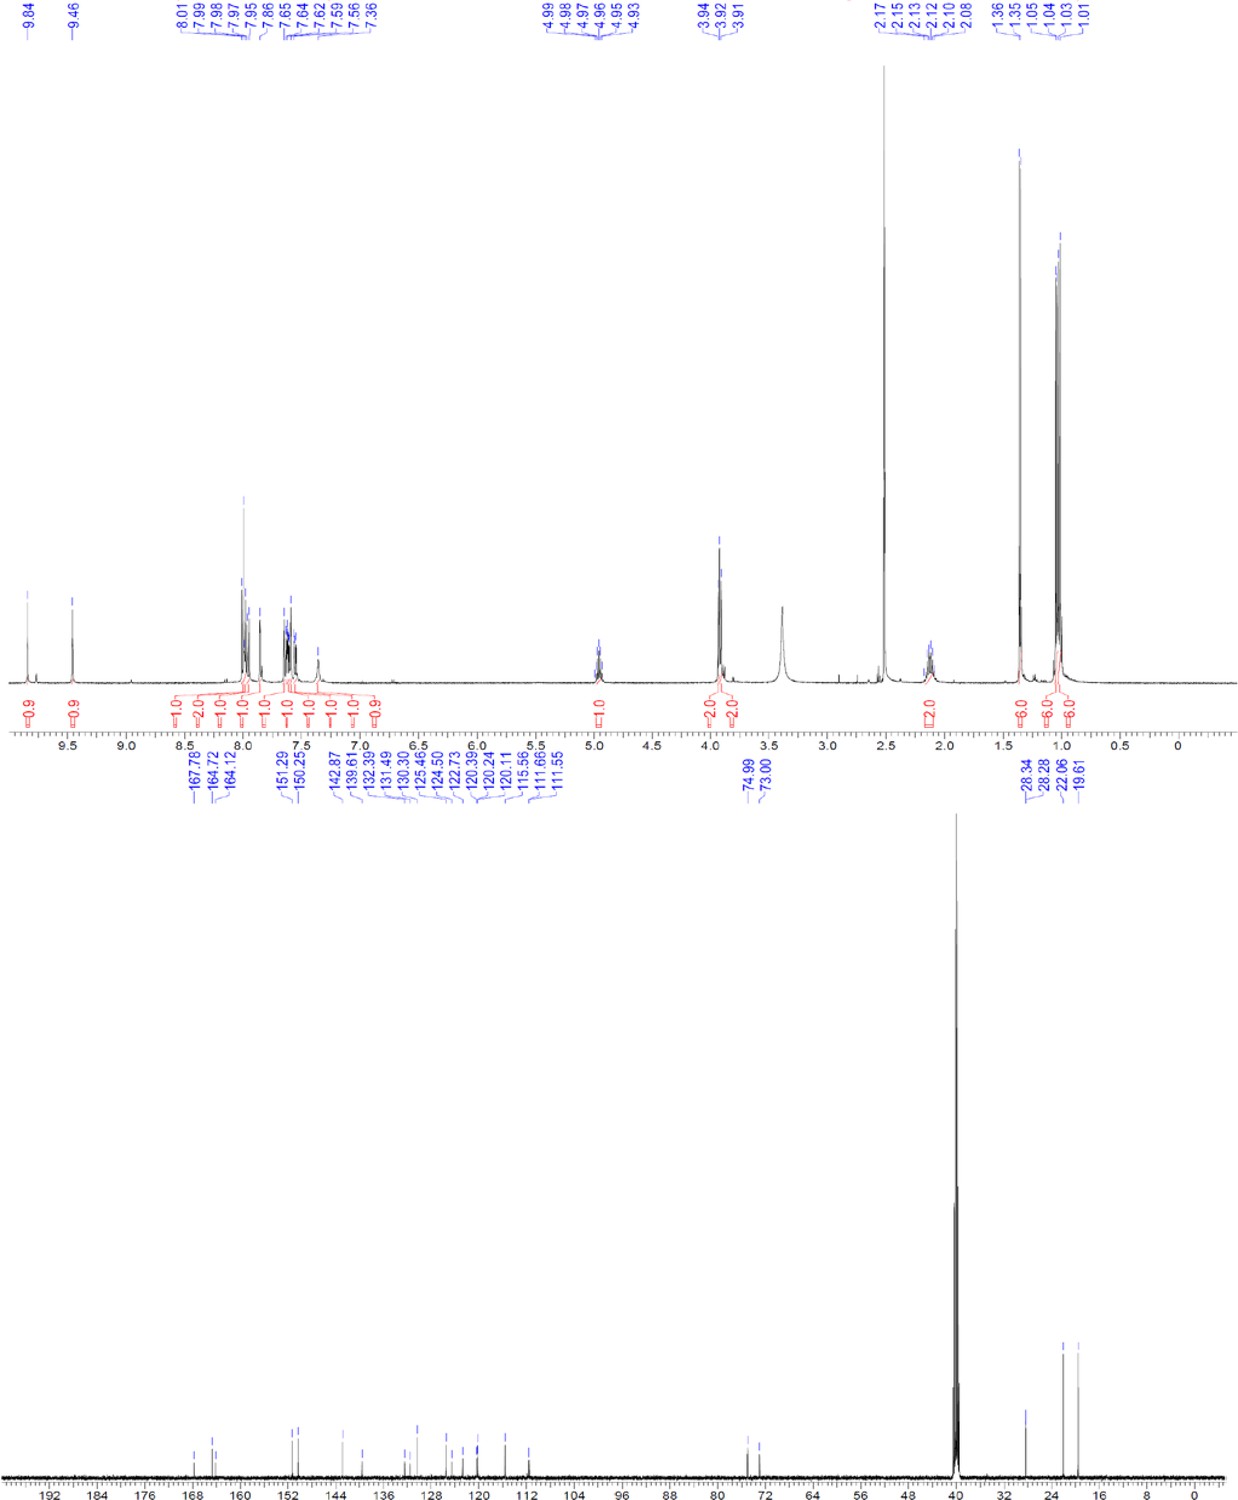
Appendix 1—figure 12

1H and 13C NMR of ERX-10.
https://doi.org/10.7554/eLife.26857.066
Appendix 1—figure 13
1H and 13C NMR of ERX-12.
https://doi.org/10.7554/eLife.26857.067
Appendix 1—figure 14
1H and 13C NMR of ERX-13.
https://doi.org/10.7554/eLife.26857.068
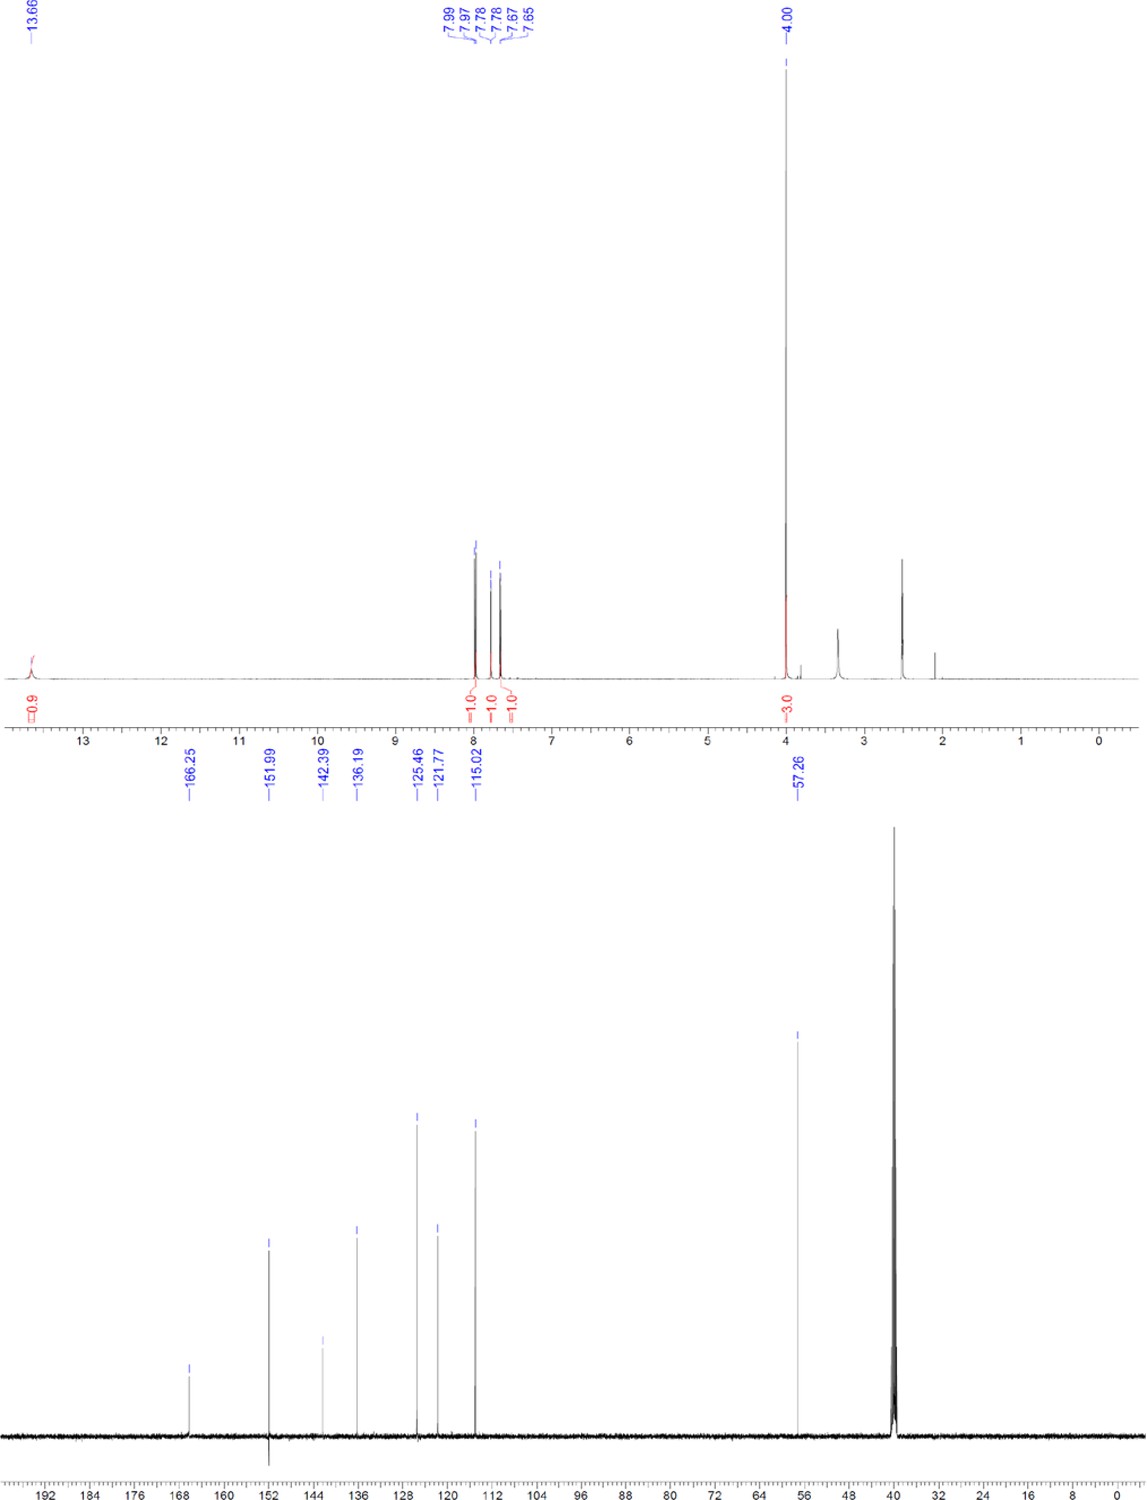
Appendix 1—figure 15

1H and 13C NMR of compound 9.
https://doi.org/10.7554/eLife.26857.069
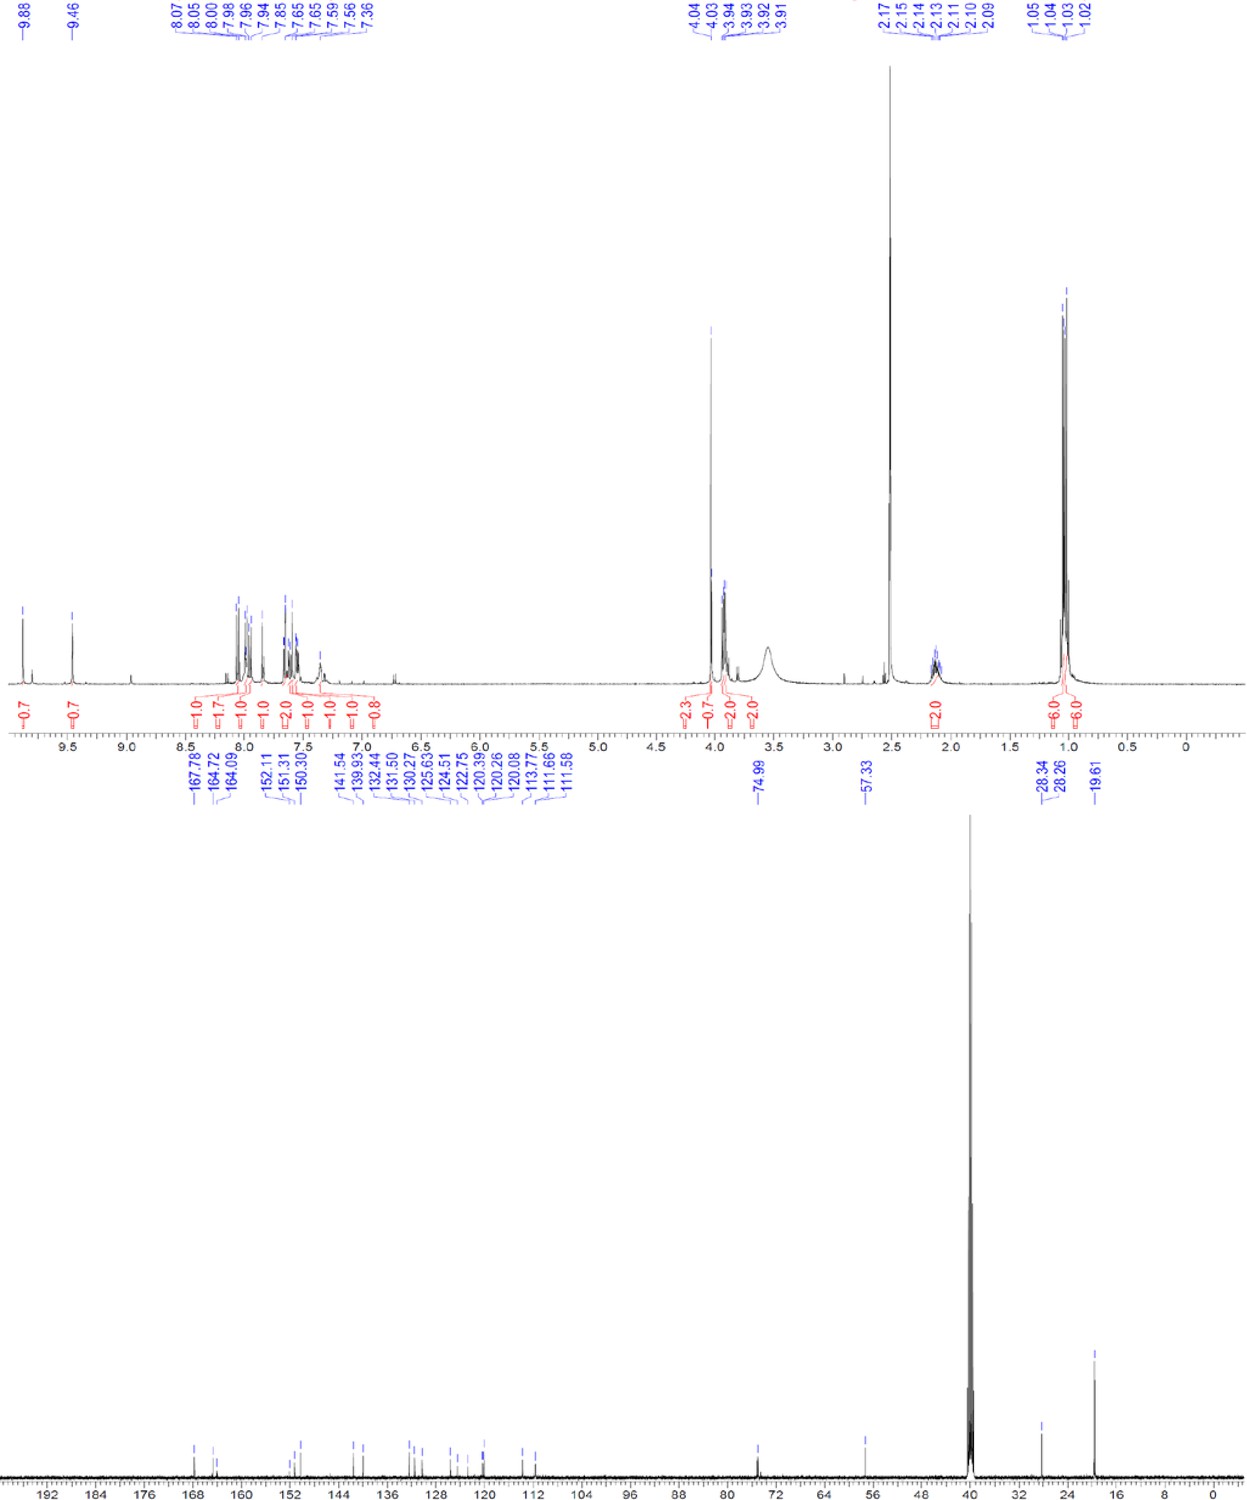
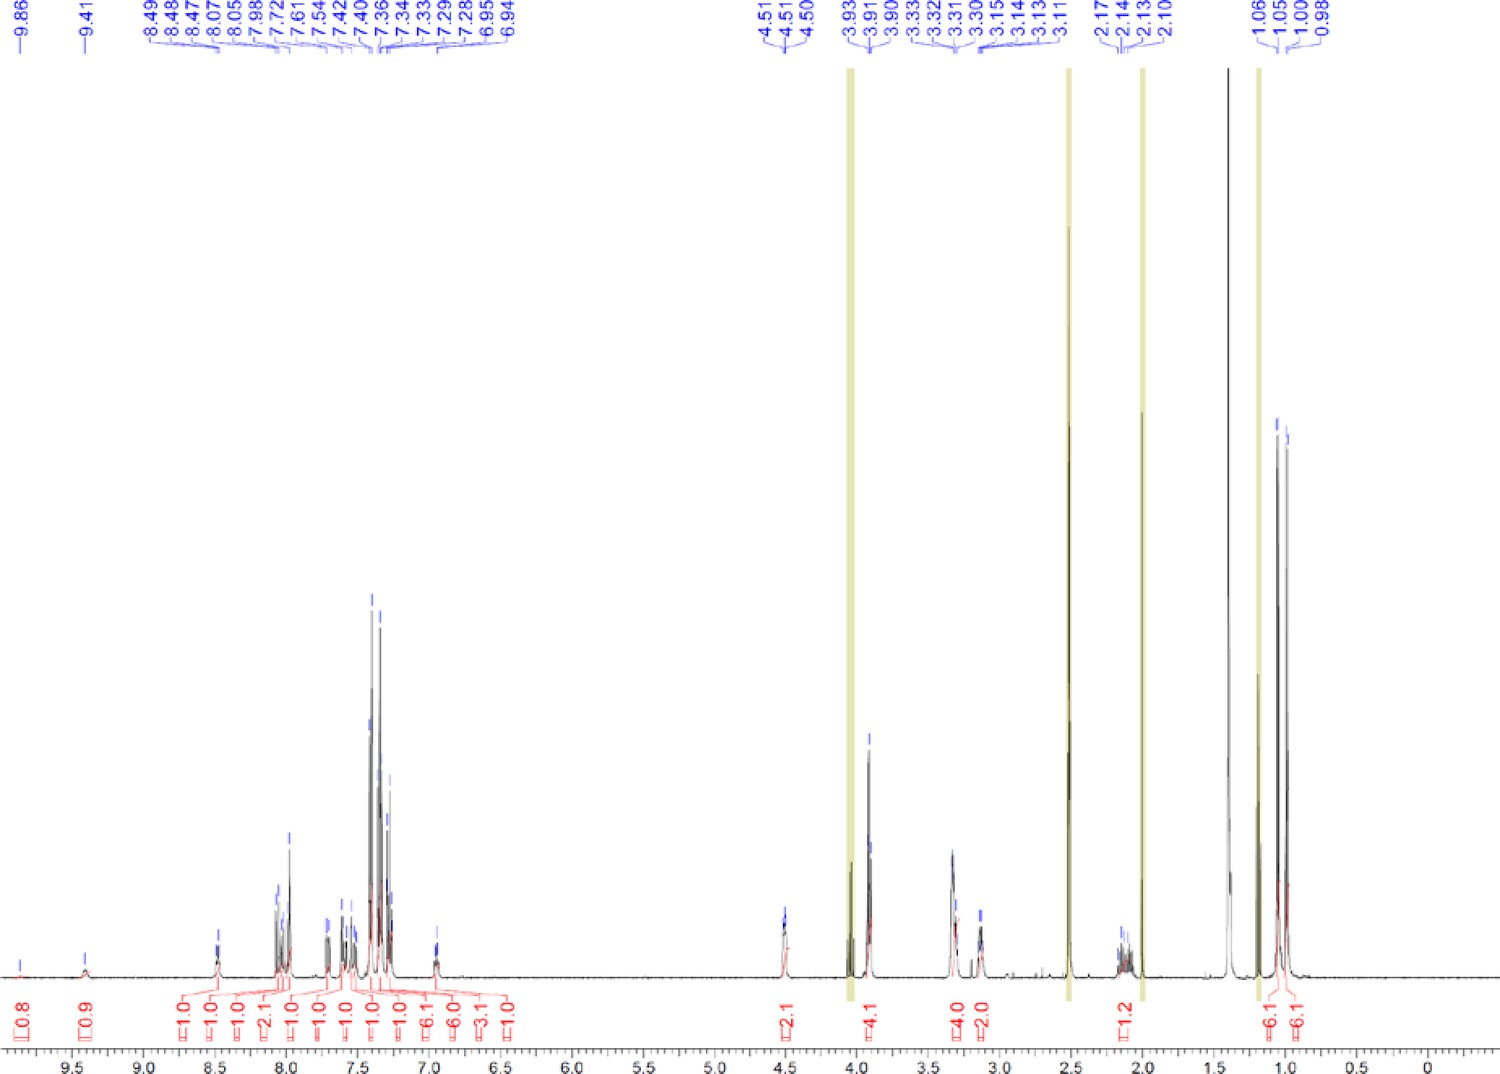
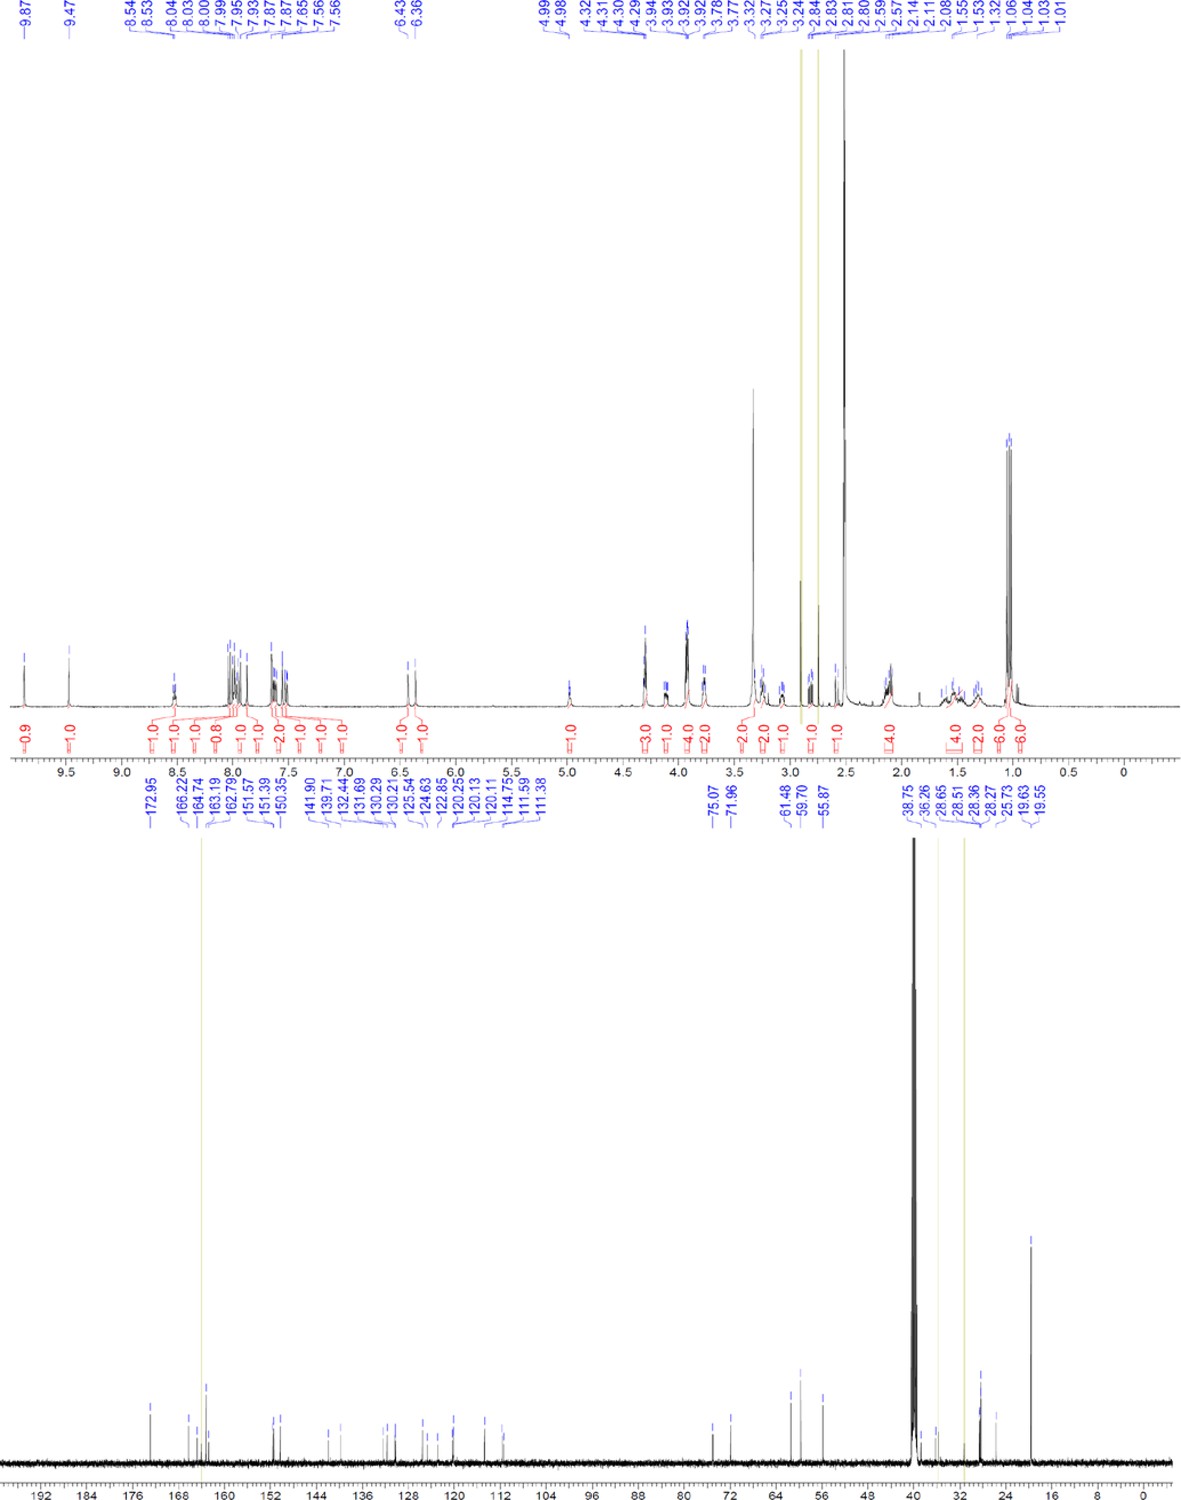
Appendix 1—figure 16
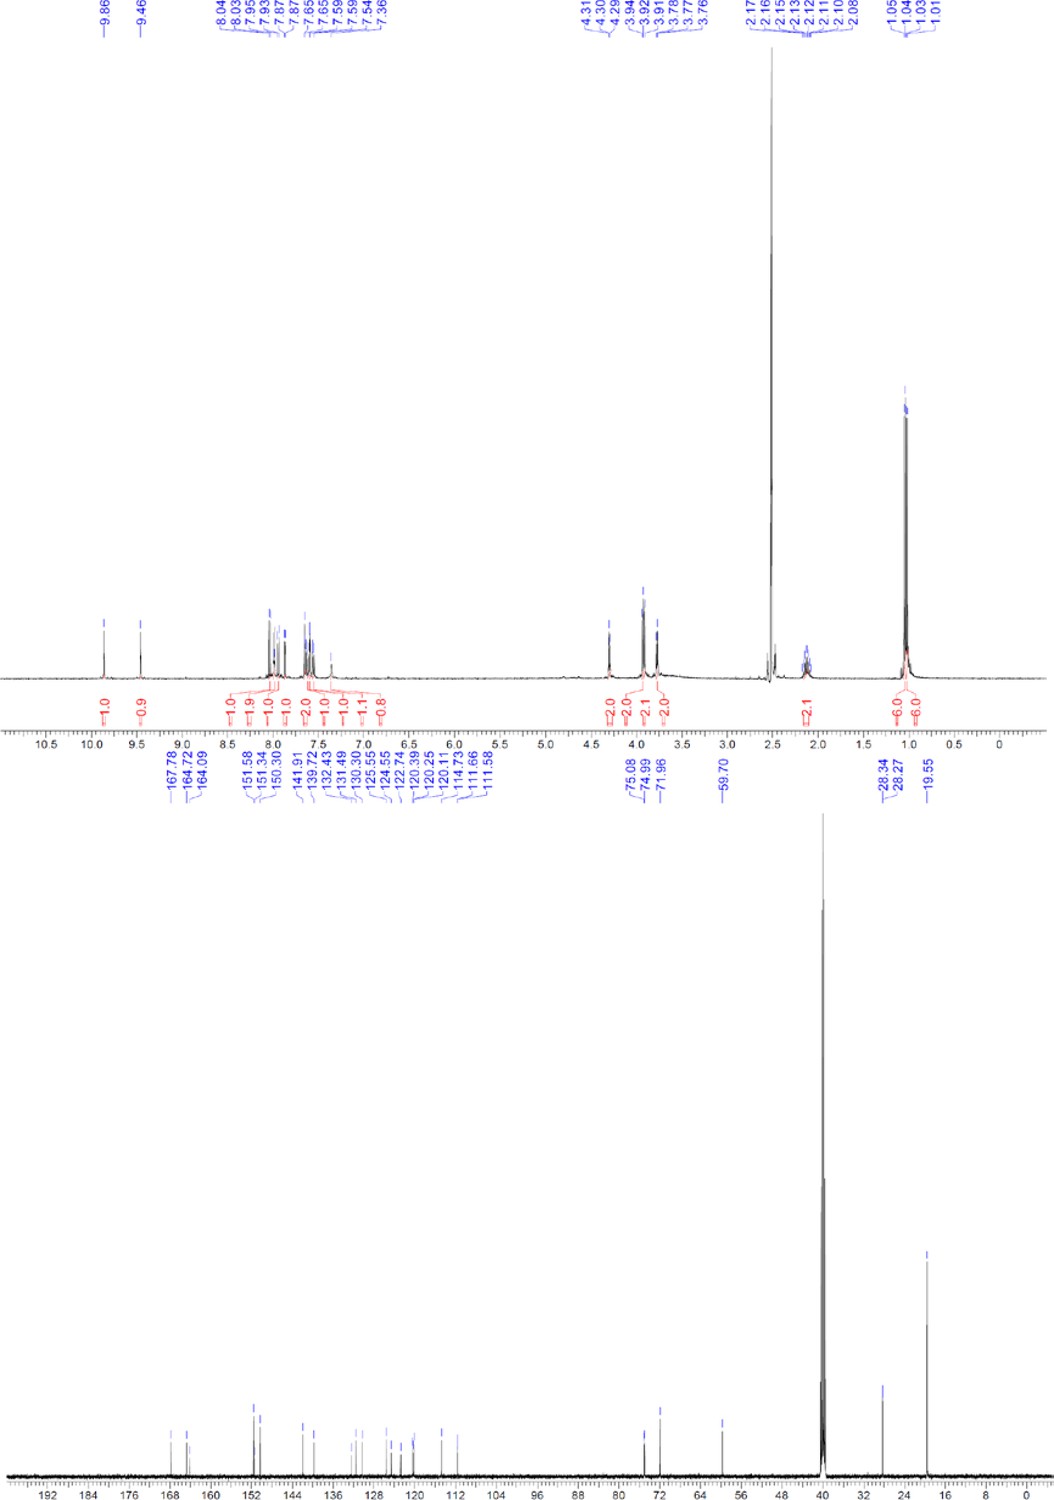
1H and 13C NMR of ERX-11.
https://doi.org/10.7554/eLife.26857.070
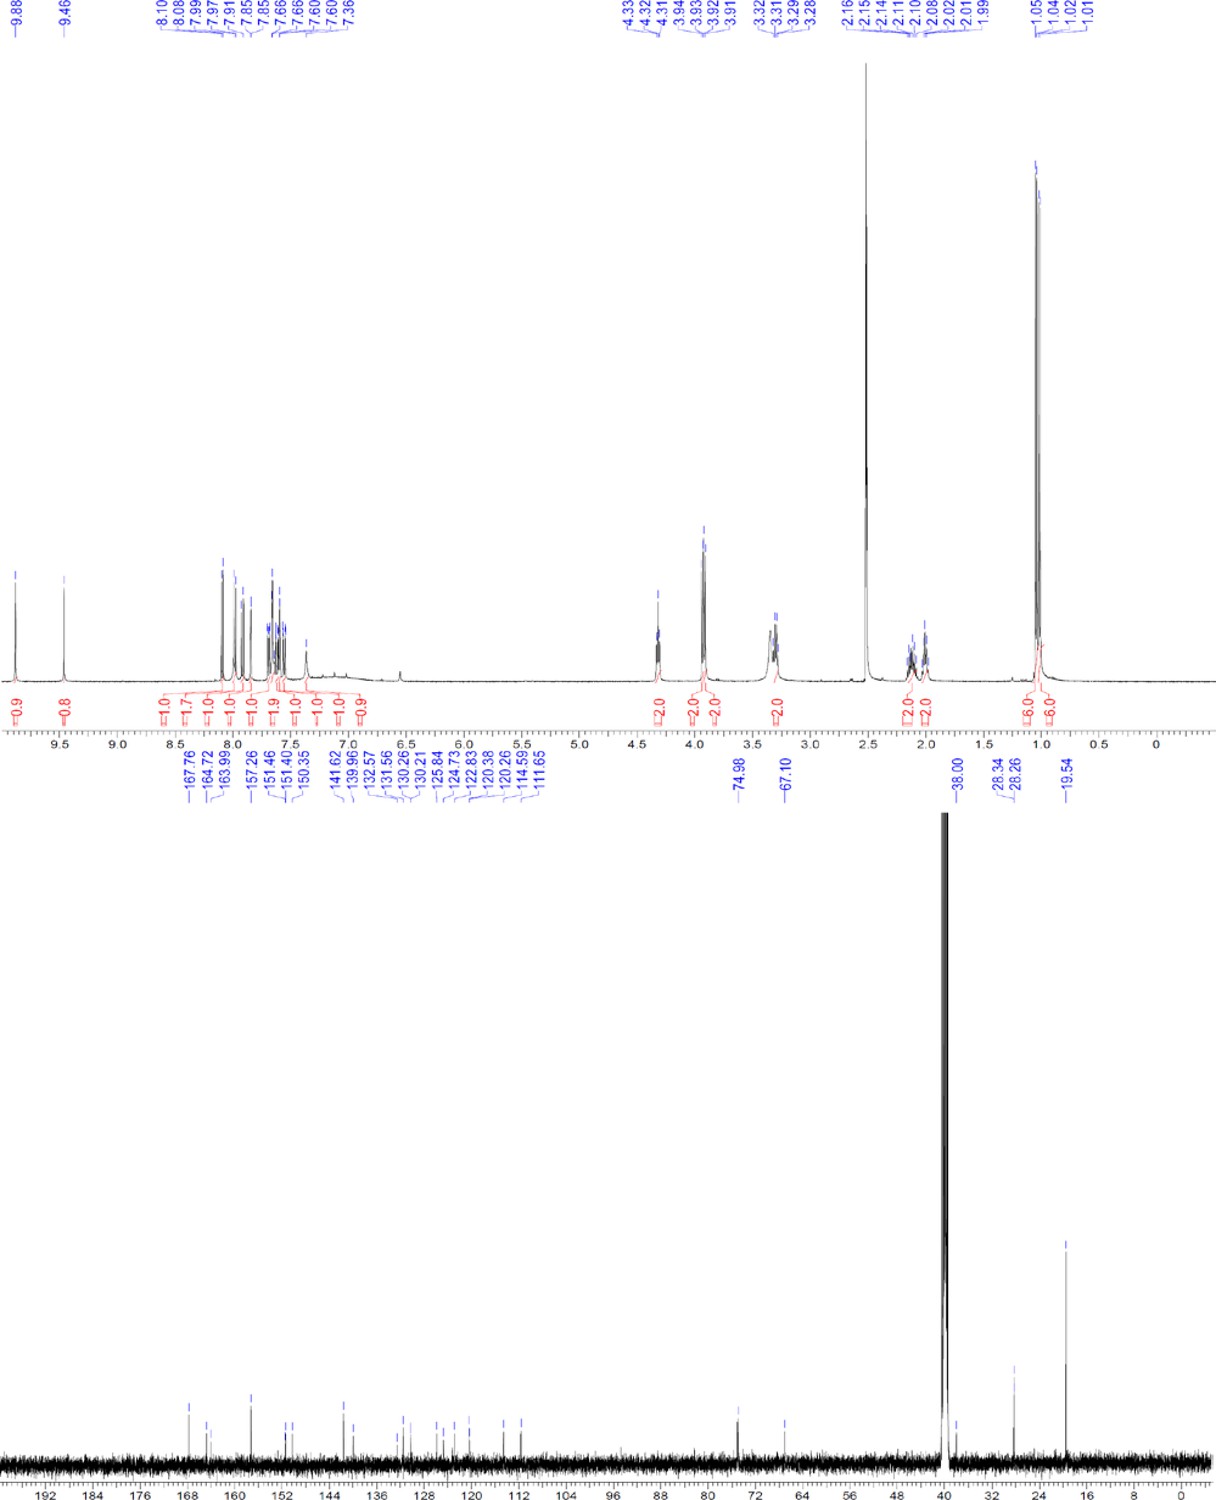
Appendix 1—figure 17
1H and 13C NMR of compound 11.
https://doi.org/10.7554/eLife.26857.071
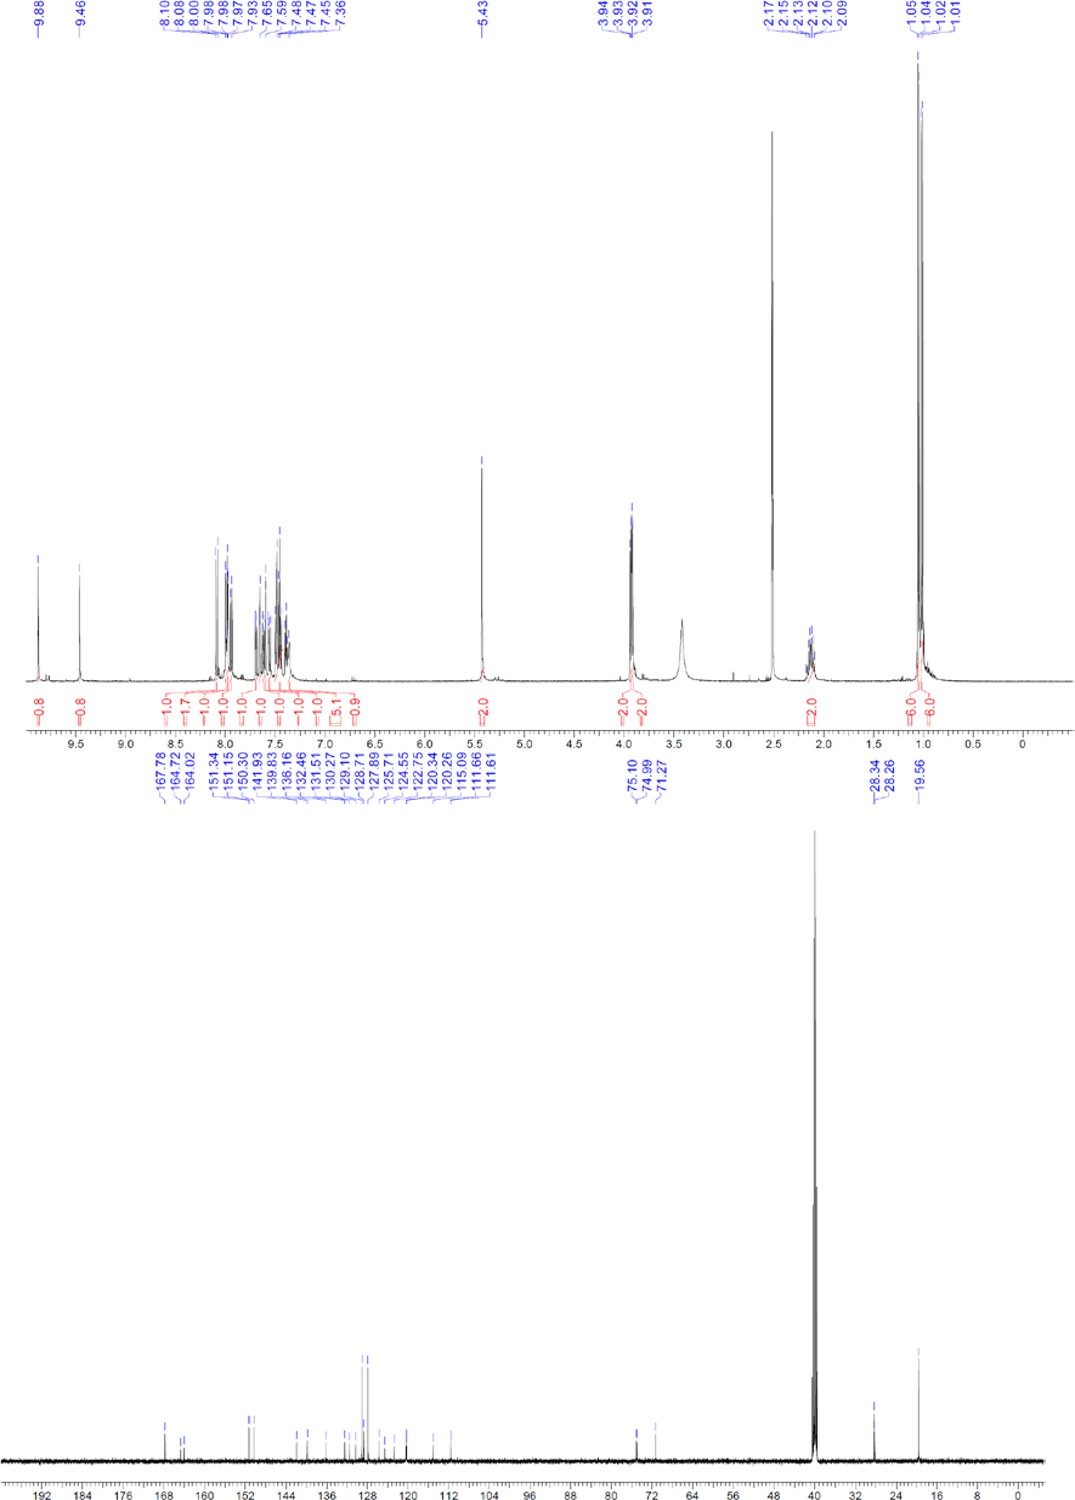
Appendix 1—figure 18
1H NMR of compound 12.
https://doi.org/10.7554/eLife.26857.072
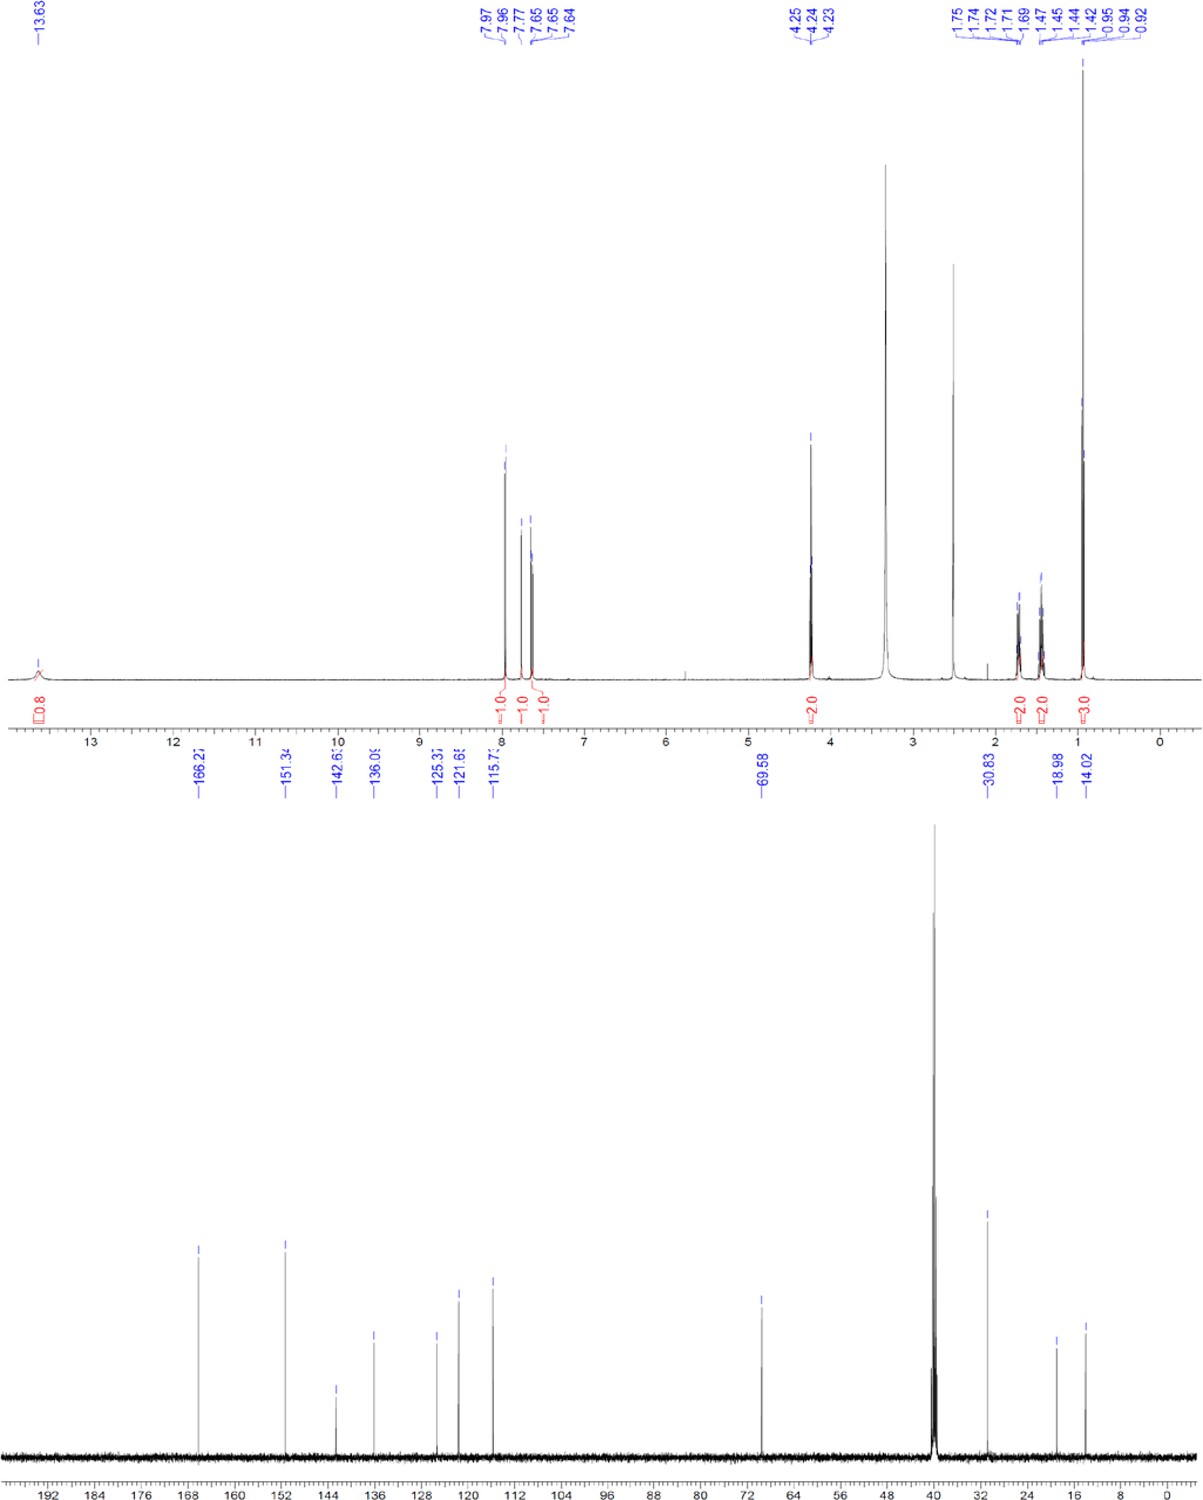
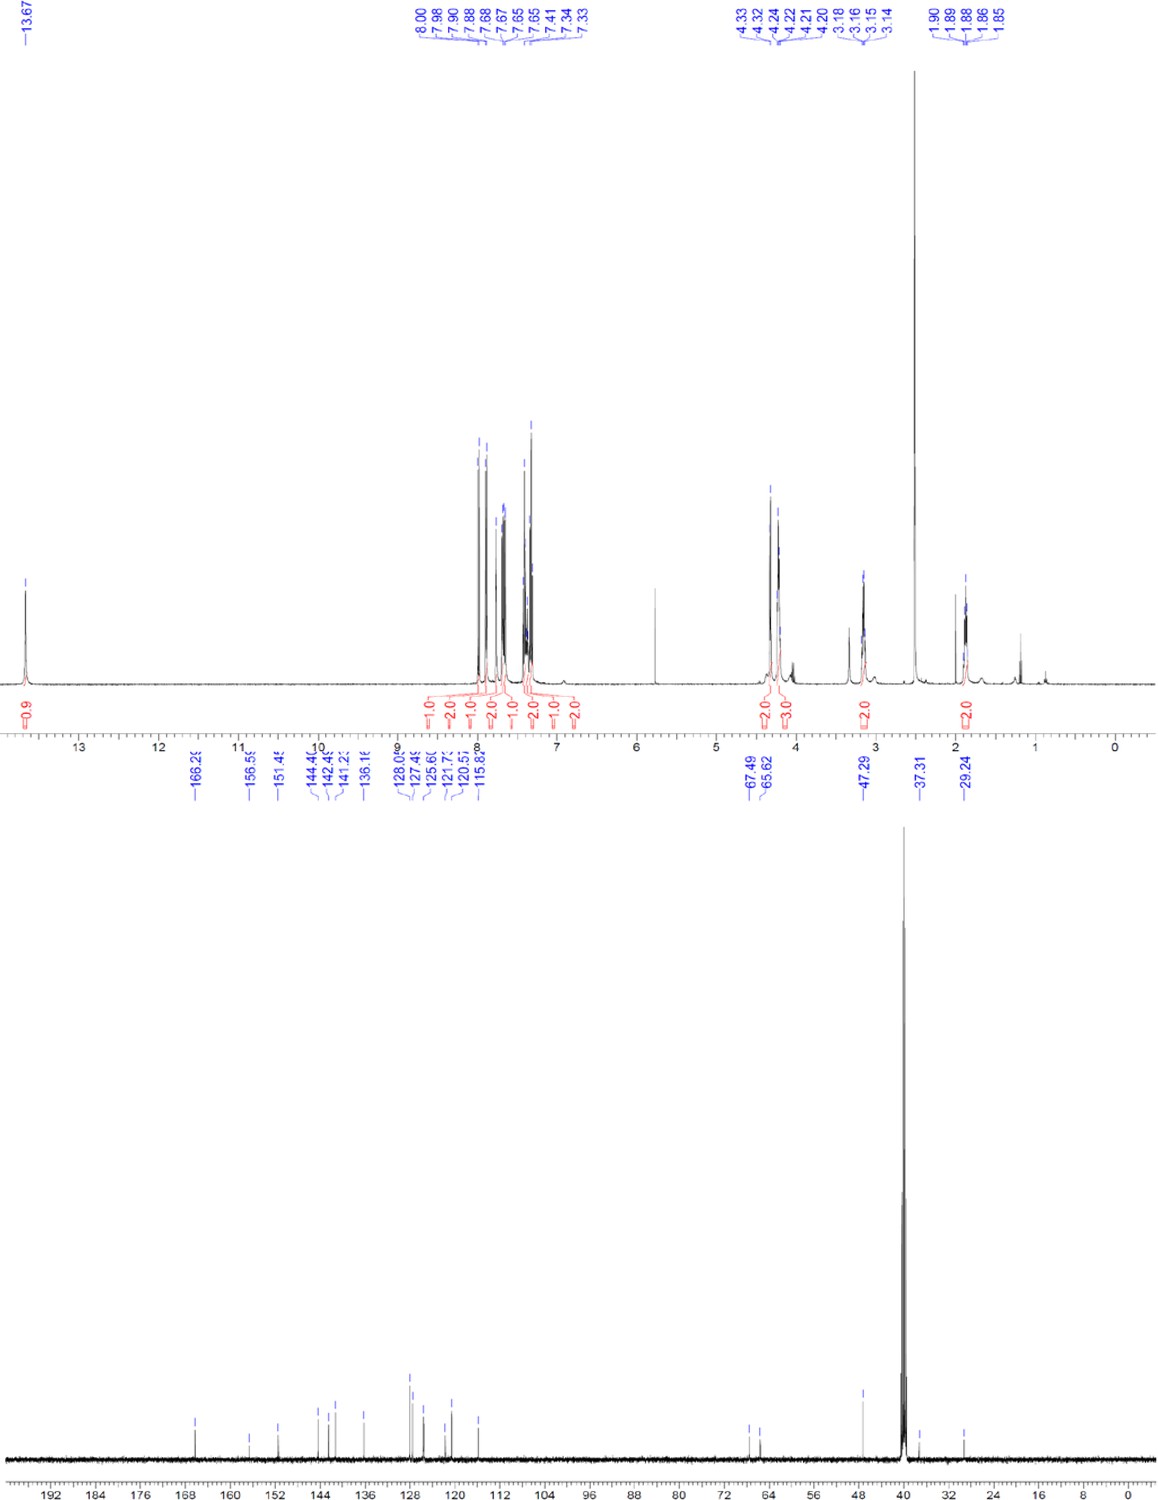
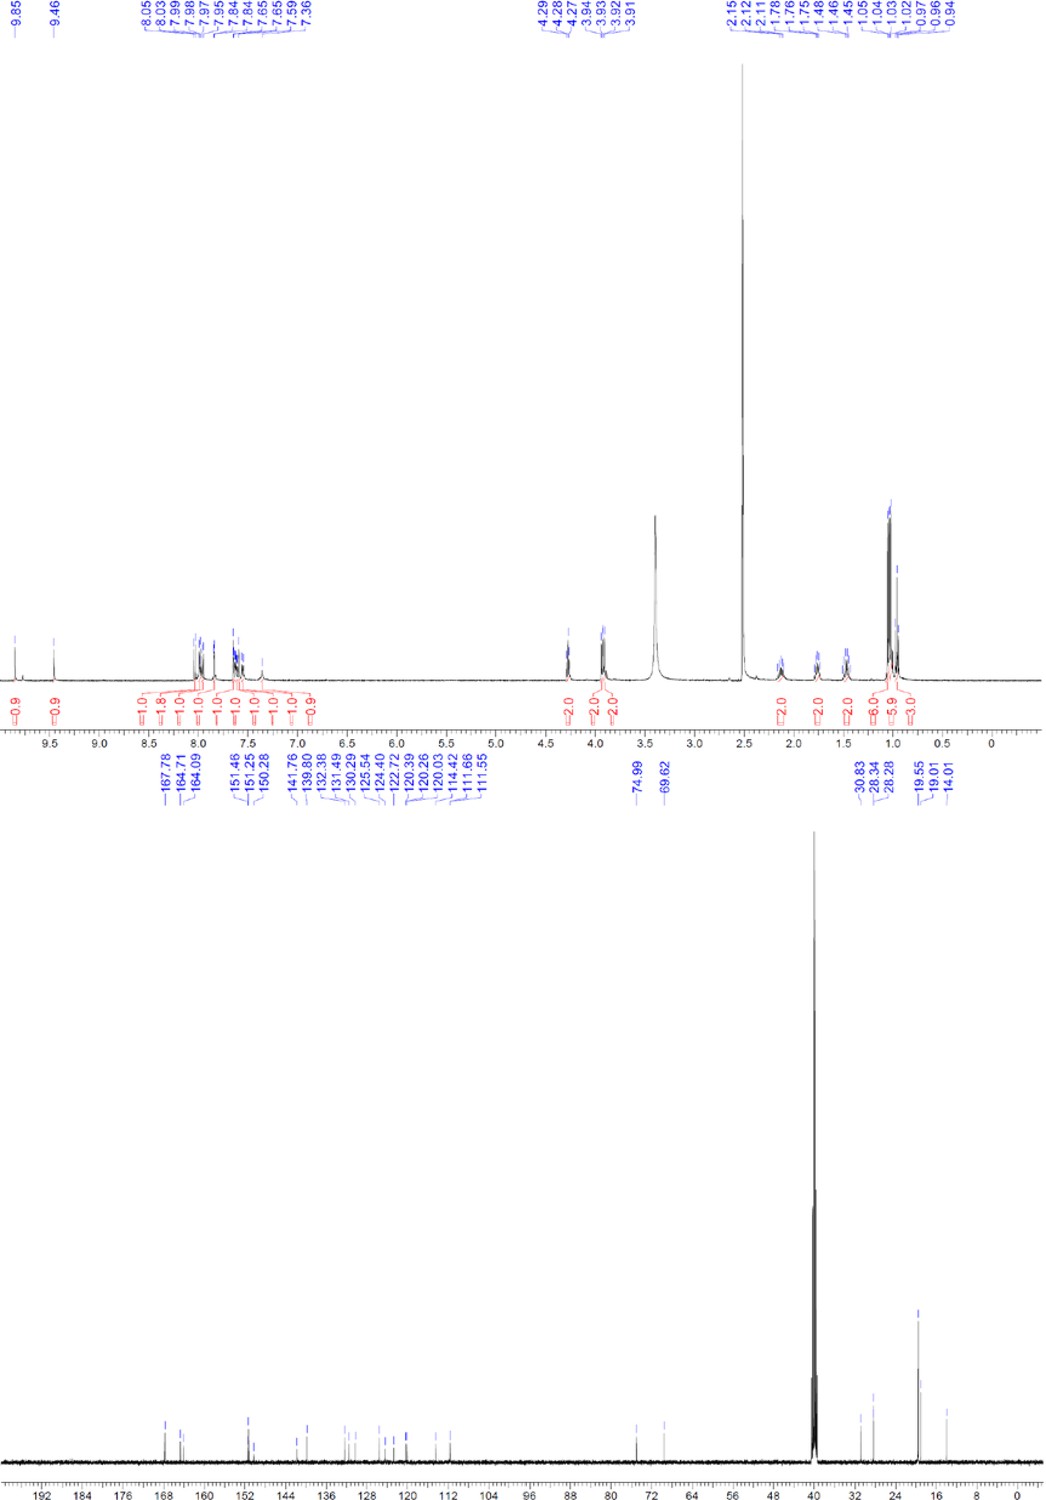
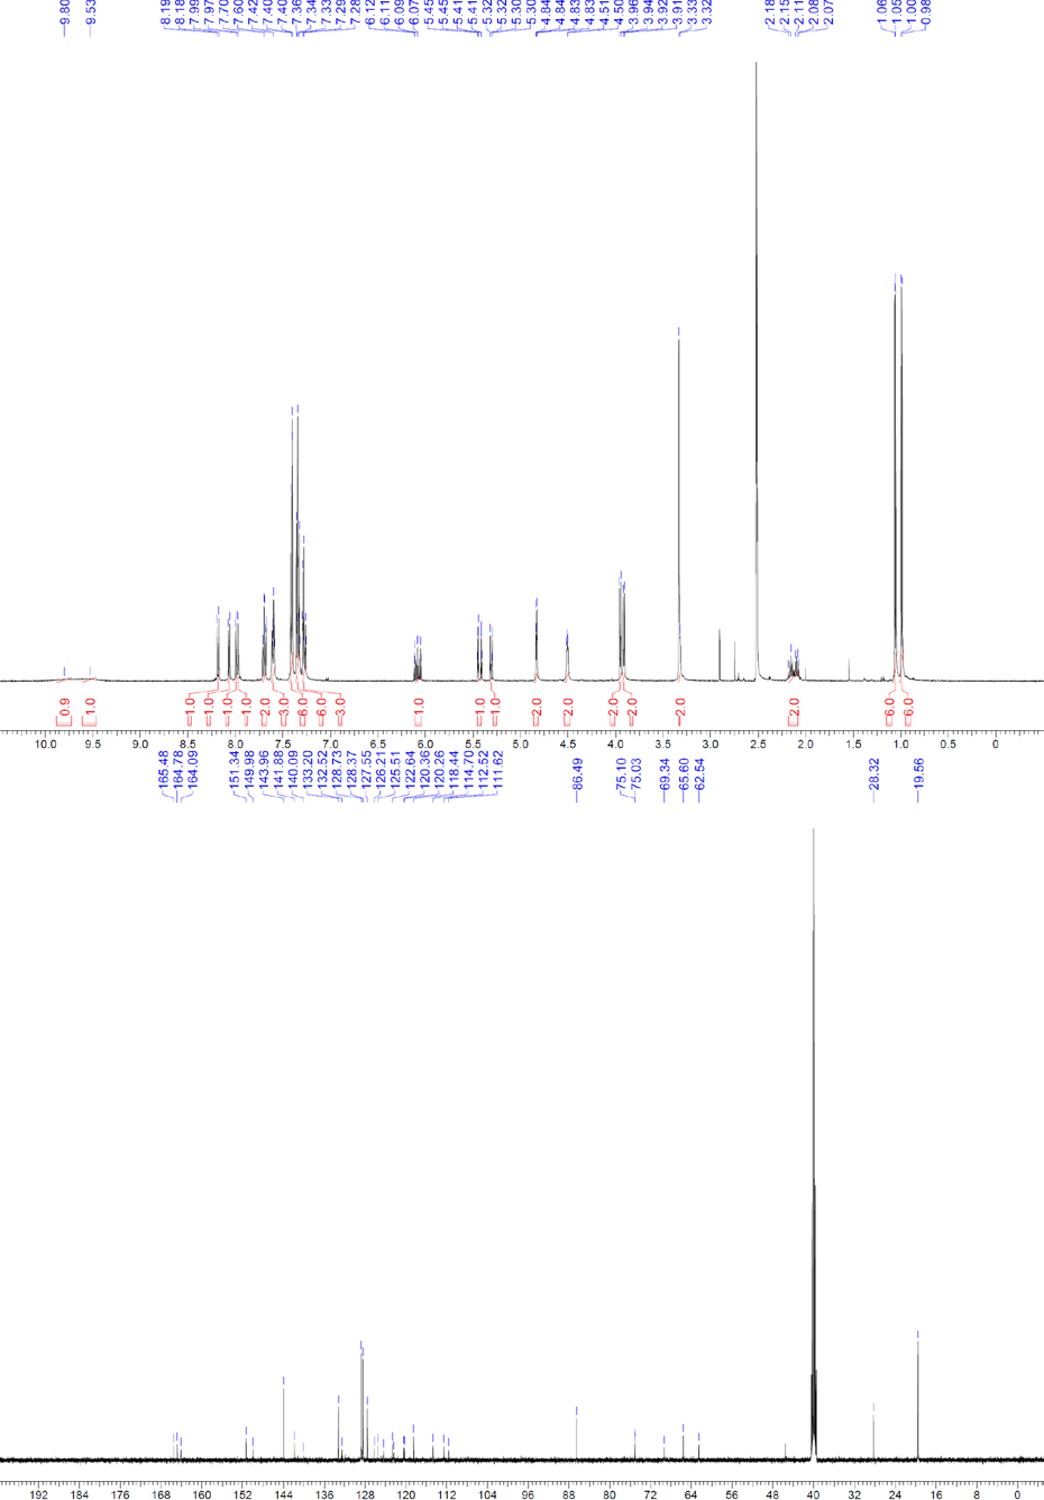
Appendix 1—figure 19
1H and 13C NMR of compound ERX-11-biotin.
https://doi.org/10.7554/eLife.26857.073
Appendix 1—figure 20
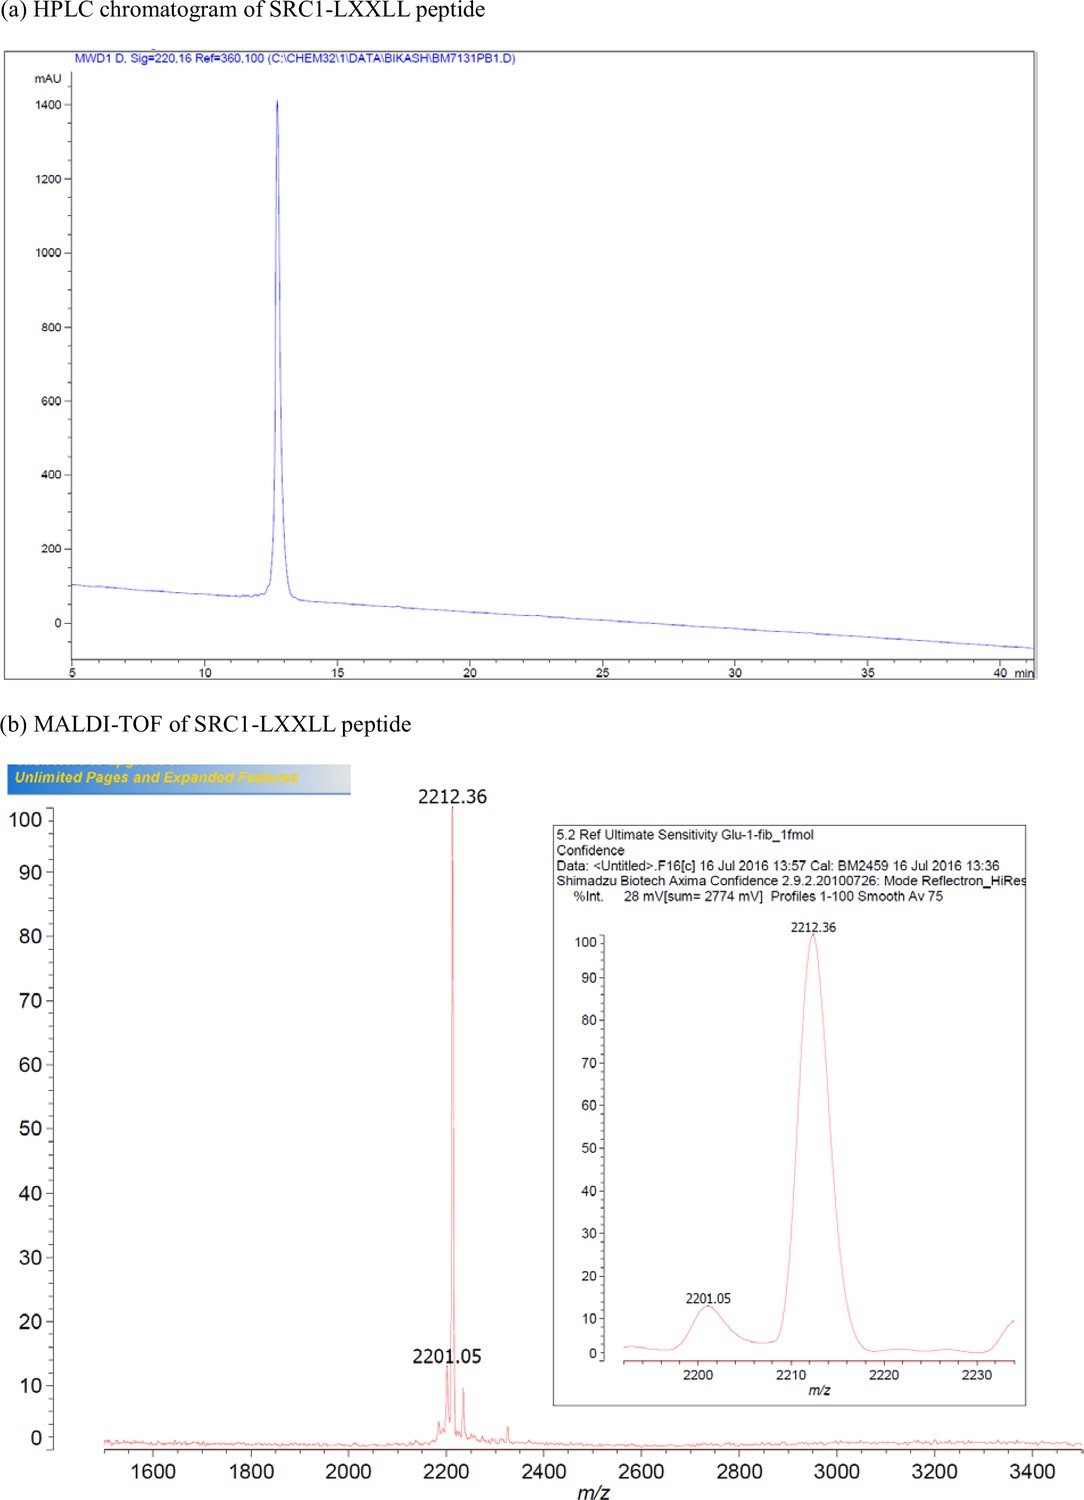
Characterization of SRC1-LXXLL peptide.
(a) HPLC chromatogram of SRC1-LXXLL peptide. (b) MALDI-TOF of SRC1-LXXLL peptide.
Appendix 1—figure 21

Characterization of SRC2-LXXLL peptide.
(a) HPLC chromatogram of SRC2-LXXLL peptide. (b) MALDI-TOF of SRC2-LXXLL peptide.
Appendix 1—figure 22
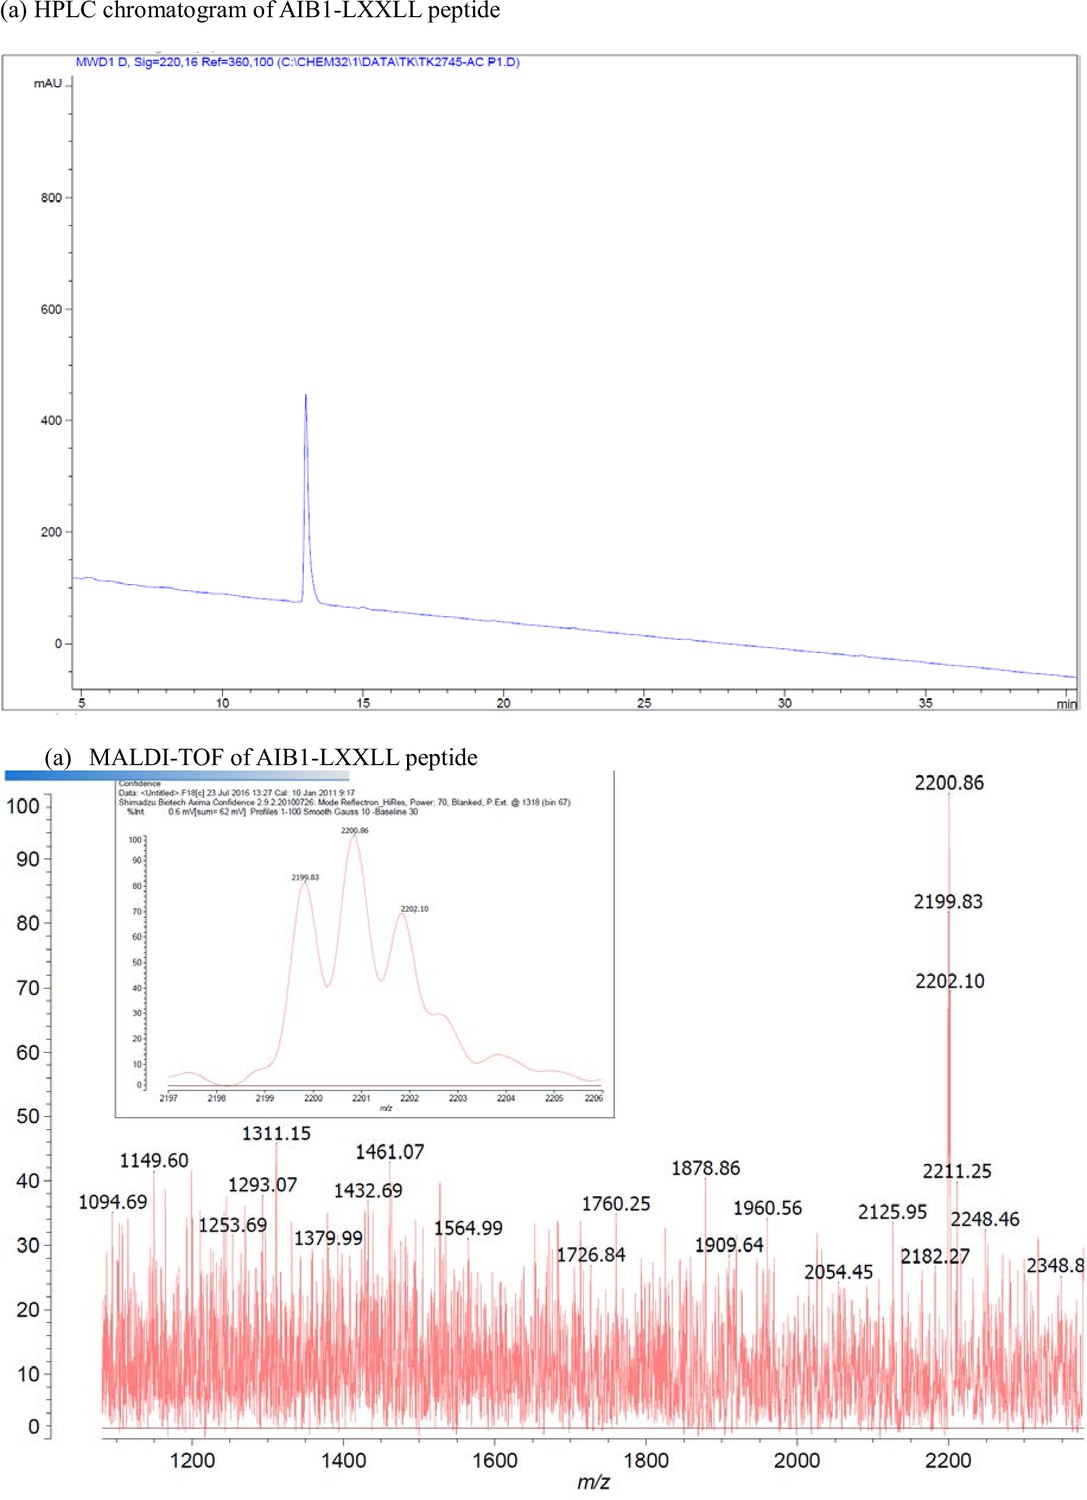
Characterization of AIB1-LXXLL peptide.
(a) HPLC chromatogram of AIB1-LXXLL peptide. (b) MALDI-TOF of AIB1-LXXLL peptide.
Appendix 1—figure 23
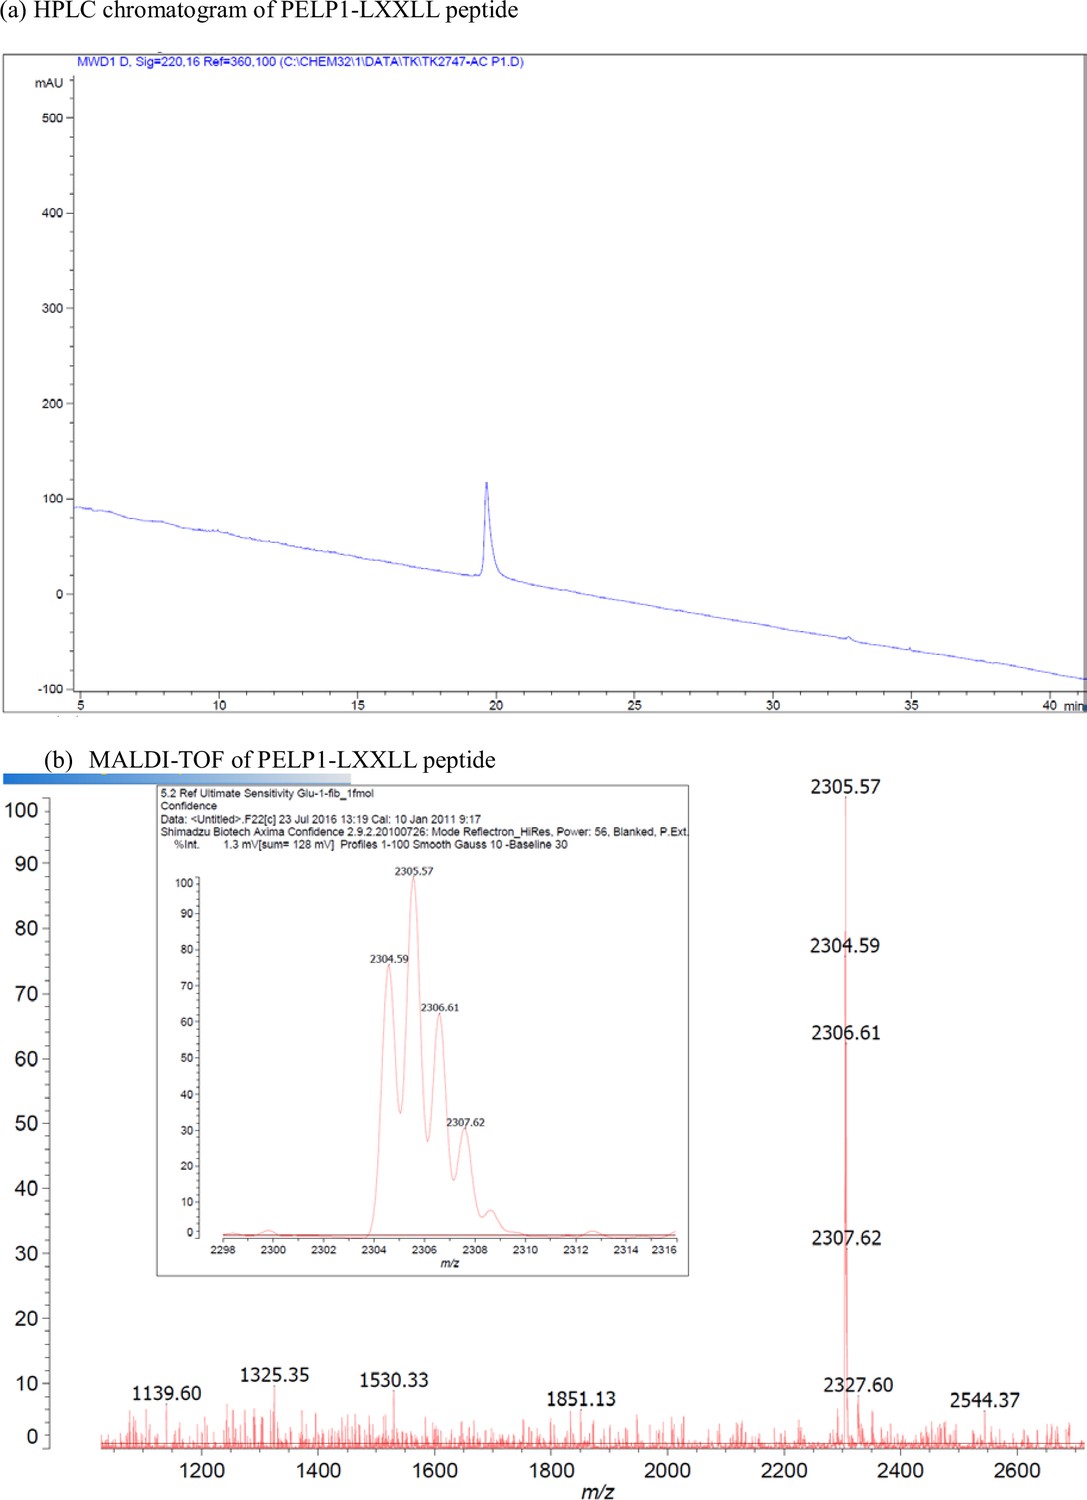
Characterization of PELP1-LXXLL peptide.
(a) HPLC chromatogram of PELP1-LXXLL peptide. (b) MALDI-TOF of PELP1-LXXLL peptide.
Tables
Table 1
Top proteins pulled down by biotinylated ERX-11 in MCF-7 cells, as identified by IP-MS. The column marked E2 represents spectral counts for the protein bound to biotinylated control eluted from avidin column, under conditions of E2 stimulation. The column marked E2 +ERX-11 represents spectral counts for proteins bound to biotinylated ERX-11 eluted from an avidin column with E2 stimulation. The column marked E2 + ERX-11/E2 represents the ratio of binders.
| Protein | Description | Length (AA) | Mw (Da) | PSMs | Peptide seqs | % Coverage | E2 | E2 + ERX-11 | E2 + ERX-11/E2 |
|---|---|---|---|---|---|---|---|---|---|
| P38117 | ETFB_HUMAN Electron transfer flavoprotein subunit beta OS = Homo sapiens GN = ETFB PE = 1 SV = 3 | 255 | 37501.10 | 12 | 7 | 34.10 | 1 | 7.00 | 5.00 |
| Q96PZ0 | PUS7_HUMAN Pseudouridylate synthase seven homolog OS = Homo sapiens GN = PUS7 PE = 1 SV = 2 | 661 | 75186.30 | 20 | 14 | 26.30 | 1.00 | 7.98 | 10.99 |
| O95336 | 6 PGL_HUMAN 6-phosphogluconolactonase OS = Homo sapiens GN = PGLS PE = 1 SV = 2 | 258 | 27601.60 | 13 | 8 | 41.50 | 0.99 | 6.00 | 6.04 |
| Q8TD06 | AGR3_HUMAN Anterior gradient protein three homolog OS = Homo sapiens GN = AGR3 PE = 1 SV = 1 | 166 | 19194.90 | 14 | 9 | 47.00 | 0.99 | 5.96 | 7.03 |
| P18754 | RCC1_HUMAN Regulator of chromosome condensation OS = Homo sapiens GN = RCC1 PE = 1 SV = 1 | 421 | 48241.20 | 27 | 13 | 55.30 | 1.99 | 11.92 | 7.00 |
| O60506 | HNRPQ_HUMAN Heterogeneous nuclear ribonucleoprotein Q OS = Homo sapiens GN = SYNCRIP PE = 1 SV = 2 | 623 | 69739.70 | 20 | 20 | 48.50 | 1.97 | 10.82 | 3.50 |
| P03372 | ESR1_HUMAN Estrogen receptor OS = Homo sapiens GN = ESR1 PE = 1 SV = 2 | 595 | 66335.20 | 36 | 15 | 30.80 | 1.83 | 9.88 | 5.93 |
| E9PCR7 | E9PCR7_HUMAN 2-oxoglutarate dehydrogenase, mitochondrial OS = Homo sapiens GN = OGDH PE = 2 SV = 1 | 1038 | 115728.00 | 39 | 25 | 32.80 | 3.98 | 18.88 | 4.00 |
| O43488 | ARK72_HUMAN Aflatoxin B1 aldehyde reductase member 2 OS = Homo sapiens GN = AKR7A2 PE = 1 SV = 3 | 359 | 39653.80 | 22 | 11 | 39.80 | 1.99 | 8.96 | 5.51 |
| O95994 | AGR2_HUMAN Anterior gradient protein two homolog OS = Homo sapiens GN = AGR2 PE = 1 SV = 1 | 175 | 22277.70 | 29 | 12 | 65.70 | 2.97 | 11.92 | 4.68 |
| P19338 | NUCL_HUMAN Nucleolin OS = Homo sapiens GN = NCL PE = 1 SV = 3 | 710 | 76766.50 | 99 | 35 | 48.00 | 14.00 | 50.98 | 2.43 |
| O43148 | MCES_HUMAN mRNA cap guanine-N7 methyltransferase OS = Homo sapiens GN = RNMT PE = 1 SV = 1 | 476 | 57831.90 | 16 | 9 | 29.40 | 1.99 | 6.97 | 3.50 |
| Q562R1 | ACTBL_HUMAN Beta-actin-like protein 2 OS = Homo sapiens GN = ACTBL2 PE = 1 SV = 2 | 376 | 42084.00 | 14 | 14 | 39.10 | 2.00 | 7.00 | 3.00 |
| Q9Y5A9 | YTHD2_HUMAN YTH domain family protein 2 OS = Homo sapiens GN = YTHDF2 PE = 1 SV = 2 | 579 | 62457.80 | 15 | 12 | 23.10 | 2.00 | 6.99 | 3.00 |
| P16152 | CBR1_HUMAN Carbonyl reductase [NADPH] 1 OS = Homo sapiens GN = CBR1 PE = 1 SV = 3 | 277 | 30427.90 | 20 | 11 | 56.70 | 2.99 | 9.98 | 2.33 |
| Q9UBS4 | DJB11_HUMAN DnaJ homolog subfamily B member 11 OS = Homo sapiens GN = DNAJB11 PE = 1 SV = 1 | 358 | 40578.70 | 21 | 12 | 35.20 | 3.00 | 10.00 | 2.67 |
Table 2
Top biological processes of coregulators, whose interactions with ER are disrupted by ERX-11 in MCF-7 cells.
| Biology processes | Genes |
|---|---|
| RNA processing | CD2BP2 CHERP CPSF1 CPSF2 CPSF3L CSTF3 DDX17 DDX20DDX23 DHX15 DHX9 DKC1 GEMIN5 HNRNPA3 HNRNPK HNRNPLL HNRNPLL HNRNPR INTS2 INTS4 INTS5 NCBP1 PCF11 POLR2A PPP2R1A PRPF31 PRPF40a PUF60 RBM10 RBM14 SART1 SF1 SF3A3 SF3B1 SF3B3 Sfrs15 SKIV2L2 SMC1A SRRM1 SSB SYNCRIP THOC2 TRNT1 U2AF2 XRN2 ZCCHC8 |
| Transcription | ADNP CCNL1 CSDA CTNND2 DIDO1 DMAP1 EIF2S2 ERCC2 FOXA1 GTF2I GTF3C1 GTF3C KDM3B KDM5B LRPPRC MCM2 MED1 MED24 NCOA3 PELP1 POLR2A POLR3C PSIP1 PUF60 RBM14 RFX1 SAP130 SF1 SMARCA2 SMARCA4 SMARCC2 SMARCD2 THRAP3 Th1l TRIM33 UHRF1 XRN2 ZBTB7A ZMYM2 ZNF217 ZNF512B |
| Protein transport, protein localization | AP2A2 CLTC COG1 COG3 COG5 COG8 COPB1 COPB2 COPG2 CSE1L EXOC2 EXOC3 EXOC4 EXOC5 EXOC8 IPO4 KPNA4 KPNB1 NUP153 NUP155 NUP93 RANBP2 SEC16A SEC23A SEC24B SEC24C SRP72 STXBP2 TNPO1 TRAM1 TRNT1 VCP VPS11 VPS18 VPS39 |
| RNA splicing | CD2BP2 CPSF1 CPSF2 CSTF3 DDX20 DDX23 DHX15 DHX9 GEMIN5 HNRNPA3 HNRNPL HNRNPR LUC7L3 NCBP1 PCF11 POLR2A PPP2R1A PRPF31 PRPF40A PUF60 RBM10 SART1 SF1 SF3A3 SF3B1 SF3B3 SKIV2L2 SMC1A SRRM1 SYNCRIP THOC2 U2AF2 ZCCHC8 |
| Macromolecular complex subunit organization | CSE1L DARS DDX20 DDX23 EPRS ERCC2 FKBP4 GEMIN5 GTF2I GTF3C4 HSP90AA1 IPO4 KPNB1 LONP1 MCM2 MED1 MED24 NCBP1 PFKL PFKM PFKP POLR2A PPP2R1A PREX1 PRPF31 SF1 SF3A3 SF3B3 THRAP3 TNPO1 TUBA1B TUBB VCP XRN2 |
| Cell cycle | CUL1 CUL2 CUL3 CUL4B Dmc1 DNM2 DYNC1H1 EIF4G2 LIG3 MCM2 MRE11A NUMA1 PDS5B PHGDH PPP3CA PSMC1 PSMC4 PSMD3 PSMD5 RAD50 SART1 SF1 SMC1A SMC3 SMC4 TUBB UHRF1 |
| Chromosome organization | PDS5B KDM5B RBM14 RAD50 MRE11A CHD1L DMAP1 DKC1 EP400 KDM3B MCM2 SAP130 SMC1A SMC3 SMC4 SMCHD1 SMARCA2 SMARCA4 SMARCC2 SMARCD2 |
| Regulation of cell death | ACTN1 ADNP CSDA CUL1 CUL2 CUL3 DDX20 DNM2 ERCC2 PPP2R1A PREX1 SART1 SCRIB TUBB UACA VCP |
Table 3
Selected pathways modulated by ERX-11 treatment. Differentially expressed genes were subjected to pathway analysis using IPA software and the selected top canonical pathways modulated by ERX-11 are shown. This data is related to Figure 3.
| Pathway | p-Value | Ratio | Genes |
|---|---|---|---|
| Retinoic-acid-Mediated Apoptosis Signaling | 2.44E + 00 | 1.25E-01 | PARP12,ZC3HAV1,TNFSF10,PARP9,PARP14,CRABP2,RARG,CRABP1 |
| ERK/MAPK Signaling | 1.77E + 00 | 7.49E-02 | SRC,MKNK2,PLA2G4F,DUSP2,BAD,ELF5,PPM1J,PPP1R14B,STAT1,RAC3,ELF4,PPP2R1A,RRAS,RPS6KA4 |
| Cyclins and Cell Cycle Regulation | 1.46E + 00 | 8.97E-02 | HDAC5,TGFB1,PPM1J,PPP2R1A,E2F1,HDAC11,HDAC7 |
| Death Receptor Signaling | 1.53E + 00 | 8.70E-02 | PARP12,ACTG1,ZC3HAV1,LIMK1,TNFSF10,PARP9,PARP14,BIRC3 |
| Inhibition of Matrix Metalloproteases | 2.40E + 00 | 1.54E-01 | HSPG2,MMP10,TIMP1,MMP13,MMP15,SDC1 |
| Estrogen Receptor Signaling | 1.19E + 00 | 7.09E-02 | KAT2B,ERCC2,SRC,G6PC3,TAF6,MED24,TAF6L,RRAS,MED15 |
| Breast Cancer Regulation by Stathmin1 | 4.63E-01 | 4.71E-02 | ADCY1,ARHGEF19,PPM1J,PPP1R14B,LIMK1,PPP2R1A,E2F1,TUBA4A,RRAS |
Table 4
Clinicopathologic characteristics of the 12 patients, whose ER+, PR + status in breast tumors were analyzed by Ki67 and ER staining. This data is related to Figure 7B,C.
| Case # | Tumor | ER% | PR% | HER2 |
|---|---|---|---|---|
| 1 | IDC | 100 | 80 | Negative |
| 2 | IDC | 90 | 90 | Negative |
| 3 | Papillary | 100 | 70 | Non-amplified |
| 4 | IDC | 90 | 90 | Negative |
| 5 | IDC | 100 | 95 | Non-amplified |
| 6 | IDC | 100 | 30 | Negative |
| 7 | IDC | 100 | 10–40 | Negative |
| 8 | IDC | 80 | 50 | Negative |
| 9 | IDC | 50–60 | 80–90 | Negative |
| 10 | IDC | 100 | 100 | Non-amplified |
| 11 | IDC | 100 | 95 | Non-amplified |
| 12 | IDC | 95 | 95 | Negative |
Table 5
Primer sequences used for RTqPCR
| Gene name | Primer sequence |
|---|---|
| SRC-325F | GAGCGGCTCCAGATTGTCAA |
| SRC-410R | CTGGGGATGTAGCCTGTCTGT |
| E2F1-378F | ACGCTATGAGACCTCACTGAA |
| E2F1-626R | TCCTGGGTCAACCCCTCAAG |
| ERCC2-68F | GGAAGACAGTATCCCTGTTGGC |
| ERCC2-169R | CAATCTCTGGCACAGTTCTTGA |
| LIMK1-276F | CAAGGGACTGGTTATGGTGGC |
| LIMK1-367R | CCCCGTCACCGATAAAGGTC |
| MMP15-149F | AGGTCCATGCCGAGAACTG |
| MMP15-305R | GTCTCTTCGTCGAGCACACC |
| DUSP2-491F | GGGCTCCTGTCTACGACCA |
| DUSP2-574R | GCAGGTCTGACGAGTGACTG |
| RCOR2-118F | CACTCGCACGACAGCATGAT |
| RCOR2-285R | CATCGCAATGTACTTGTCAAGC |
| DKK1-95F | CCTTGAACTCGGTTCTCAATTCC |
| DKK1-232R | CAATGGTCTGGTACTTATTCCCG |
| PDGFB-63F | CTCGATCCGCTCCTTTGATGA |
| PDGFB-301R | CGTTGGTGCGGTCTATGAG |
| PGLYRP2-23F | TCCTACTCGGATTGCTACTGTG |
| PGLYRP2-206R | AAGTGGTAGAGGCGATTGTGG |
| ELF5-357F | TAGGGAACAAGGAATTTTTCGGG |
| ELF5-519R | GTACACTAACCTTCGGTCAACC |
| TNFSF10-46F | TGCGTGCTGATCGTGATCTTC |
| TNFSF10-126R | GCTCGTTGGTAAAGTACACGTA |
| STAT1-368F | ATCAGGCTCAGTCGGGGAATA |
| STAT1-553R | TGGTCTCGTGTTCTCTGTTCT |
| XAF1-297F | GCTCCACGAGTCCTACTGTG |
| XAF1-403R | GTTCACTGCGACAGACATCTC |
| IFI6-257F | GGTCTGCGATCCTGAATGGG |
| IFI6-401R | TCACTATCGAGATACTTGTGGGT |
Table 6
Analyses of the amino acids at the flanking sequences of top ER binders whose interactions are blocked by ERX-11 in MCF-7 and ZR-75 cells, as determined by unbiased IP-MS.
| Protein/GENE ID | # LXXLL motifs | LXXLL sequences | Serine at i ± 3/4 |
|---|---|---|---|
| Plectin Q15149-3 | 6 | 210 GHNLISLLEVL 220 213 LISLLEVLSGDS 224 421 YRELVLLLLQWM 431 659 LRYLQDLLAWV 669 1102 YQQLLQSLEQG 1112 4006 TGQLLLPLSDA 4016 | yes |
| FAM83H Q6ZRV2 | 2 | 816 AAQLLDTLGRS 826 966 SLRLRQLLSPK 976 | yes |
| AHNAK Q09666 | 0 | ||
| CLTC: cQ00610 | 5 | 563 TAFLLDALKNN 573 854 RNRLKLLLPWL 864 1001 PNELIELLEKIV 1011 1021 HRNLQNLLILT 1031 1418 PLLLNDLLMVLS 1429 | yes |
| FAS P49327 | 10 | 76 DPQLRLLLEVT 86 418 HATLPRLLRAS 428 560 QIGLIDLLSCM 570 691 APPLLQELKKV 701 1175 QQELPRLLSAA 1185 1211 EDPLLSGLLDSP 1221 1346 GFLLLHTLLRGH 1358 1470 RCVLLSNLSST 1480 2216 QLNLRSLLVNP 2226 2381 NRVLEALLPLKG 2391 | yes |
| TRG P27635 | 1 | 116 VNRLLDSLEPP 126 | no |
| ACTN4 O43707 | 1 | 81 GLKLMLLLEVIS 92 | yes |
| TFG Q92734 | 0 | ||
| Coatomer subunit alpha P53621 | 1 | 83 RRCLFTLLGHLDYI 96 | no |
| Q9NVI7-2 | 1 | 99 ALSLLHTLVWA 109 | no |
Appendix 1—Table 1
Characterization of the peptides
| LXXLL Peptide | Sequence | molecular mass (MALDI-TOF-MS) | |
| calculated | observed | ||
| SRC1 | Ac-LTARHKILHRLLQEGSPSD-NH2 | [M + H]+ for C96H162N32O28: 2212.2 | 2212.4 |
| SRC2 | Ac-DSKGQTKLLQLLTTKSDQM-NH2 | [M + H]+ for C92H162N26O32: 2176.2 | 2176.6 |
| AIB1 | Ac-ESKGHKKLLQLLTCSSDDR-NH2 | [M + H]+ for C92H159N29O31: 2199.2 | 2199.8 |
| PELP1 | Ac-SIKTRFEGLCLLSLLVGESPT-NH2 | [M + H]+ for C103H174N26O31: 2304.3 | 2304.6 |
Download links
A two-part list of links to download the article, or parts of the article, in various formats.
Downloads (link to download the article as PDF)
Open citations (links to open the citations from this article in various online reference manager services)
Cite this article (links to download the citations from this article in formats compatible with various reference manager tools)
Estrogen receptor coregulator binding modulators (ERXs) effectively target estrogen receptor positive human breast cancers
eLife 6:e26857.
https://doi.org/10.7554/eLife.26857


