Distinct Akt phosphorylation states are required for insulin regulated Glut4 and Glut1-mediated glucose uptake
- Weill Cornell Medicine, United States
Figures
Figure 1 with 2 supplements
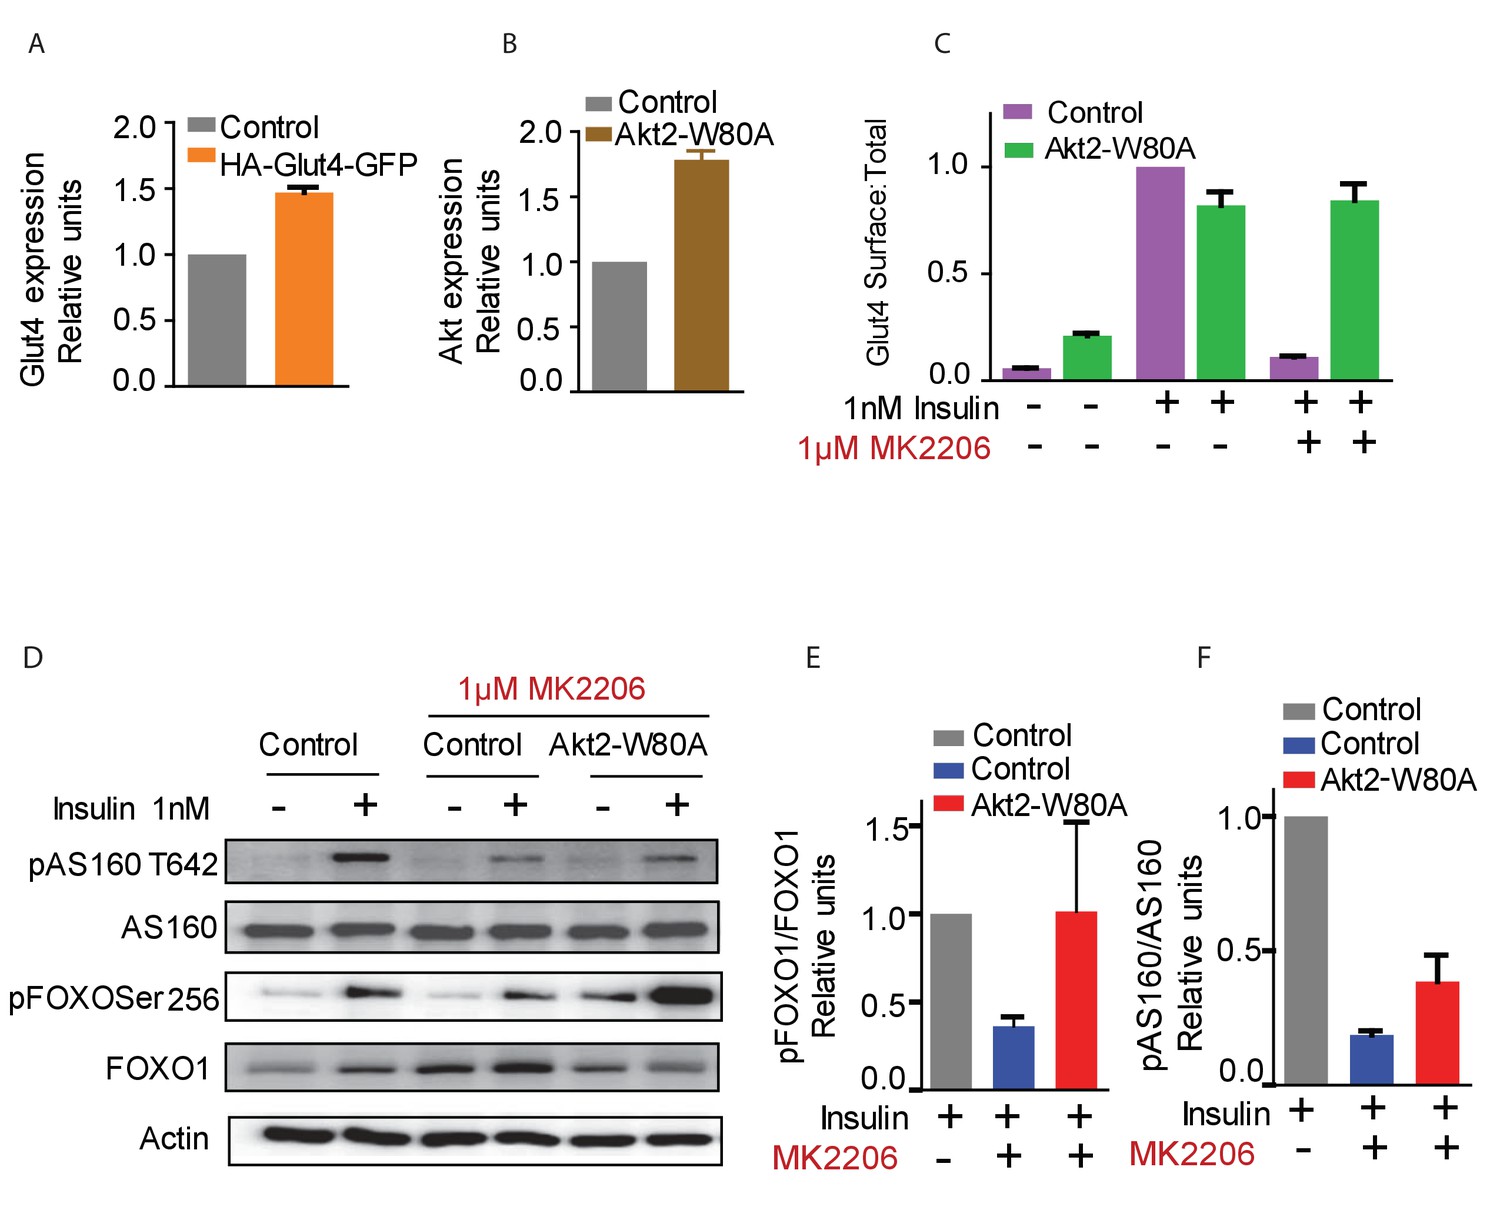
Function of ectopic Akt can be selectively studied by expression of Akt2-W80A and using Akt inhibitor MK2206.
(A and B) Relative expression levels of HA-Glut4-GFP reporter (A) and Akt2-W80A (B) relative to endogenous proteins in 3T3-L1 adipocytes used in this study. Cultured 3T3-L1 adipocytes were electroporated with HA-Glut4-GFP or Akt2-W80A. The cells were then stained with antibodies against the endogenous protein to measure the expression of ectopic protein relative to the endogenous. GFP fluorescence (HA-Glut4-GFP) or FLAG staining (Akt2-W80A) was used to identify cells expressing the ectopic construct. Akt expression depicts total Akt expression. Data are normalized to the expression level in control adipocytes. Data shows average of two independent experiments± SEM. (C) Insulin stimulated translocation of HA-Glut4-GFP in control adipocytes or adipocytes expressing Akt2-W80A with or without the Akt inhibitor MK2206. Cells were stimulated with insulin for 30 min. To inhibit Akt, cells were treated for 60 min with MK2206 before insulin treatment. Data are normalized to the Glut4 surface expression in control cells treated with 1 nM insulin. Data shows average of three independent experiments± SEM. (D) Phosphorylation of Akt substrates AS160 and FOXO1 under the conditions used in (C). (E and F) quantification of AS160 and FOXO1 phosphorylation from (D).
Figure 1—figure supplement 1
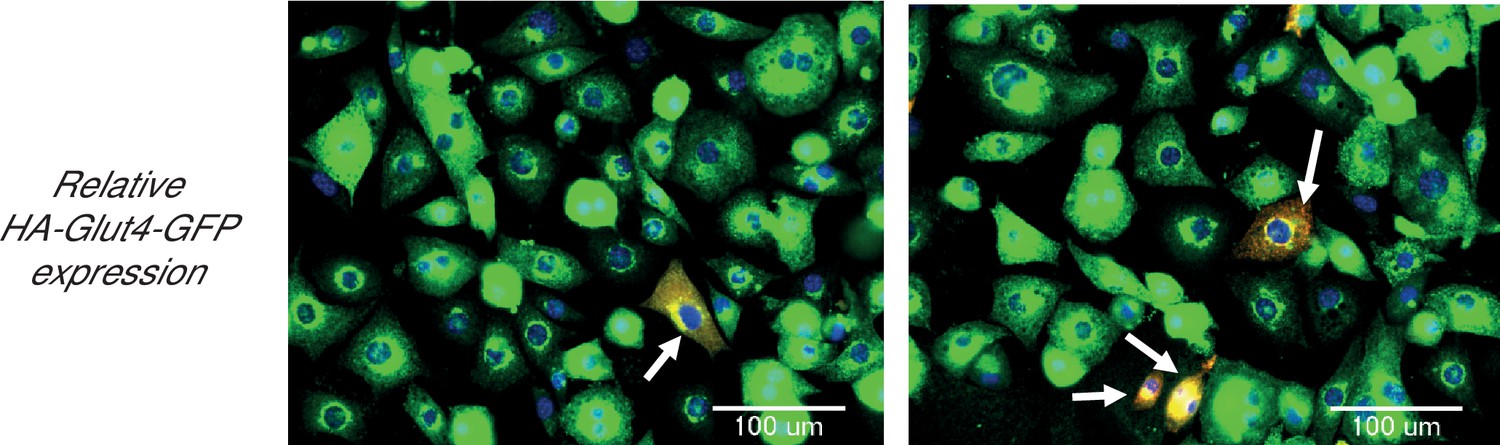
Adipocytes showing expression levels of ectopic Glut4, relative to endogenous Glut4.
Cells were electroporated with HA-Glut4-GFP. The total Glut4 was stained with antibody against endogenous protein. Expression levels in native and electroporated cells was quantified in the same field using quantitative fluorescence microscopy. The cells expressing the ectopic construct were identified by HA-epitope staining. The endogenous protein is shown in green, while the ectopic protein is stained red. Cells expressing the ectopic protein are shown as overlay (yellow, arrows). A minimum of 30 cells were counted in each condition. Images represent representative of two independent experiments. Scale bar = 100 µm.
Figure 1—figure supplement 2

Adipocytes showing expression levels of ectopic Akt2-W80A, relative to endogenous Akts.
Cells were electroporated with Akt2-W80A. The total Akts were stained with antibody against endogenous Akts. Expression levels in native and electroporated cells was quantified in the same field using quantitative fluorescence microscopy. The cells expressing the ectopic construct were identified by FLAG-epitope staining. The endogenous protein is shown in green, while the ectopic protein is stained red. Cells expressing the ectopic protein are shown as overlay (yellow, arrows). A minimum of 30 cells were counted in each condition. Images represent representative of two independent experiments. Scale bar = 100 µm.
Figure 2
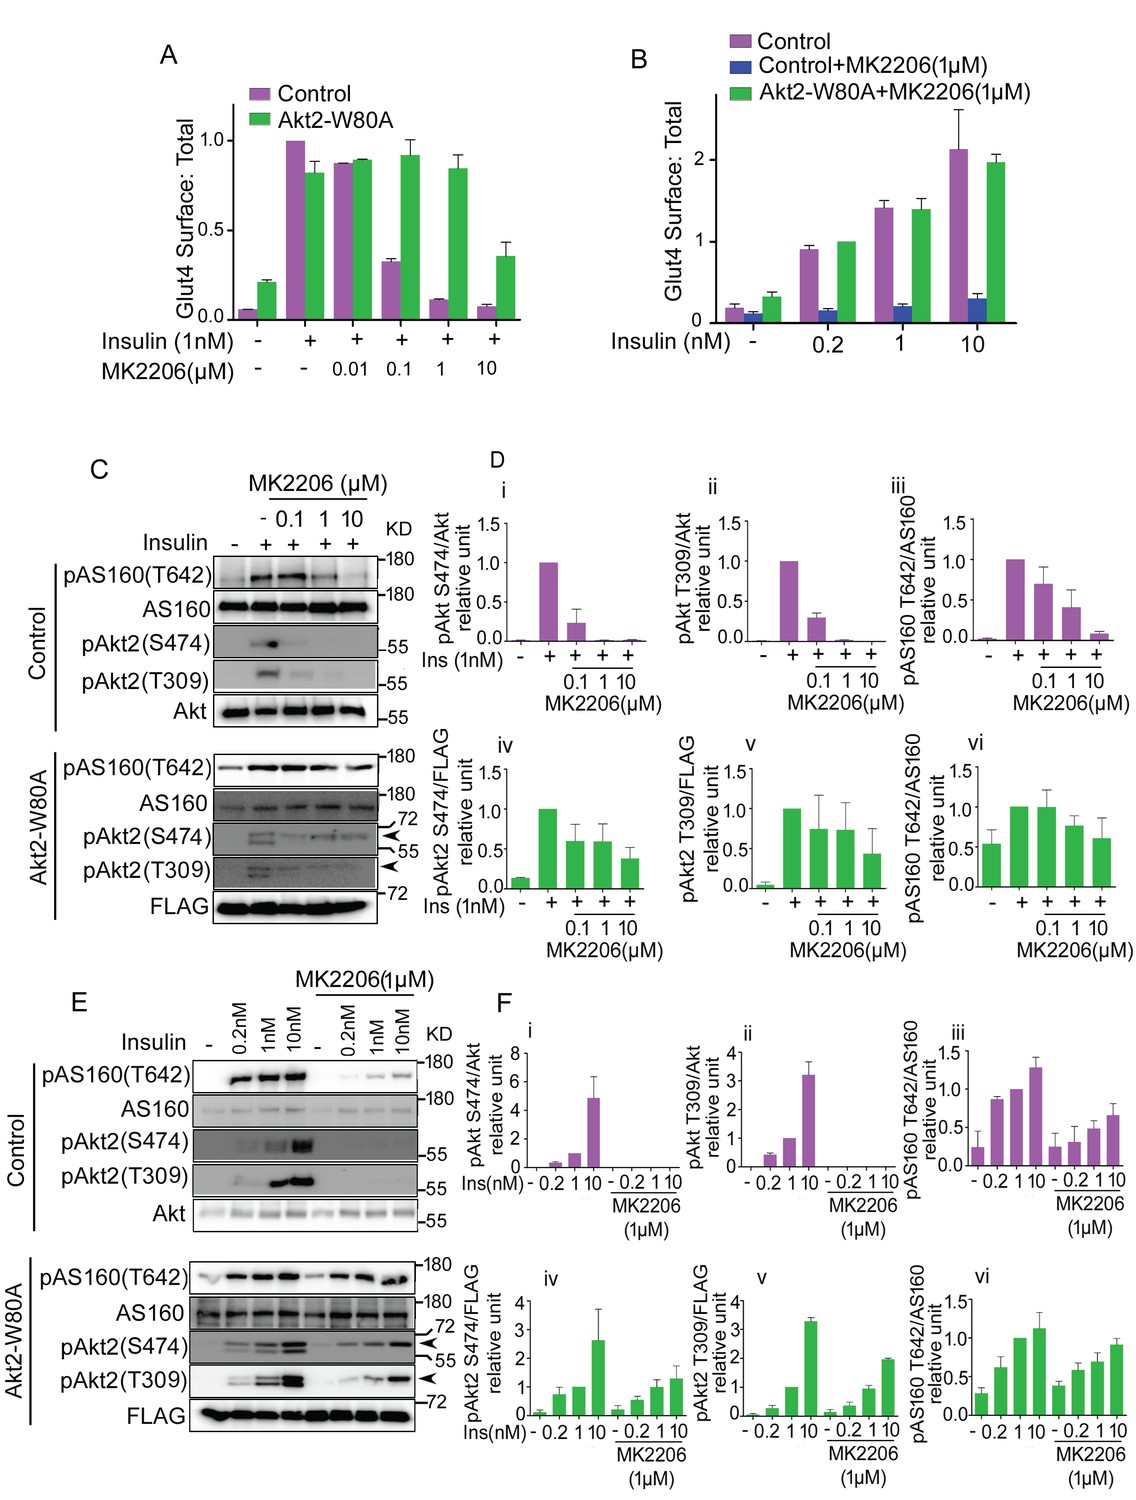
Akt substrate phosphorylation does not directly reflect its physiological activity.
(A and B). Optimization of the dose of MK2206 and insulin to study insulin stimulated Glut4 translocation in 3T3-L1 adipocytes. Surface (Cy3 anti-HA) to total (GFP) ratio of HA-GLUT4-GFP is plotted in control adipocytes or adipocytes co-expressing Akt-W80A. Cells were pretreated with the indicated dose of MK2206 for 1 hr followed by 30 min stimulation by insulin. More than 30 cells were quantified per condition per assay. Mean normalized values ± SEM. n = 3–4 independent experiments. In panel A, the data of the individual experiments are normalized to Glut4 surface to total value in control cells stimulated with 1 nM insulin. In panel B, the data are normalized to Glut4 surface to total value in Akt2-W80A + MK2206, 0.2 nM insulin condition. (C and E). In a similar experimental setup, cell lysates were collected and subjected to immunoblot analysis for Akt and AS160 phosphorylation. Arrow heads note the migration of ectopically expressed Akt, whose migration is slower due to the amino-terminal Flag epitope. (D and F). The quantification for (C) and (E) respectively. (i-iii) control adipocytes, (iv-vi) adipocytes transiently transfected with ectopic Akt. Each data normalized to 1 nM insulin. n = 5 independent experiments.
Figure 3
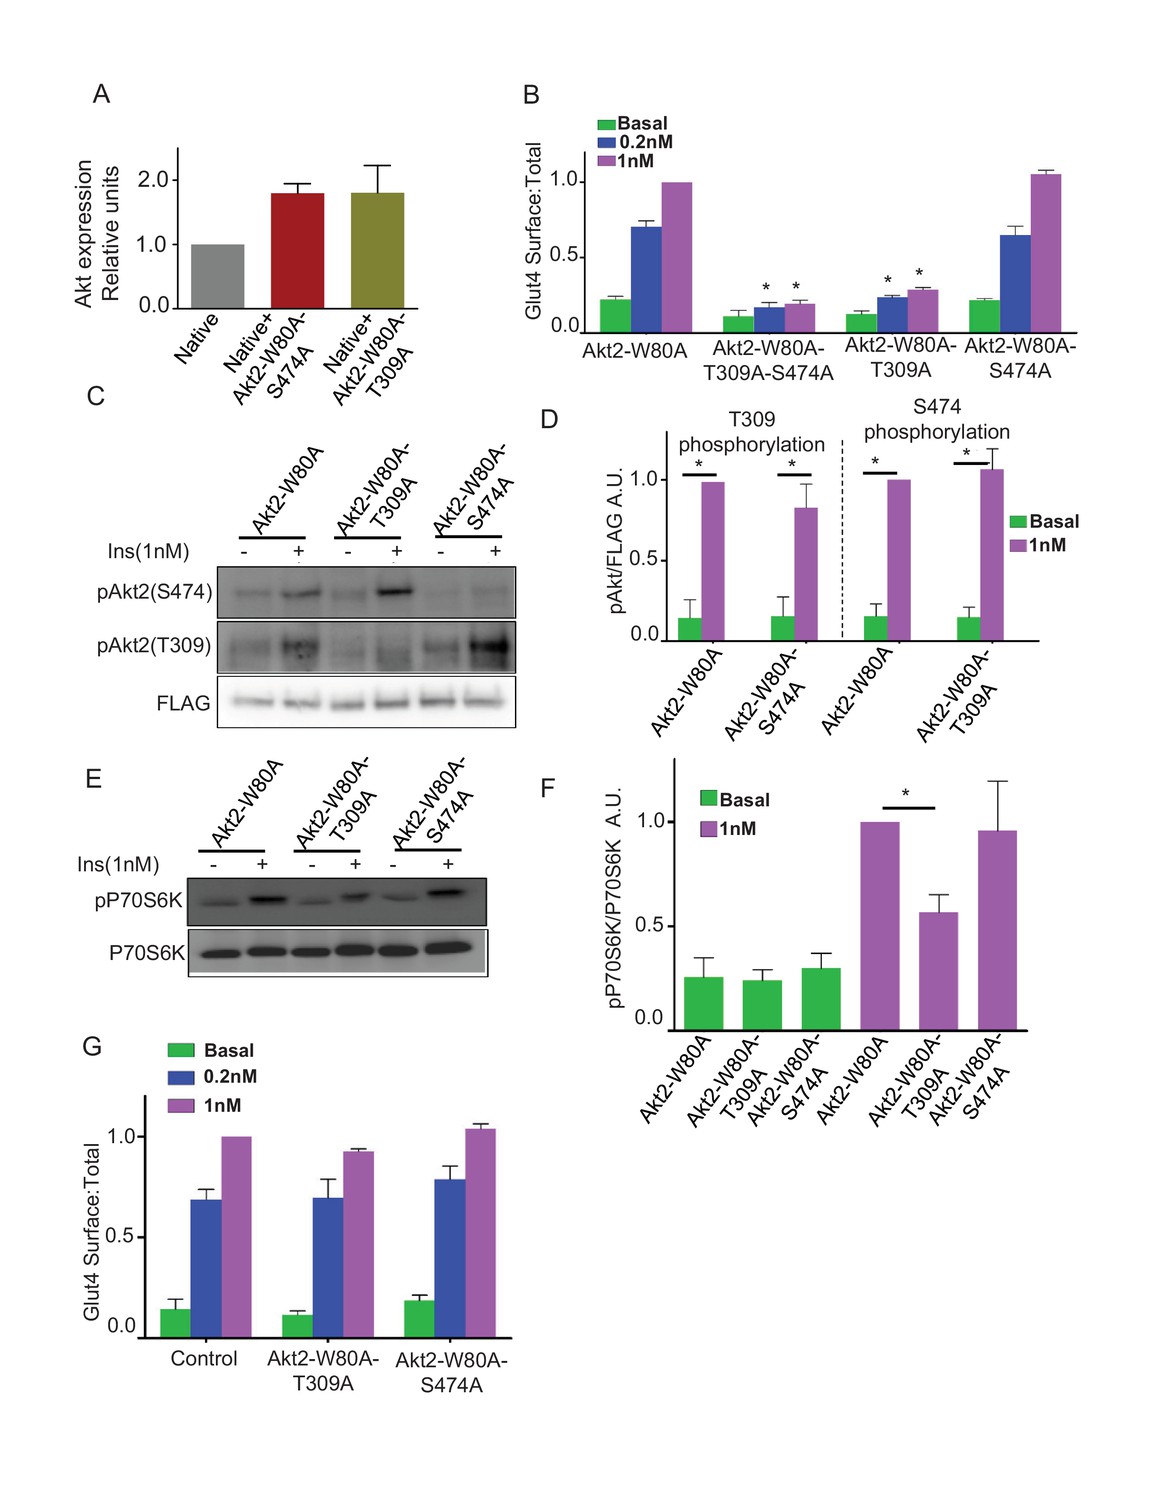
Phosphorylation of T309 is required and sufficient for insulin effect on GLUT4 and mTORC1.
(A) Relative levels of expression of Akt2-W80A-S474A or Akt2-W80A-T309A in cells electroporated with the respective construct. Expression levels are measured with antibody that identify total Akt similar to Figure 1A. Data are normalized to the expression level in control adipocytes. Data shows average of 2 independent experiments ± SEM. (B) Quantification of surface-to-total ratio of HA-Glut4-GFP in 3T3-L1 adipocytes transiently co-expressing indicated mutants of Akt2. Cells were pretreated with MK2206 for 1 hr followed by 30 min insulin stimulation. More than 30 cells quantified per condition per assay. Mean normalized values ± SEM. n = 5–7 independent experiments. The data of the individual experiments are normalized to Glut4 surface to total value in control cells stimulated with 1 nM insulin. *p<0.05 compared to the respective Glut4 surface to total value in Akt2-W80A cells. (C) Representative immunoblot for Akt phosphorylation on T309 or S474 in cells expressing indicated Akt2 mutants. FLAG expression is shown as the level of expression of the Akt2 mutants. (D) Quantitation of blots similar to panel B. Averages ± SEM are plotted normalized to insulin stimulated condition. n = 6 independent experiments. *p<0.05. (E) P70-S6 kinase phosphorylation was assessed in cells expressing indicated Akt mutants. (F) Quantitation of blots similar to panel D. Average ± SEM are plotted normalized to insulin stimulated Akt2-W80A. n = 3 independent experiments. *p<0.05. (G) Quantification of surface-to-total HA-Glut4-GFP in control adipocytes or adipocytes co-expressing Akt2-W80A-T309A or Akt2-W80A-S474A. Cells without insulin stimulation (basal) or stimulated for 30 min with insulin were studied without inhibition of native Akt’s by MK2206. Data are means ± SEM, n = 2.
Figure 4
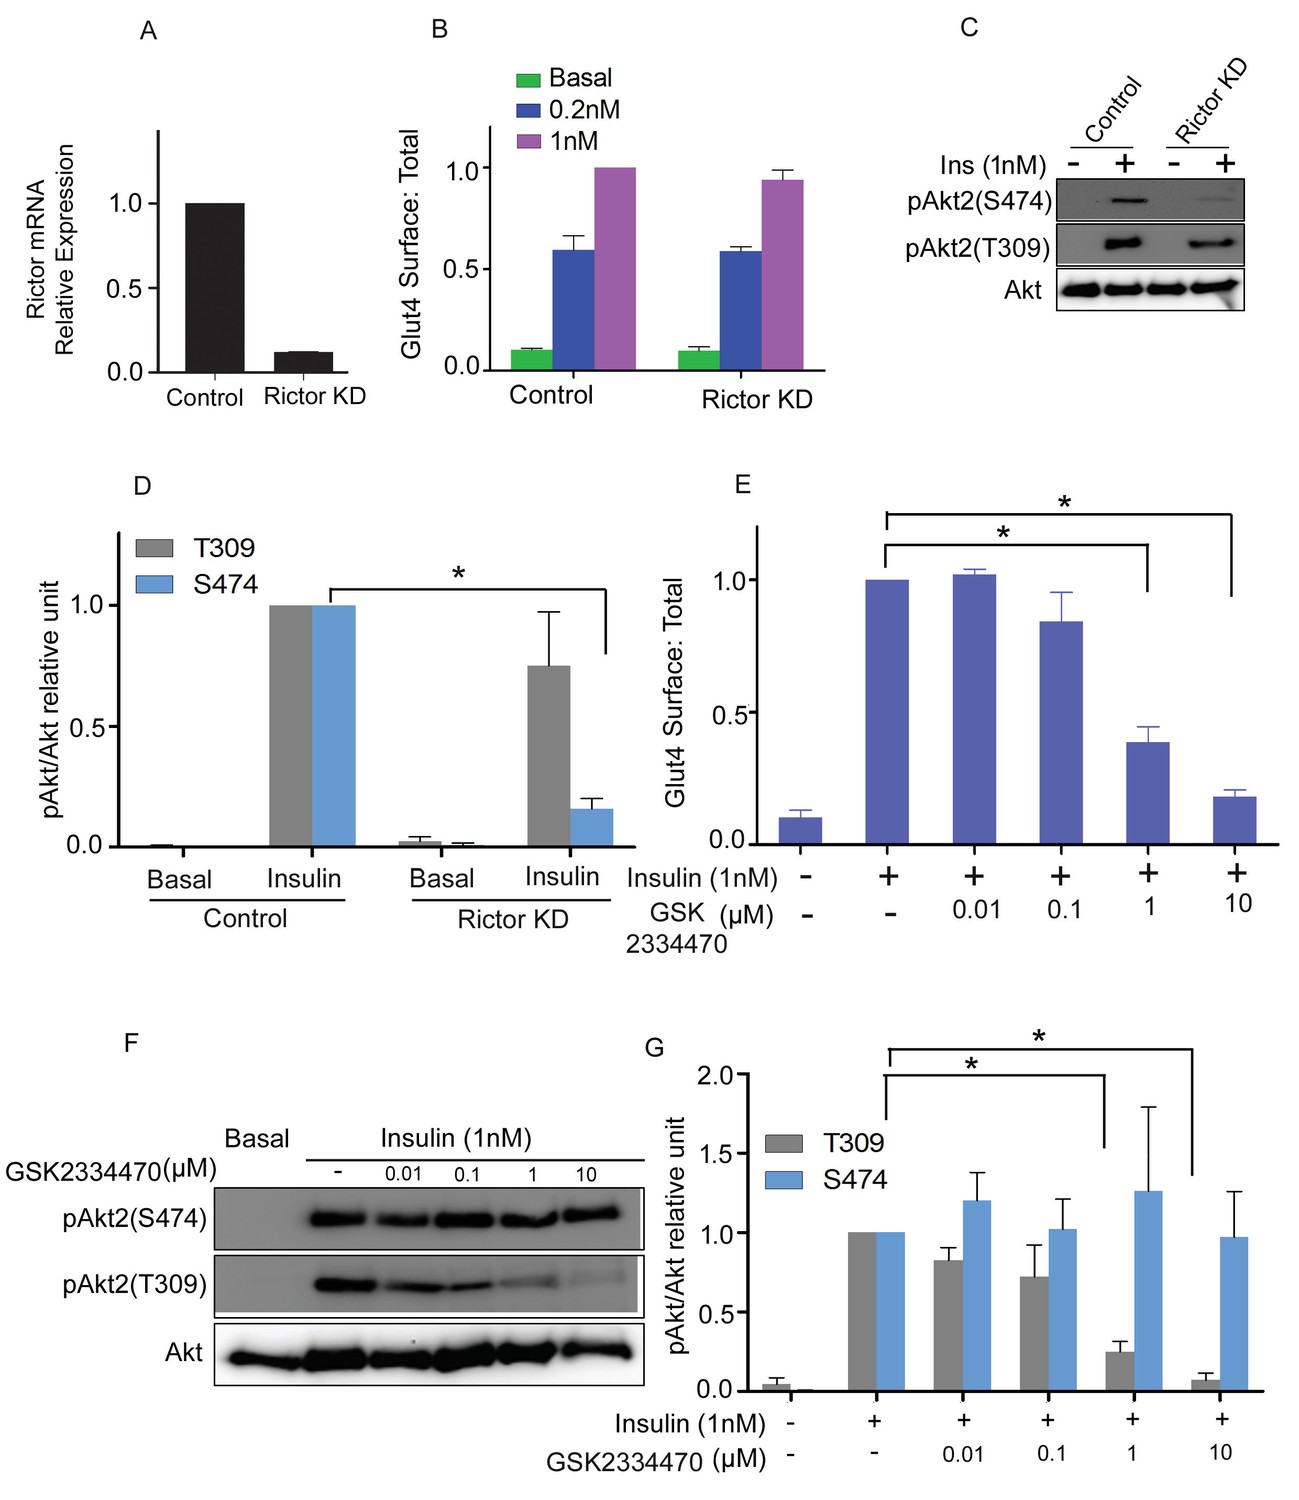
mTORC2 is not required for insulin’s regulation of Glut4.
(A) 3T3-L1 adipocytes were transfected with Rictor siRNA and cell lysates collected 48 hr later. RT-PCR was performed for Rictor knockdown assessment. n = 3 independent experiments. (B) Quantification of surface-to-total ratio of HA-Glut4-GFP in control adipocytes and rictor knockdown adipocytes in basal and insulin treated conditions. Mean normalized values ± SEM. n = 3 independent experiments. The data of the individual experiments are normalized to Glut4 surface to total value in control cells stimulated with 1 nM insulin. (C) Immunoblot to assess Akt phosphorylation (S474/T309) in control and Rictor knockdown cells. Representative blot. (D) Quantitation of blots similar to (C). Mean ± SEM normalized to 1 nM insulin treated control cells is plotted. n = 4 independent assays. *p<0.05. (E) Quantification of surface-to-total ratio of HA-Glut4-GFP in control adipocytes and adipocytes pretreated for 30 min with indicated doses of PDPK1 inhibitor GSK2334470, prior to insulin stimulation for next 30 min. Mean normalized values ± SEM. n = 5 independent assays. The data of the individual experiments are normalized to Glut4 surface to total value in control cells stimulated with 1 nM insulin. *p<0.05. (F) Representative immunoblots assessing insulin-stimulated phosphorylation of Akt after 30 min pretreatment with the indicated doses of GSK2334470. (G) Quantitation of blots similar to (F). Average is plotted normalized to 1 nM insulin treated control cells. n = 4 independent assays. *p<0.05.
Figure 5
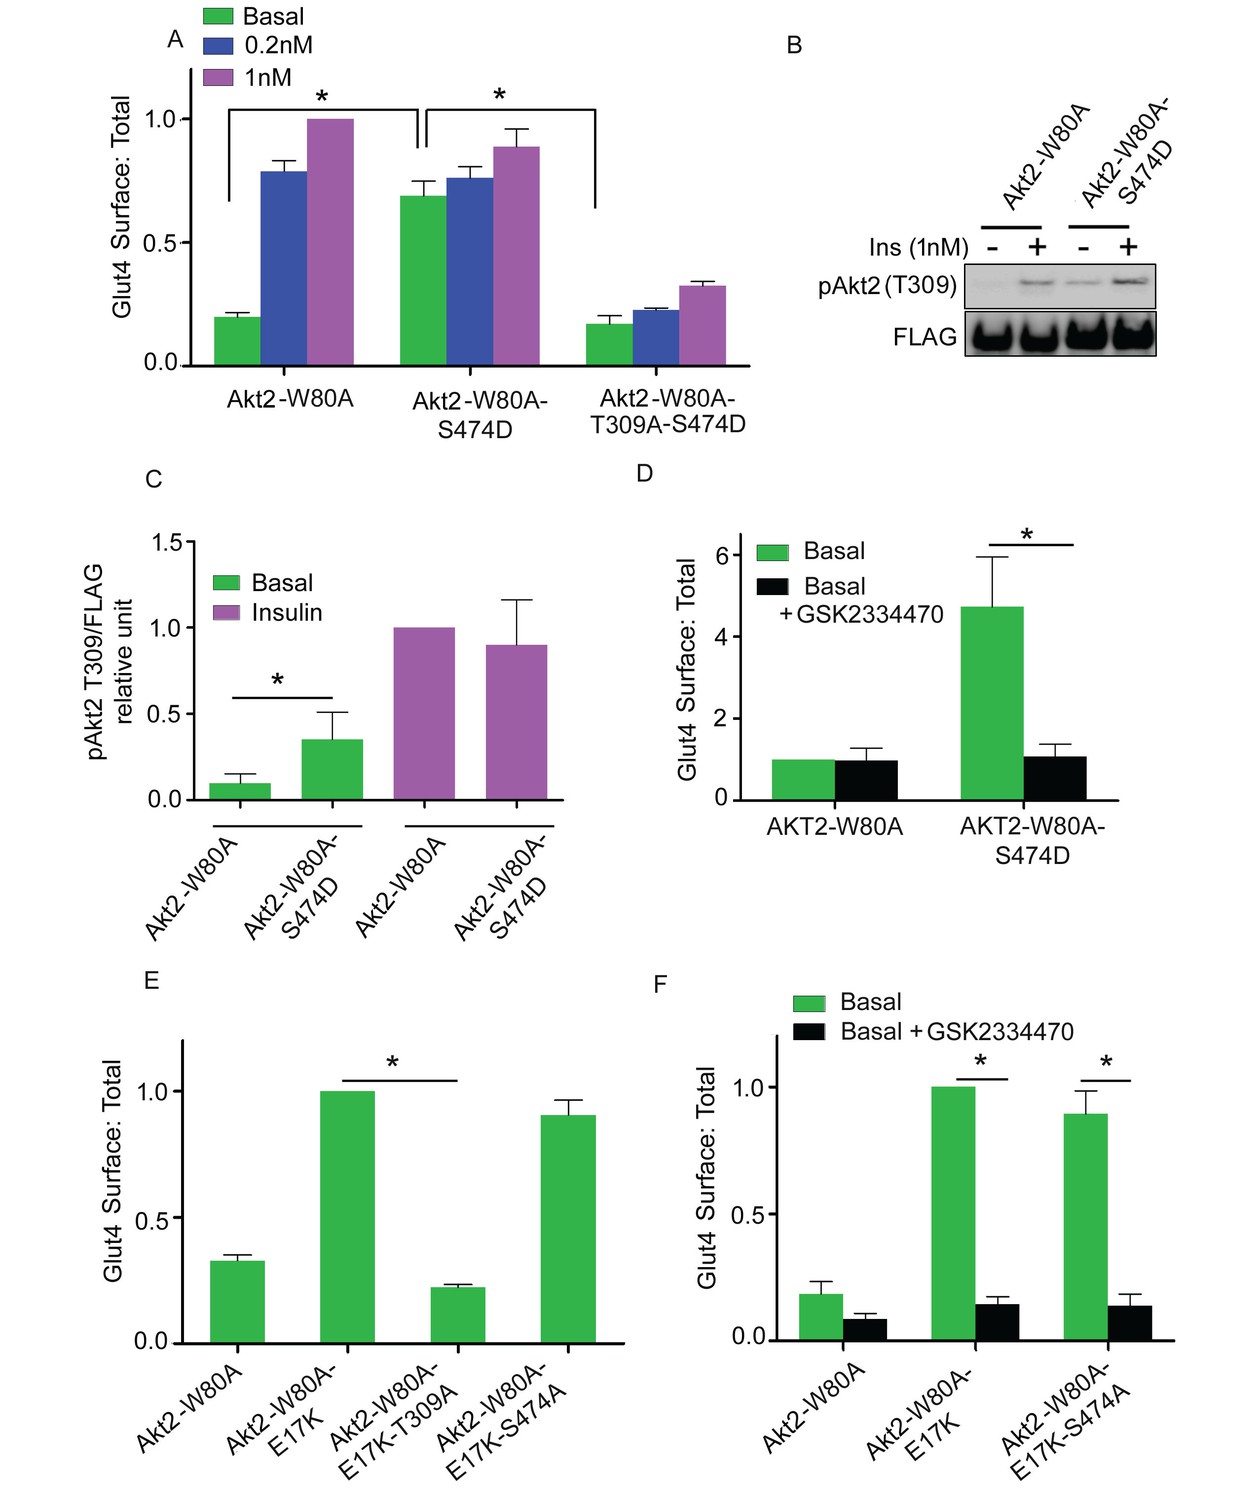
Akt2 constitutively active mutants require T309 phosphorylation.
(A) Quantification of surface-to-total ratio of HA-Glut4-GFP in 3T3-L1 adipocytes transiently co-expressing indicated Akt2 mutants. Cells were pretreated with MK2206 for 1 hr followed by 30 min insulin stimulation. More than 30 cells were quantified per condition per assay. Mean normalized values ± SEM. n = 3–4 independent assays. The data of the individual experiments are normalized to Glut4 surface to total value in control cells stimulated with 1 nM insulin. *p<0.05. (B) Representative immunoblot of T309 phosphorylation in cells expressing Akt2-W80A or Akt2-W80A-S474D. Cells were pretreated with MK2206 followed by 1 nM insulin for 30 min. Cell lysates were subjected to western blotting to assess phosphorylation. FLAG expression was used as measure of Akt2 expression. (C) Quantitation of blots similar to (B). Mean ± SEM is plotted normalized to insulin stimulated Akt2-W80A. n = 3 independent assays. *p<0.05. (D) Quantification of surface-to-total ratio of HA-Glut4-GFP in cell co-expressing Akt2-W80A or Akt2-W80A-S474D under basal state. Cells were pretreated with MK2206 for 1 hr where GSK2334470, a PDPK inhibitor co-incubated for last 30 min. More than 30 cells quantified per condition per assay. Mean normalized values ± SEM. n = 3 assays. The data of the individual experiments are normalized to Glut4 surface to total value in basal control cells stimulated. *p<0.05. (E) Quantification of surface-to-total ratio of HA-Glut4-GFP in cells co-expressing Akt2-W80A or constitutively active mutant Akt2-W80-E17K and its T309A and S474A mutants. Cells were pretreated with MK2206 for 1 hr and Glut4 Surface to total determined in basal condition. More than 30 cells quantified per condition per assay. Mean normalized values ± SEM. n = 4 independent assays. The data of the individual experiments are normalized to Glut4 surface to total value in cells expressing Akt2-W80A-E17K. *p<0.05. (F) Quantification of surface-to-total ratio of HA-Glut4-GFP in cells co-expressing indicated mutants under basal state. Cells were pretreated with MK2206 for 1 hr where GSK2334470, a PDPK1 inhibitor co-incubated for last 30 min. More than 30 cells quantified per condition per assay. n = 3 assays. The data of the individual experiments are normalized to Glut4 surface to total value in cells expressing Akt2-W80A-E17K. *p<0.05.
Figure 6
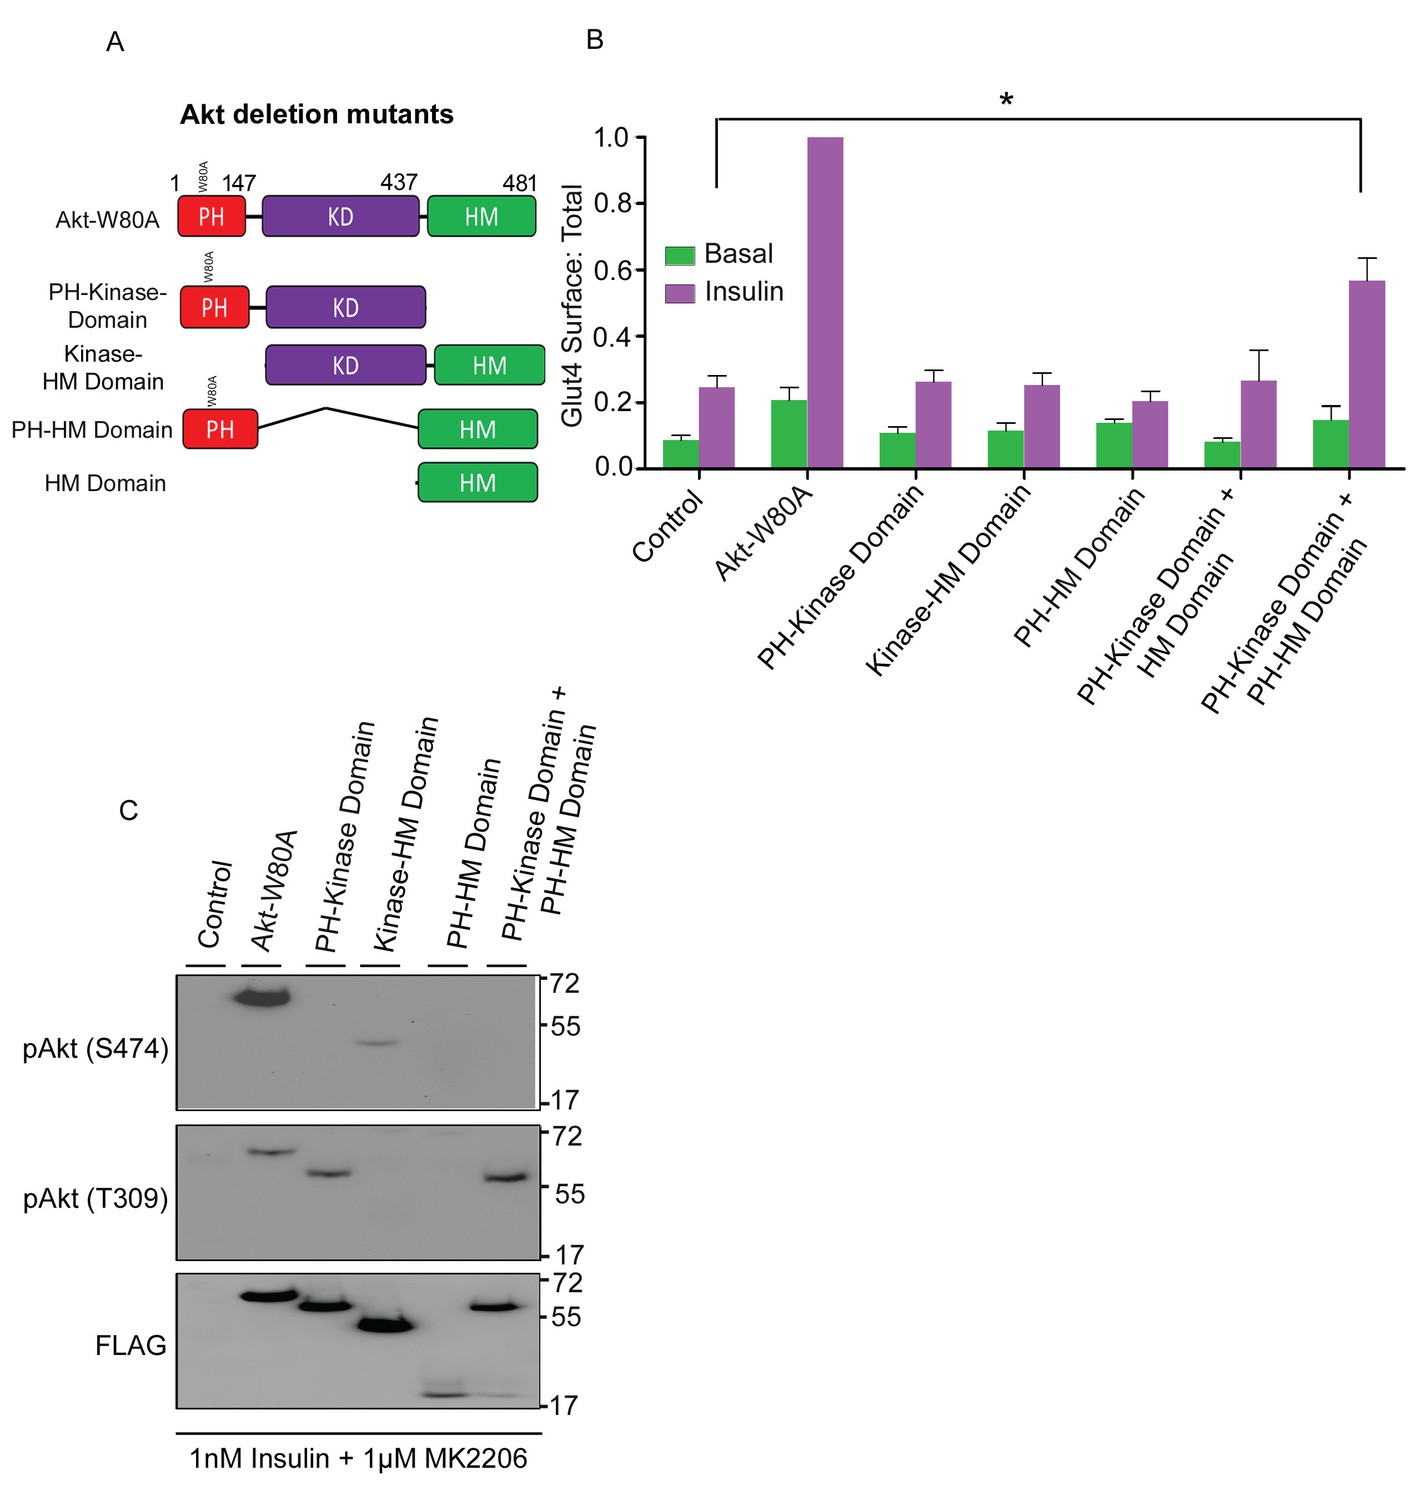
HM domain targeted to membrane can complement kinase domain in-trans to restore Akt2 activity.
(A) Schematic representation of full-length Akt2-W80A and indicated domain deletion constructs. Numbers represent domains boundaries deduced from literature. (B) Quantification of surface-to-total ratio of HA-Glut4-GFP in control adipocytes or adipocytes transiently co-expressing either full length Akt2-W80A or indicated deletion mutants. Cells were pretreated with MK2206 for 1 hr followed by 30 min insulin stimulation. More than 30 cells quantified per condition per assay. Mean normalized values ± SEM. n = 6 independent assays. The data of the individual experiments are normalized to Glut4 surface to total value in Akt2-W80A expressing cells stimulated with 1 nM insulin. *p<0.05. (C) Representative immunoblot of Akt2 phosphorylation (T309/S474) in cells expressing full length and indicated deletion mutants. Cells were pretreated with MK2206 and stimulated with insulin for 30 min. n = 3 independent experiments.
Figure 7 with 2 supplements
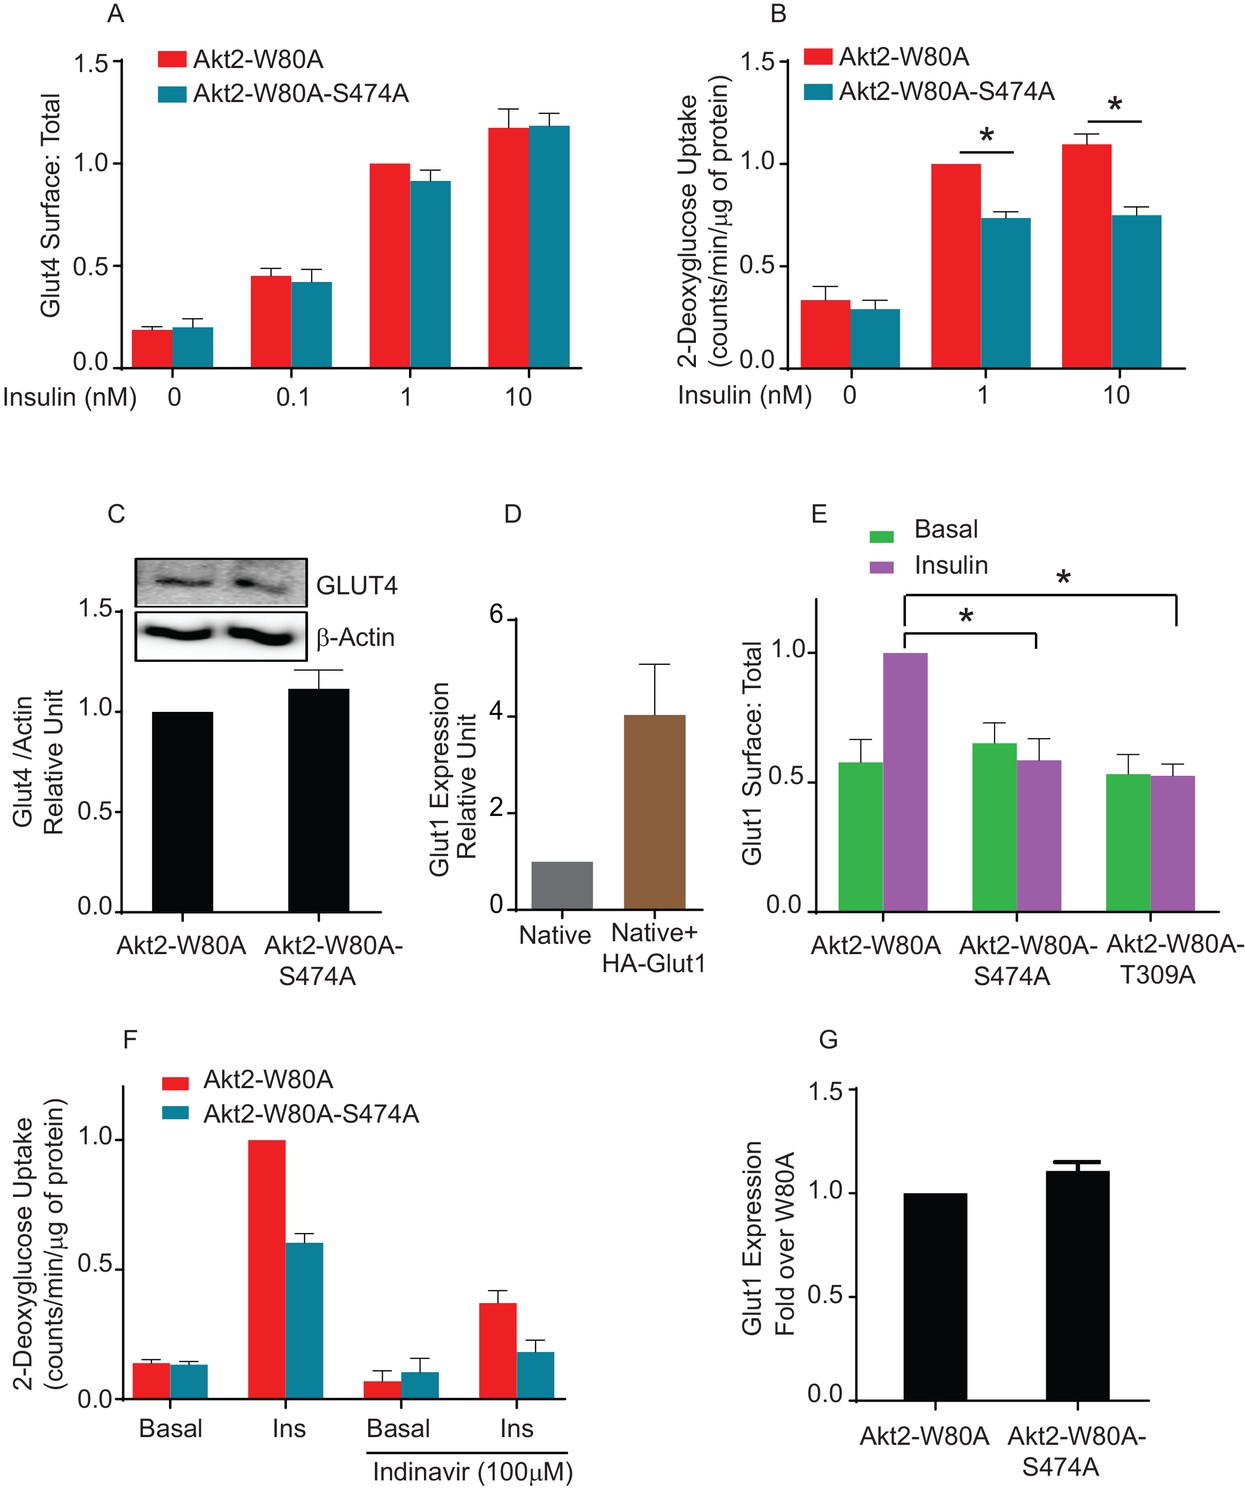
Akt2 phosphorylation on S474 is required for insulin mediated Glut1 translocation and Glut1-mediated glucose uptake.
(A) Quantification of surface-to-total ratio of HA-Glut4-GFP in adipocyte stably expressing Akt2-W80A and Akt2-W80A-S474A. Cells were pretreated with MK2206 for 1 hr followed by indicated dose of insulin. Mean normalized values ± SEM is plotted. n = 3 independent experiments. The data of the individual experiments are normalized to Glut4 surface to total value in Akt2-W80A cells stimulated with insulin. (B) 2-Deoxyglucose uptake was measured in cells stably expressing Akt2-W80A or Akt2-W80A-S474A. Cell were pretreated with MK2206 for 1 hr followed by indicated dose of insulin for 30 min. Glucose uptake was performed in last 5 min of post insulin stimulation. 3H-2-deoxyglcusoe uptake was normalized to total protein content for each well in every assay. Each data further normalized to 1 nM insulin treated Akt2-W80A cells. n = 5 independent experiments. *p<0.05. (C) Representative immunoblot of Glut4 and respective actin expression in cells stably expressing W80A or S474A Akt2 mutants (inset). Bars represent quantitation of the immunoblot. Mean normalized values ± SEM is plotted. n = 3 independent experiments. (D) Relative levels of expression of HA-Glut1 in electroporated cells. Expression levels are measured with antibody that identify both endogenous and ectopic Glut1. Data are normalized to the expression level in control adipocytes. Data shows average of 2 independent experiments± SEM. (E) Quantification of surface-to-total ratio of HA-Glut1 expression in 3T3-L1 adipocytes transiently expressing indicated Akt2 mutants under basal and insulin stimulated condition. Cells were pretreated with MK2206 for 1 hr followed by insulin (170 nM) treatment. Data is normalized to insulin treated Akt2-W80A. Mean normalized values ± SEM is plotted. n = 6 independent experiments.*p<0.05. (F) Fraction of Glut4 mediated 2-Deoxyglucose uptake in cells stably expressing Akt2-W80A or Akt2-W80A-S474A was determined by incubation of cells with HIV protease inhibitor, Indinavir for 2 hr. MK2206 was co-incubated in last 1 hr during the course of indinavir incubation followed by 170 nM insulin stimulation. Glucose uptake was performed in last 5 min of post insulin stimulation. 3H-2-deoxyglcusoe uptake was normalized to total protein content for each well in every assay. Each data further normalized to insulin treated Akt2-W80A cells. n = 3. *p<0.05. (G) Quantitation of the expression level of endogenous Glut1 in cells stably expressing Akt2-W80A or Akt2-W80A-S474A. More than 200 cells were counted in each assay. Mean normalized values ± SEM is plotted. n = 3 independent experiments.
Figure 7—figure supplement 1
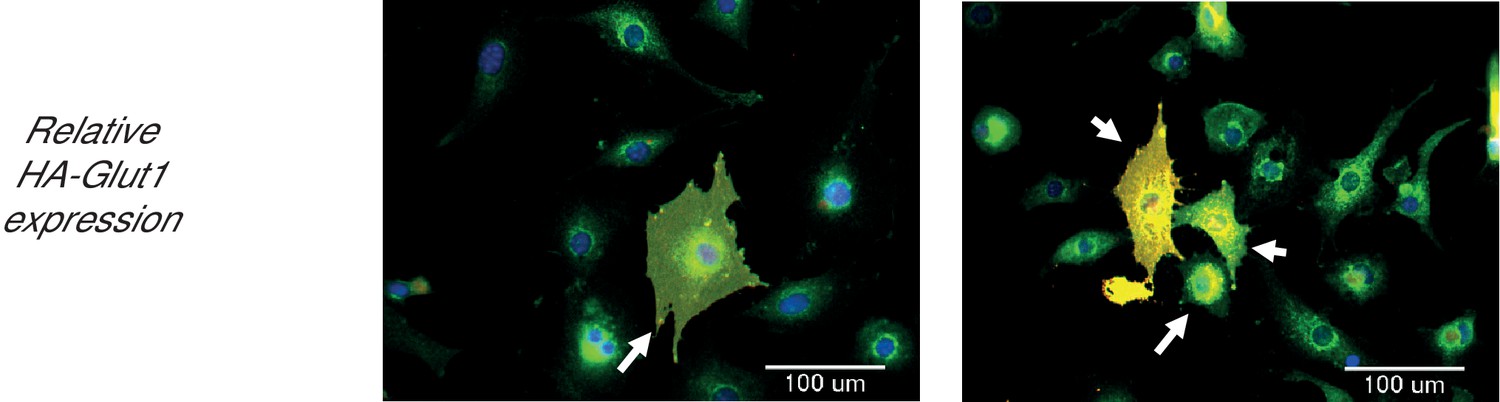
Adipocytes showing expression levels of ectopic Glut1, relative to endogenous Glut1.
Cells were electroporated with HA-Glut1. The total Glut1 was stained with antibody against endogenous protein. Expression levels in native and electroporated cells was quantified in the same field using quantitative fluorescence microscopy. The cells expressing the ectopic construct were identified by FLAG-epitope staining. The endogenous protein is shown in green, while the ectopic protein is stained red. Cells expressing the ectopic protein are shown as overlay (yellow, arrows). A minimum of 30 cells were counted in each condition. Images represent representative of two independent experiments. Scale bar = 100 µm.
Figure 7—figure supplement 2
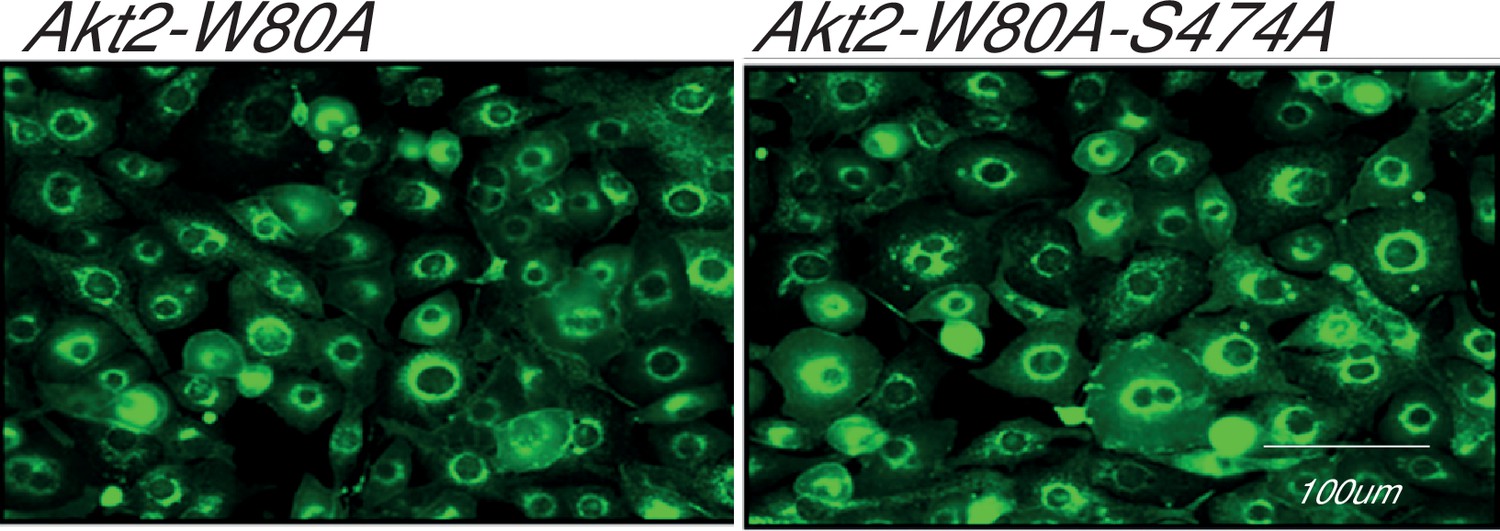
Adipocytes stably expressing Akt2-W80A or Akt2-W80A-S474A showing expression levels of endogenous Glut1.
Relative endogenous Glut1 expression in cultured 3T3-L1 adipocytes stably expressing Akt2-W80A (left) or Akt2-W80A-S474A (right). Cells stably expressing the respective AKT2 construct were stained with antibody against native Glut1. The expression level was measured using quantitative fluorescence microscopy. A minimum of 200 cells were counted in each condition. Images represent representative of three independent experiments. Scale bar = 100 µm.
Figure 8

Akt2 phosphorylation on S474 mediates Glut1 trafficking and glucose uptake downstream of KRAS mutant.
(A) Glut1 translocation was measured in 3T3-L1 adipocytes transiently expressing Akt2-W80A or co-expressing Akt2-W80A and AS160-4A. Serum-starved cells were treated with 1 µM MK2206 for one hours prior to a 30 min incubation ±170 nM insulin. HA-Glut1 reporter was used to quantify glut1 on the surface normalized to total glut1 expression. Data are mean ± SEM of 4 experiments. Data from individual experiments are normalized to the value for insulin-stimulated Akt2-W80A expressing cells. *p<0.05. (B) Transferrin receptor translocation was measured in response to insulin in 3T3-L1 adipocytes transiently co-expressing Akt2-W80A or Akt2-W80A-S474A and the human transferrin receptor. Serum-starved cells were treated with 1 µM MK2206 for one hours prior to a 30 min incubation ±170 nM insulin. Data are mean ± SEM of 3 experiments. Data from individual experiments are normalized to the value for insulin-stimulated Akt2-W80A expressing cells. *p<0.05. (C) Glut1 translocation in KP1 lung cancer cells. HA-Glut1 reporter translocation was measured in KP1 cells transiently expressing Akt2-W80A or Akt2-W80A-S474A. Serum-starved cells were treated with 1 µM MK2206 for one hours prior to a 30 min incubation ±170 nM insulin. HA-Glut1 reporter was used to quantify Glut1 on the surface normalized to total Glut1 expression. Each data has been normalized to the basal Glut1 surface:total in Akt2-W80A. n = 4 independent experiments. *p<0.05. (D) Basal glucose uptake in KP1 cells. KP1 cells stably expressing Akt2-W80A or Akt2-W80A-S474A were serum starved for 5 hr, with 1 µM MK2206 added for the last hour. 3H-2-deoxyglcusoe uptake was measured during the last 2 min. Each data has been normalized to the glucose uptake in Akt2-W80A. n = 4 independent experiments. *p<0.05.
Download links
A two-part list of links to download the article, or parts of the article, in various formats.
Downloads (link to download the article as PDF)
Open citations (links to open the citations from this article in various online reference manager services)
Cite this article (links to download the citations from this article in formats compatible with various reference manager tools)
Distinct Akt phosphorylation states are required for insulin regulated Glut4 and Glut1-mediated glucose uptake
eLife 6:e26896.
https://doi.org/10.7554/eLife.26896


