Rv3723/LucA coordinates fatty acid and cholesterol uptake in Mycobacterium tuberculosis
- Cornell University, United States
Figures
Figure 1 with 2 supplements
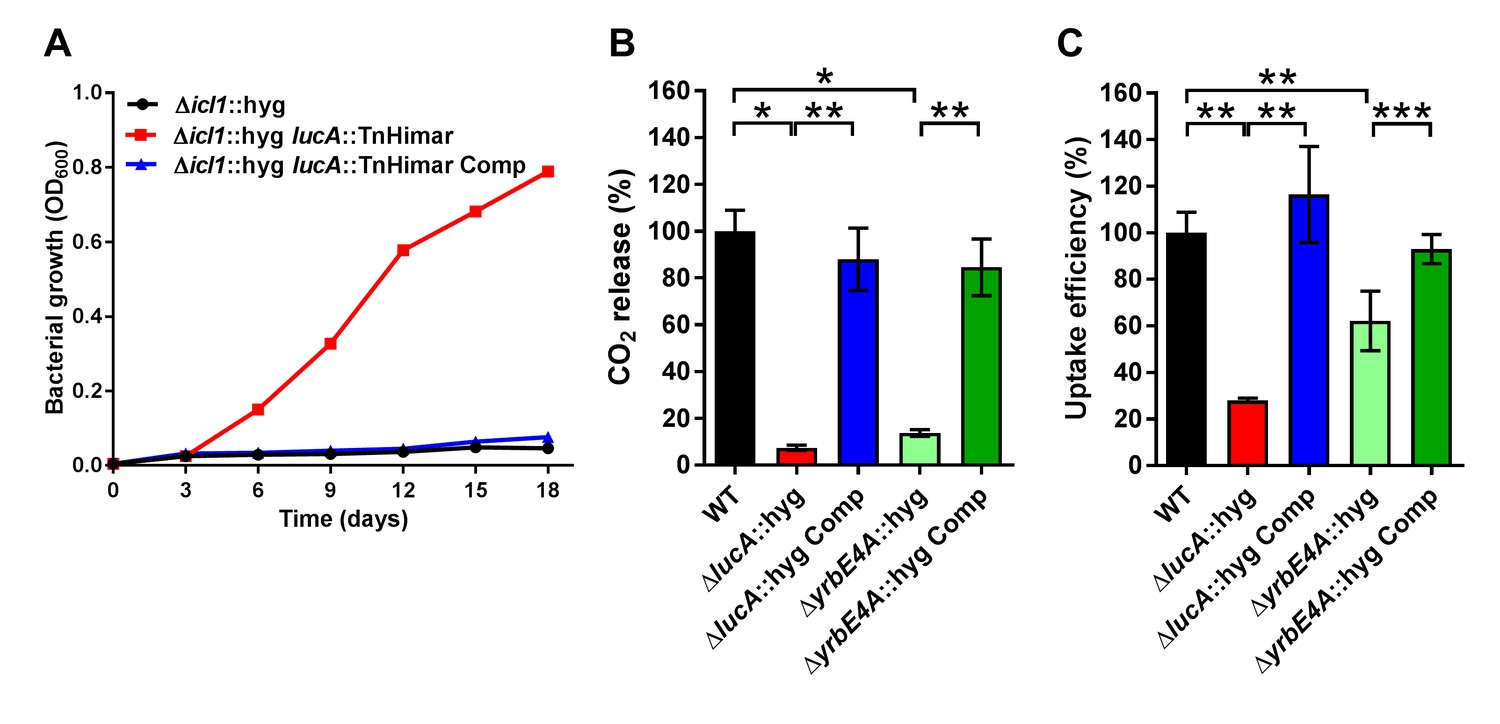
LucA facilitates cholesterol uptake in Mtb.
(A) Complementation with lucA restores cholesterol toxicity in the Δicl1::hyg lucA::TnHimar mutant. (B) The ΔlucA::hyg and ΔyrbE4A::hyg mutants are defective in the catabolic release of 14CO2 from [4-14C]-cholesterol. (C) The ΔlucA::hyg and ΔyrbE4A::hyg mutants are defective in cholesterol uptake. Representative 14C-cholesterol uptake data used in these calculations (Figure 1—figure supplement 2C,D). Data are means ± SD (n = 4). *p<0.0005, **p<0.005, ***p<0.05 (Student’s t test).
Figure 1—figure supplement 1
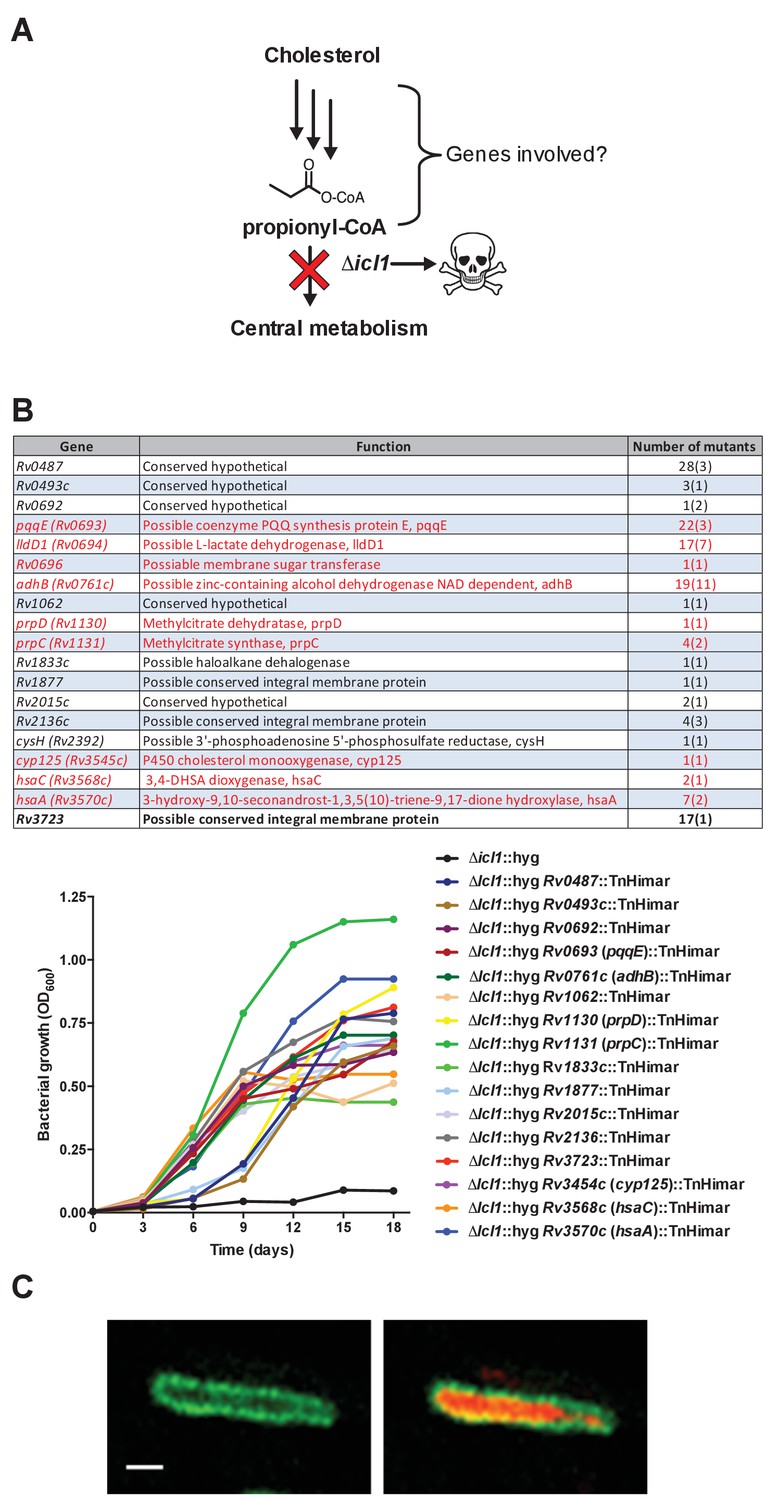
Rational for genetic screen and summary of mutants selected by the screen.
(A) Schematic detailing cholesterol toxicity in Δicl1 Mtb. (B) Identity of the mutants identified where parentheses denote the number of independent insertions found in the specific gene. Genes indicated in red are predicted to be required for Mtb to grow on cholesterol (Griffin et al., 2011). Representative mutants identified in the screen grow in media containing cholesterol. (C) Wild-type Mtb constitutively expressing cytosolic mCherry and LucA-GFP. Left panel, a z-slice in the green channel alone (green = LucA-GFP) and the right panel, overlaid green and red channels (red = mCherry Mtb) for the same optical slice. Scale bar 1.0 μm.
Figure 1—figure supplement 2
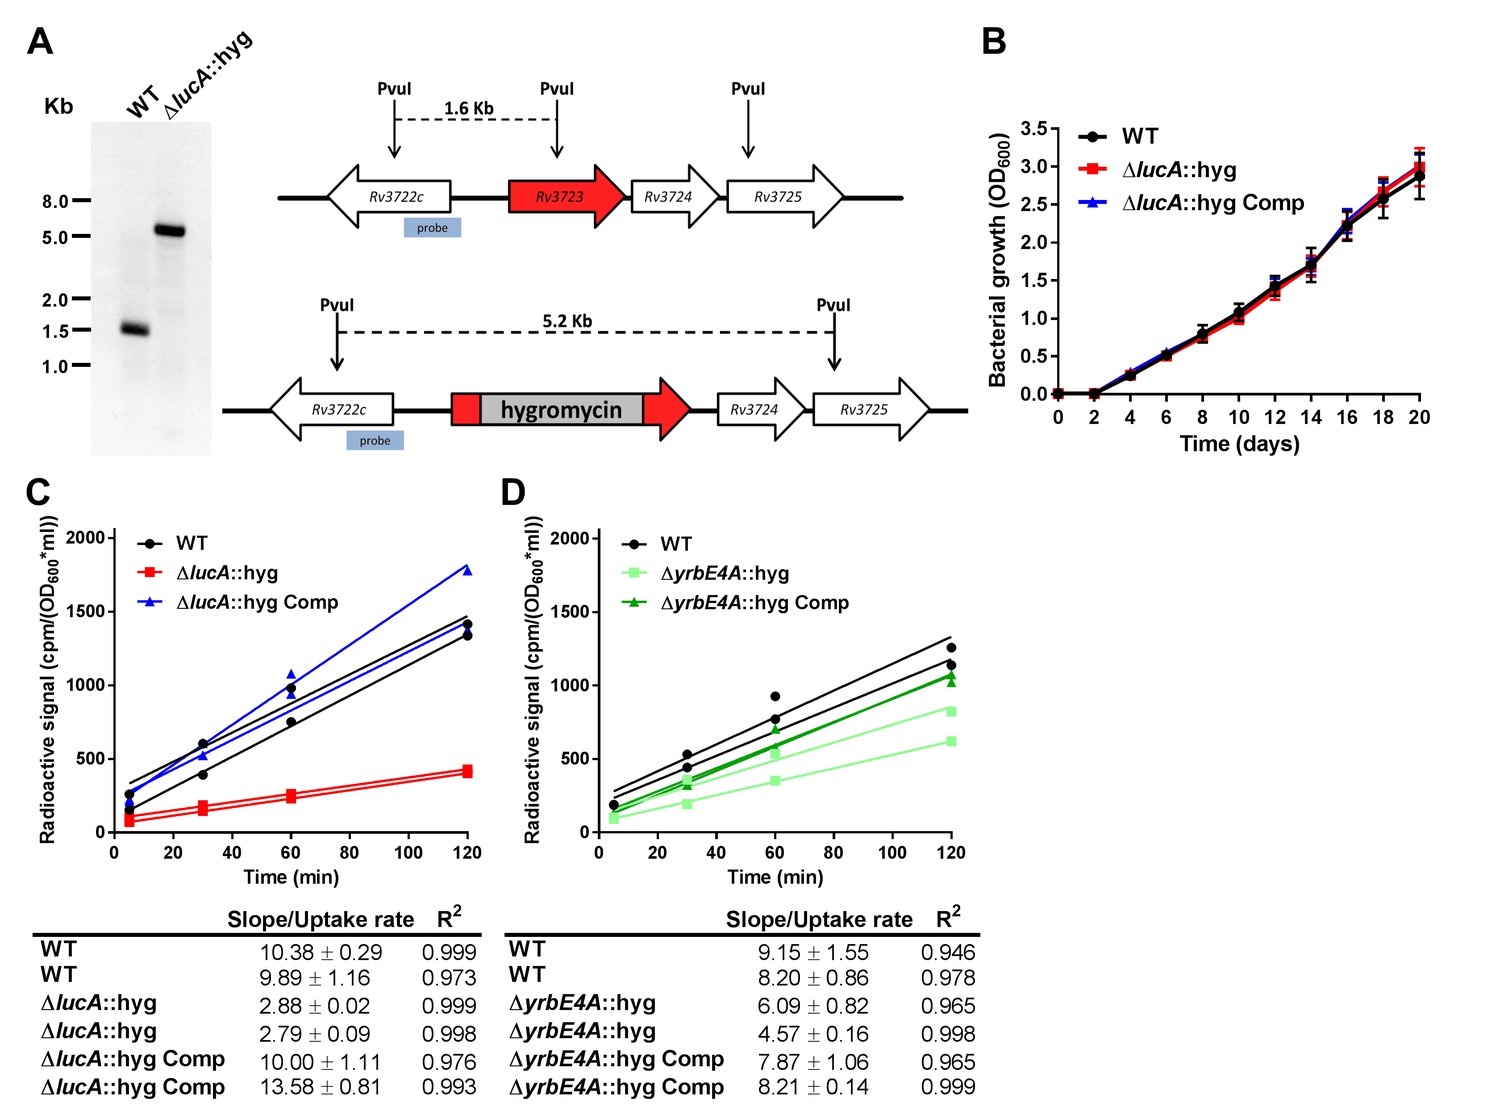
Mutant construction and kinetic analysis of cholesterol uptake.
(A) Southern blot of PvuI-digested genomic DNA that has been probed using the indicated probe confirms allelic exchange in the ΔlucA::hyg mutant. (B) The ΔlucA::hyg mutant has no growth defect in the 7H9 AD media used for uptake and metabolism experiments. Data are means ± SD (n = 3). (C and D) Representative 14C-cholesterol uptake data used to calculate cholesterol uptake rates used in (Figure 1C). Data shown are representative of one independent experiment with two biological replicates.
Figure 2 with 1 supplement
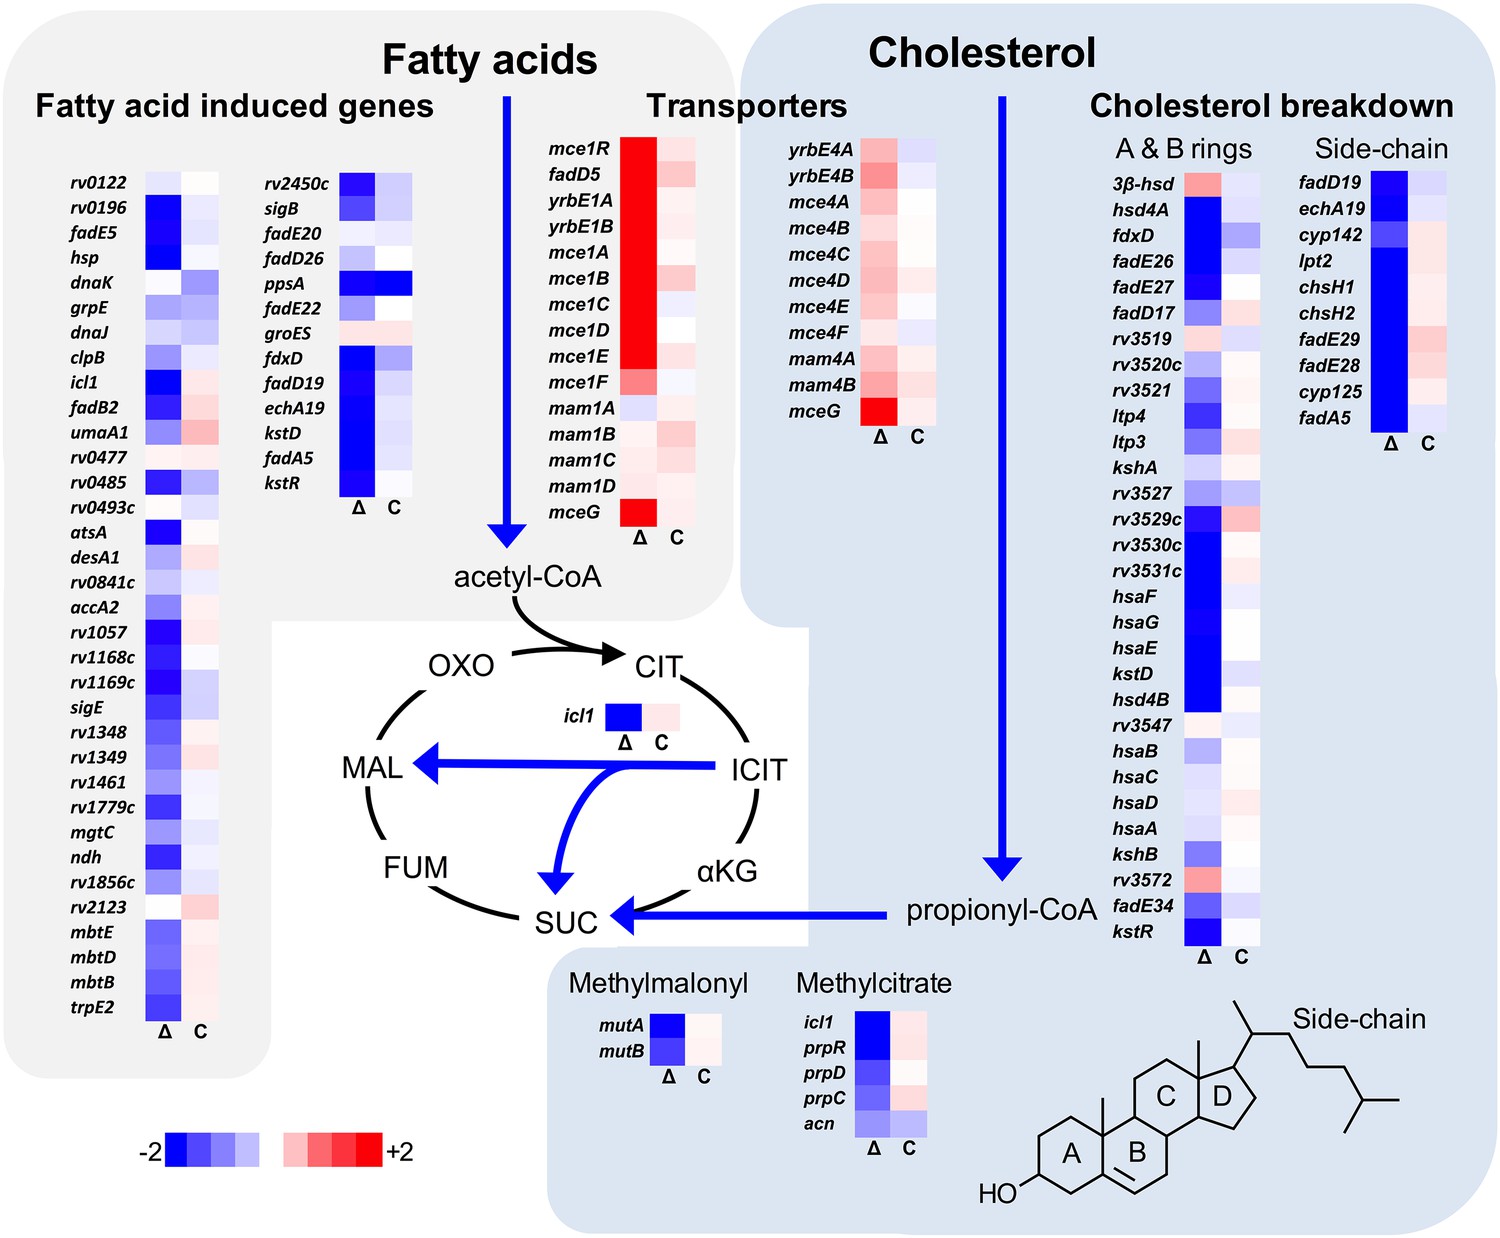
Transcriptional profile of the ΔlucA::hyg mutant during infection in macrophages.
Bacterial gene expression profiles were determined at day 3-post infection in resting murine macrophages. Gene expression values from the ΔlucA::hyg mutant (Δ) and complement (C) strains were normalized to wild type. Data represent means (n = 3).
-
Figure 2—source data 1
Spreadsheet of curated gene expression data.
- https://doi.org/10.7554/eLife.26969.006
Figure 2—figure supplement 1
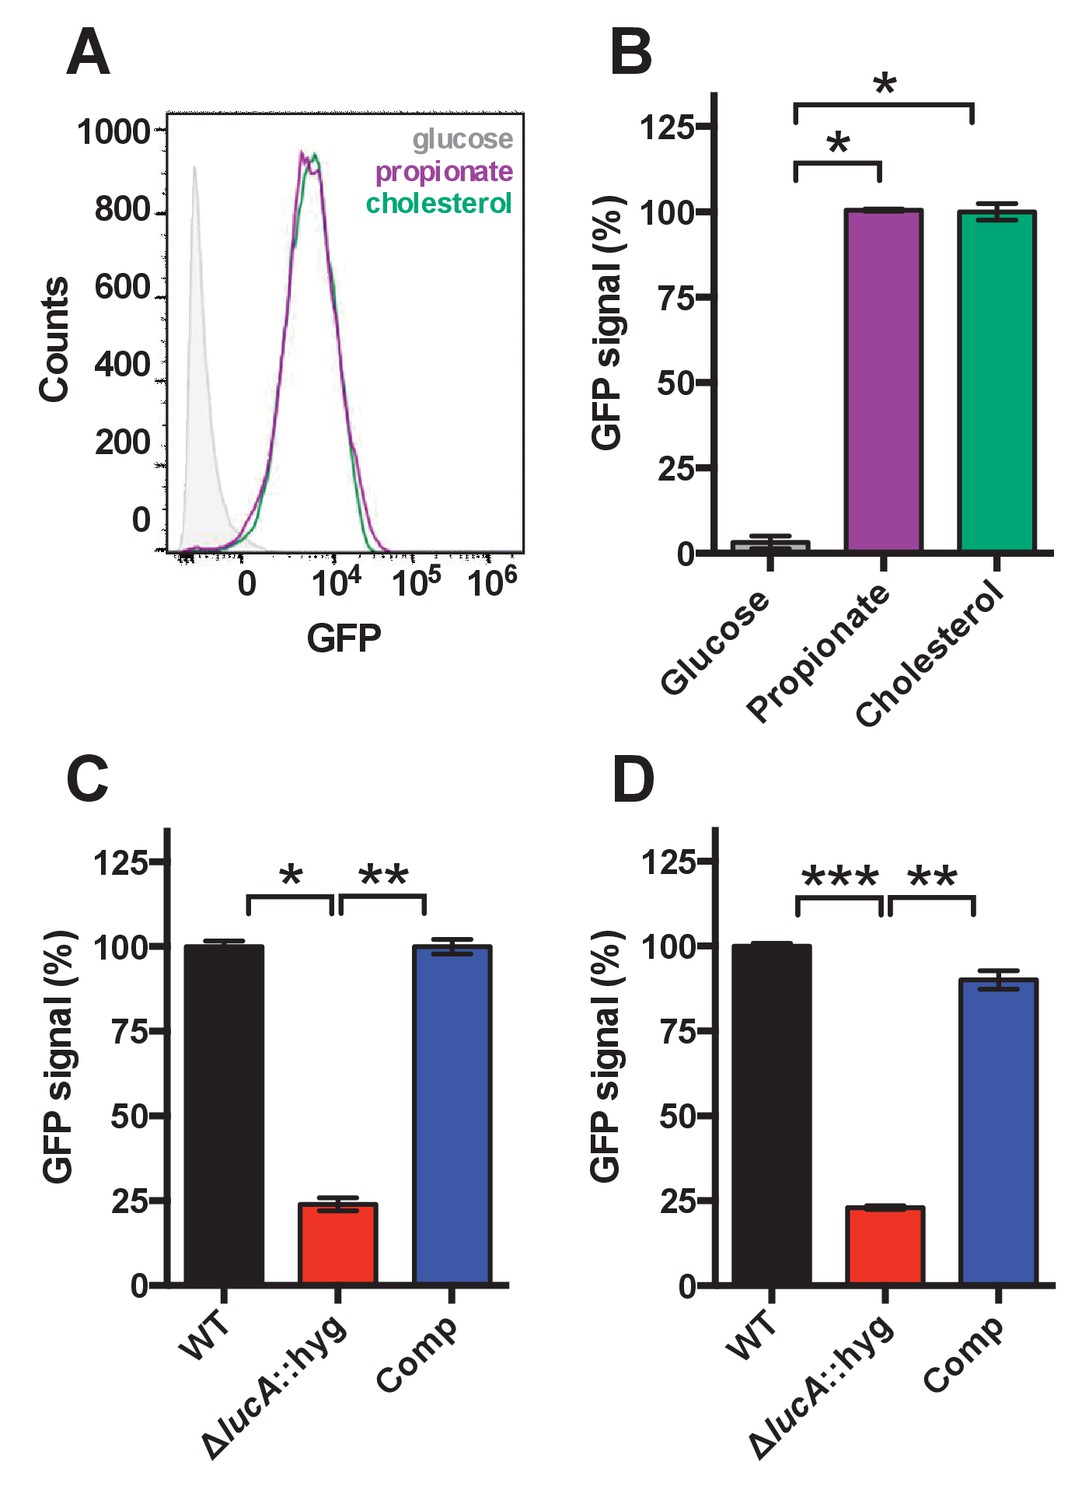
Validation of cholesterol utilization defect with a GFP based reporter.
(A) Flow cytometery-based analysis of wild type Mtb carrying the prpD promoter reporter (prpD’::GFP smyc’::mCherry) confirms that this strain expresses GFP in response to cholesterol (100 μM) or propionate (300 μM) but not glucose (200 μM). (B) Quantification of GFP expression of wild type Mtb carrying the prpD promoter reporter in media containing the indicated carbon source. (C) The ΔlucA::hyg mutant carrying the prpD reporter has a decrease in GFP expression in cholesterol media. (D) The ΔlucA::hyg mutant carrying the prpD reporter has a decrease in GFP expression during infection of murine macrophages. Data are means ± SD (n = 3) and for flow cytometery analysis, >10,000 individual bacteria were analyzed. *p<1*10−6, **p<5*10−6, ***p<5*10−8 (Student’s t test).
Figure 3 with 3 supplements
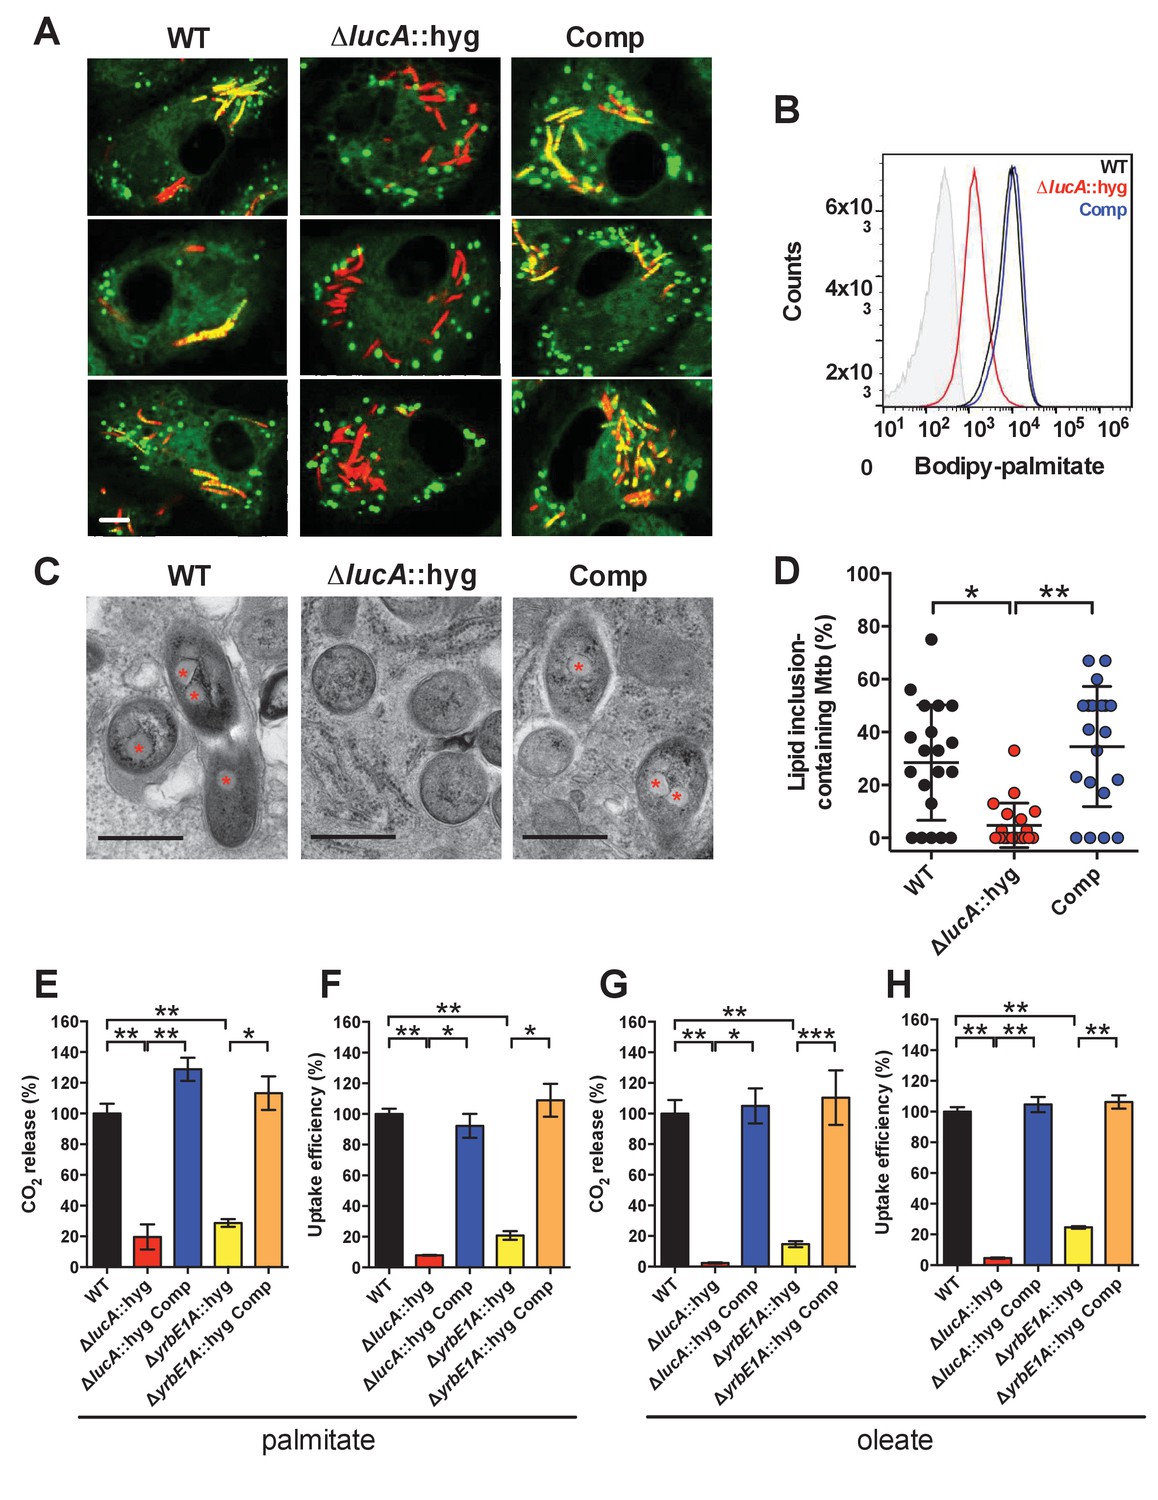
LucA facilitates fatty acid uptake during infection and in axenic culture.
(A) Bodipy-C16 does not accumulate in ΔlucA::hyg mutant as cytosolic lipid inclusions. Representative confocal images of infected macrophages (red = mCherry Mtb, green = Bodipy-C16). Scale bar 5.0 μm. (B) Flow cytometery quantification of Bodipy-C16 incorporation by Mtb isolated from pulse-labeled macrophages. Shaded histogram represents autofluorescence in the green channel. (C) Transmission electron microscopy reveals that lipid inclusions (indicated by asterisks) are not apparent in the ΔlucA::hyg mutant. Scale bar 0.5 μm. (D) Quantification of intracellular Mtb containing lipid inclusions per macrophage section. Horizontal bars are means ± SD (n = 20). (E and G) Catabolic release of 14CO2 from [14C(U)]-palmitic acid or [1-14C]-oleic acid. (F and H) Uptake of [14C(U)]-palmitic acid or [1-14C]-oleic acid. The uptake rates were calculated from the incorporated radioactive counts (Figure 3—figure supplement 2A,B). Data are means ± SD (n ≥ 4). *p<0.0005, **p<0.0001, ***p<0.005 (Student’s t test).
Figure 3—figure supplement 1
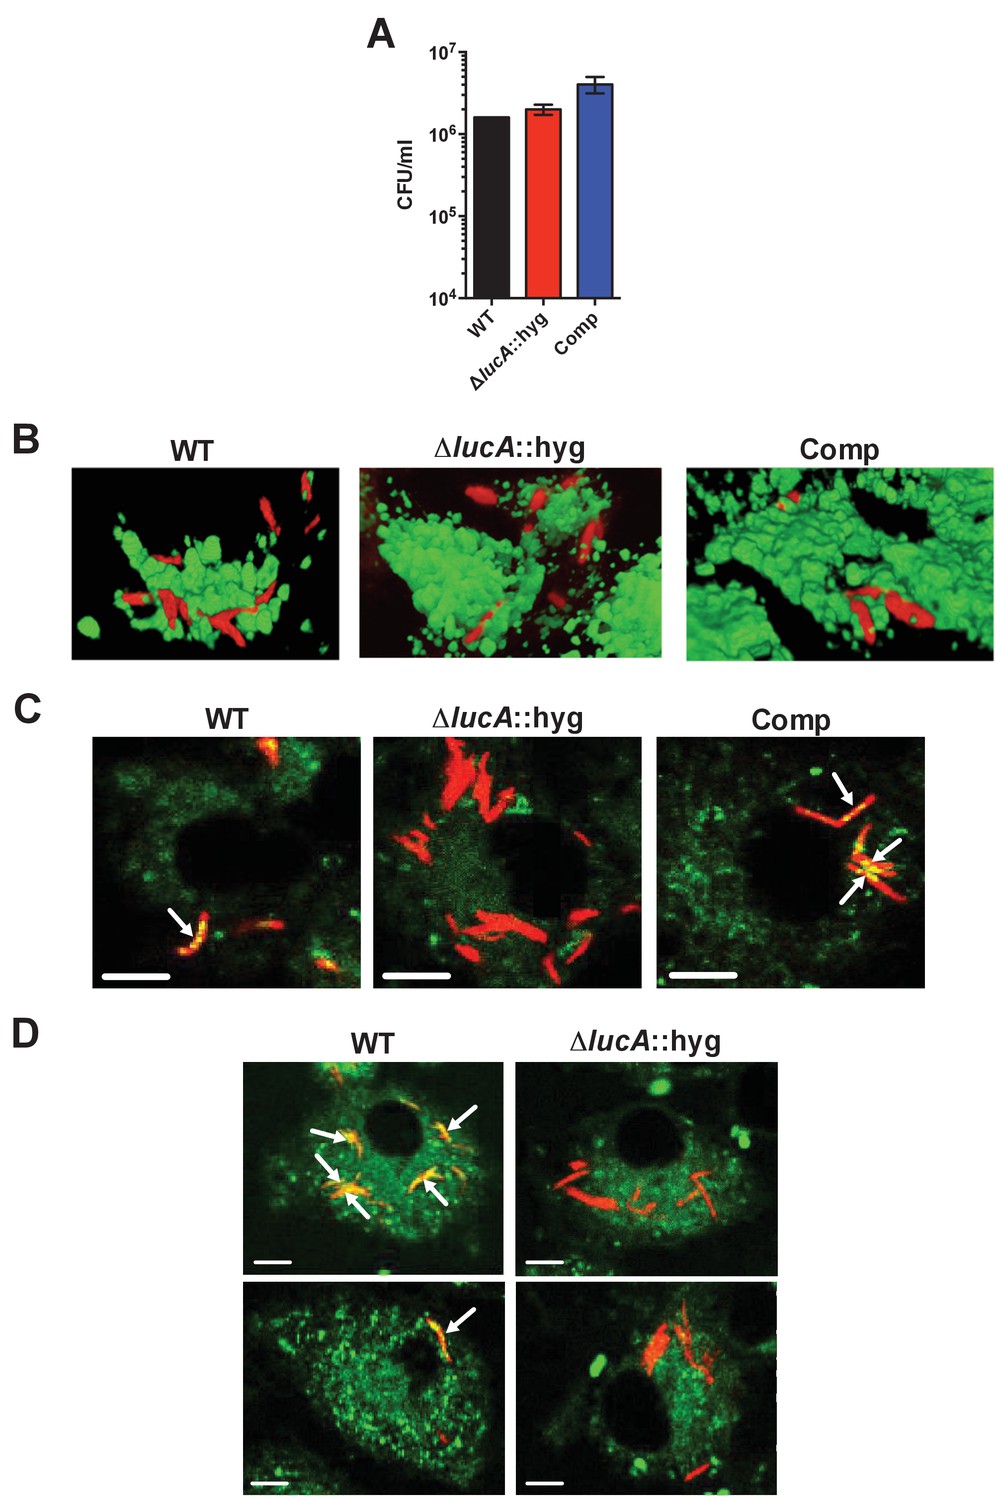
Characterization of the mutant during infection in macrophages.
(A) Bacterial viability determined at day 3-post infection from infected macrophages. Data are means ± SD (n = 3). (B) Three-dimensional reconstructions of infected macrophages labeled with Alexa647-dextran (green = lysosomes, red = Mtb). (C) The ΔlucA::hyg mutant does not accumulate Bodipy-493/503 positive intracellular lipid inclusions (red = Mtb, green = Bodipy-493/503). Arrows indicate bacteria with intracellular lipid inclusions positive with Bodipy-493/503. Scale bar, 5.0 μm.( D) THL treating of the ΔlucA::hyg strain does not induce intracellular lipid inclusions that are positive with Bodipy-493/503 (red = Mtb, green = Bodipy-493/503). Arrows indicate bacteria with intracellular lipid inclusions positive with Bodipy-493/503. Scale bar, 5.0 μm.
Figure 3—figure supplement 2
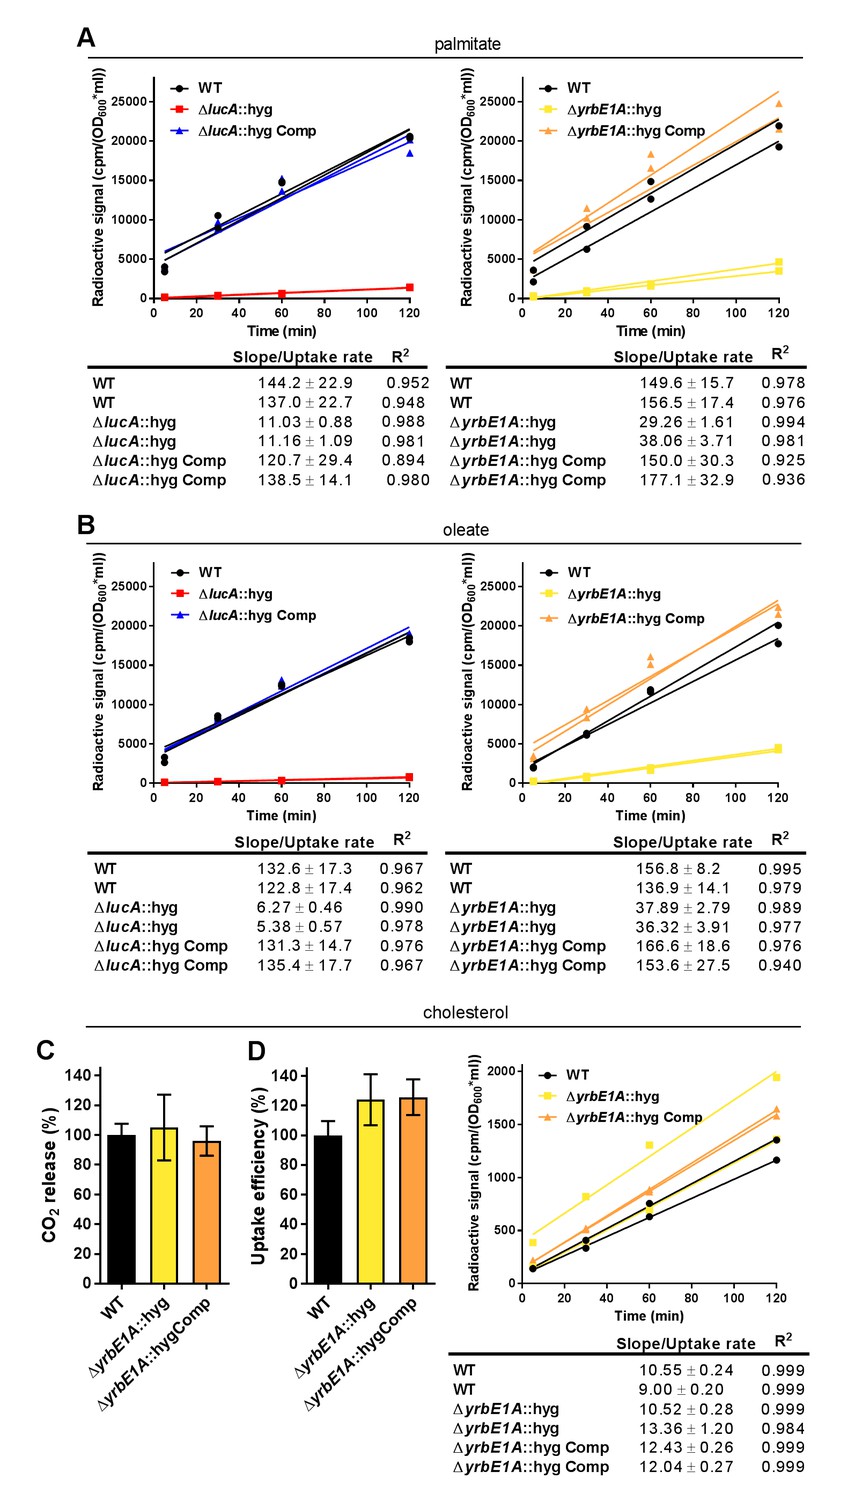
Kinetic data used used in comparisons.
(A) Representative 14C-palmitate uptake data used to calculate palmitate uptake rates for (Figure 3F). (B) Representative 14C-oleate uptake data used to calculate oleate uptake rates for (Figure 3H). (C) The catabolic release of 14CO2 from [4-14C]-cholesterol by the ΔyrbE1A::hyg mutant. Data are means ± SD (n ≥ 4). (D) Cholesterol metabolism values for the ΔyrbE1A::hyg mutant (data are means ± SD (n ≥ 4)) and representative 14C-cholesterol uptake data used to calculate cholesterol uptake rates in the ΔyrbE1A::hyg mutant.
Figure 3—figure supplement 3

Deletion of the full Mce1 operon leads to fatty acid uptake defect.
(A and B) the Δmce1::hyg mutant can metabolize and import cholesterol. (C and D) the Δmce1::hyg mutant is defective in oleic acid metabolism and uptake. (E and F) the Δmce1::hyg is defective in palmitic acid metabolism and uptake. Data are means ± SD (n ≥ 4). *p<0.0001 (Student’s t test).
Figure 4 with 1 supplement
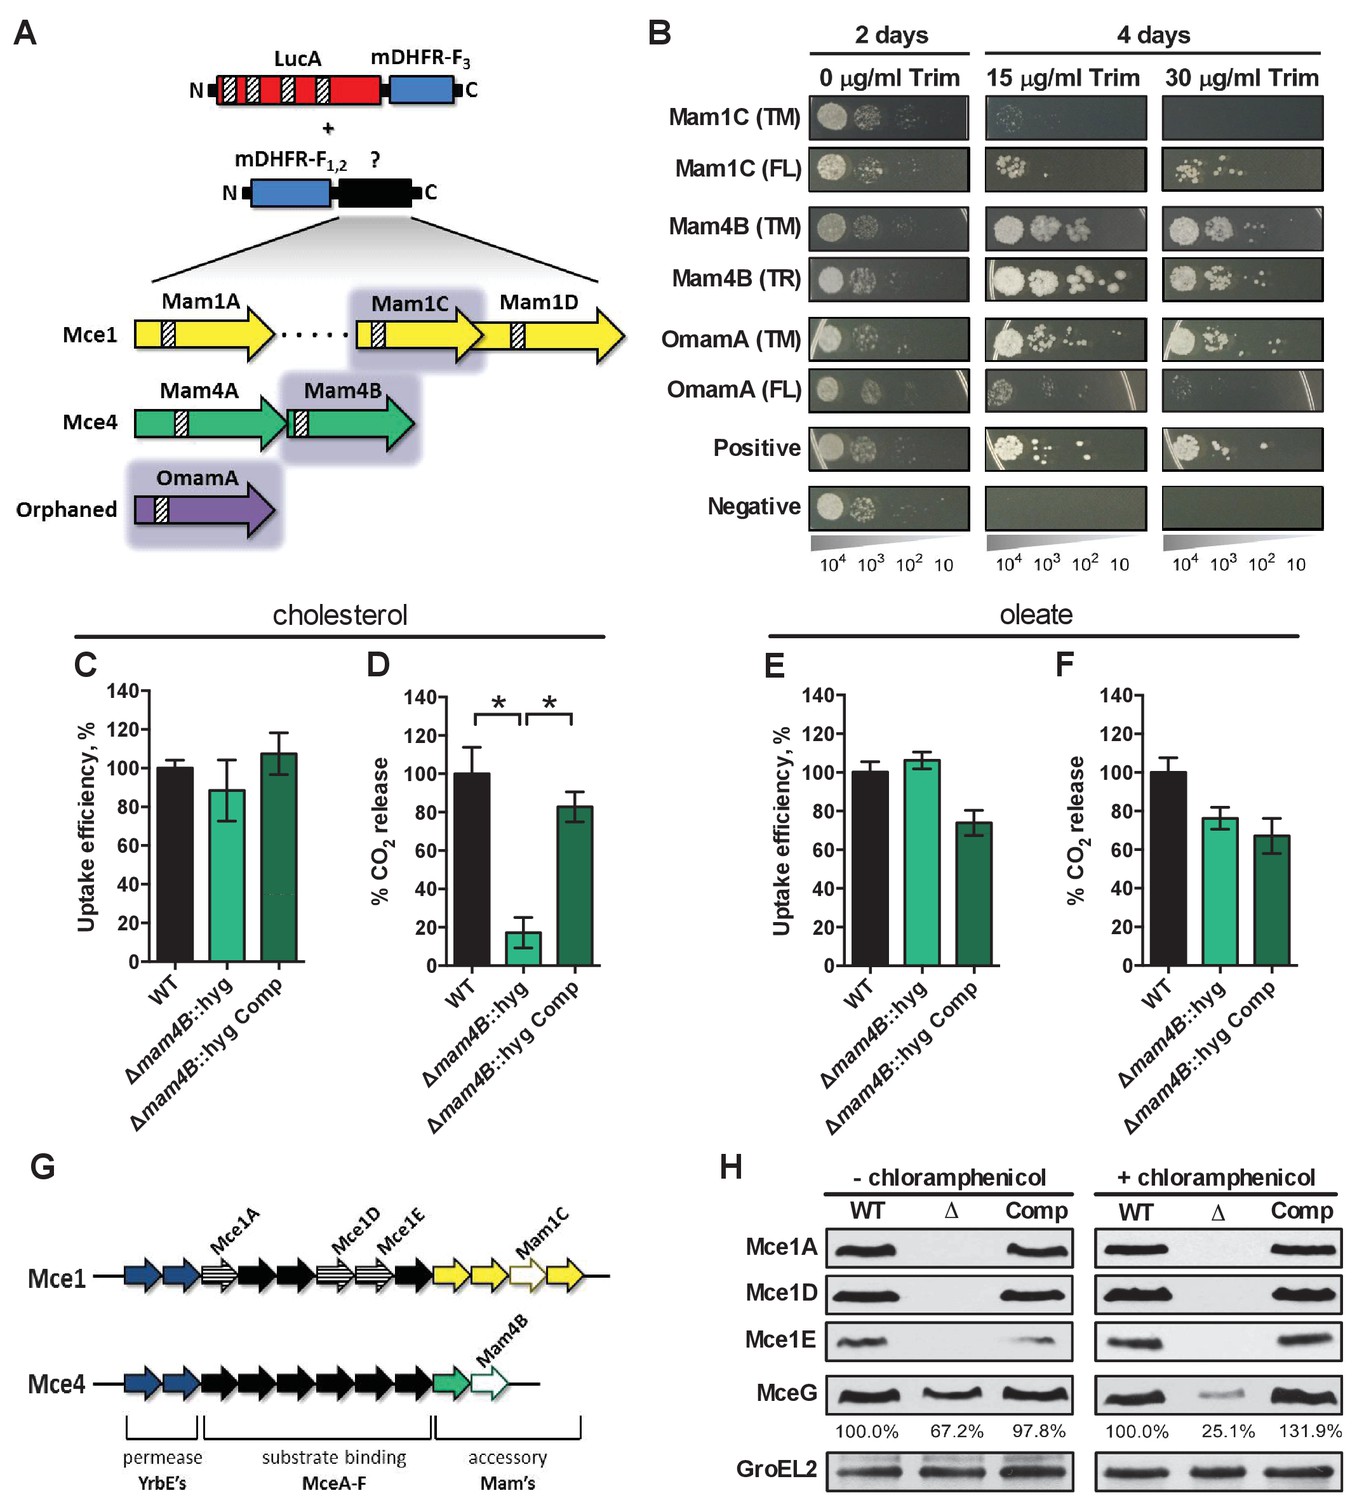
LucA interacts with subunits of Mce1 and Mce4 transporters and is required for their stability.
(A) Schematic of split-DFHR protein constructs, shading indicates proteins that interact with LucA and striped boxes indicate predicted transmembrane domains. (B) Serial dilutions of Msm co-expressing the LucA-F3 bait and the indicated prey were plated onto plates without antibiotic or plates containing trimethoprim at the indicated concentration. Growth on trimethoprim indicates protein-protein interaction. Positive is the positive control strain of Msm that co-expresses Saccharomyces cerevisiae homodimeric leucine zipper subunits (GCN4-F1,2 and GCN4-F3). Negative is the negative control strain of Msm that expresses LucA-F3 and GCN4-F1,2. (C and D) Cholesterol import and metabolism by the Δmam4B::hyg mutant. Data are means ± SD (n = 4).*p<0.0001 (Student’s t test). (E and F) Oleate import and metabolism by the Δmam4B::hyg mutant. Data are means ± SD (n = 4). (G) Organization of genes that encode the Mce1 and Mce4 transporters. Striped arrows indicate genes encoding proteins that are degraded in the ∆lucA::hyg mutant. Empty arrows indicate genes encoding accessory proteins that interact with LucA. (H) Whole-cell lysates probed by western blotting using antibodies specific for the indicated proteins. Chloramphenicol was added for 2 days before the lysate was prepared where indicated. Inset values indicate MceG protein levels that were quantified and expressed as a ratio relative to MceG in the wild type lysates. GroEL2 is a loading control and blots are representative of two independent experiments.
Figure 4—figure supplement 1
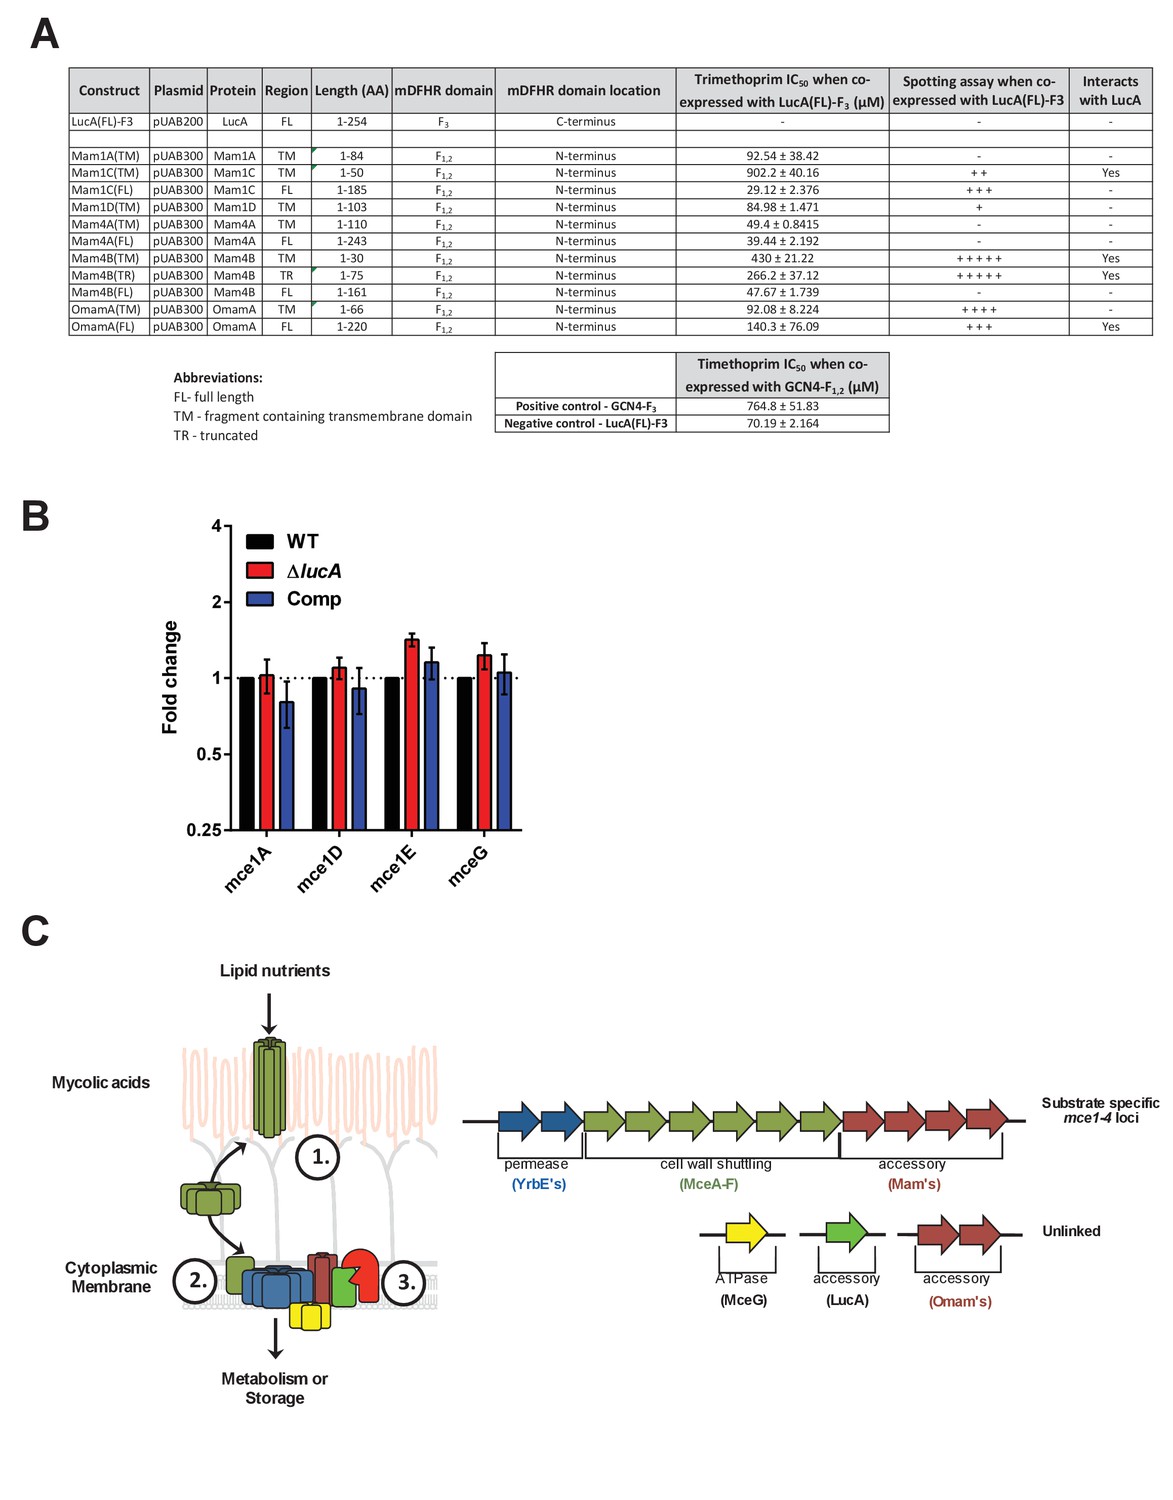
Details of interaction clones, gene expression analysis of Mce1 genes, and model of Mce mediated nutrient import.
(A) Protein interaction constructs. ± indicates robustness of growth on trimethoprim. (B) Quantification of RNA transcripts by qPCR from untreated bacterial strains. Fold change values were determined by normalizing transcript levels to the Mtb housekeeping gene, sigA. Data are means ± SD (n = 6). (C) Left panel, Model for Mce mediated transport of nutrients in Mtb. The MceA-F proteins bind and shuttle nutrients across the outer mycolic acid layer and ‘pseudo-periplasmic space’ of the Mtb cell wall (step 1). The cytoplasmic membrane proteins translocate nutrients across the membrane (step 2). The permease subunits likely serve as the substrate pore and the accessory subunits likely act as an adapter to recruit additional proteins to the complex such as MceG and LucA which potentially regulate activity/stability of the transport complex. LucA likely interacts with and protects the Mce complexes from proteolytic degradation from an unknown protease (red) (step 3). Right panel, Generalized depiction of genome organization for Mce transporters.
Figure 5
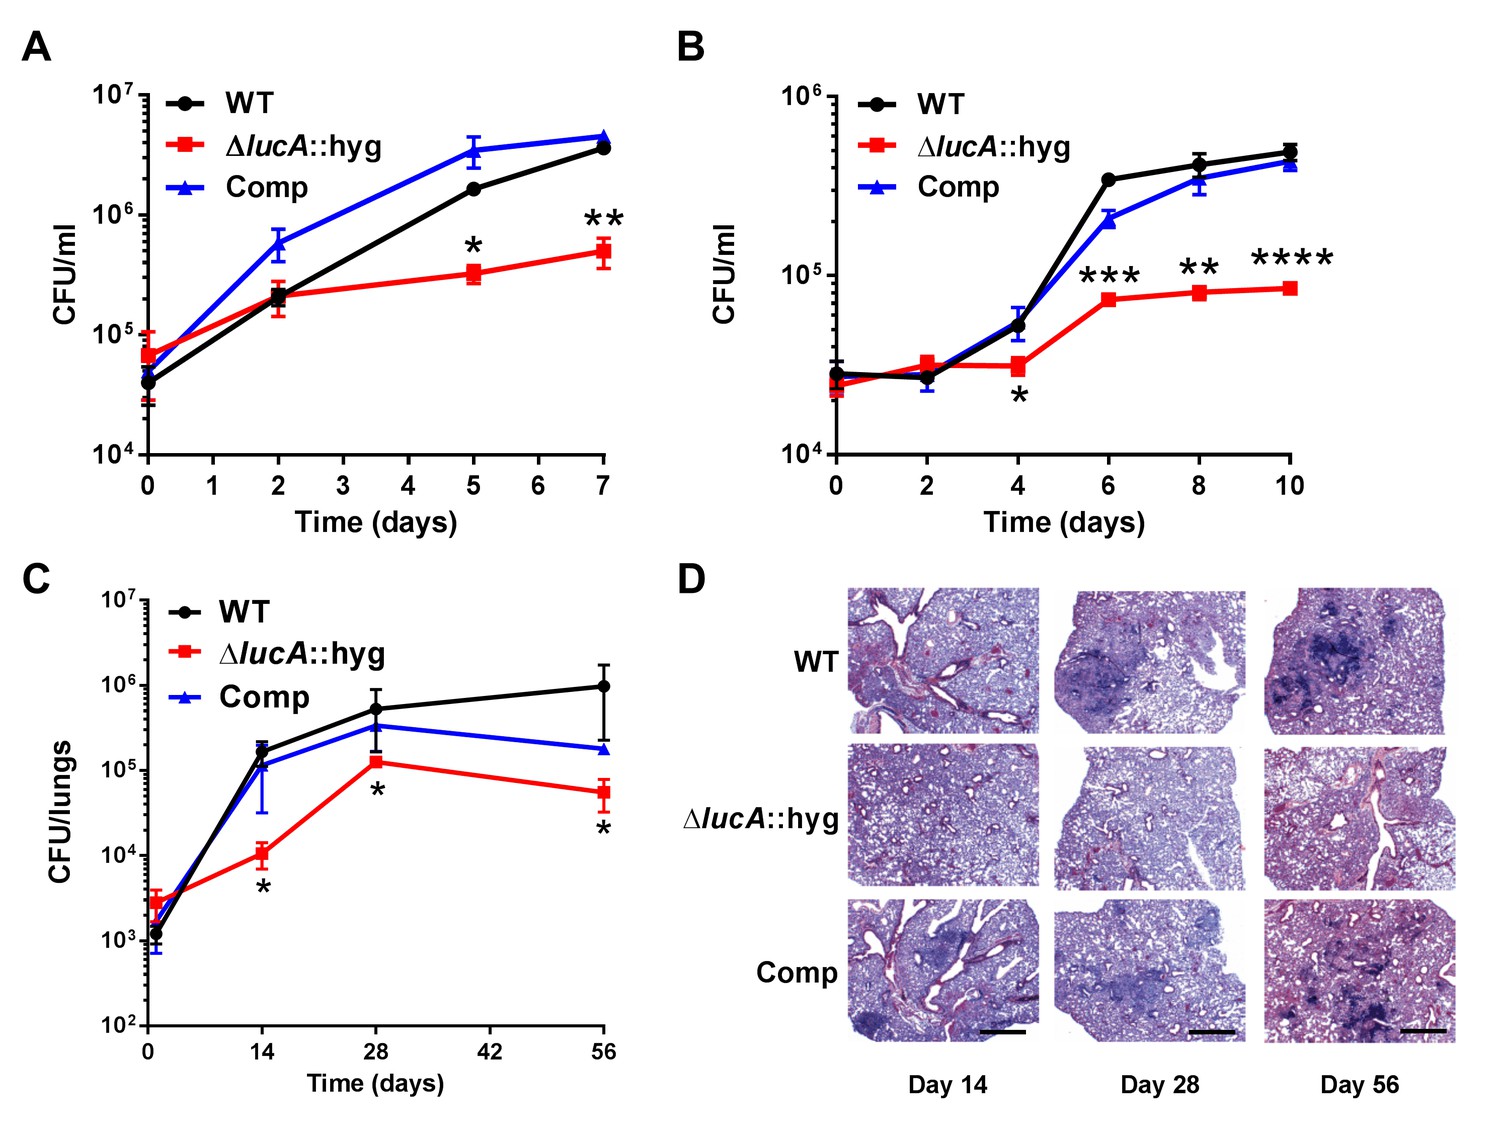
LucA is required for the full fitness of Mtb in macrophages and survival in mouse lungs.
(A) Bacterial replication in resting human monocyte derived macrophages. Data are means ± SD (n = 3). (B) Bacterial replication in resting murine bone-marrow-derived macrophages. Data are means ± SD (n = 3). (C) Bacterial survival in mouse lung tissues. Data are means ± SD (n = 5 per time point) (D) Lung pathology of infected mice collected at indicated time points and H&E stained. Scale bar 400 μm. *p<0.05, **p<0.005, ***p<0.001, ****p<0.0005 (Student’s t test).
Additional files
-
Supplementary file 1
Details of strains.
- https://doi.org/10.7554/eLife.26969.015
Download links
A two-part list of links to download the article, or parts of the article, in various formats.
Downloads (link to download the article as PDF)
Open citations (links to open the citations from this article in various online reference manager services)
Cite this article (links to download the citations from this article in formats compatible with various reference manager tools)
Rv3723/LucA coordinates fatty acid and cholesterol uptake in Mycobacterium tuberculosis
eLife 6:e26969.
https://doi.org/10.7554/eLife.26969


