Neural activity in cortico-basal ganglia circuits of juvenile songbirds encodes performance during goal-directed learning
- University of Southern California, United States
Figures
Figure 1 with 3 supplements
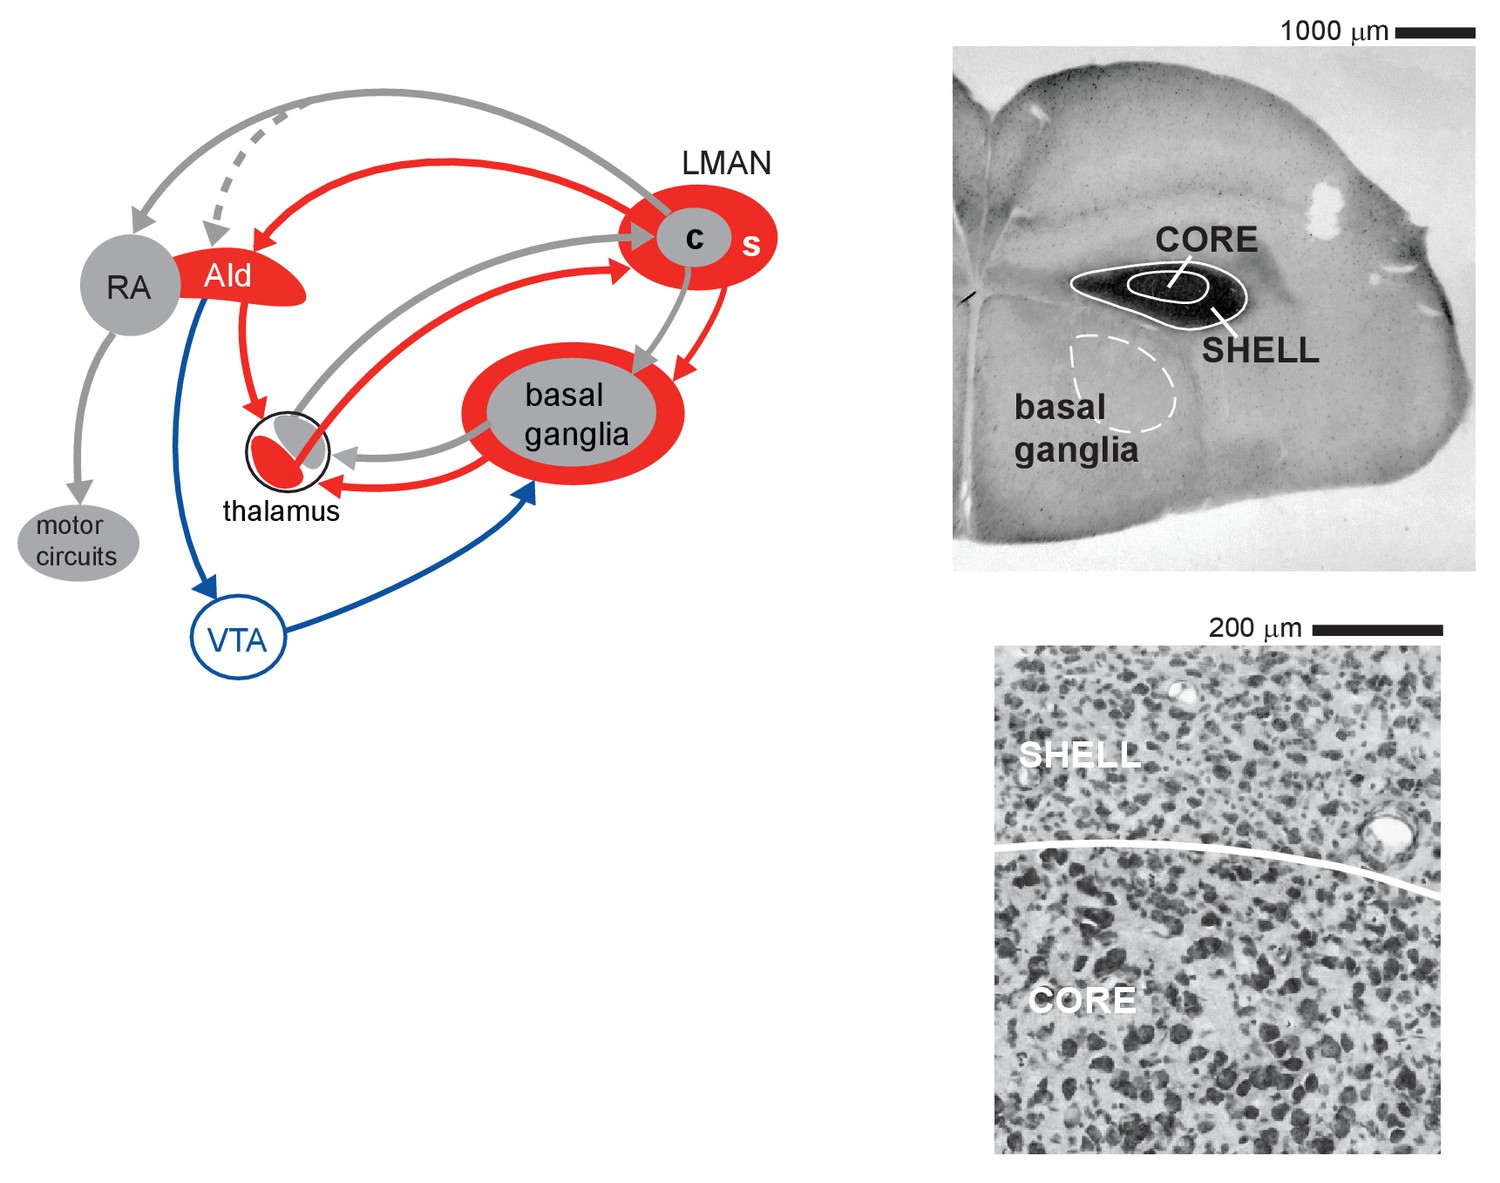
Cortico-basal ganglia circuits for vocal learning in juvenile zebra finches.
Left: core (c, gray) and shell (s, red) subregions of the cortical nucleus LMAN give rise to parallel recurrent loops through the basal ganglia. LMAN-core projects to vocal motor cortex (RA); this pathway drives vocal motor output in juvenile birds. LMAN-shell projects to a region of motor cortex that is adjoined to the lateral margin of RA (AId); this pathway does not drive motor output but is involved in learning. Shell also forms a trans-cortical loop via AId that converges with the core-shell basal ganglia loops in a dorsal thalamic zone. A transient projection from core to AId (dashed line) is present only in juvenile birds and creates a site of integration between core and shell pathways in AId during the learning period. The dorsal thalamus feeds back to LMAN and feeds forward to the premotor cortical area, HVC (High Vocal Center), via medial MAN (latter pathway not shown for clarity). Right: upper panel shows a low-power coronal section containing core and shell regions of LMAN as well as the anterior basal ganglia (Area X, dashed white outline, is an anatomical subregion of basal ganglia in songbirds; it contains both striatal and pallidal cells and is necessary for vocal learning). Calbindin expression (dark staining) demarcates both core and shell regions by labeling terminals of afferent thalamic axons. Lower panel shows a high-magnification Nissl-stained coronal view of the border between core and shell subregions, which are distinguished by the higher density of magnocellular neurons within core.
Figure 1—figure supplement 1
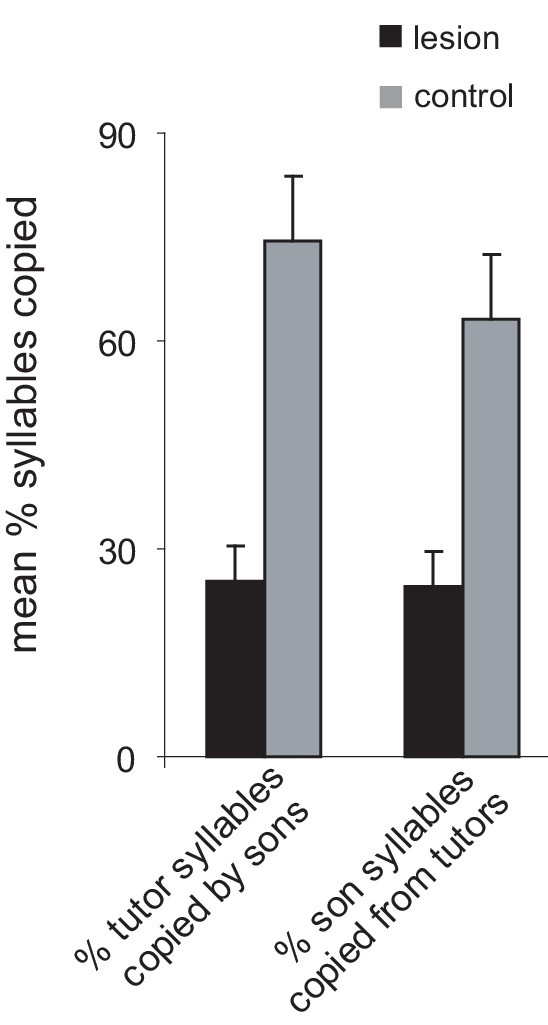
Lesions of AId prevent vocal learning in juvenile birds.
Imitation of tutor (father) songs by adult birds that had received a bilateral lesion of AId as juveniles (at 45 dph, after tutor song memorization) compared to birds that received control lesions. Lesion of AId interrupts the trans-cortical loop from shell through AId and back to shell via the thalamus, and prevents the convergence of this trans-cortical loop with the cortico-basal ganglia loops through thalamus. Left bars: percent of syllables in the tutor songs copied by the sons; right bars: percent of syllables in the sons’ songs copied from the tutors (black, lesioned birds versus gray, control birds; means + s.e.m.). Lesions of AId prevent imitation of the tutor song as well as the development of a stereotyped sequence of syllables; however, the phonology of syllables is normal, indicating that AId lesions do not exert an effect on vocal motor production.
© 2010, Bottjer and Altenau. Reproduced, with permission, from Figure 3 of Bottjer and Altenau (2010). Nature Neuroscience. 13 (2):153–5.
Figure 1—figure supplement 2
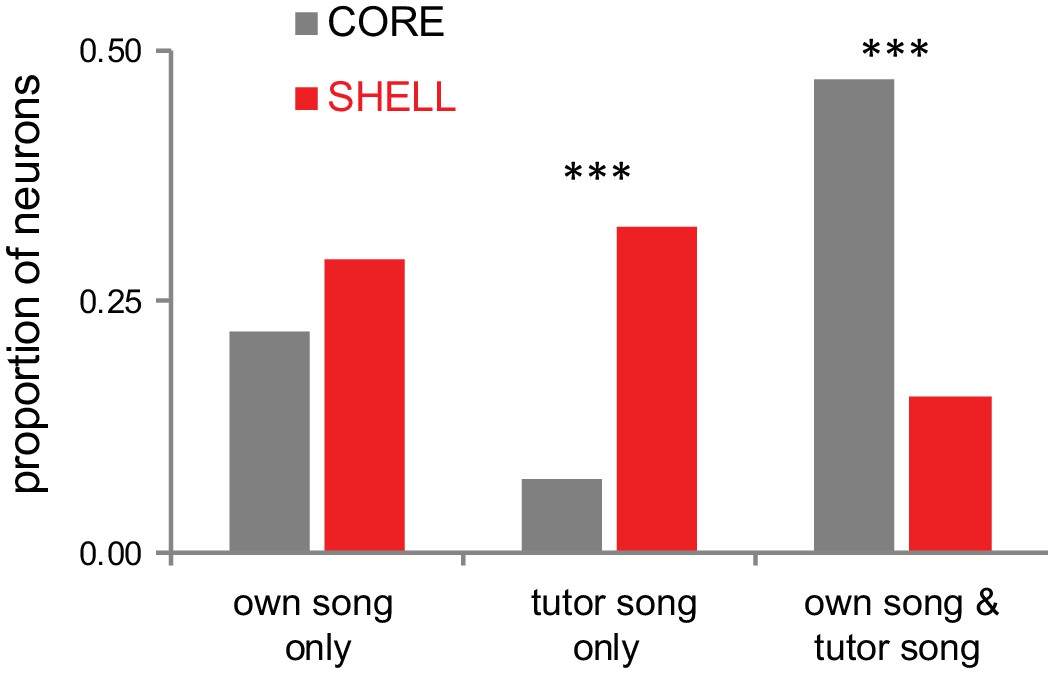
Distinct populations of neurons in LMAN-shell respond to either tutor song or self-generated song (own song).
LMAN neurons respond differentially to playback of songs in juvenile zebra finches during early stages of sensorimotor integration, following memorization of the tutor song (45 dph). Individual core neurons show significant responses to playback of their own song only or to both their own song and the tutor song (and frequently to other songs as well, data not shown); few core neurons respond to tutor song only. In contrast, individual shell neurons show significant responses either to their own song or to tutor song; few shell neurons respond to playback of both their own song and tutor song. Thus, a large population of shell neurons (~30%) responds significantly to tutor song, but not to own song (or other control songs). This pattern indicates that LMAN contains representations of both current behavior (self-generated song) and the goal behavior (tutor song). Tutor-tuned neurons are a transient population: their incidence decreases greatly by late stages of sensorimotor integration (not shown), indicating that tutor-tuned neurons are eliminated due to cell death or are re-tuned to each bird’s own song.
© 2013, Achiro and Bottjer. Reproduced, with permission, under the terms of the Creative Commons Attribution-Non Commercial 3.0 Unported (CC BY-NC 3.0) license (https://creativecommons.org/licenses/by-nc/3.0/) from Figure 3A of Achiro and Bottjer (2013). The Journal of Neuroscience. 33 (36):14475–88.
Figure 1—figure supplement 3
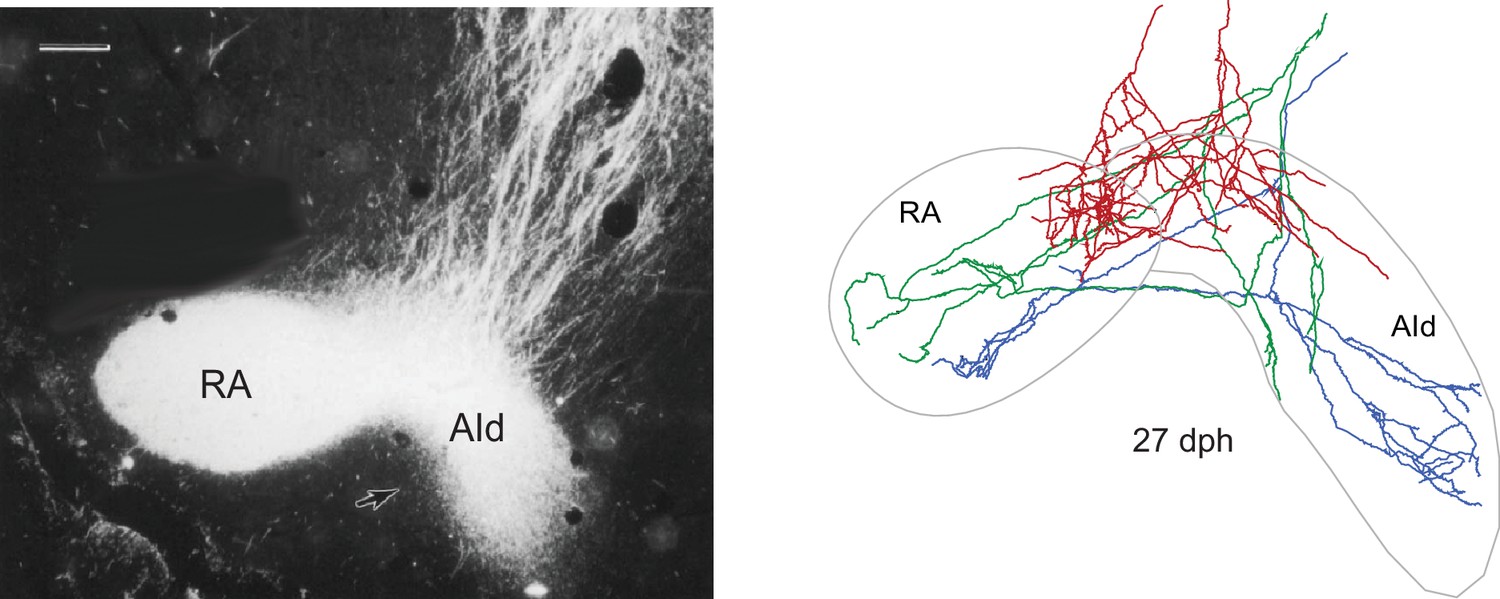
Individual LMAN-core neurons send axon collaterals into both RA and AId only in juvenile birds.
Left: the borders of AId are difficult to discern in Nissl-stained sections but are clearly demarcated by the axonal projection from LMAN. Labeled axons in this photomicrograph were produced by a large injection of HRP that covered both core and shell in an adult bird; axons enter the dorsal border of AId (most core axons enter RA through its lateral margin). Coronal view, medial is left; bar = 200 µm. Right: reconstructions of individual axon arbors of LMAN-core neurons in a juvenile bird (27 dph). Many core neurons of juvenile birds, but not adults, extend collaterals into AId; in adult birds, core neurons project only to RA and shell neurons project only to AId. This transient projection provides a point of integration between the two basal ganglia pathways as juvenile birds are actively engaged in learning but is completely retracted in adult birds. In addition, the transient projection suggests that these branches convey corollary discharge signals, since they are collateral branches of core neurons that drive vocal behavior via RA but lesions of AId do not cause motor disruption.
© 2012, The American Physiological Society. All rights reserved. The figure in the right panel was originally published as Figure 11 in Miller-Sims and Bottjer (2012). Journal of Neurophysiology. 107 (4):1142–56. Further reproduction of the right panel would need permission from the copyright holder.
© 1989, Alan R Liss, Inc/Wiley. All rights reserved. The figure in the left panel was originally published as Figure 4 in Bottjer et al. (1989). The Journal of Comparative Neurology. 279 (2):312–26. Further reproduction of the left panel would need permission from the copyright holder.
Figure 2 with 2 supplements
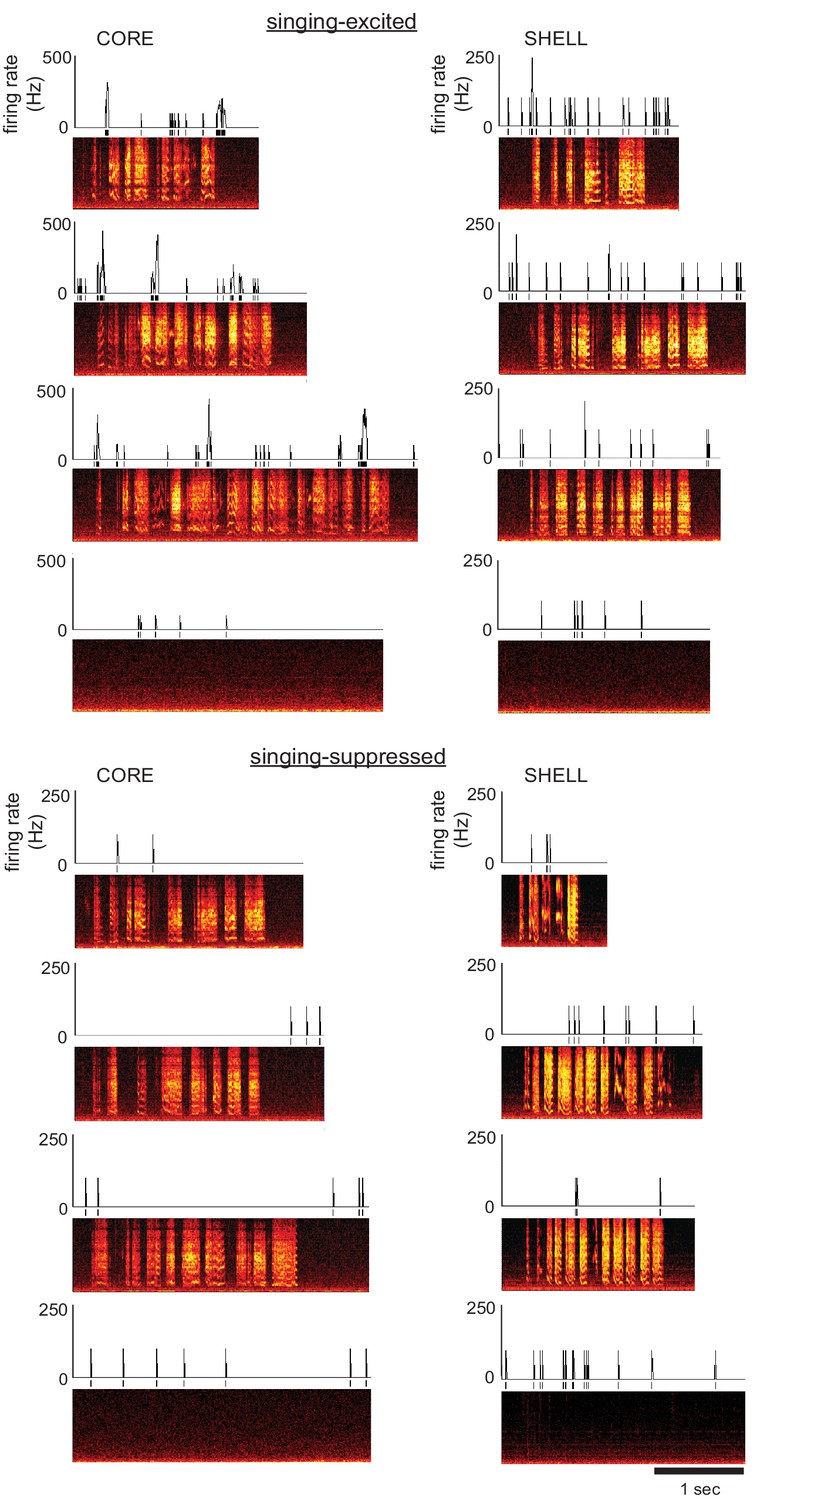
Single neurons in both core and shell subregions of LMAN showed singing-related activity in juvenile songbirds.
Left: Examples of two different core neurons during singing in juvenile birds showing either excitation (top; 54 dph) or suppression (bottom; 43 dph) compared with quiet baseline periods. Spectrograms depict three example singing episodes (frequency, 0–8 kHz, over time) and one non-singing baseline period; time-aligned spikes and corresponding firing rates (spikes/s; 10 ms bin size) are shown above. Right: Examples of two different shell neurons during singing in juvenile birds showing either excitation (top; 43 dph) or suppression (bottom; 50 dph), as in left panels.
Figure 2—figure supplement 1
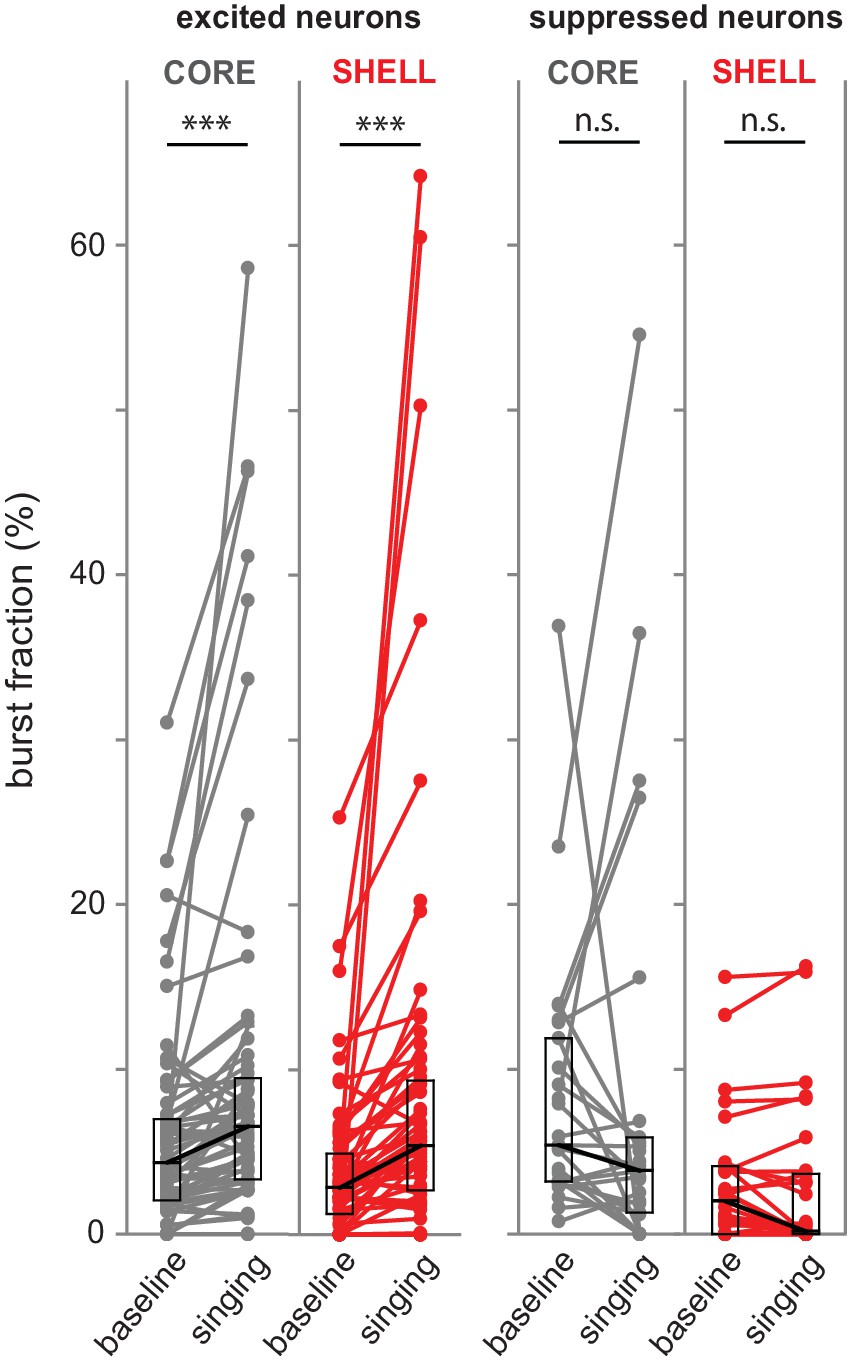
Spike bursts increased in excited but not suppressed neurons during singing.
Percent of spikes that occurred in bursts (interspike intervals <10 ms) from core (gray) and shell (red) neurons during singing and local baselines (average of the two baseline periods nearest in time to each singing episode). Left panels: singing-excited neurons; right panels: singing-suppressed neurons. Box plots indicate medians and first/third quartiles. ***p<0.001; n.s. indicates no significant difference between baseline and singing (Wilcoxon signed-rank tests).
Figure 2—figure supplement 2
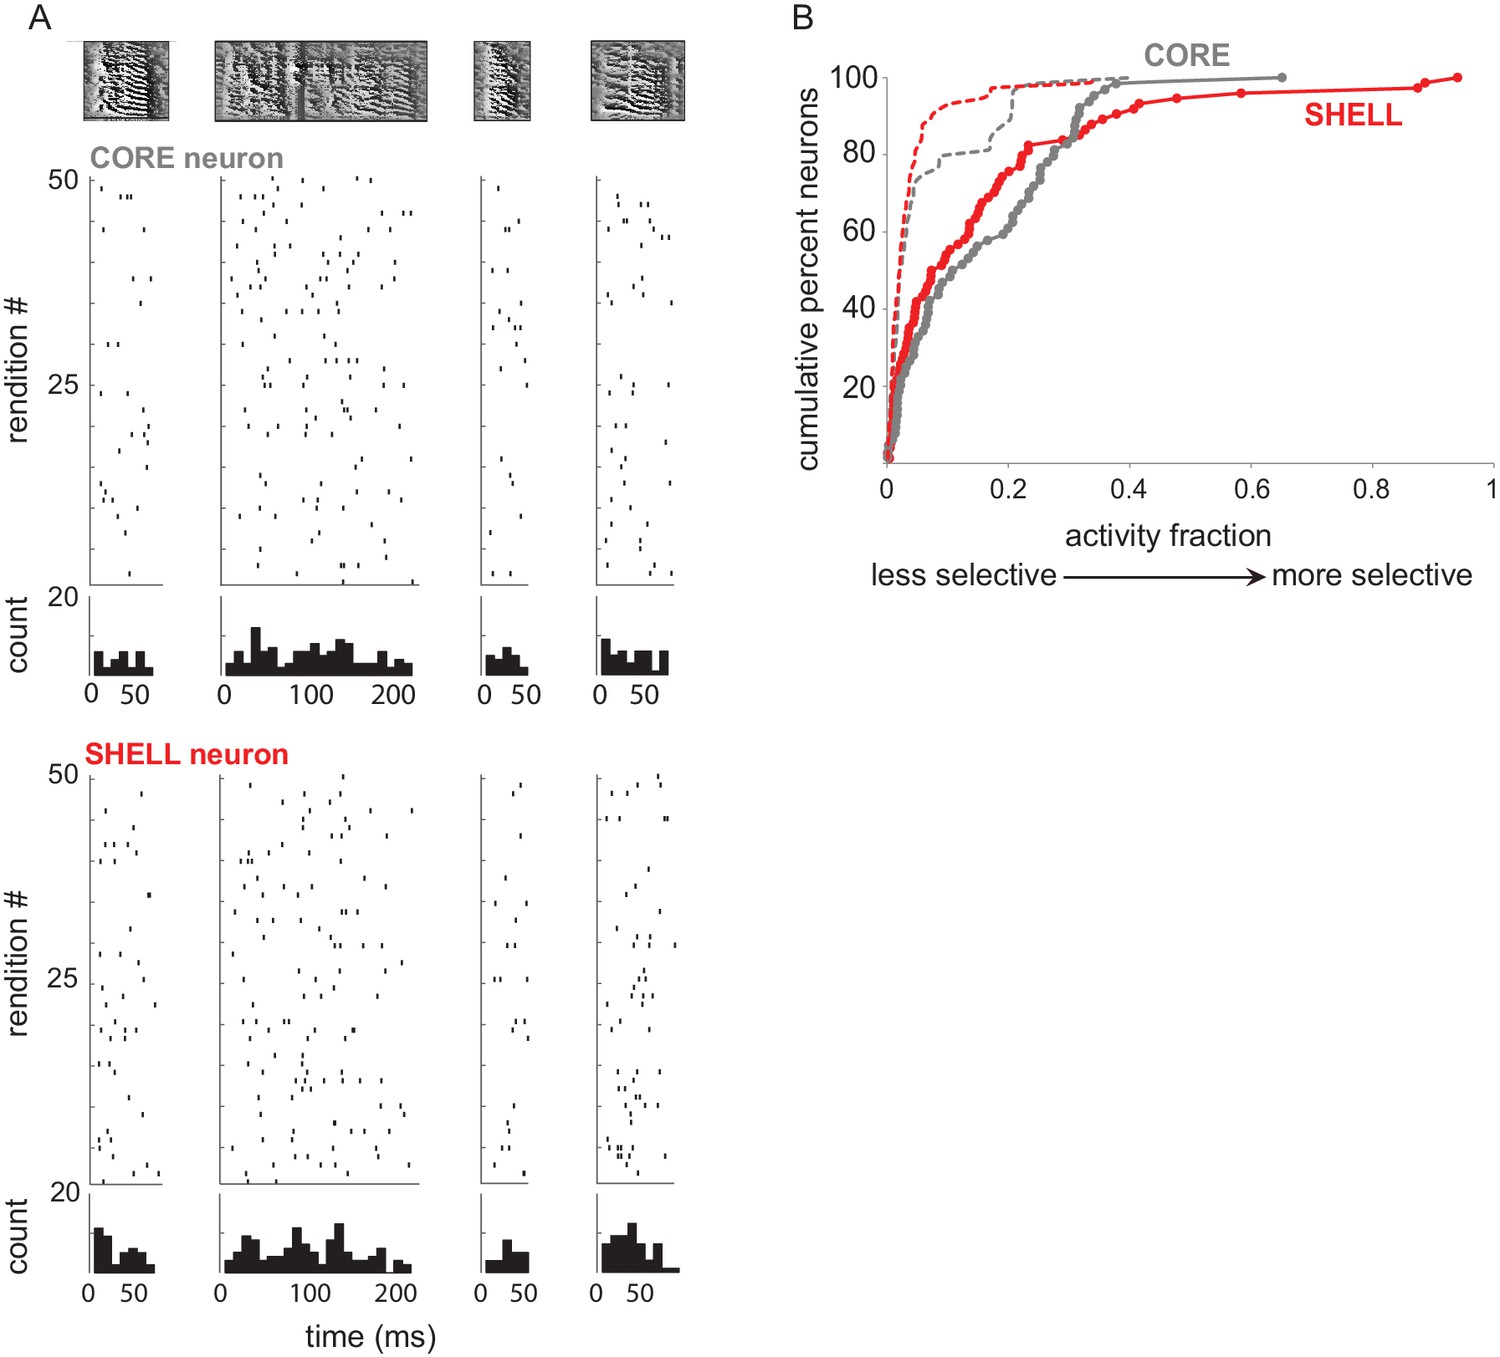
LMAN neurons had low selectivity for different syllable types.
(A) Example spiking responses during production of four different syllable types in a 53 dph bird. Top row shows spectrograms; raster plots and PSTHs for each syllable in single core and shell neurons are below. Firing rates in both core and shell neurons were similar across production of different syllable types, suggesting little selectivity. (B) To quantify the selectivity of responses for different syllable types we computed an activity fraction for neurons that were excited during production of at least one syllable type, where a score of 0 indicates no selectivity for a specific syllable type and one indicates maximum selectivity (see Materials and methods). Cumulative distributions of activity fraction scores were low (filled circles; mean scores ± s.e.m.: core = 0.15 ± 0.02; shell = 0.16 ± 0.02; no difference between core and shell, Kolmogorov-Smirnov Z = 0.97, p=0.31). However, scores for both subregions were significantly different from distributions of scores for which responses were shuffled with respect to syllable type (dashed lines; core Kolmogorov-Smirnov Z = 2.48, p<0.001; shell Kolmogorov-Smirnov Z = 2.71, p<0.001), suggesting that neurons in both subregions of juvenile LMAN have a low level of selectivity for syllable identity.
Figure 3
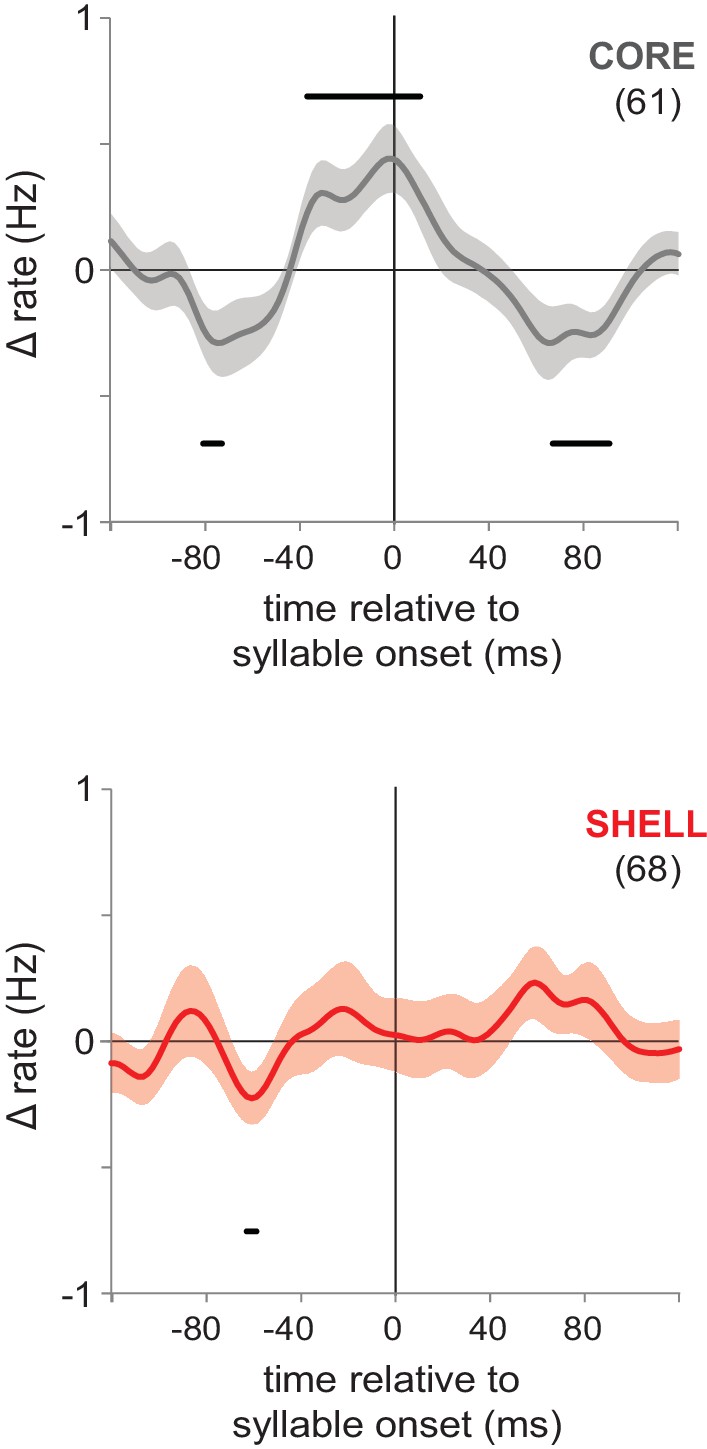
Pre-singing activity aligned to syllable onsets showed coordinated premotor activity in core but not shell.
Pre-singing activity in core (gray, top panel) and shell (red, bottom panel) in juvenile birds for all neurons that showed significant excitation prior to syllable onsets. Solid lines show smoothed mean-subtracted population rate histograms aligned to syllable onsets (syllable onset at time 0), shading indicates s.e.m. Bars above and below the traces indicate times at which the rate change is significant (95% confidence interval outside of zero); n’s are indicated in parentheses. Population histograms aligned to syllable offsets showed no significant changes for either core or shell offset-excited neurons (data not shown).
-
Figure 3—source data 1
Pre-singing spiking activity of individual CORE and SHELL neurons.
- https://doi.org/10.7554/eLife.26973.011
Figure 4
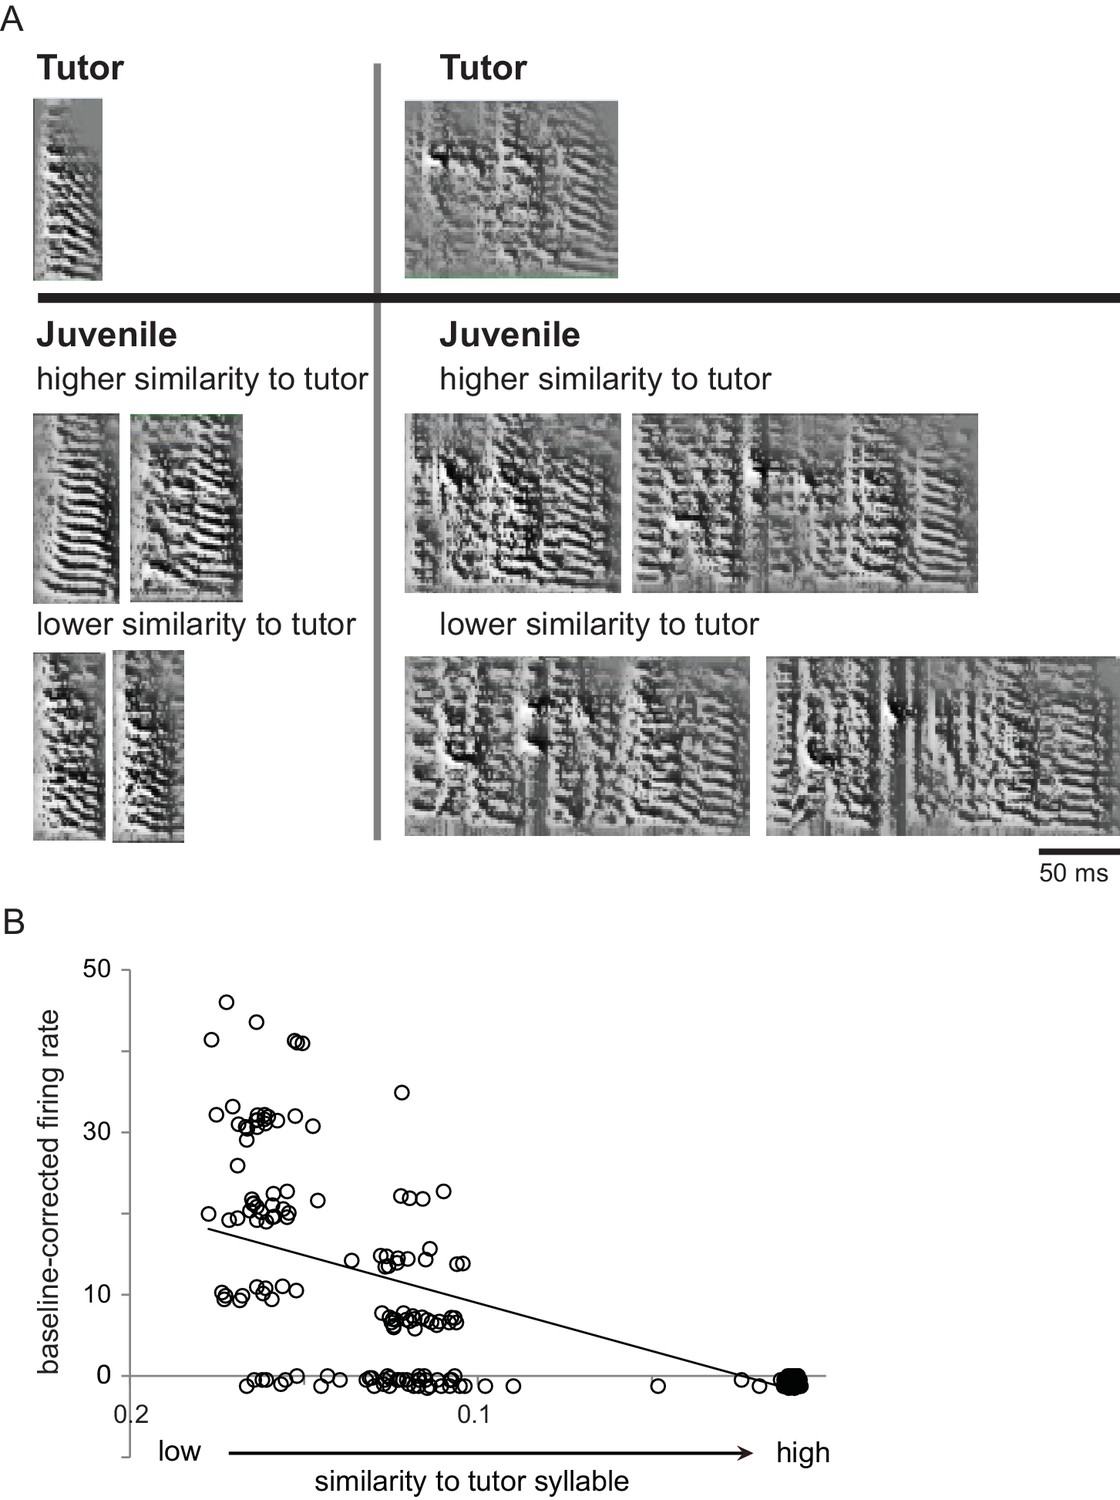
Single LMAN neurons encoded similarity to tutor song in singing juvenile birds.
(A) Examples of juvenile syllables with relatively high or low similarity to tutor syllables. Spectrograms (frequency, 0–8 kHz, over time) showing two different tutor syllables (top) and examples of juvenile renditions from a 59 dph juvenile bird (bottom) which were matched to the corresponding tutor syllable and showed either relatively high or low similarity to that tutor syllable. (B) Baseline-corrected firing rates across all renditions of all syllable types for a shell neuron from the same bird during the same period of singing as in A; this cell showed a significant negative correlation between baseline-corrected firing rates and tutor similarity of self-generated utterances.
Figure 5
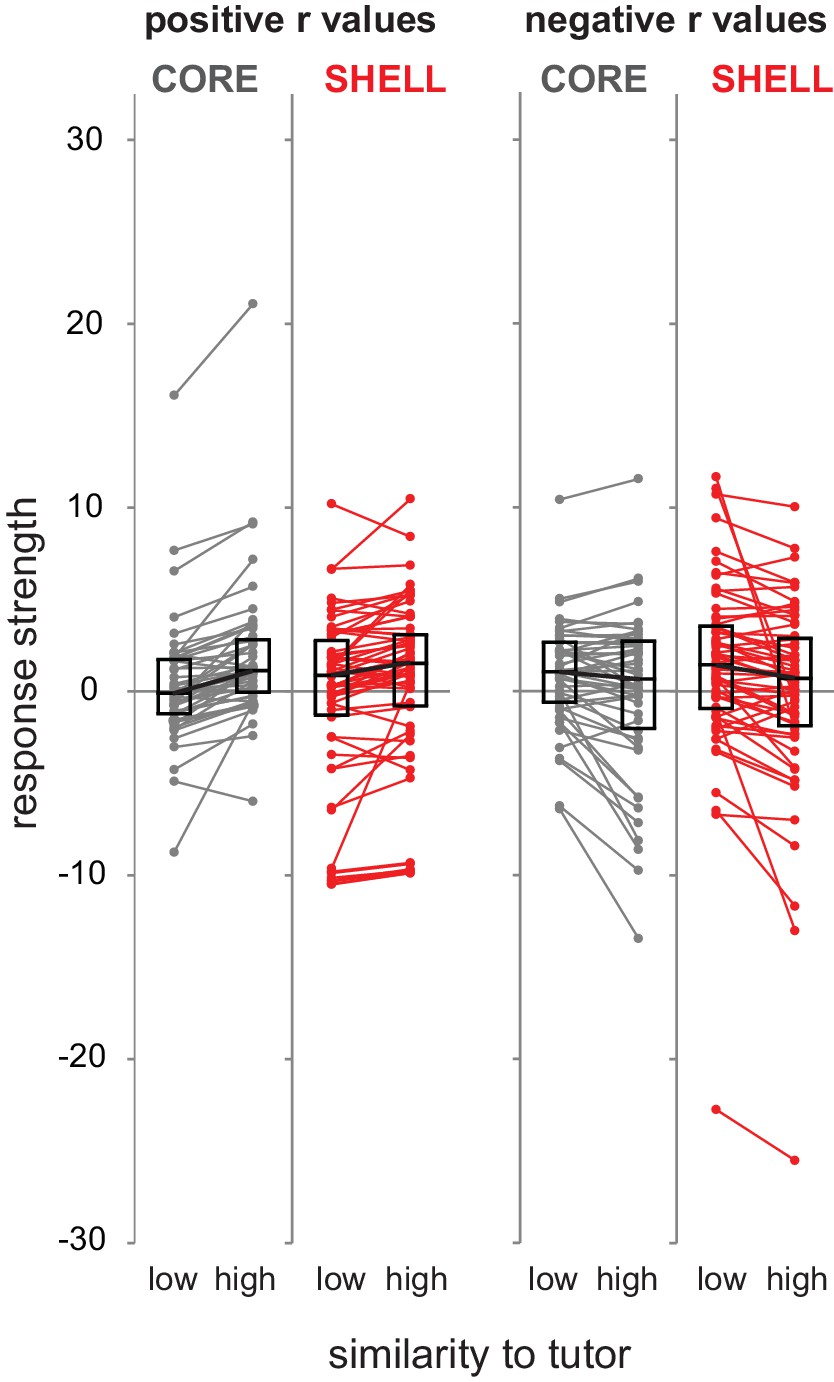
Similarity to tutor syllables modulated firing rate in either a positive or negative direction across the population of LMAN neurons.
Standardized response strength for each neuron in core (gray) and shell (red) during production of syllable renditions representing low versus high similarity to corresponding tutor syllables based on a median split of tutor similarity scores (bottom versus top 50% of tutor similarity scores). Left panels, neurons that showed positive slopes in the regression analysis (r values > 0); right panels, neurons that showed negative slopes in the regression analysis (r values < 0) (left panels: core n = 48, shell n = 62; right panels: core n = 50, shell n = 60; two outliers have been removed from core for clarity of exposition). Box plots represent median and first/third quartiles.
Figure 6
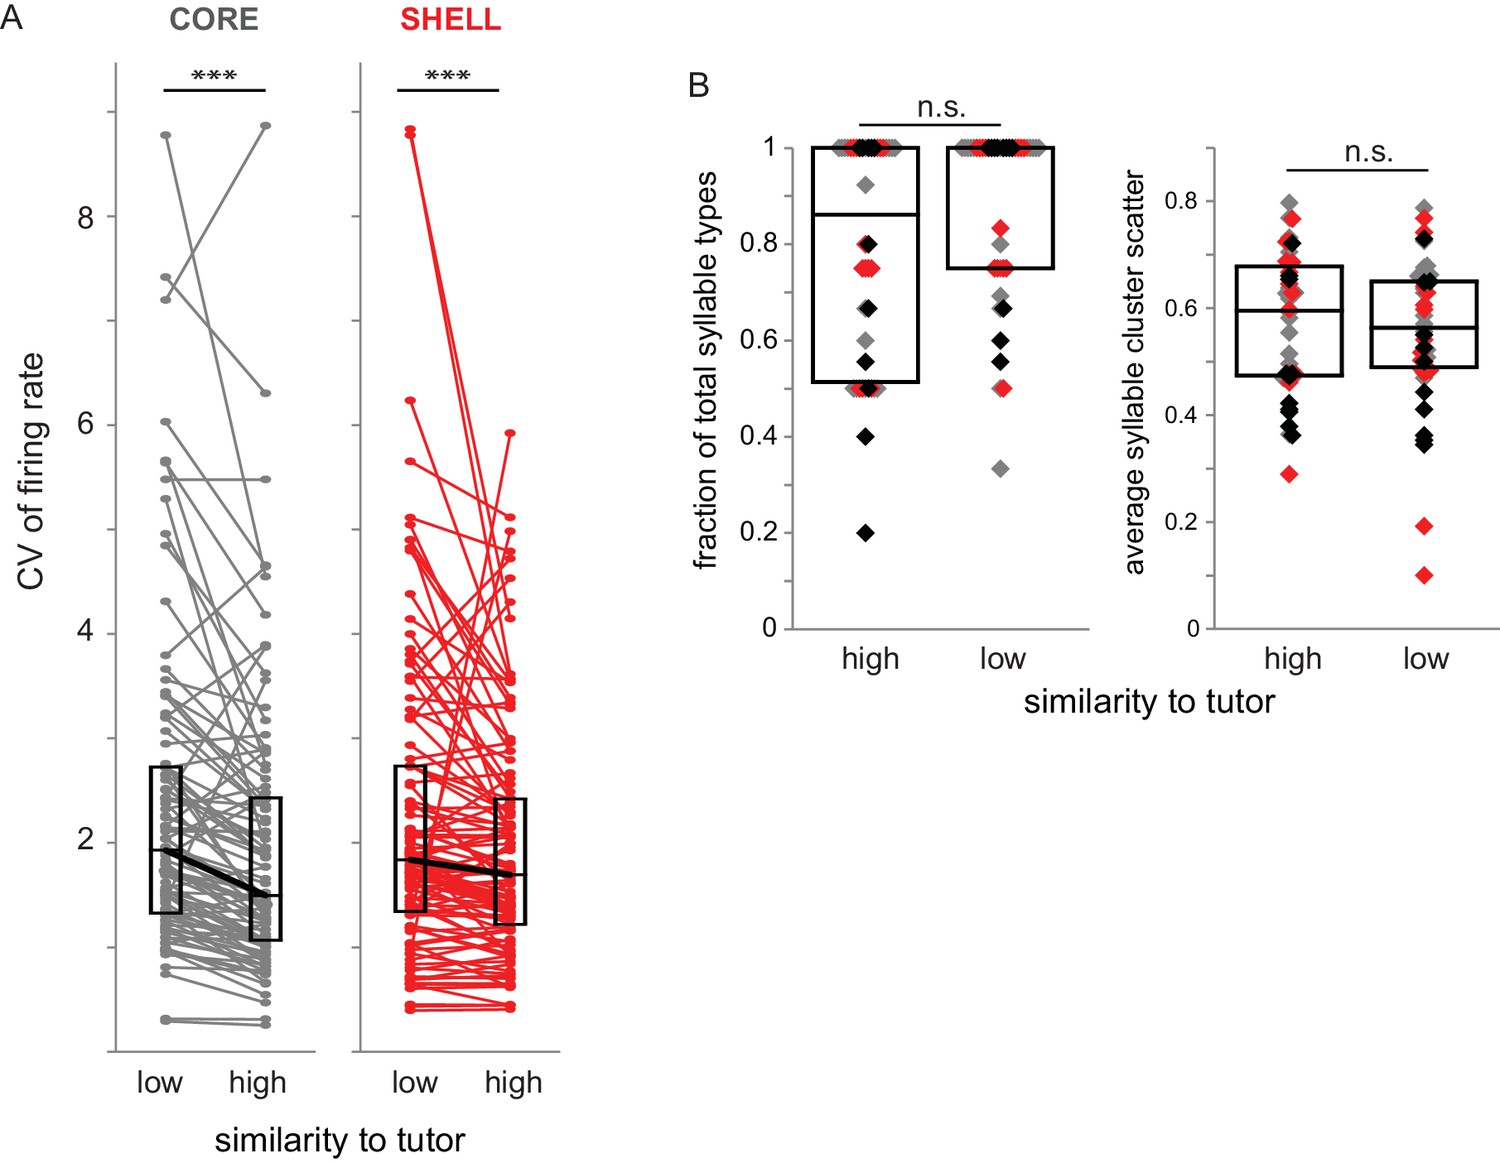
Variability of firing rate was higher during syllable renditions with low tutor similarity in both core and shell neurons.
(A) Coefficient of variation (CV) of firing rate for core (gray) and shell (red) neurons during production of syllables that had high or low similarity to tutor syllables (top versus bottom 50% of tutor similarity scores). ***p<0.001 between CV during production of syllables representing high versus low similarity to tutor (Wilcoxon signed-rank tests; core n = 87, shell n = 105). (B) Characteristics of syllables in high- versus low-similarity categories. Left: fraction of syllable types represented in high versus low similarity to tutor syllables for each bird for day of singing; each symbol represents the number of syllable types produced in a recording session as a fraction of the total number of syllable types produced. Gray markers represent sessions in which activity of core neurons was collected (n = 17), red markers represent sessions in which activity of shell neurons was collected (n = 14), black markers represent sessions in which activity of both core and shell neurons was collected (n = 11). Right: the average scatter for each syllable type represented in high- versus low- tutor similarity categories for each session, defined as the average of the acoustic distance between each point in the distribution to its centroid (lower values indicate a tighter cluster). Box plots represent median and first/third quartiles.
Figure 7 with 1 supplement
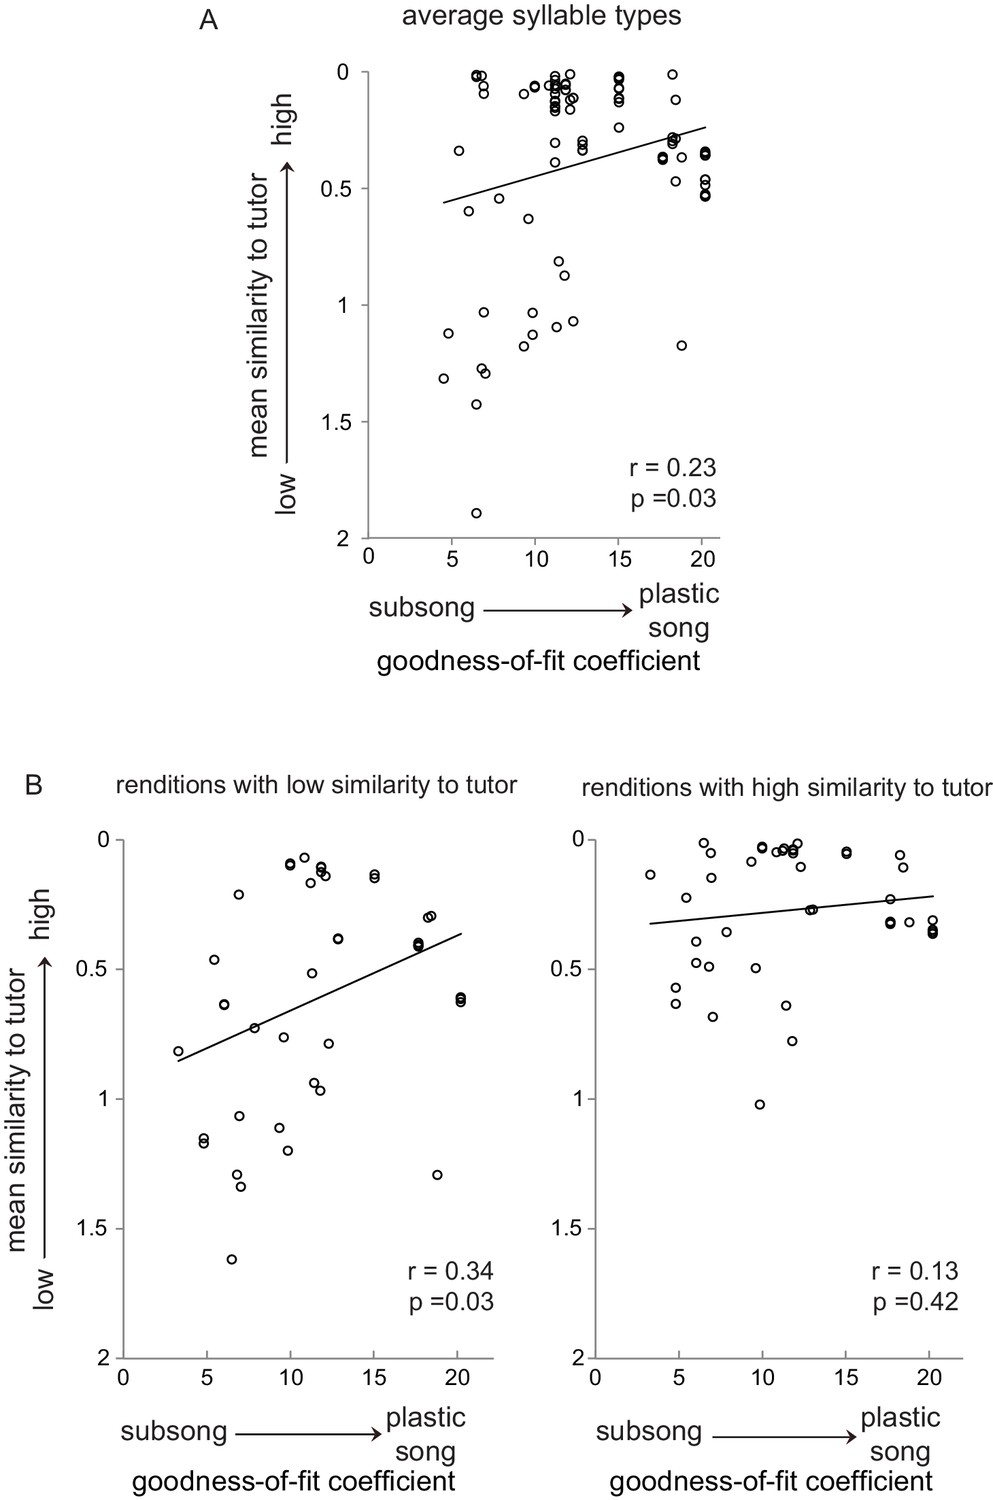
Subsets of syllable utterances during early sensorimotor learning had either high or low similarity to tutor syllables.
(A) Average similarity of all juvenile syllable types to corresponding tutor syllables as a function of the progression of song development from subsong to plastic song (goodness-of-fit coefficients plotted against average syllable-type similarity for each bird for each day of singing; see Figure 7—figure supplement 1). (B) Average similarity to tutor across development, plotted as in A, but segregating individual syllable renditions into low similarity (bottom 50% of tutor similarity scores, left panel) and high similarity (top 50% of tutor similarity scores, right panel) for each day of singing for each bird. For tutor similarity scores, 2 = no similarity, 0 = perfect similarity (see Materials and methods).
Figure 7—figure supplement 1
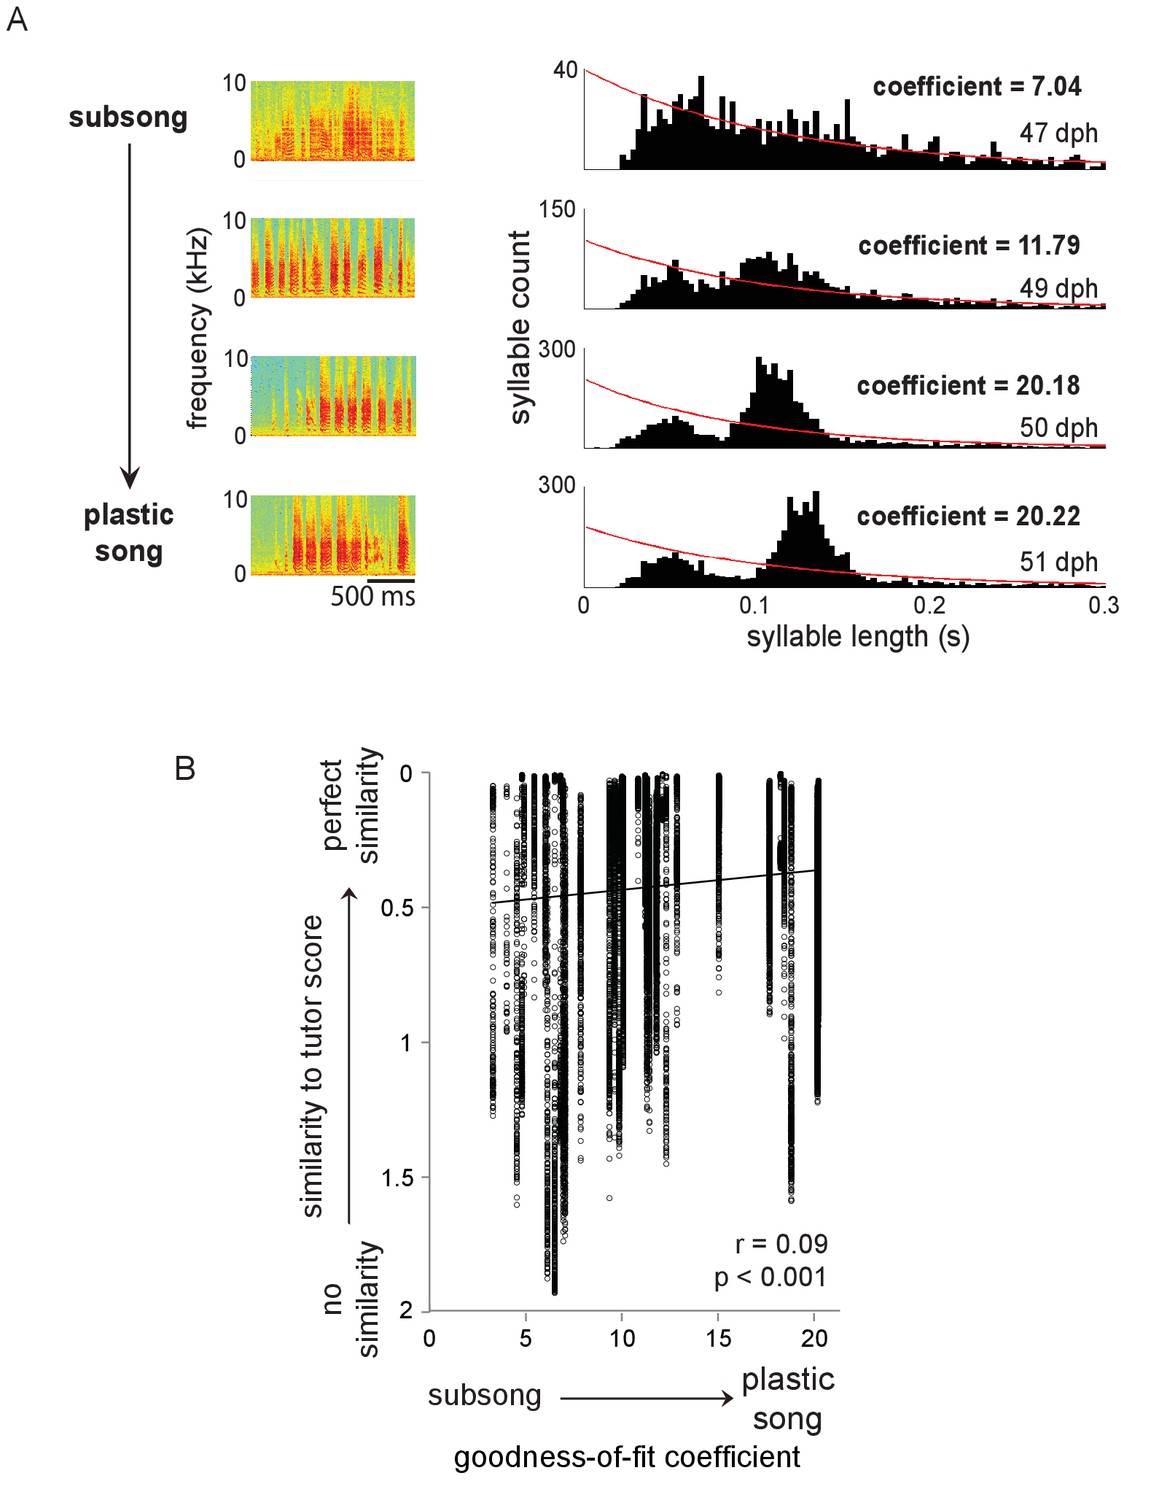
Measuring degree of song development for each day of singing for each bird.
(A) Left panel: example spectrograms of syllables from the same bird at different ages (47, 49, 50 and 51 dph). Right panel: distributions of syllable durations per day for this bird; red lines indicate exponential fits for each distribution. Coefficients shown for each day are goodness-of-fit coefficients from the Lilliefors test for fit to an exponential function (lower numbers indicate better fit). As birds progress to the plastic song stage of sensorimotor integration, they begin to produce syllables that appear as peaks in the distribution of syllable durations, causing the distributions to no longer be approximated by an exponential function. (B) Tutor similarity scores across all individual syllable renditions of all birds (regardless of whether or not renditions were assigned to syllable types) as a function of song development (0 = perfect similarity, 2 = no similarity; see Materials and methods). Black line indicates linear fit. These data show increases in tutor similarity across development for the population of individual syllable renditions in all birds.
Figure 8
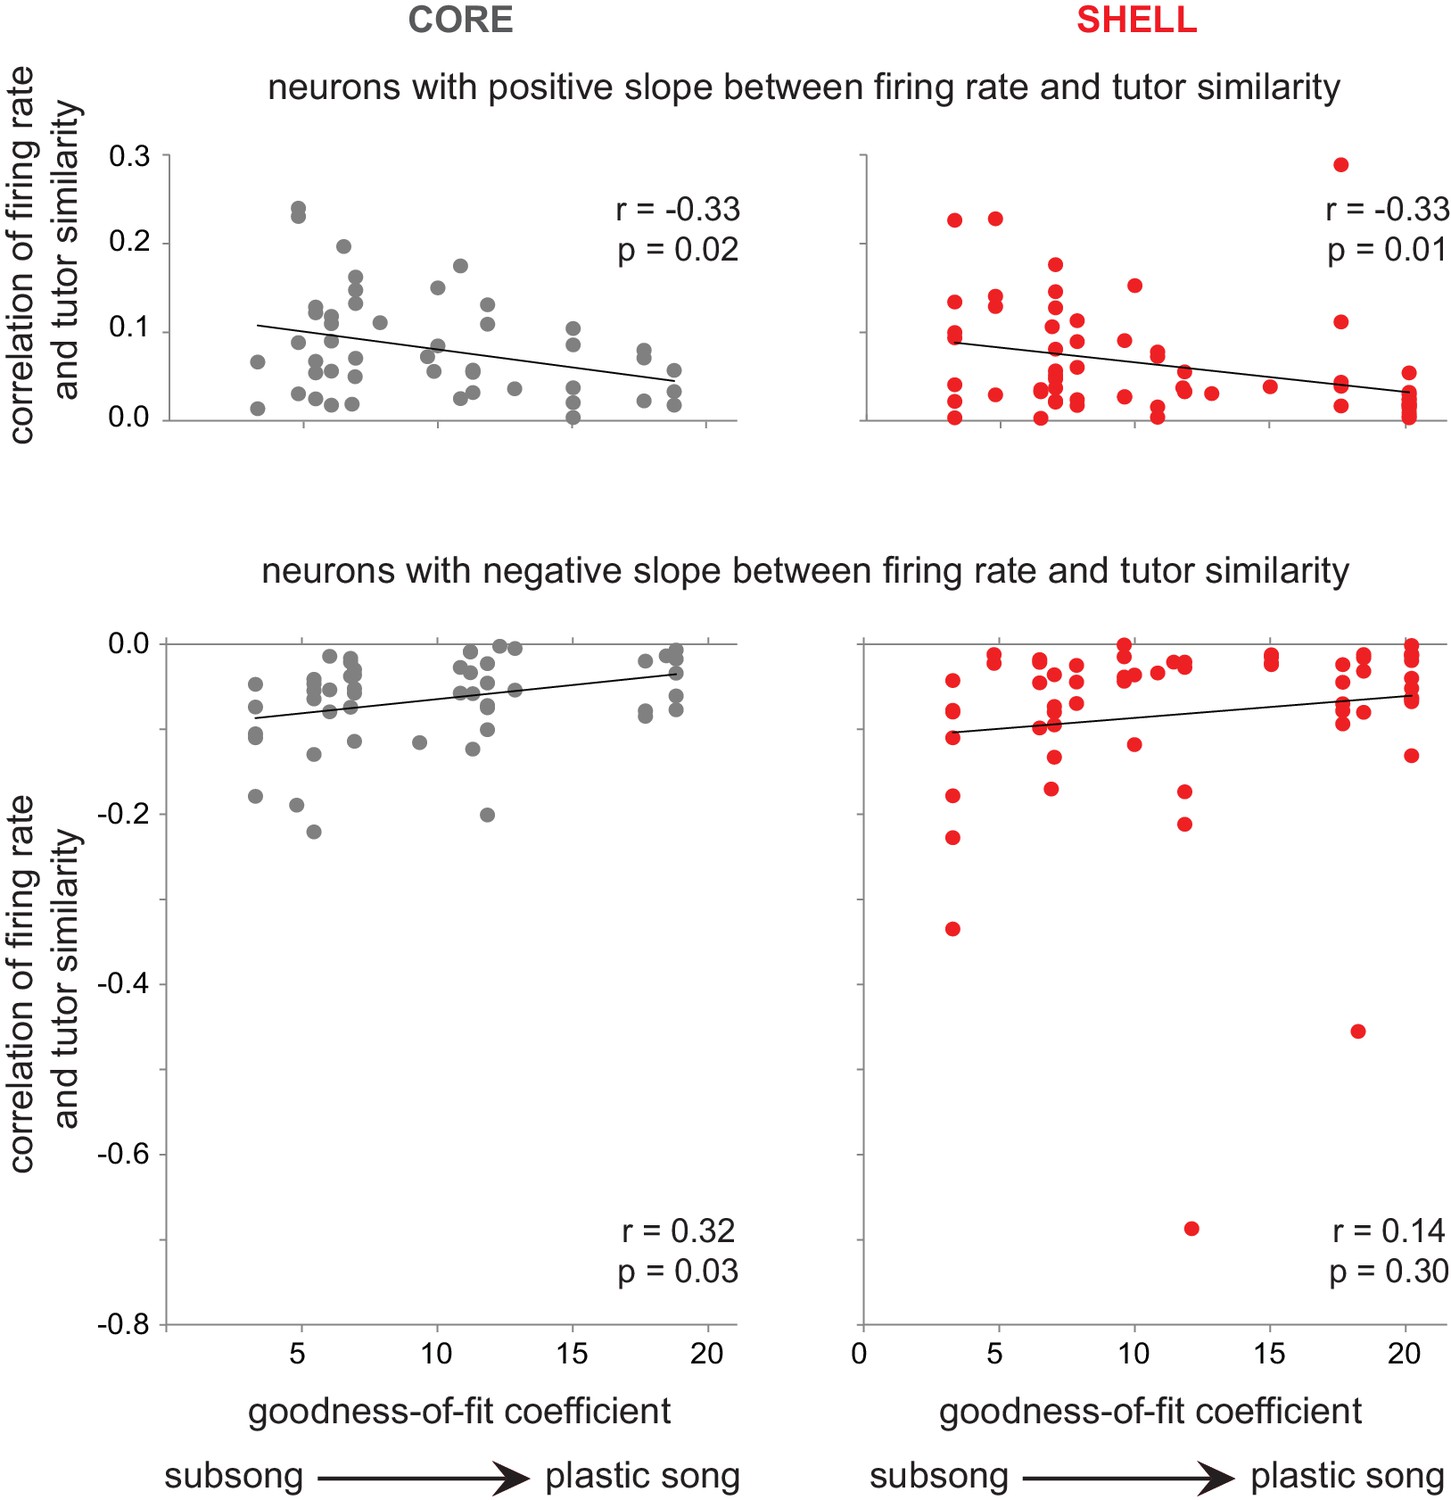
The association between firing rate and tutor similarity decreased in strength with the progression of song development.
The correlation between baseline-corrected firing rate and tutor similarity (r values, y-axis) is plotted against degree of song development (goodness-of-fit coefficients, x-axis) for neurons with a positive slope between firing rate and tutor similarity (r values > 0; top panels) and for neurons with a negative slope between firing rate and tutor similarity (r values < 0; bottom panels). core (gray, left panels); shell (red, right panels).
Figure 9
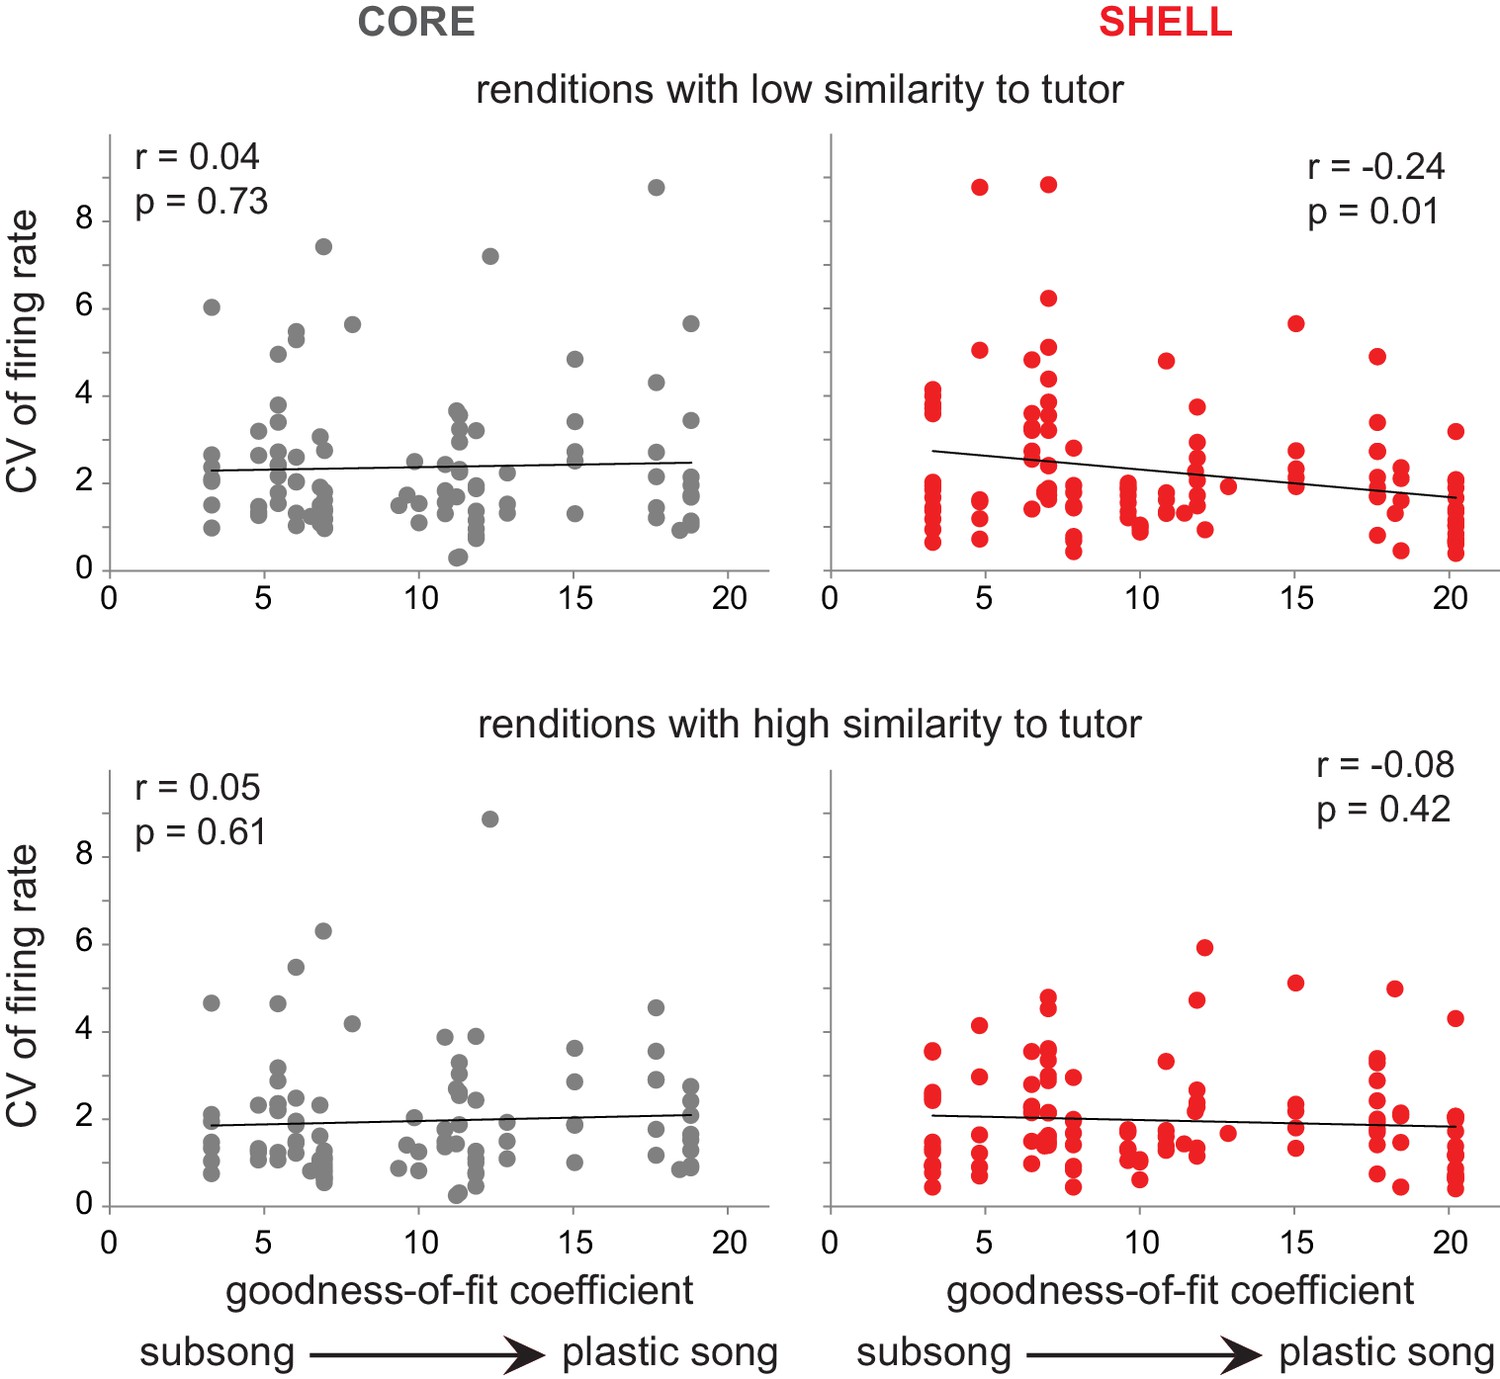
Variability of firing rate decreased in shell neurons during development for syllable renditions with low tutor similarity during subsong.
Top panels: correlation of CV of firing rate during production of syllable renditions in the bottom 50% of tutor similarity with the progression of song development. Bottom panels: correlation of CV of firing rate during production of syllable renditions in the top 50% of tutor similarity with the progression of song development. Black lines indicate linear fits. core (gray, left panels); shell (red, right panels).
Figure 10 with 1 supplement
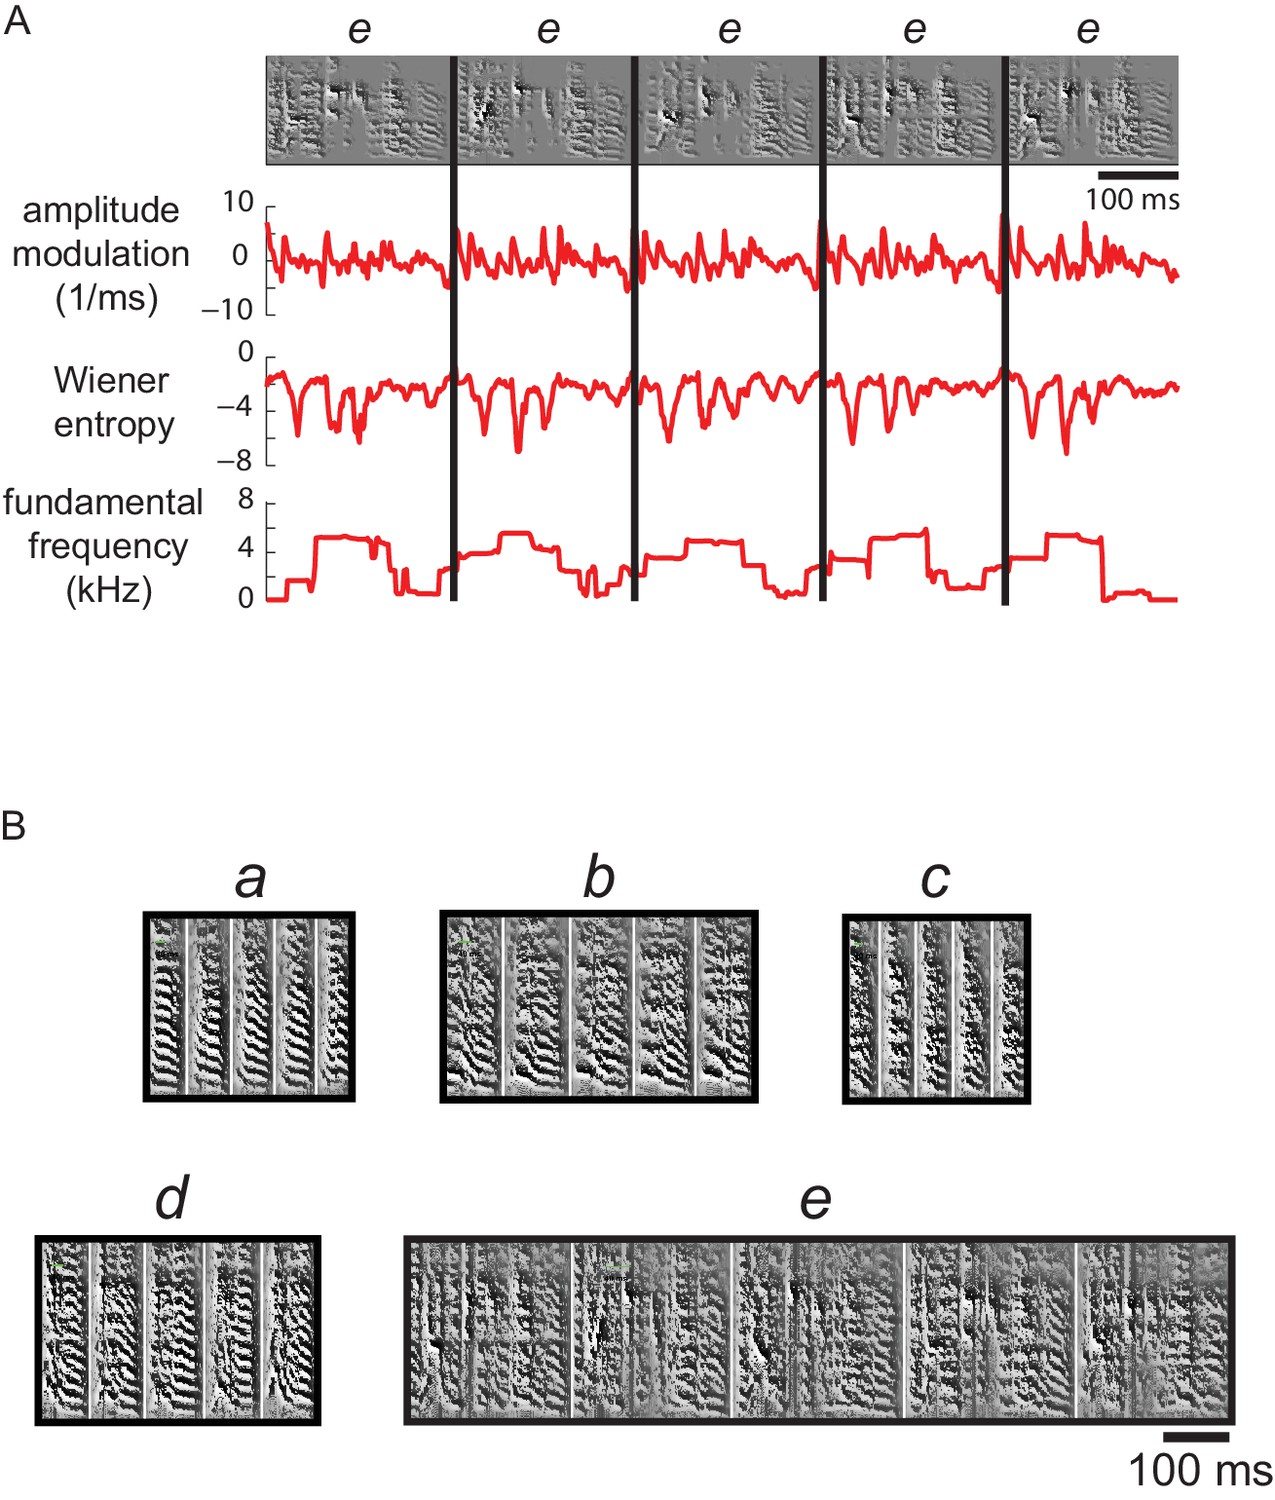
Multiple acoustic features were used to cluster syllable types.
(A) Examples of the features used to calculate acoustic similarity in order to assign juvenile syllable renditions to types (clusters). Top row shows spectrograms for five renditions of a syllable type labeled e from a 59 dph bird (also shown in B). Below are plots of three features calculated across time for each syllable; a total of 11 features were used to generate an acoustic distance score for clustering of syllables into types (see Materials and methods). (B) Spectrograms for the five syllable types from this bird, a-e, resulting from automatic clustering of syllables.
Figure 10—figure supplement 1
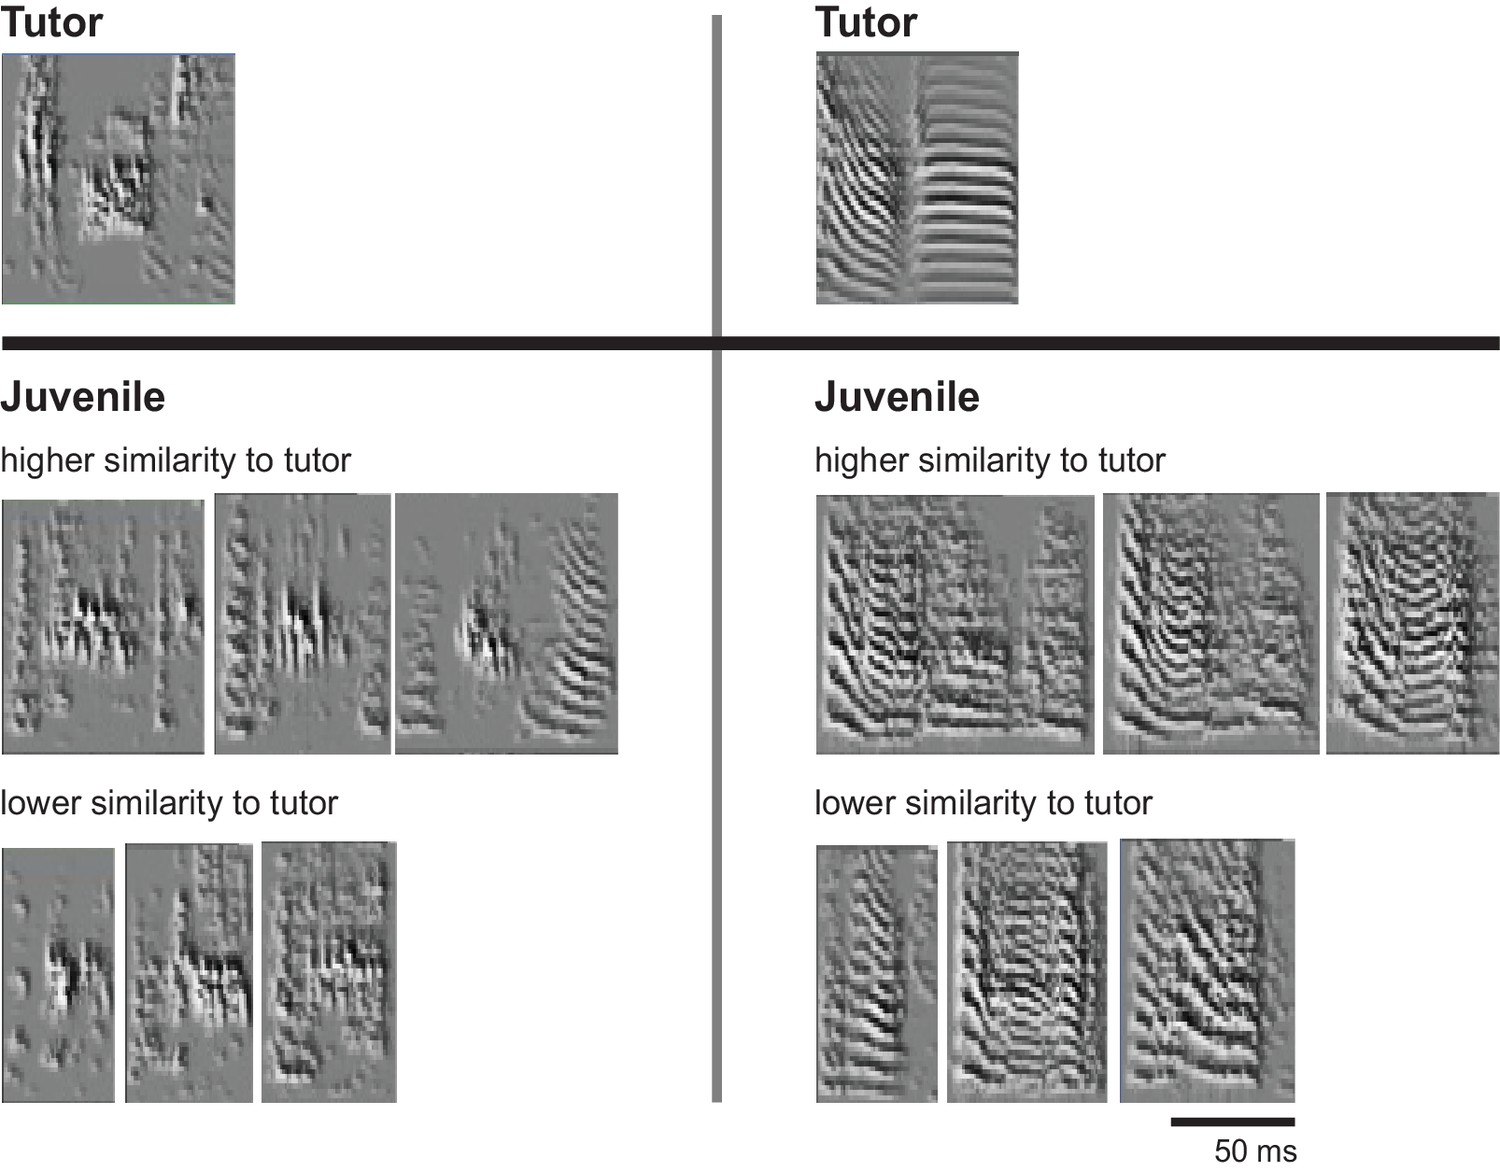
Examples of syllable renditions with either high or low acoustic similarity to the closest-matching tutor syllable.
The tutor syllable was selected by finding the closest acoustic distance between each juvenile syllable rendition and the tutor syllables for that bird (see Materials and methods).
Tables
Table 1
Response strength during episodes of singing.
Standardized response strength (mean ± s.e.m.) for core and shell neurons in LMAN that showed significant excitation or suppression during song production compared with quiet baseline periods (see Materials and methods).
| CORE | SHELL | |||
|---|---|---|---|---|
| Fraction | Response strength | Fraction | Response strength | |
| Excited | 0.72 (66/92) | 7.06 ± 0.71 | 0.65 (66/102) | 7.28 ± 0.44 |
| Suppressed | 0.28 (26/92) | −7.32 ± 1.15 | 0.35 (36/102) | −5.82 ± 0.45 |
Table 2
Tutor similarity modulates baseline-corrected firing rates in single LMAN neurons.
Single neurons showed either positive or negative slopes for the regression of firing rate against tutor similarity. The incidence of neurons across the population that had either positive (increased firing rates for syllables with higher tutor similarity) or negative (increased firing rates for syllables with lower tutor similarity) r values was similar for core and shell. Most single neurons had nonsignificant r values, but clear effects were observed at the population level (see Figure 5, text).
| Positive slope (r > 0) | Negative slope (r < 0) | ||
|---|---|---|---|
| CORE | 48 | 50 | Total cell number (n = 98) |
| 49.0 | 51.0 | Percent | |
| 0.082 | −0.065 | Mean of r value across all cells | |
| 3.3 | 2.2 | Estimated % significant core cells = 5.5 | |
| 0.22 | −0.21 | Approximate mean r value for significant cells (n = 5) | |
| SHELL | 62 | 60 | Total cell number (n = 122) |
| 50.8 | 49.2 | Percent | |
| 0.062 | −0.081 | Mean of r value across all cells | |
| 4.5 | 6.3 | Estimated % significant shell cells = 10.8 | |
| 0.21 | −0.31 | Approximate mean r value for significant cells (n = 13) |
Additional files
-
Transparent reporting form
- https://doi.org/10.7554/eLife.26973.022
Download links
A two-part list of links to download the article, or parts of the article, in various formats.
Downloads (link to download the article as PDF)
Open citations (links to open the citations from this article in various online reference manager services)
Cite this article (links to download the citations from this article in formats compatible with various reference manager tools)
Neural activity in cortico-basal ganglia circuits of juvenile songbirds encodes performance during goal-directed learning
eLife 6:e26973.
https://doi.org/10.7554/eLife.26973


