Regulation of life span by the gut microbiota in the short-lived African turquoise killifish
- Max Planck Institute for Biology of Ageing, Germany
- Chinhoyi University of Technology, Zimbabwe
- Czech Academy of Sciences, Czech Republic
- University of Cologne, Germany
Figures
Figure 1
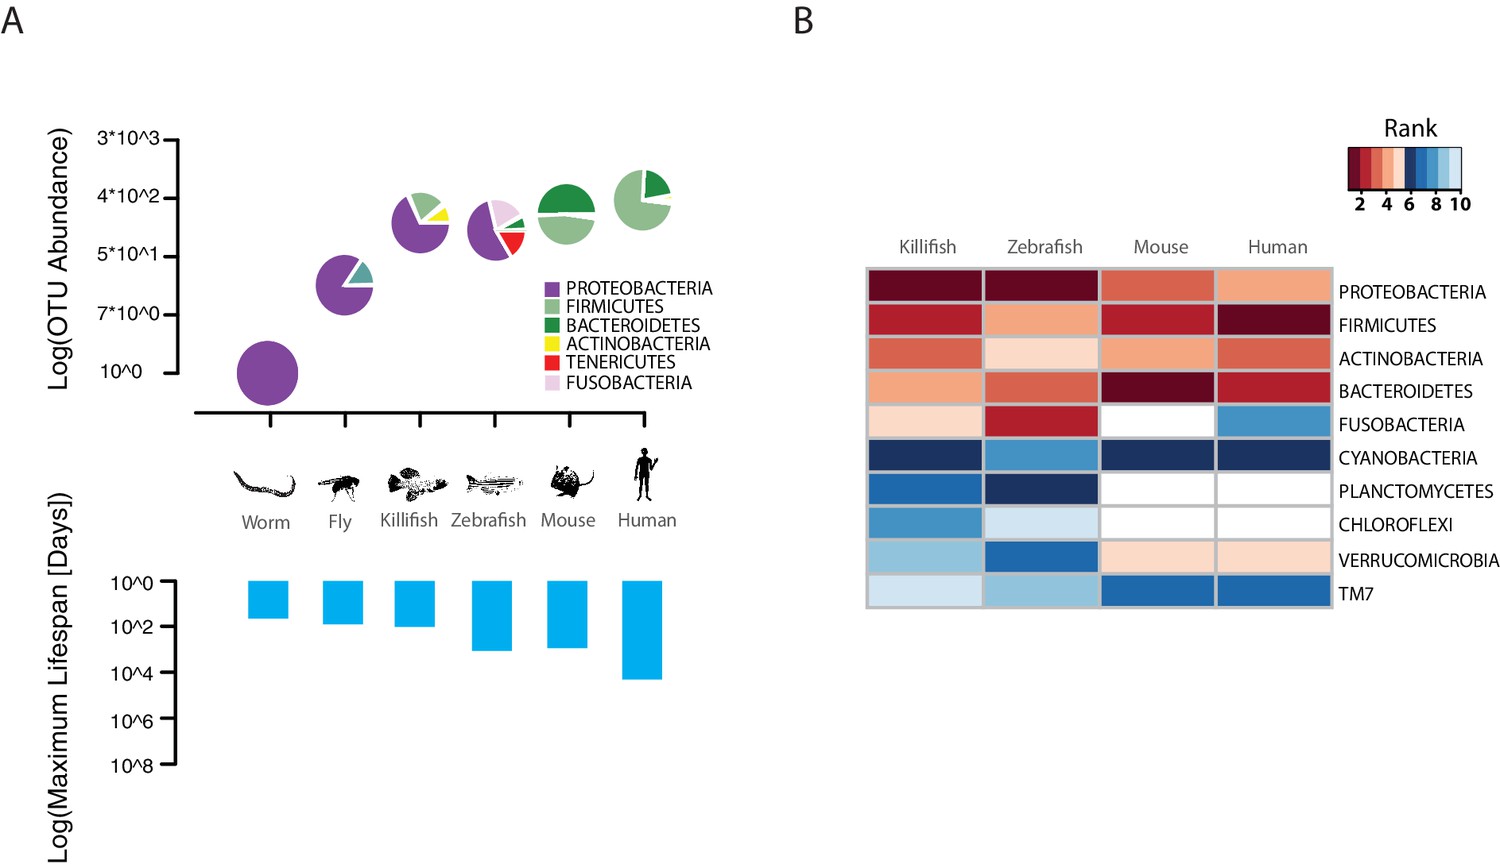
TK as a model to study aging of the GM.
(A) Above: relative bacterial OTU composition (pie charts) and diversity (y-axis of upper plot) across different aging model organisms (Figure 1—source data 1 and 2). Below: maximum life span (logarithm of days) in six model organisms, data from the AnAge longevity database (http://genomics.senescence.info/species/). (B) Heatmap of ranked relative abundance of OTU composition at the phylum-level for different model organisms (Figure 1—source data 1). Bacterial phyla are ordered by their relative abundance in the TK. The ranked abundance is color-coded, with higher ranks (red) indicating greater relative abundance and lower ranks (blue) indicating lower relative abundance. White cells mark phyla that are not detected in the respective model organism.
-
Figure 1—source data 1
Ranked abundance of bacterial phyla shared among turquoise killifish (TK), zebrafish, mouse and human (Materials and methods).
For each species indicated in the first row, the values in column display the rank order of each bacterial phylum indicated in bold in the first column.
- https://doi.org/10.7554/eLife.27014.004
-
Figure 1—source data 2
Relative phylum abundance of bacterial phyla shared among turquoise killifish (TK), zebrafish, mouse and human (Materials and methods).
A indicates Archaea, B indicates Bacteria.
- https://doi.org/10.7554/eLife.27014.005
Figure 2 with 1 supplement
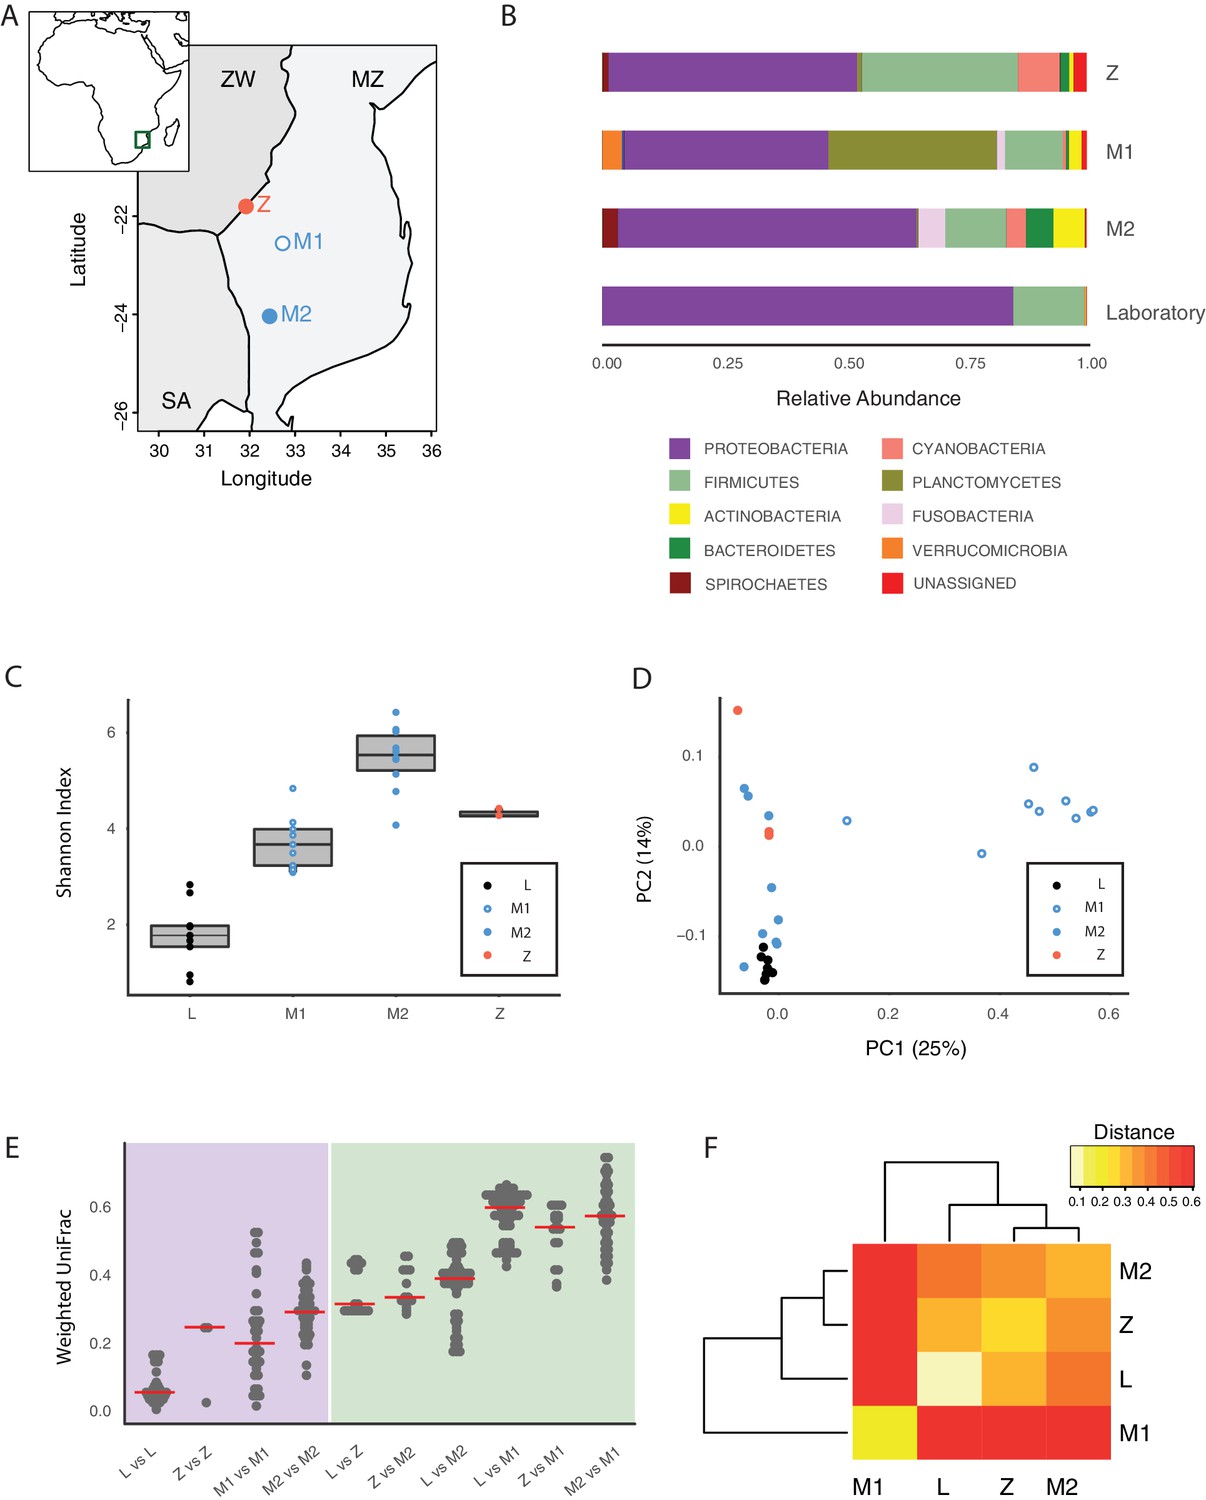
Core microbiota is conserved between wild and captive TK.
(A) Map location of wild populations collected in Zimbabwe (Z) and Mozambique (M1 and M2). ZW: Zimbabwe; MZ: Mozambique; SA: South Africa. (B) Relative abundance of bacterial phyla in wild populations and laboratory fish. (C) Shannon Index alpha diversity in laboratory and wild fish (L = laboratory, derived from individuals originally collected in Zimbabwe). (D) PCoA of the Weighted UniFrac beta diversity distance for wild and laboratory fish. Adonis test: L vs. all groups: p value < 0.001, M2 vs. M1: p value < 0.001, Z vs. M1 and M2: p value < 0.05. (E) Dotplot of the Weighted UniFrac distance values to visualize beta diversity within (purple background) and between (green background) the different populations. Single dots represent comparisons between individual fish. Red horizontal line indicates the median for each comparison. (F) Heatmap of the Weighted UniFrac distance among wild populations and laboratory fish.
-
Figure 2—source data 1
Collection points of the wild fish populations.
- https://doi.org/10.7554/eLife.27014.007
-
Figure 2—source data 2
Ecological factors associated with wild fish populations.
- https://doi.org/10.7554/eLife.27014.008
Figure 2—figure supplement 1
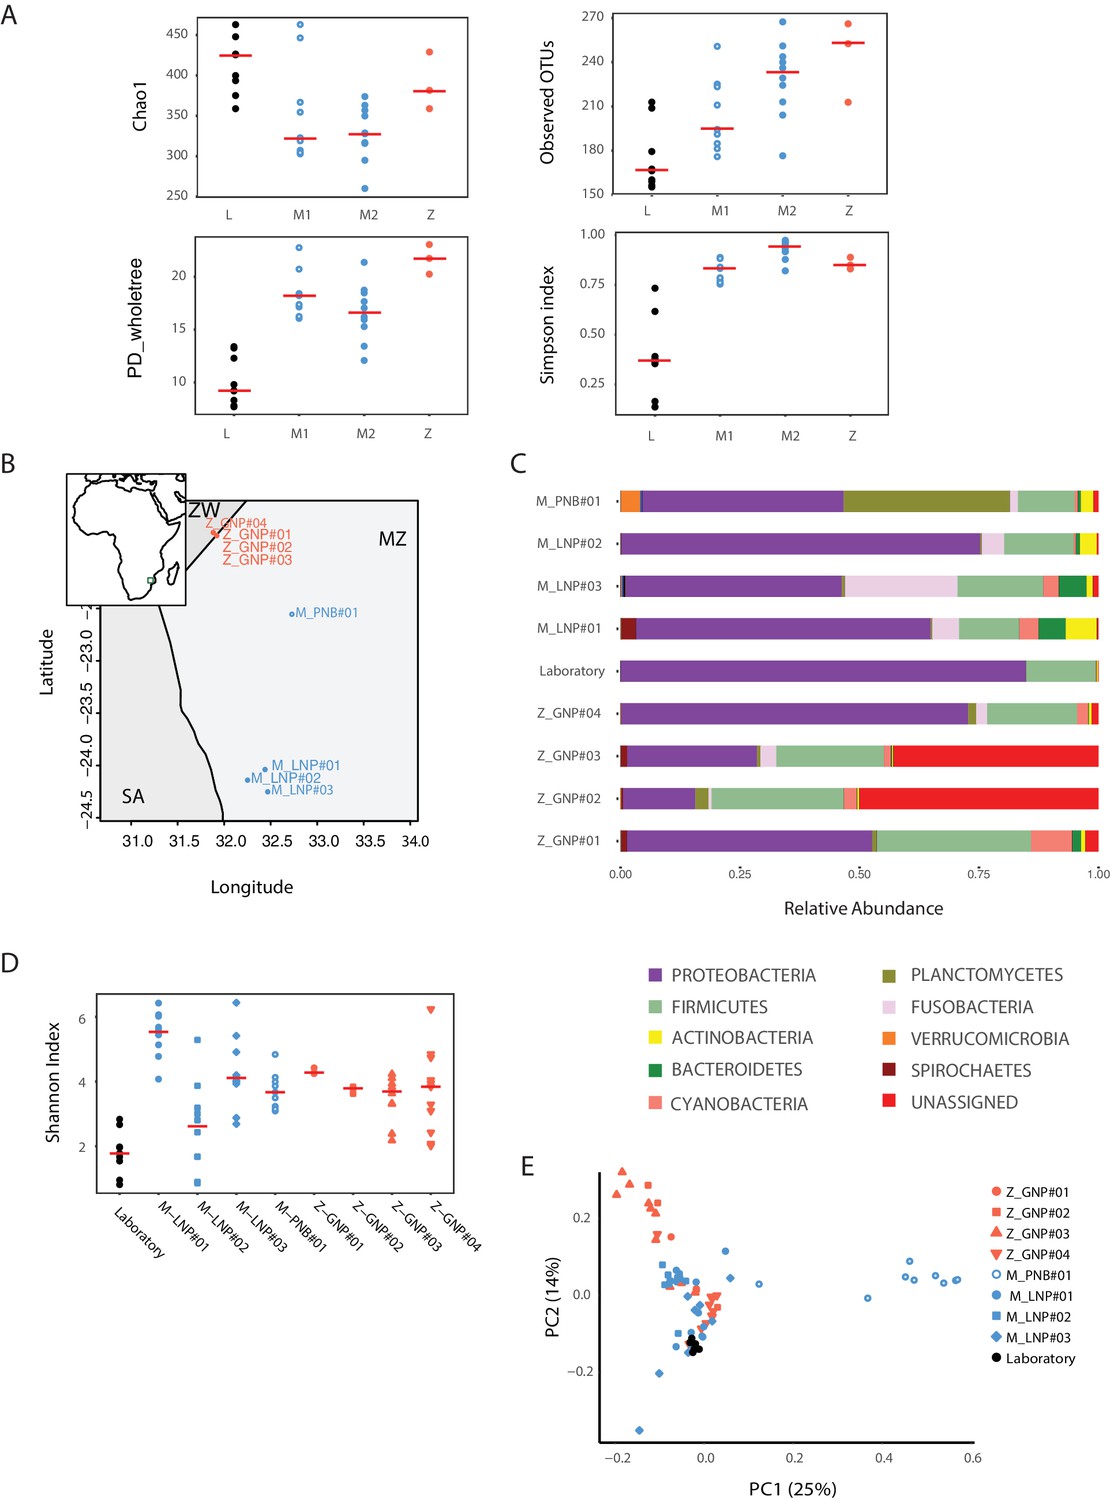
Bacterial diversity measures in captive and wild turquoise killifish populations.
(A) Chao1, Observed OTUs, Phylogenetic Distance and Simpson Index for laboratory (‘L’) and wild-caught populations (M1, M2, Z). (B) Map location of all the collected and sequenced populations. MZ: Mozambique; Z: Zimbabwe; SA: South Africa. (C) Phylum-level bacterial frequency in wild and laboratory populations. (D) Alpha diversity Shannon Index in laboratory and wild-caught populations. (E) PCoA of the Weighted UniFrac beta diversity between wild and laboratory fish.
Figure 3 with 2 supplements
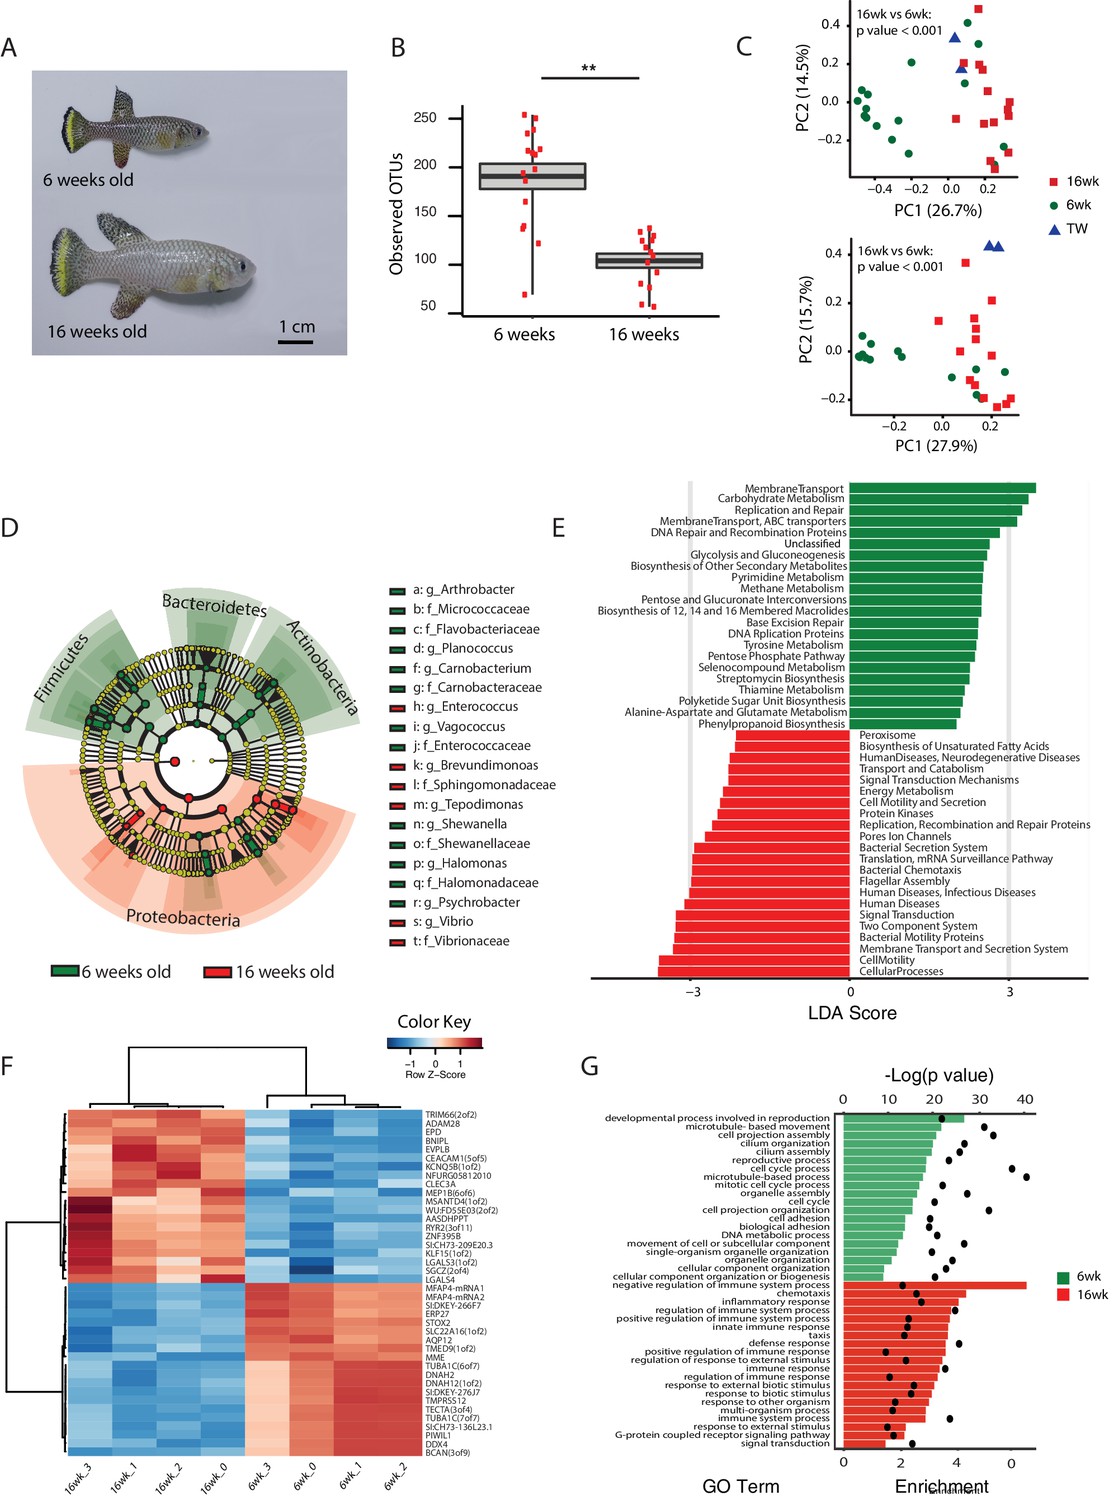
Changes in GM and gut transcriptome between young and old fish.
(A) Representative 6-week-old (young) and 16-week-old (old) male TK. (B) Alpha diversity changes in observed OTUs in young (6 weeks) and old (16 weeks) TK. N = 16 6-week-old fish and 14 16-week-old fish. The groups are compared using the Mann Whitney U test; ** indicates a p value < 0.001. (C) Beta diversity microbiota analysis separates samples based on age. Above: Bray-Curtis analysis, below: Unweighted UniFrac analysis. TW: tank water control. Adonis test, p value < 0.001 in both comparisons between 6-week and 16-week-old fish. (D) Cladogram representing microbial taxa enriched in young (green) versus old (red) individuals. (E) Predicted metagenome function in young (green) and old (red) groups (LEfSe), representing functions with p value < 0.001. The x-axis indicates the Linear Discriminant Analysis score for all the significant metabolic functions. (F) Expression heatmap for the twenty top differentially expressed genes (DEGs) between young and old fish (n = 4 for each group). Blue to red color represent low to high expression. Top 20 genes are highly expressed in old fish, the bottom 20 are highly expressed in young fish. (G) Top 20 Gene Ontology (GO) terms of the DEGs between young and old fish. Enrichment values (bars) and the negative natural logarithm of p values (black dots) are shown.
Figure 3—figure supplement 1
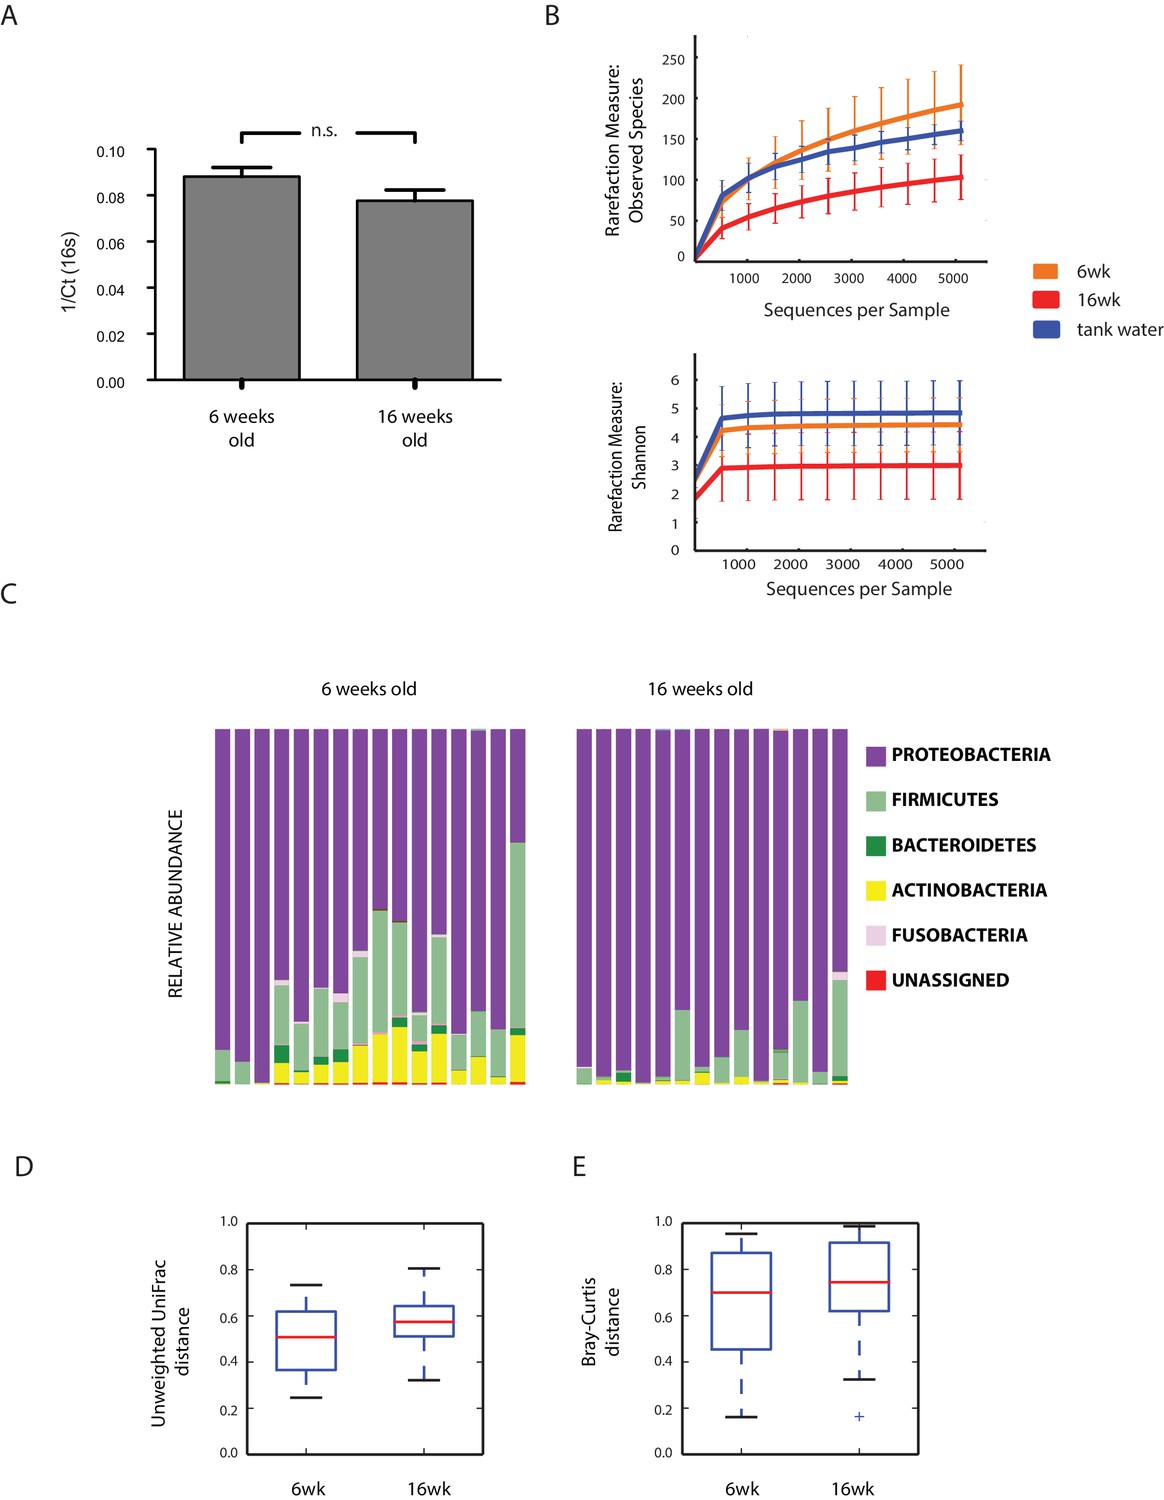
Aging in the GM: bacterial diversity.
(A) Bacterial abundance in young and old fish measured from faecal pellets. (B) Rarefaction curves between young, old fish, and two tank water control samples. (C) Relative abundance at the phylum level between young and old subjects. (D–E) Beta diversity analysis between young and old fish OTUs. Unweighted UniFrac analysis, non-parametric, Bonferroni-corrected p value = 0.001; Bray-Curtis beta diversity, non-parametric, Bonferroni-corrected p value = 0.005.
Figure 3—figure supplement 2
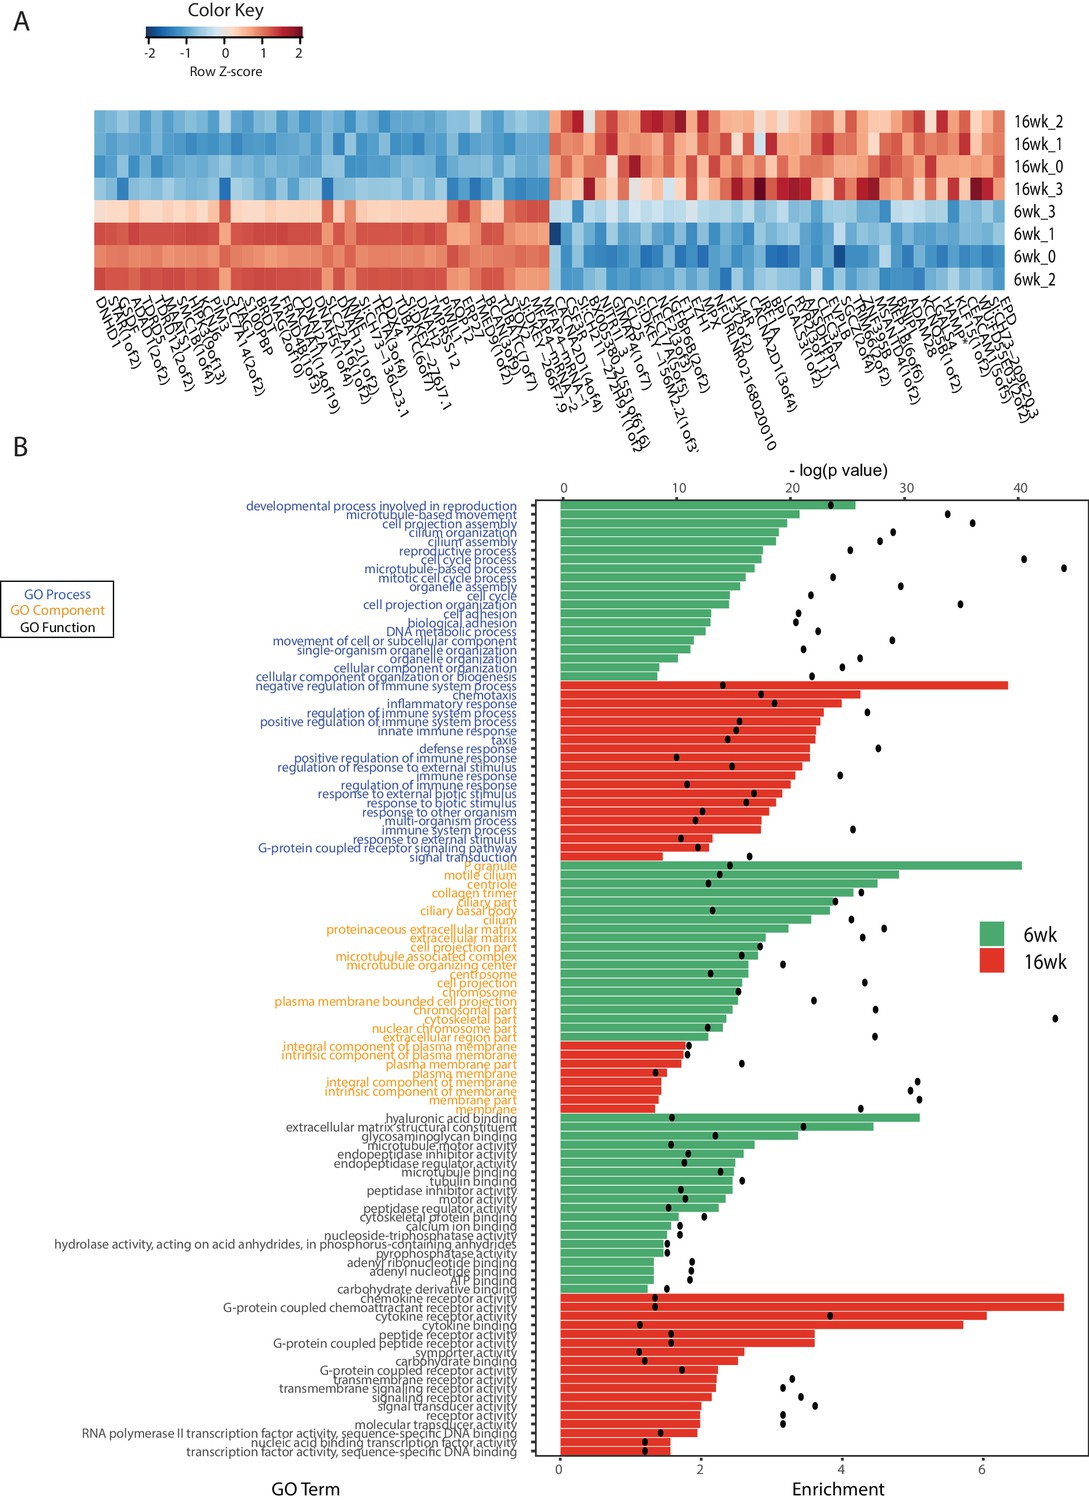
RNA-Seq analysis of young and old fish intestines.
(A) Expression heatmap for the top 80 differentially expressed genes (DEGs) between young and old fish (n = 4 for each group). Genes are shown in columns and individuals in rows. Highly expressed genes are colored red and low expressed genes are colored in blue. (B) Top Gene Ontology (GO) terms of the DEGs between young and old fish for GO categories process, function and component. The top twenty GO terms are listed based on significance and sorted by enrichment. Enrichment values (bars) and the negative natural logarithm of p values (black dots) are shown. *HAMP is the best protein blast hit in Danio rerio of the TK gene NFURG05812010005.
Figure 4 with 1 supplement
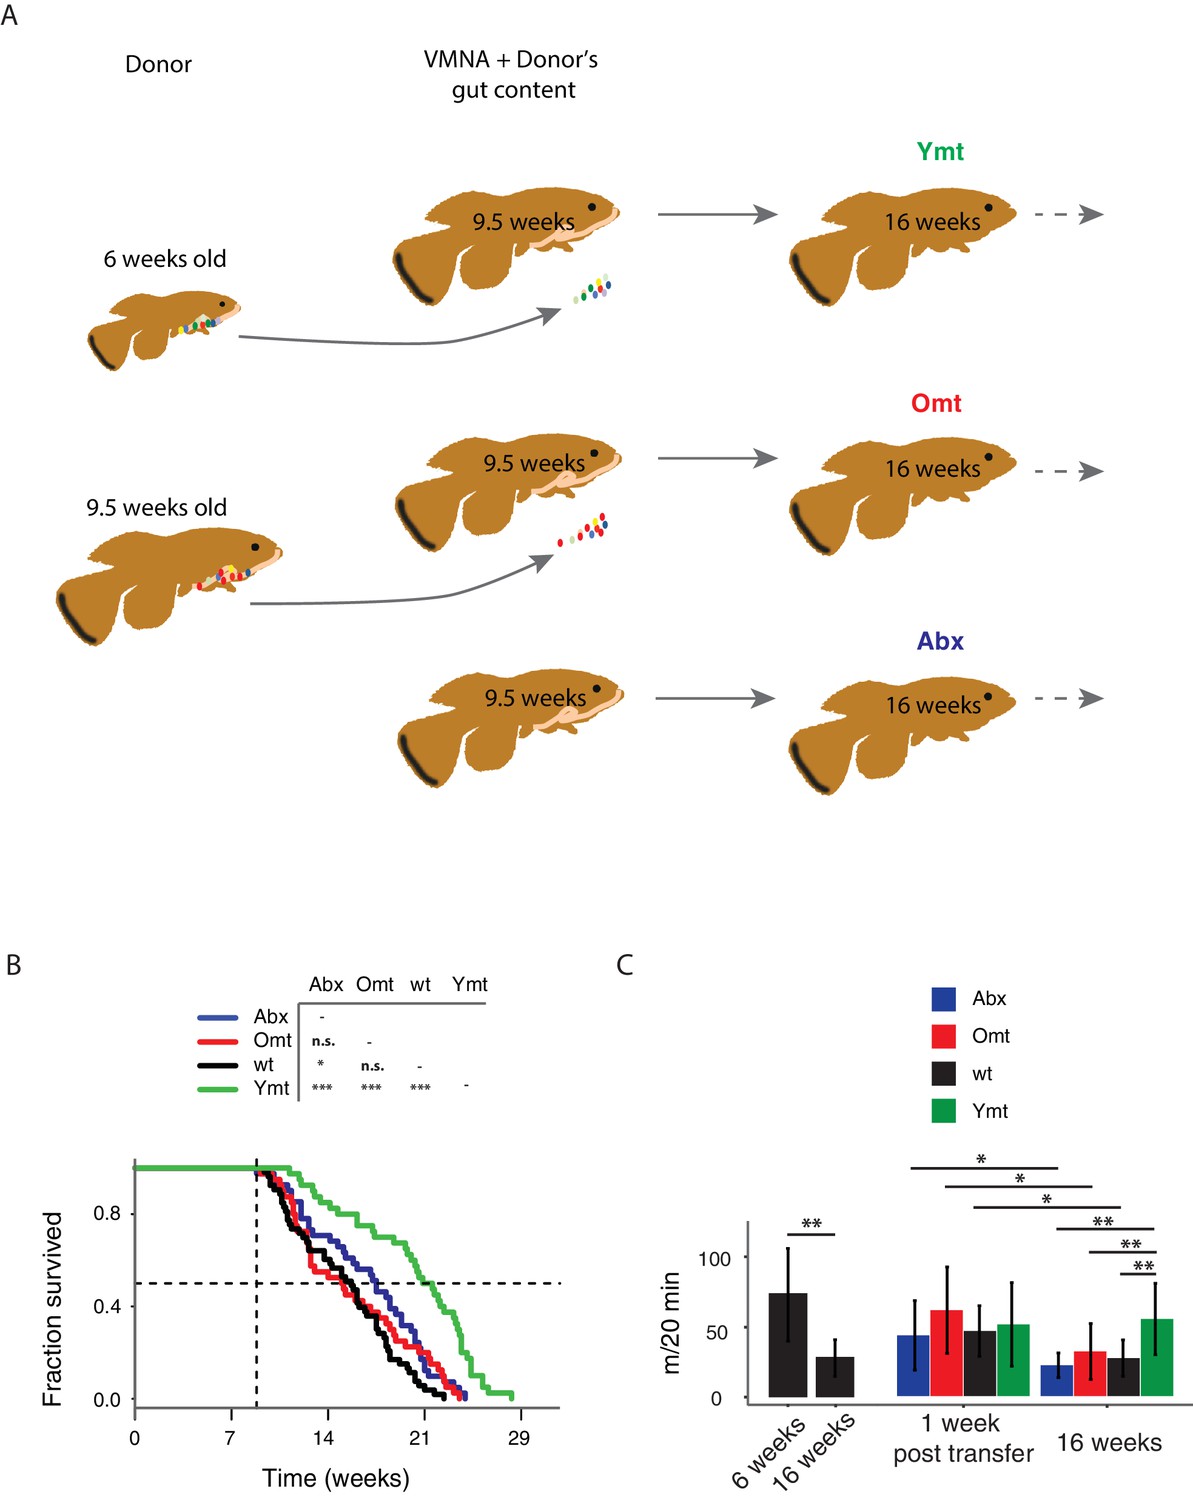
Transferring young GM to adult fish prolongs life span and delays motor decline.
(A) Schematic representation of the microbial transfer experiment (Materials and methods). Experimental group legend, Abx: fish receiving only antibiotic treatment at 9.5 weeks without direct recolonization. Omt: fish receiving same-age GM transfer after antibiotic treatment at 9.5 weeks. Wt: wild-type, untreated fish. Ymt: fish receiving 6-week-old fish GM transfer after antibiotic treatment at 9.5 weeks. VMNA: antibiotic cocktail of vancomycin, metronidazole, neomycin and ampicillin. (B) Survival analysis. Statistical significance is calculated by Logrank test. * indicates a p value < 0.05; *** indicates a p value < 0.001. (C) Exploratory behavior in different treatments. Y-axis indicates average distance (in meters) covered in 20 min. Young and old wild-types are compared with a Kruskal-Wallis test (left), the remaining groups are compared using a Dunn Kruskal-Wallis test for multiple comparisons, and the p values are adjusted based on BH correction. Statistical significance: * indicates a p value < 0.05; ** indicates a p value < 0.01; *** indicates a p value < 0.001.
-
Figure 4—source data 1
Survival data for transfer experiment after antibiotic treatment at 9.5 weeks of age.
- https://doi.org/10.7554/eLife.27014.014
-
Figure 4—source data 2
Survival data for transfer experiment after antibiotic treatment at 6 weeks of age.
- https://doi.org/10.7554/eLife.27014.015
-
Figure 4—source data 3
Spontaneous locomotor activity (cm/20 min).
- https://doi.org/10.7554/eLife.27014.016
Figure 4—figure supplement 1
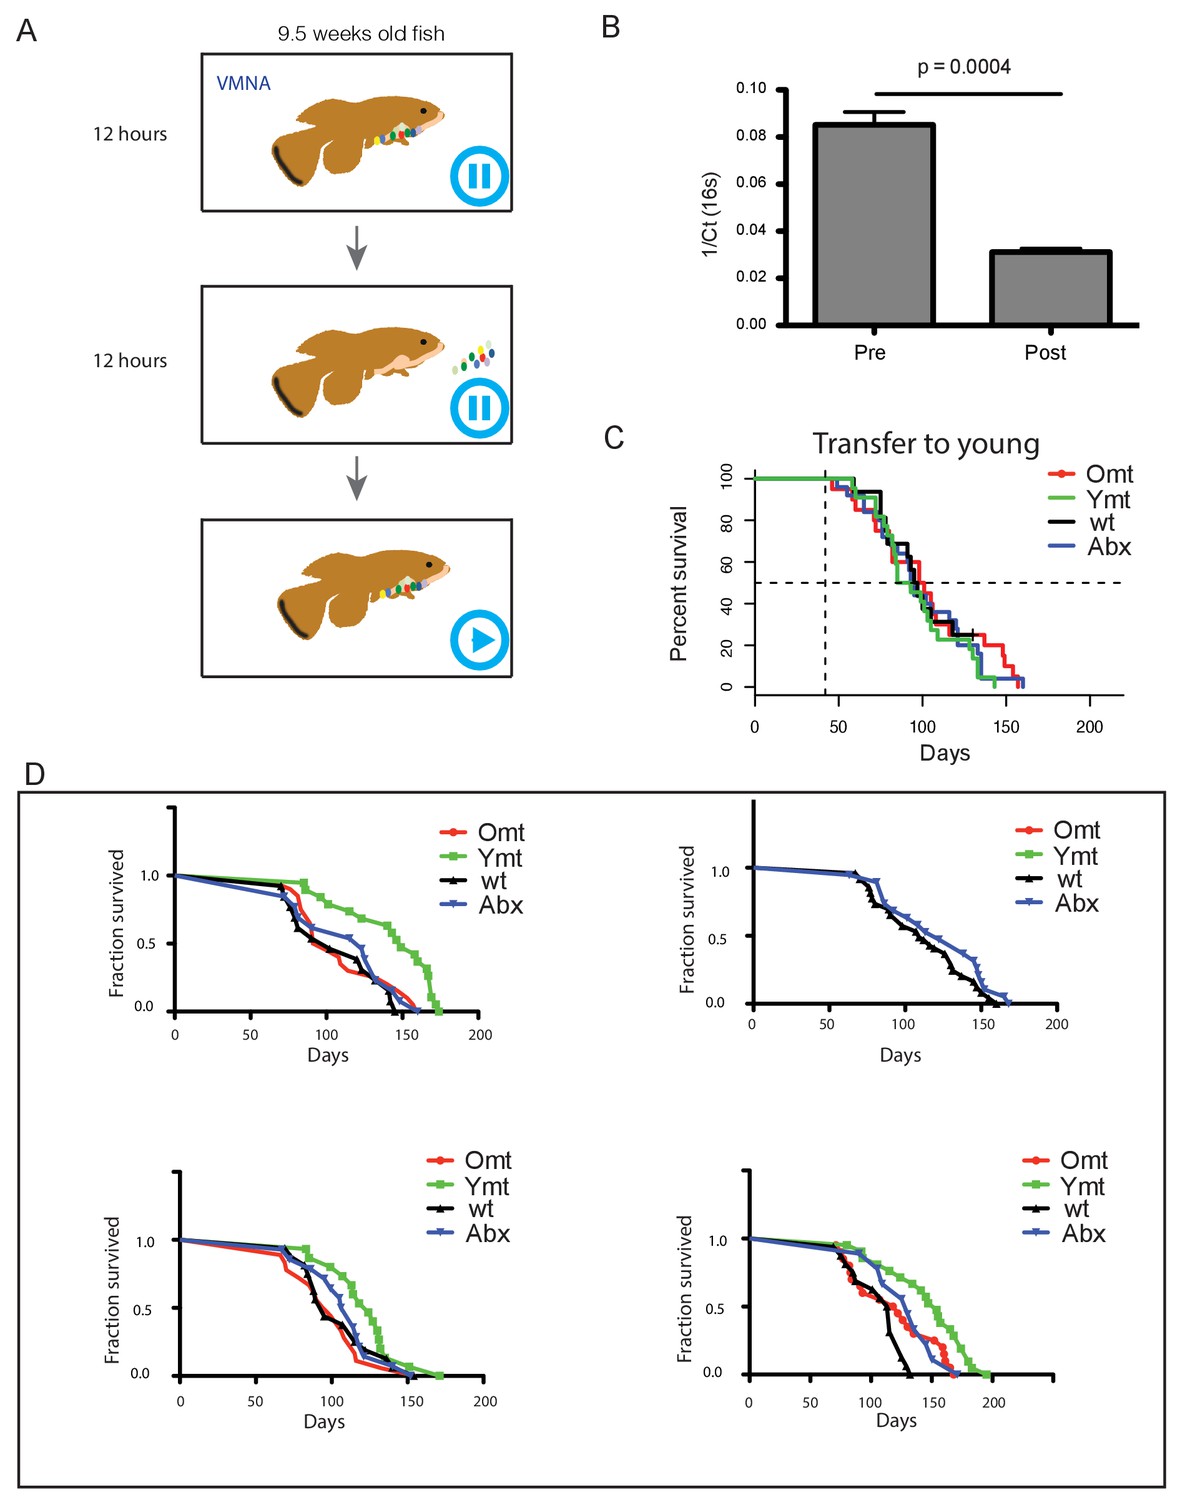
Experimental design and consequences of gut microbiota transfer protocol.
(A) Schematic of microbiota transfer protocol. During 12 hr of VMNA antibiotic cocktail administration fish are kept in tanks with no water filtration/recirculation. Next they are transferred to new tanks with autoclaved tank water where gut microbiota recolonization occurs for 12 hr without water filtration/recirculation. After the second step, fish are transferred back to the water filtration/recirculation system and exposed to the regular fish room environment. (B) Bacterial load decreases after antibiotic treatment, measured as 1/Ct value after normalization to amount of input faecal material (n = 10 pre-treatment and 10 post-treatment; Materials and methods). (C) Transfer to 6-week-old fish (Figure 4—source data 2). Abx: fish receiving only antibiotic treatment at 6 weeks without direct recolonization. Omt: fish receiving 16-week-old GM transfer after antibiotic treatment at 6 weeks. Wt: wild-type, untreated fish. Ymt: fish receiving 6-week-old fish GM transfer after antibiotic treatment at 6 weeks. (D) Independent survival cohorts for the microbiota transfer experiment, with transfer towards 9.5-week-old fish (Figure 4—source data 1). Abx: fish receiving only antibiotic treatment at 9.5 weeks without direct recolonization. Omt: fish receiving 9.5-week-old GM transfer after antibiotic treatment at 9.5 weeks. Wt: wild-type, untreated fish. Ymt: fish receiving 6-week-old fish GM transfer after antibiotic treatment at 9.5 weeks. VMNA: antibiotic cocktail of vancomycin, metronidazole, neomycin and ampicillin (Materials and methods).
Figure 5 with 1 supplement
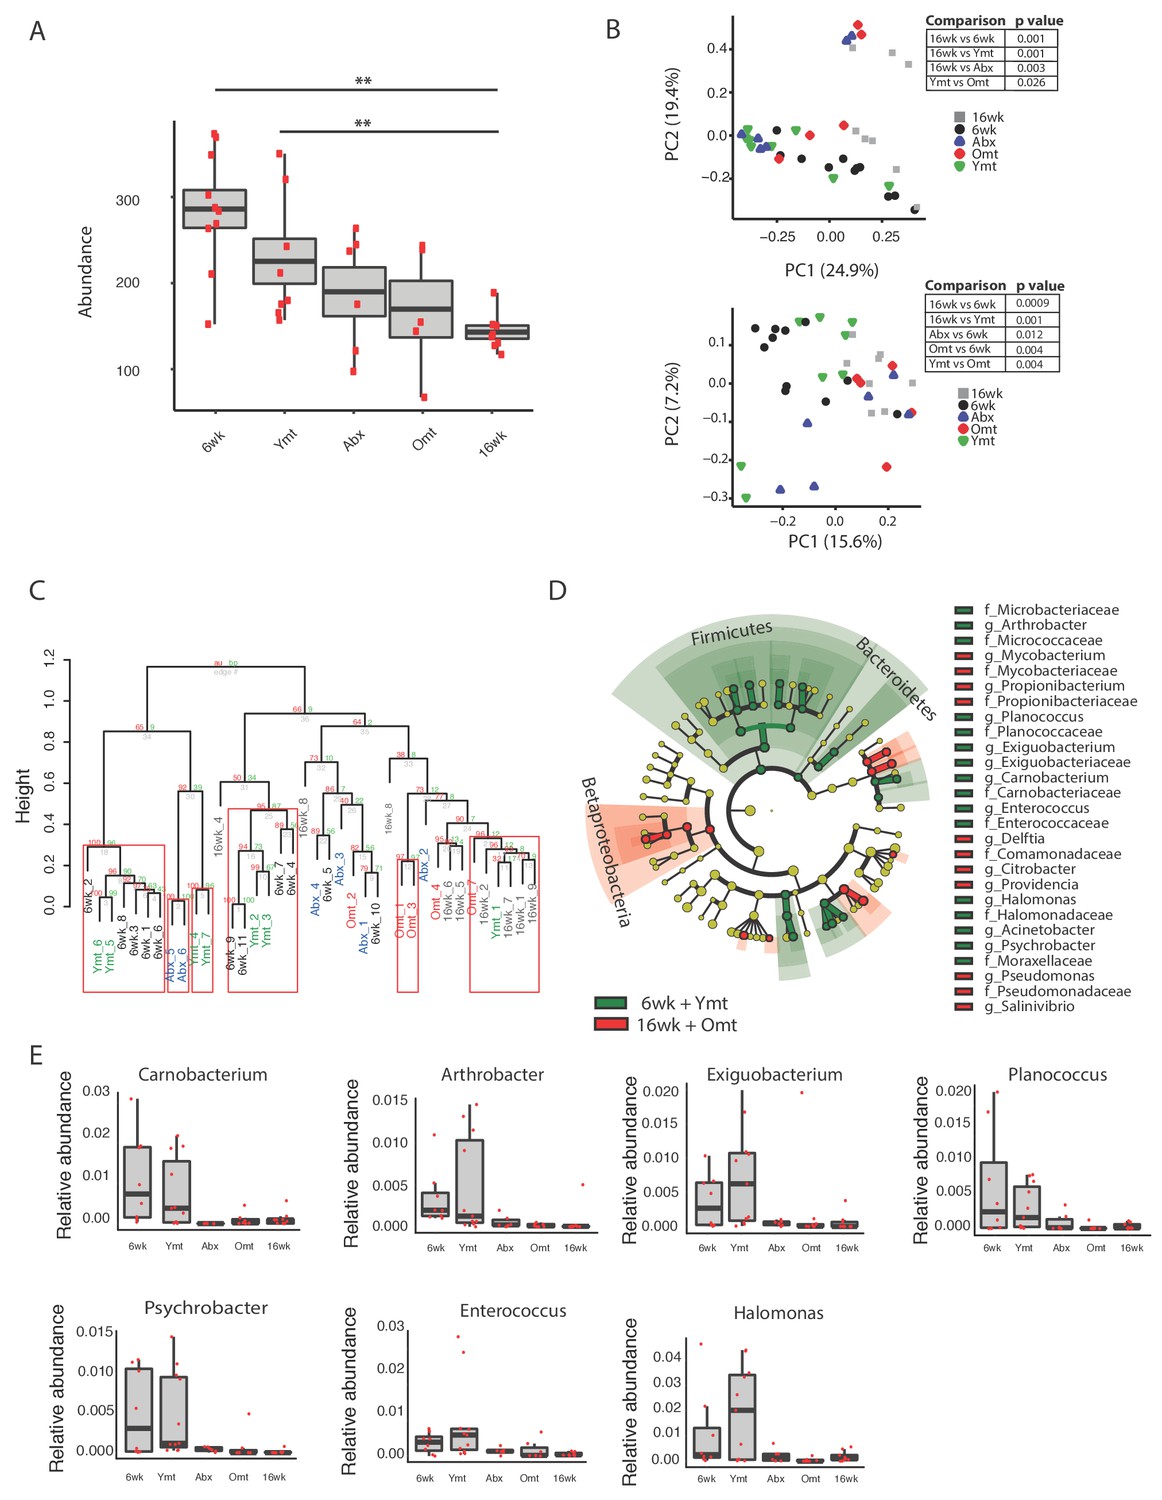
Microbiota transfer at 9.5 weeks influences microbial composition at 16 weeks.
(A) Alpha diversity measured by number of observed OTUs in experimental groups at 16 weeks (16wk, Abx, Omt, Ymt) and young controls (6wk). Dunn Kruskal-Wallis test for multiple comparisons. The p values are adjusted based on BH correction. Statistical significance: ** indicates a p value < 0.01. (B) Microbiota community analysis using Bray-Curtis (above) and Unweighted UniFrac (below) separates samples based on young vs. old GM treatment (significant p values are shown, Adonis test). (C) Hierarchical clustering on OTU data. Significant clusters are highlighted by red rectangles. P values: au = approximately unbiased; bp: bootstrap probability. (D) Cladogram of bacterial taxa enriched in young wild-type (6wk) and Ymt groups versus 16wk and Omt. (E) Boxplots of selected bacterial genera relative abundance in experimental groups. Bacterial genera are those represented in Figure 5D, filtered by r-square value larger than 0.8, based on the correlation between bacterial genus abundance vs. median life span in each individual group (Figure 5—source data 2).
-
Figure 5—source data 1
Beta diversity significance at one-week post-transfer.
- https://doi.org/10.7554/eLife.27014.019
-
Figure 5—source data 2
Regression between lifespan and genus abundance.
- https://doi.org/10.7554/eLife.27014.020
Figure 5—figure supplement 1
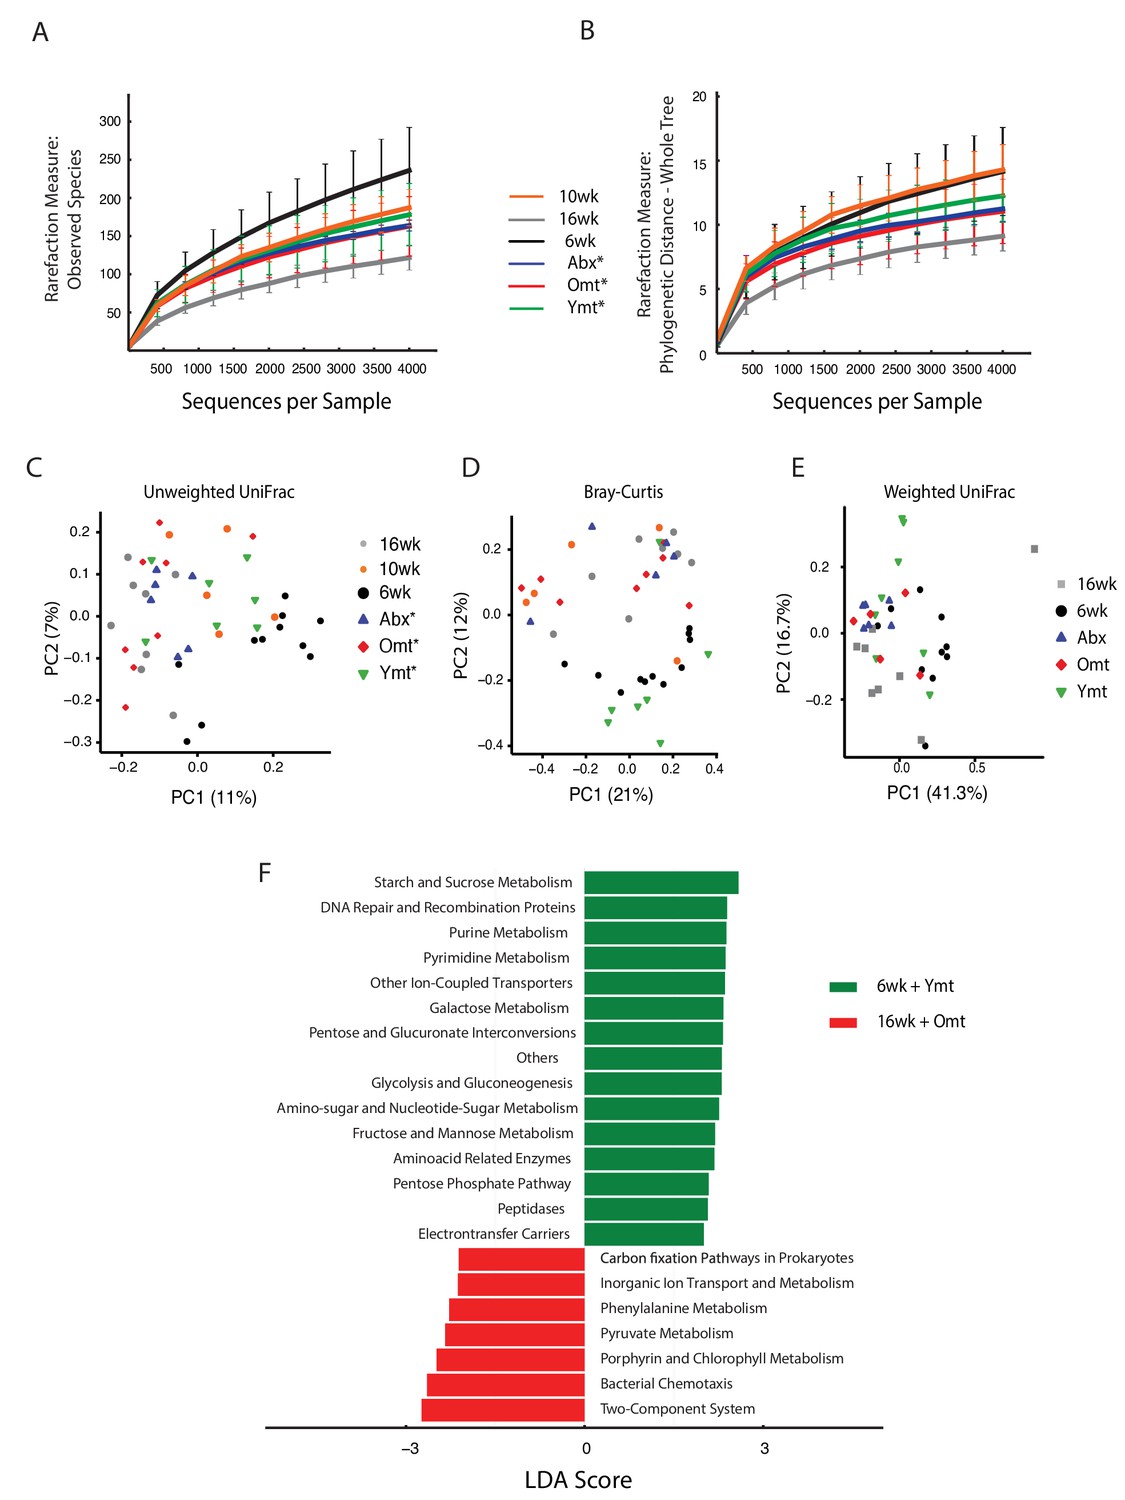
Effects of gut microbiota transfer on OTU composition and metagenome.
(A) Rarefaction curve for observed species alpha diversity at one week post-transfer shows no difference in transfer groups at one-week post transfer. (B) Rarefaction curve for phylogenetic distance (whole tree) alpha diversity at one week post-transfer shows no difference in transfer groups at one-week post transfer. (C) Unweighted UniFrac and Bray-Curtis (D) beta diversity distance at 1 week post transfer shows early segregation of young and Ymt away from old, Omt and Abx (measured one week post transfer), while 10wk has an intermediate position. The asterisk * indicates that measures were performed one-week post transfer. (E) Weighted UniFrac beta diversity at 16 weeks, that is, 7 weeks post transfer. (F) Predicted metagenome function in 6wk and Ymt (green) versus 16wk and Omt (red) groups (LEfSe).
Figure 6
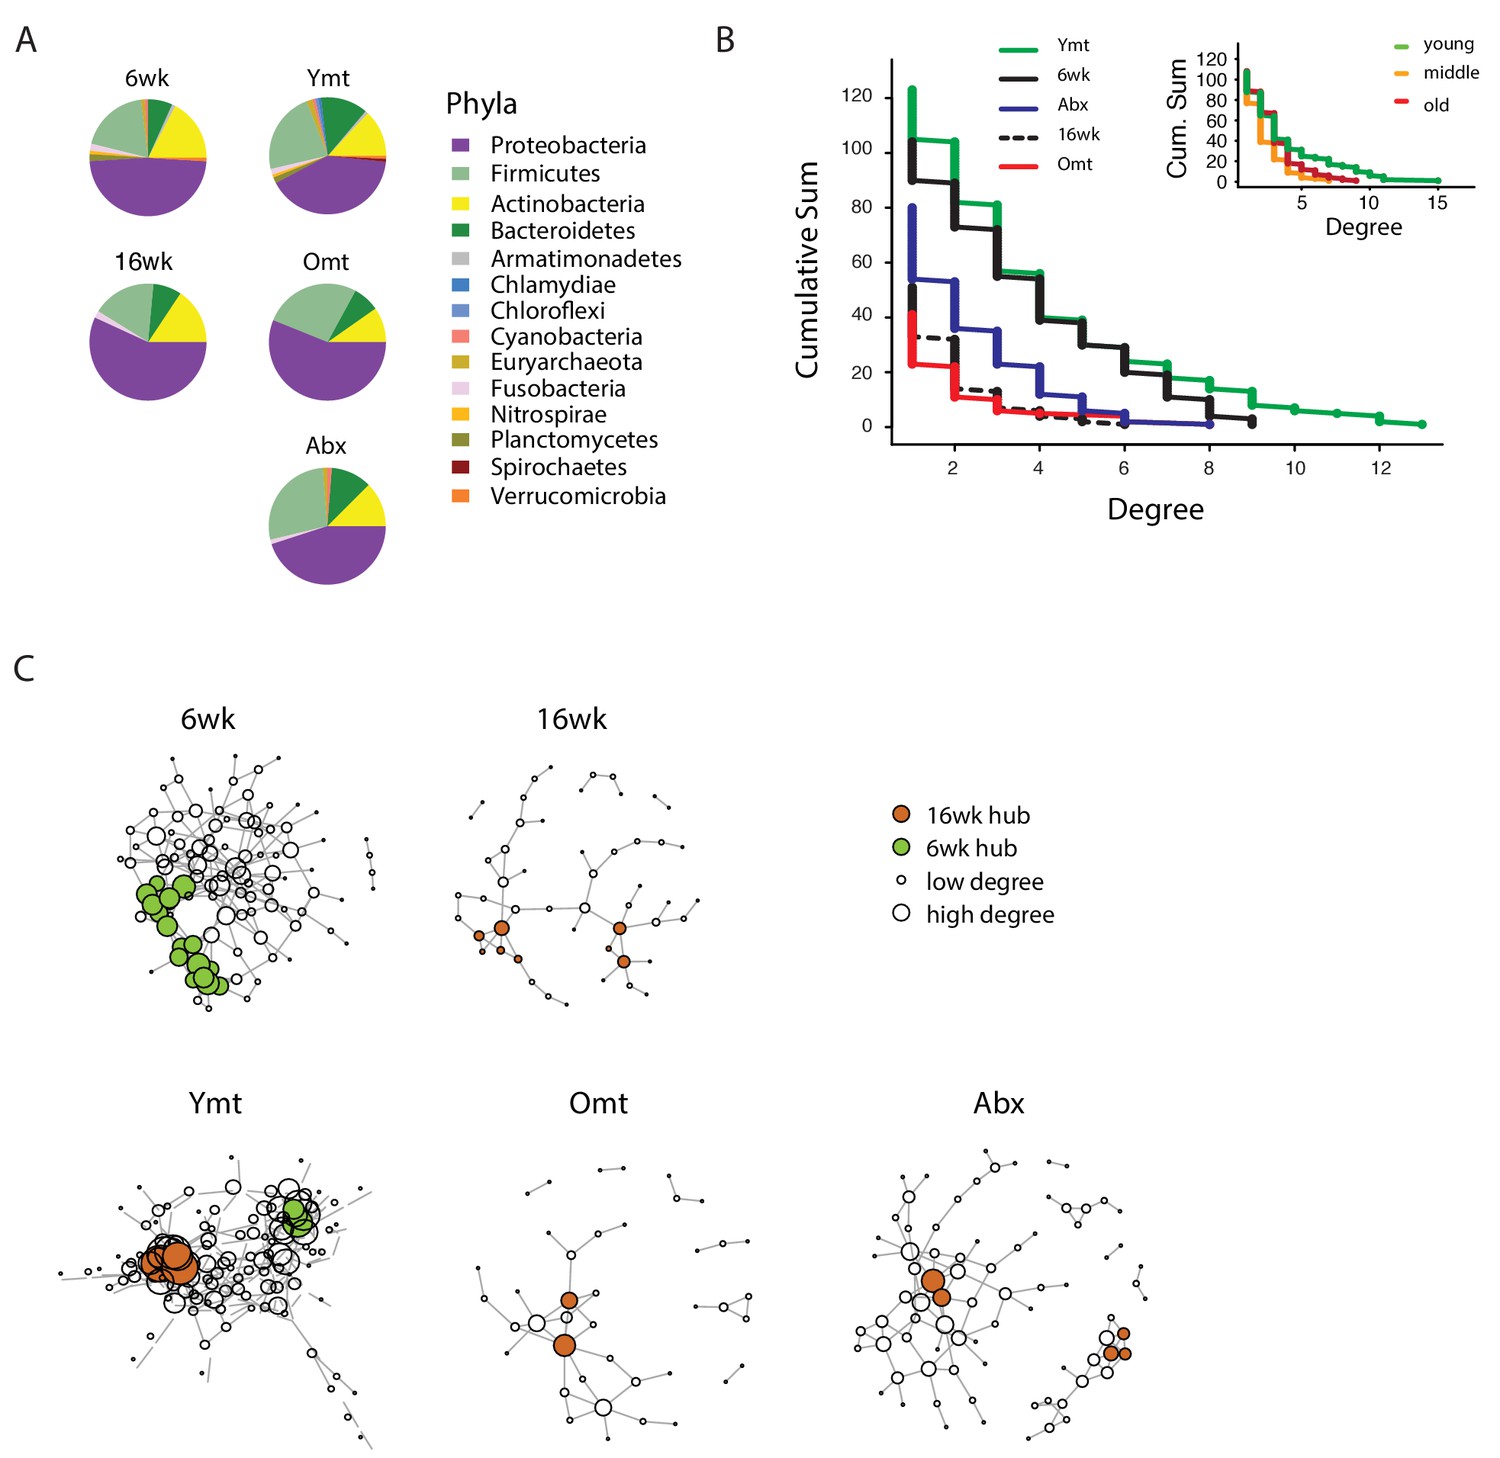
Bacterial co-occurrence connectivity.
(A) Phyla composition of the bacterial co-occurrence networks in experimental groups at 16 weeks (16wk, Ymt, Omt, Abx) and at 6 weeks (6wk) (Materials and methods). (B) Cumulative sum of degree distribution in co-occurrence networks of all analyzed TK experimental groups (black: 6wk; dashed black line: 16wk; green: Ymt; red: Omt; blue: Abx) and a mouse cohort from (Langille et al., 2014) (inset, green: young mice; orange: middle-age mice; red: old mice). X-axis shows the degree count and y-axis the cumulative sum of nodes with the corresponding degree. (C) Visualization of co-occurrence networks in Fruchtermann-Reingold layout of 6wk, 16wk, Ymt, Omt, and Abx. Circle size increases with degree count and circle color corresponds to 6wk hubs (green) or 16wk hubs (orange).
-
Figure 6—source data 1
Network hubs of OTU-based networks.
- https://doi.org/10.7554/eLife.27014.023
Figure 7 with 2 supplements

Transcriptional changes in host intestine after acute GM transfer.
(A) Cluster analysis of gut RNA-Seq from intestines from 6-week-old fish (6wk) and 16-week-old fish (16wk, Omt (red) and Ymt (green)). (B) Expression heatmap for the 80 top differentially expressed genes (DEGs) between Ymt and Omt fish (n = 4 for each group). *HAMP is the best protein blast hit in Danio rerio of the TK gene NFURG05812010005 (Figure 7—source data 1). (C) Gene Ontology (GO) analysis of the DEGs between Ymt and Omt fish. Enrichment values (bars) and the negative natural logarithm of p values (black dots) are shown. Endonuclease activity* indicates the following GO function: ‘Endonuclease activity, active either with ribo or deoxyribonucleic acids and producing 3’ phosphomonoesters’. (D) Relative gene expression levels compared to 6-week-old fish (6wk) of genes significantly differentially expressed between 16wk (gray), Omt (red) and 6wk (black), but not between Ymt (green) and 6wk. These genes are also significantly differentially expressed between 16wk and Ymt. (E) Based on the correlation matrix between OTU abundance and transcript levels in individual fish (Figure 7—source data 2), we identified the gene transcripts whose expression correlates more significantly with the hub bacteria shared between Ymt and 6wk fish (full analysis in Figure 7—figure supplement 2). Displayed are the top hits (chosen from an r-square value larger than 0.65 on both axes) shared between Psychrobacter and Exiguobacterium, which have the highest OTU-transcript correlation trend based on Figure 7—figure supplement 2. RPLs include RPL7A, RPL8, RPL12, RPL37, RPL14, MRPL35; while RPS include RPS3A, RPS7, RPS11, RPS24.
-
Figure 7—source data 1
Best hits from zebrafish pBlast on DEGs not annotated in the Valenzano et al., 2015 genome paper.
- https://doi.org/10.7554/eLife.27014.025
-
Figure 7—source data 2
Bacterial OTU to host transcripts correlation matrix.
- https://doi.org/10.7554/eLife.27014.026
Figure 7—figure supplement 1
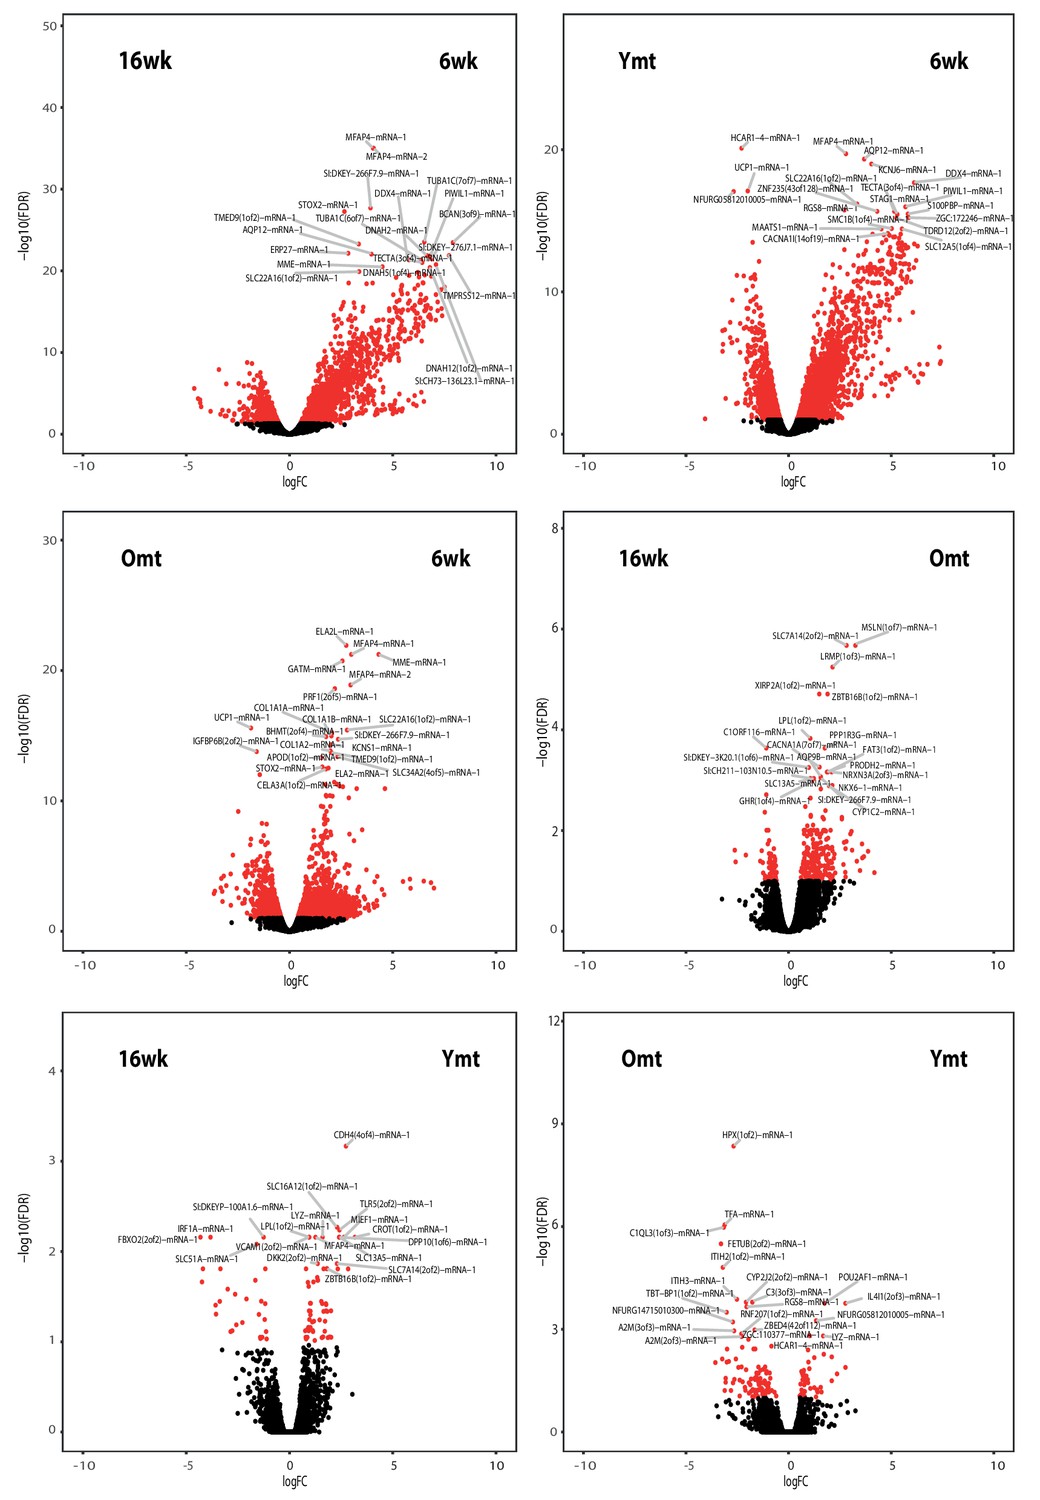
Volcano plots from the RNA-Seq data in the experimental groups.
Differentially expressed genes between all the possible group-to-group comparisons. Genes belonging to the 0.999 quantile of the FDR (y) axis are shown.
Figure 7—figure supplement 2
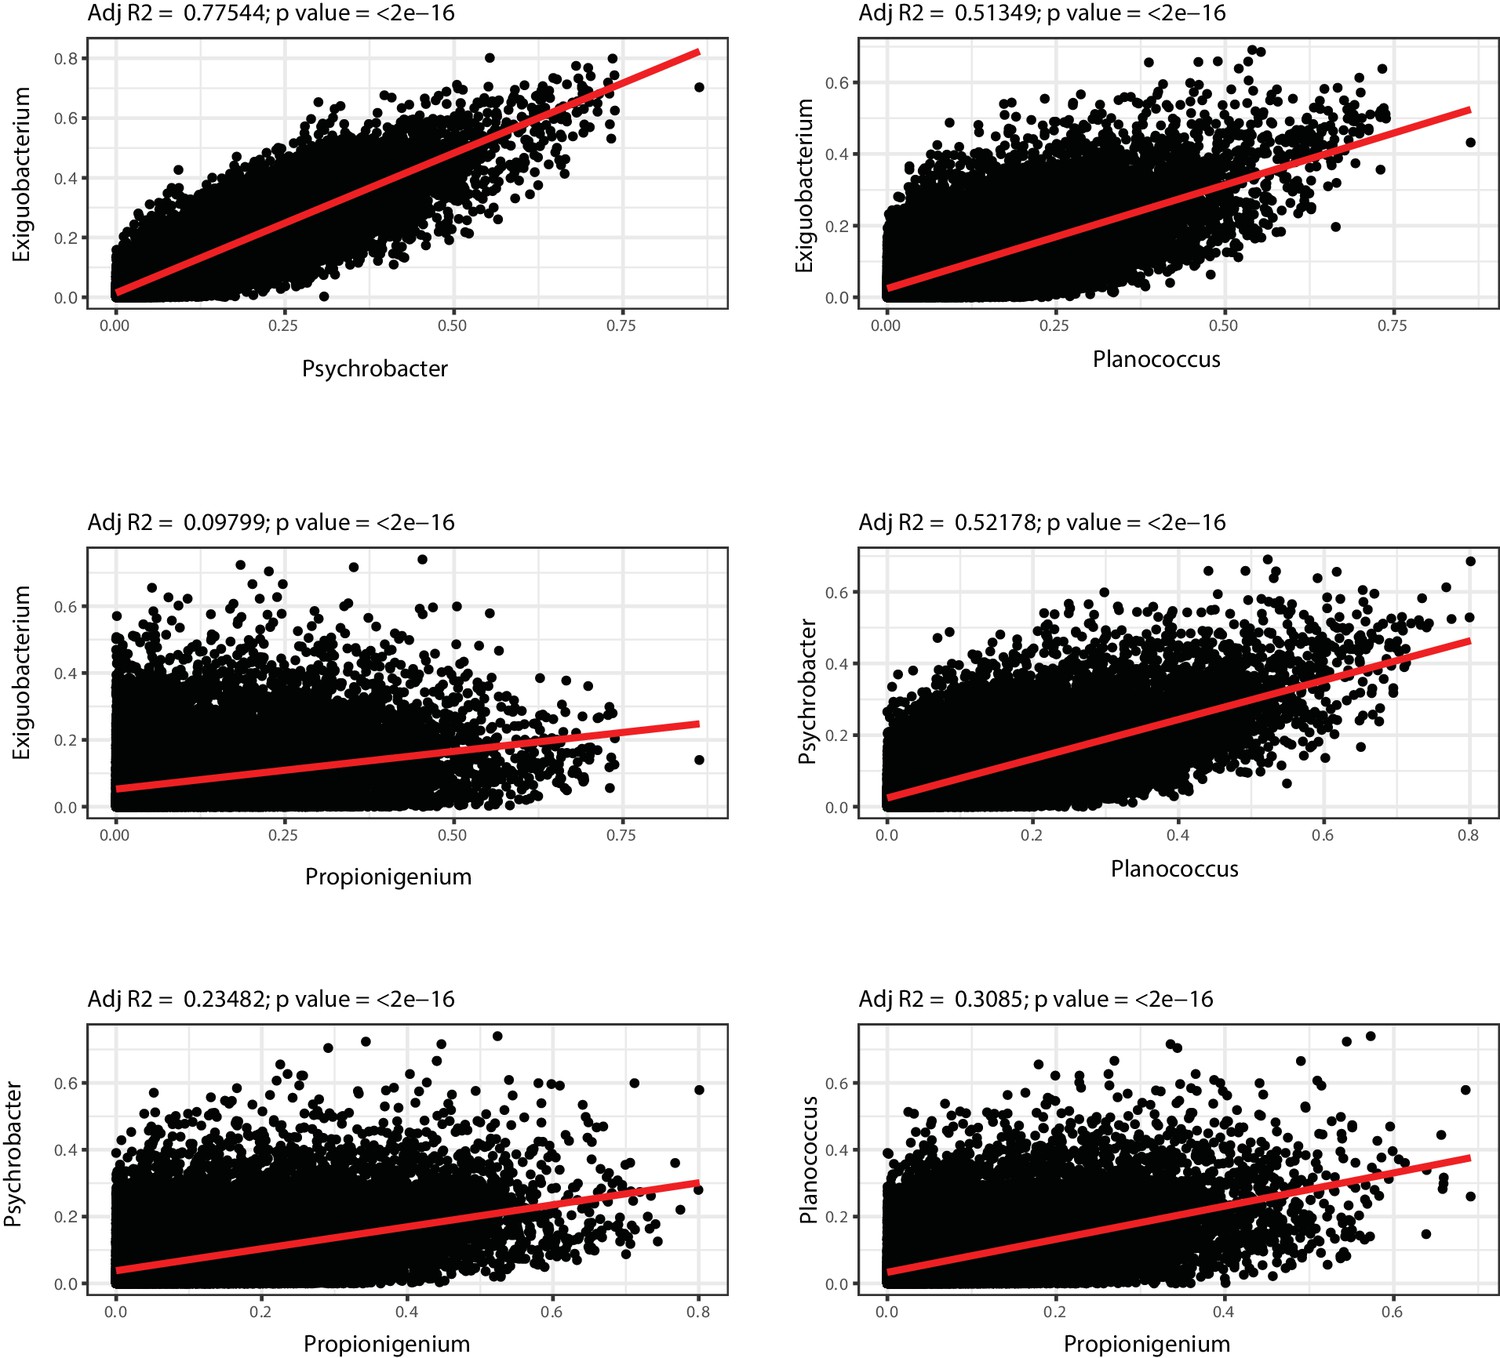
OTU-transcript correlations between hub-genera.
Each plot represents the r-square values for the correlation between the bacterial genus indicated in the respective axis and gut transcripts abundance (from Figure 7—source data 2). Displayed are comparisons of hub bacteria in Ymt shared with 6wk.
Author response image 1
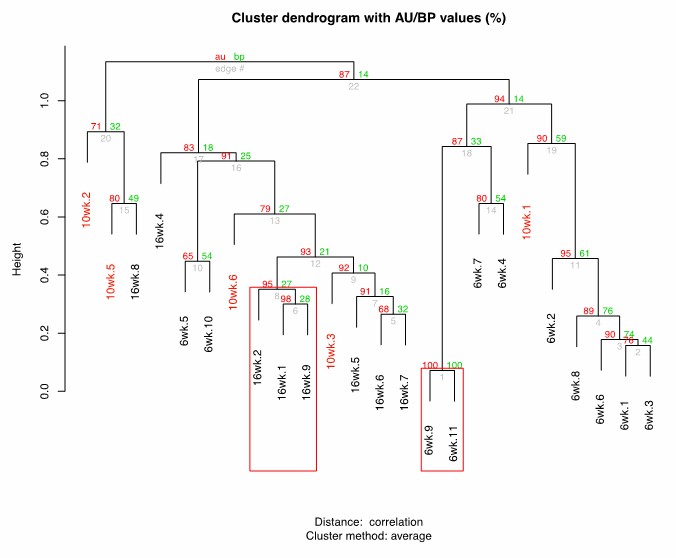
Cluster dendrogram between 6wk-10wk-16wk wild-type killifish gut microbiota.
https://doi.org/10.7554/eLife.27014.029
Author response image 2
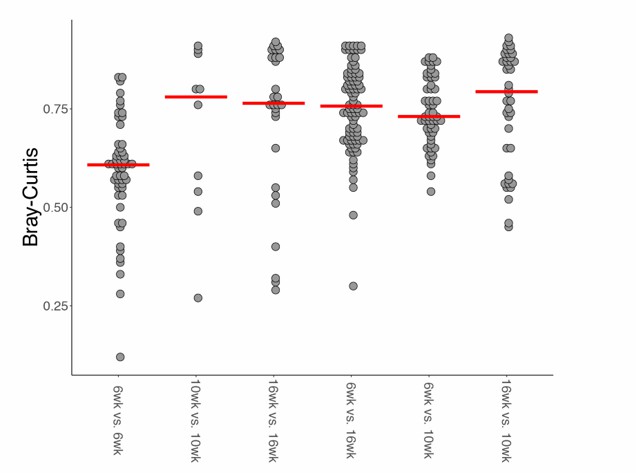
Bray-Curtis beta diversity among wild-type age-groups.
https://doi.org/10.7554/eLife.27014.030
Author response image 3
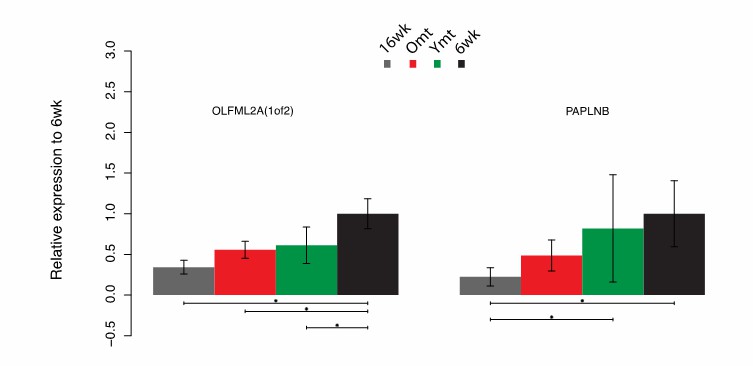
Differential gene expression in OLFM2A(1of2) and PAPLNB.
https://doi.org/10.7554/eLife.27014.031Tables
Author response table 1
Differential gene expression values for OLFML2A and PAPLNB.
| Comparison\gene | OLFML2A – FDR | OLFML2A – p value | PAPLNB – FDR | PAPLNB – p value |
| 6wk-16wk | 0.000 | 0.000 | 0.000 | 0.000 |
| 6wk-Omt | 0.026 | 0.002 | 0.167 | 0.027 |
| 6wk-Ymt | 0.053 | 0.008 | 0.775 | 0.544 |
| Ymt-16wk | 0.216 | 0.004 | 0.051 | 0.000 |
| Ymt-Omt | 1.000 | 0.650 | 1.000 | 0.110 |
| Omt-16wk | 0.256 | 0.014 | 0.367 | 0.032 |
Download links
A two-part list of links to download the article, or parts of the article, in various formats.
Downloads (link to download the article as PDF)
Open citations (links to open the citations from this article in various online reference manager services)
Cite this article (links to download the citations from this article in formats compatible with various reference manager tools)
Regulation of life span by the gut microbiota in the short-lived African turquoise killifish
eLife 6:e27014.
https://doi.org/10.7554/eLife.27014


