Science Forum: The Human Cell Atlas
- Broad Institute of MIT and Harvard, United States
- Massachusetts Institute of Technology, United States
- Howard Hughes Medical Institute, United States
- Wellcome Trust Sanger Institute, Wellcome Genome Campus, United Kingdom
- Wellcome Genome Campus, United Kingdom
- University of Cambridge, United Kingdom
- Harvard Medical School, United States
- Weizmann Institute of Science, Israel
- University of Zürich, Switzerland
- RIKEN Center for Life Science Technologies, Japan
- Hubrecht Institute, Princess Maxima Center for Pediatric Oncology and University Medical Center Utrecht, The Netherlands
- Swiss Federal Institute of Technology (EPFL), Switzerland
- Perelman School of Medicine, University of Pennsylvania, United States
- German Cancer Research Center (DKFZ), Germany
- Heidelberg University, Germany
- Ludwig Maximilian University Munich, Germany
- Takara Bio United States, Inc., United States
- John Radcliffe Hospital, University of Oxford, United Kingdom
- Massachusetts General Hospital Cancer Center, United States
- Newcastle University, United Kingdom
- Stanford University School of Medicine, United States
- University of Oxford, United Kingdom
- John Radcliffe Hospital, United Kingdom
- University of California, San Francisco, United States
- Allen Institute for Brain Science, United States
- Karolinska Institutet, Sweden
- KTH Royal Institute of Technology, Sweden
- Stanford University, United States
- National Institute of Biomedical Genomics, India
- Icahn School of Medicine at Mount Sinai, United States
- University of Cape Town, South Africa
- University of Groningen, University Medical Center Groningen, The Netherlands
- Radboud University Medical Center, The Netherlands
- Sloan Kettering Institute, United States
- University of Edinburgh, United Kingdom
- Chan Zuckerberg Biohub, United States
- The Babraham Institute, United Kingdom
- Harvard University, United States
- New York University, United States
- The Netherlands Cancer Institute, The Netherlands
- Ragon Institute of MGH, MIT and Harvard, United States
- University of Texas, United States
- German Research Center for Environmental Health, Helmholtz Center Munich, Germany
- Technical University of Munich, Germany
- Danish Technical University, Denmark
- Hubrecht Institute and University Medical Center Utrecht, The Netherlands
- University of California, Berkeley, United States
- King's College London, United Kingdom
- California Institute of Technology, United States
- Massachusetts General Hospital, United States
Figures
Figure 1
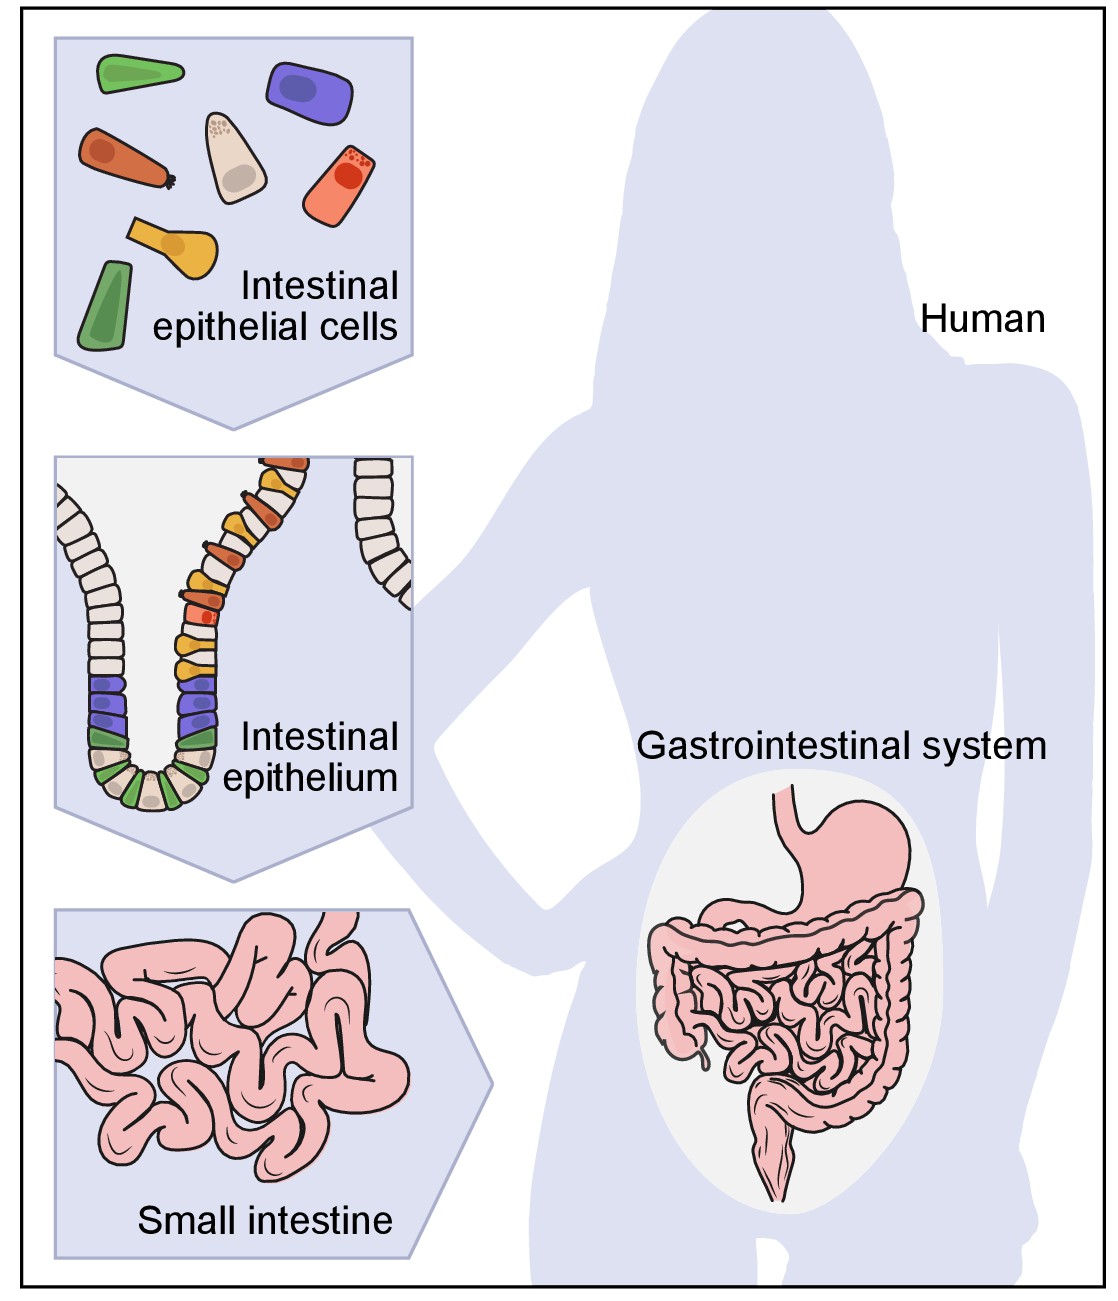
A hierarchical view of human anatomy.
A graphical depiction of the anatomical hierarchy from organs (such as the gut), to tissues (such as the epithelium in the crypt in the small intestine), to their constituent cells (such as epithelial, immune, stromal and neural cells).
Figure 2

Anatomy: cell types and tissue structure.
The first three plots show single cells (dots) embedded in low-dimensional space based on similarities between their RNA-expression profiles (A, C) or protein-expression profiles (B), using either t-stochastic neighborhood embedding (A,B) or circular projection (C) for dimensionality reduction and embedding. (A) Bi-polar neurons from the mouse retina. (B) Human bone marrow immune cells. (C) Immune cells from the mouse spleen. (D) Histology. Projection of single-cell data onto tissue structures: image shows the mapping of individual cells onto locations in the marine annelid brain, based on the correspondence (color bar) between their single-cell expression profiles and independent FISH assays for a set of landmark transcripts.
© 2016 Elsevier Inc. Figure 2A reprinted from Shekhar et al., 2016 with permission.
© 2015 Elsevier Inc. Figure 2B reprinted from Levine et al., 2015 with permission.
© 2014 AAAS. Figure 2C reprinted from Jaitin et al., 2014 with permission.
© 2015 Macmillan Publishers Limited. Figure 2D adapted from Achim et al., 2015 with permission.
Figure 3
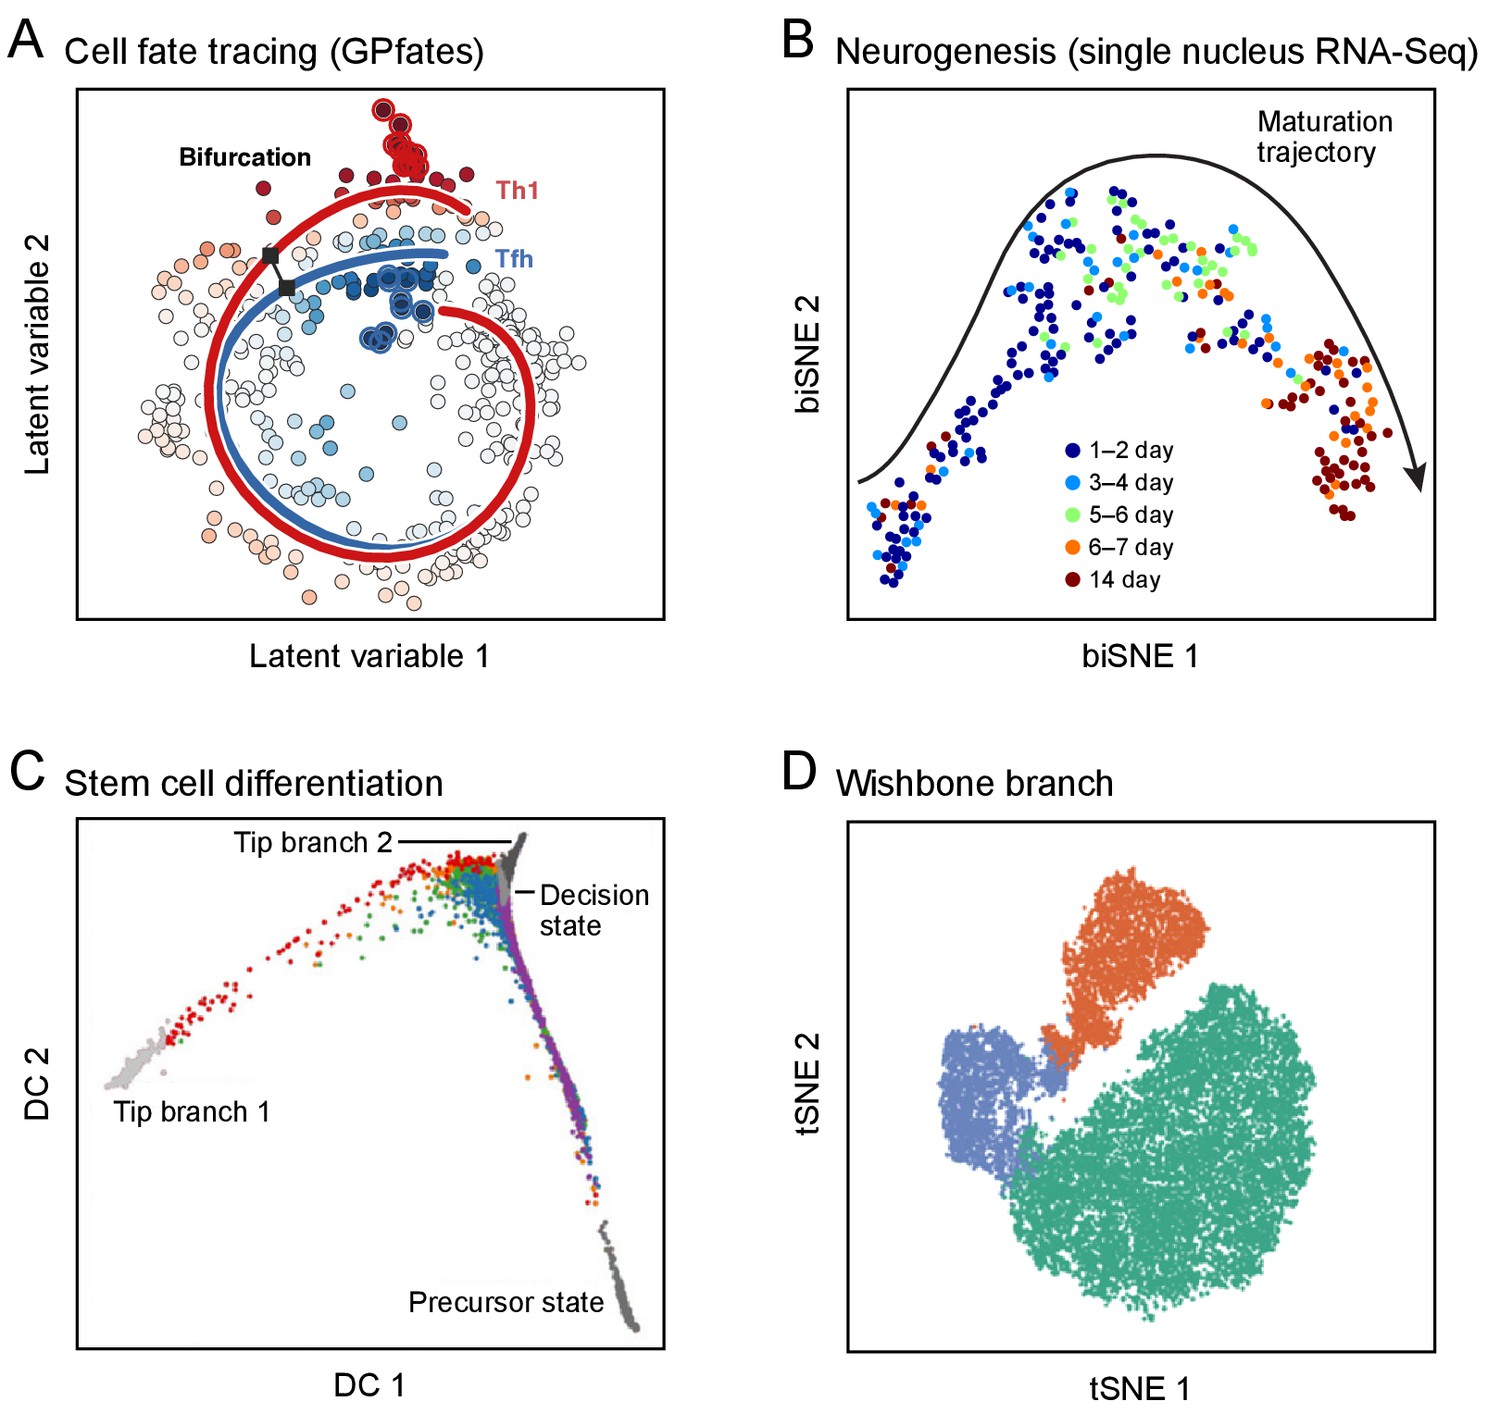
Developmental trajectories.
Each plot shows single cells (dots; colored by trajectory assignment, sampled time point, or developmental stage) embedded in low-dimensional space based on their RNA (A-C) or protein (D) profiles, using different methods for dimensionality reduction and embedding: Gaussian process patent variable model (A); t-stochastic neighborhood embedding (B, D); diffusion maps (C). Computational methods then identify trajectories of pseudo-temporal progression in each case. (A) Myoblast differentiation in vitro. (B) Neurogenesis in the mouse brain dentate gyrus. (C) Embryonic stem cell differentiation in vitro. (D) Early hematopoiesis.
© 2017 AAAS. Figure 3A reprinted from Lönnberg et al., 2017 with permission.
© 2016 AAAS. Figure 3B reprinted from Habib et al., 2016a with permission.
© 2016 Macmillan Publishers Limited. Figure 3C adapted from Haghverdi et al., 2016 with permission.
© 2016 Macmillan Publishers Limited. Figure 3D adapted from Setty et al., 2016 with permission.
Figure 4
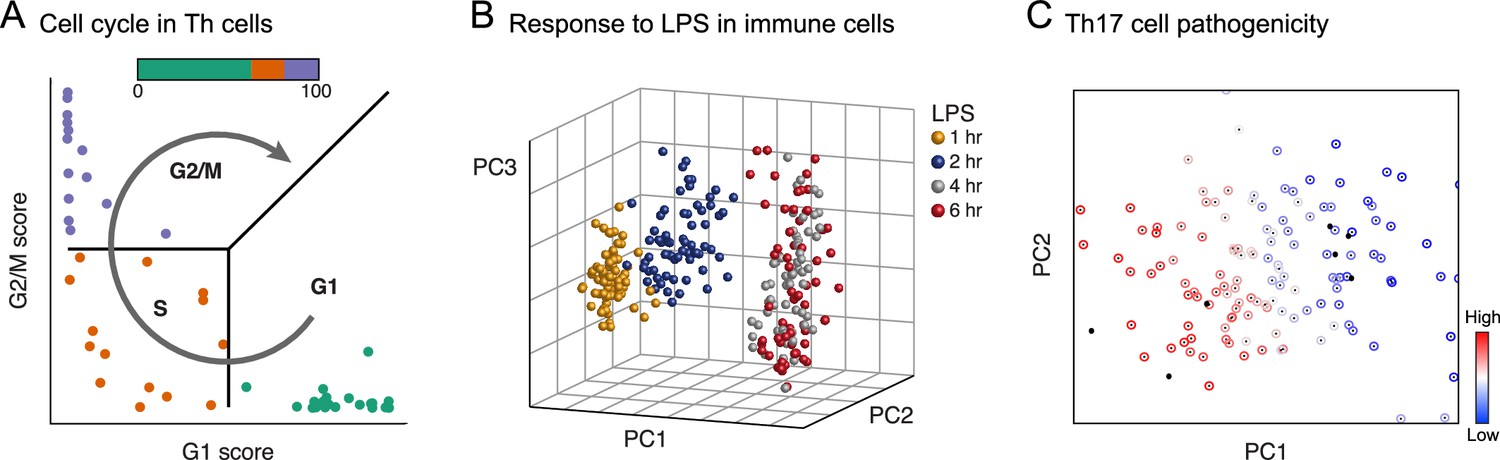
Physiology.
Each plot shows single cells (dots) embedded in low-dimensional space on the basis of their RNA profile, based on predefined gene signatures (A) or PCA (B, C), highlighting distinct dynamic processes. (A) The cell cycle in mouse hematopoietic stem and progenitor cells; adapted under terms of CC BY 4.0 from Scialdone et al. (2015). (B) Response to lipopolysaccharide (LPS) in mouse immune dendritic cells. (C) Variation in the extent of pathogenicity in mouse Th17 cells.
© 2014 Macmillan Publishers Limited. Figure 4B adapted from Shalek et al., 2014 with permission.
© 2015 Elsevier Inc. Figure 4C reprinted from Gaublomme et al., 2015 with permission.
Download links
A two-part list of links to download the article, or parts of the article, in various formats.
Downloads (link to download the article as PDF)
Open citations (links to open the citations from this article in various online reference manager services)
Cite this article (links to download the citations from this article in formats compatible with various reference manager tools)
Science Forum: The Human Cell Atlas
eLife 6:e27041.
https://doi.org/10.7554/eLife.27041


