Maintained avalanche dynamics during task-induced changes of neuronal activity in nonhuman primates
- National Institute of Mental Health, United States
Figures
Figure 1

Neuronal avalanches in prefrontal cortex during a cognitive task.
(A) Firing rate changes for putative single units demonstrate PFC region recorded by the array is involved in task performance. Unit raster (top) separated into right (green) and left (black) trials with corresponding average firing rates (bottom). Cue presentation elicits distinct rate changes for units 1 and 2 during left and right trials, but not for unit 3. Colored area (orange/purple) indicates periods that differ significantly (high/low) from baseline (see Materials and methods). Vertical solid lines: Cue on- and off-set. (B) The population of PFC units does not show a task-related change in rate (top) or Fano Factor (bottom). Top: mean-matched/original rate in solid/broken lines; 38/48% survived matching for left/right trials. Bottom: mean-matched spikes. Shaded areas: 95% confidence interval from linear regression per time window. (C) Distinct changes in the LFP for right (green) and left (black) trials during the task. Grey/light green: trial averages for each electrode. Black/dark green: average over electrodes. (D) The negative LFP (nLFP; −2SD threshold; dots) allows for distinguishing right (green) from left (black) trials. Top: Example nLFP raster (single electrode) separated into right (green) and left (black) trials. Bottom: Corresponding time course in average nLFP rate. Colored areas (orange/purple) indicate significant change (high/low) from baseline. (E) Distinct change in nLFP rate separates a baseline (BASE; 400 ms) period from an early (EARLY; 400 ms) and late (LATE; 400 ms) epoch after cue onset (vertical lines). (F) nLFPs on the array when analyzed for full left and right trial periods show avalanche organization. Power law in size probability densities for nLFP clusters (solid; fixed Δt). Arrow: Cut-off at number of electrodes on the array. Broken lines: Corresponding trial-shuffle controls. Shaded areas: Corresponding 95% confidence interval based on bootstrapping. Dotted line: Visual guide for exponent of −1.5.
Figure 2

Adaptive binning tracks avalanche organization during behaviorally induced transient activity changes in PFC.
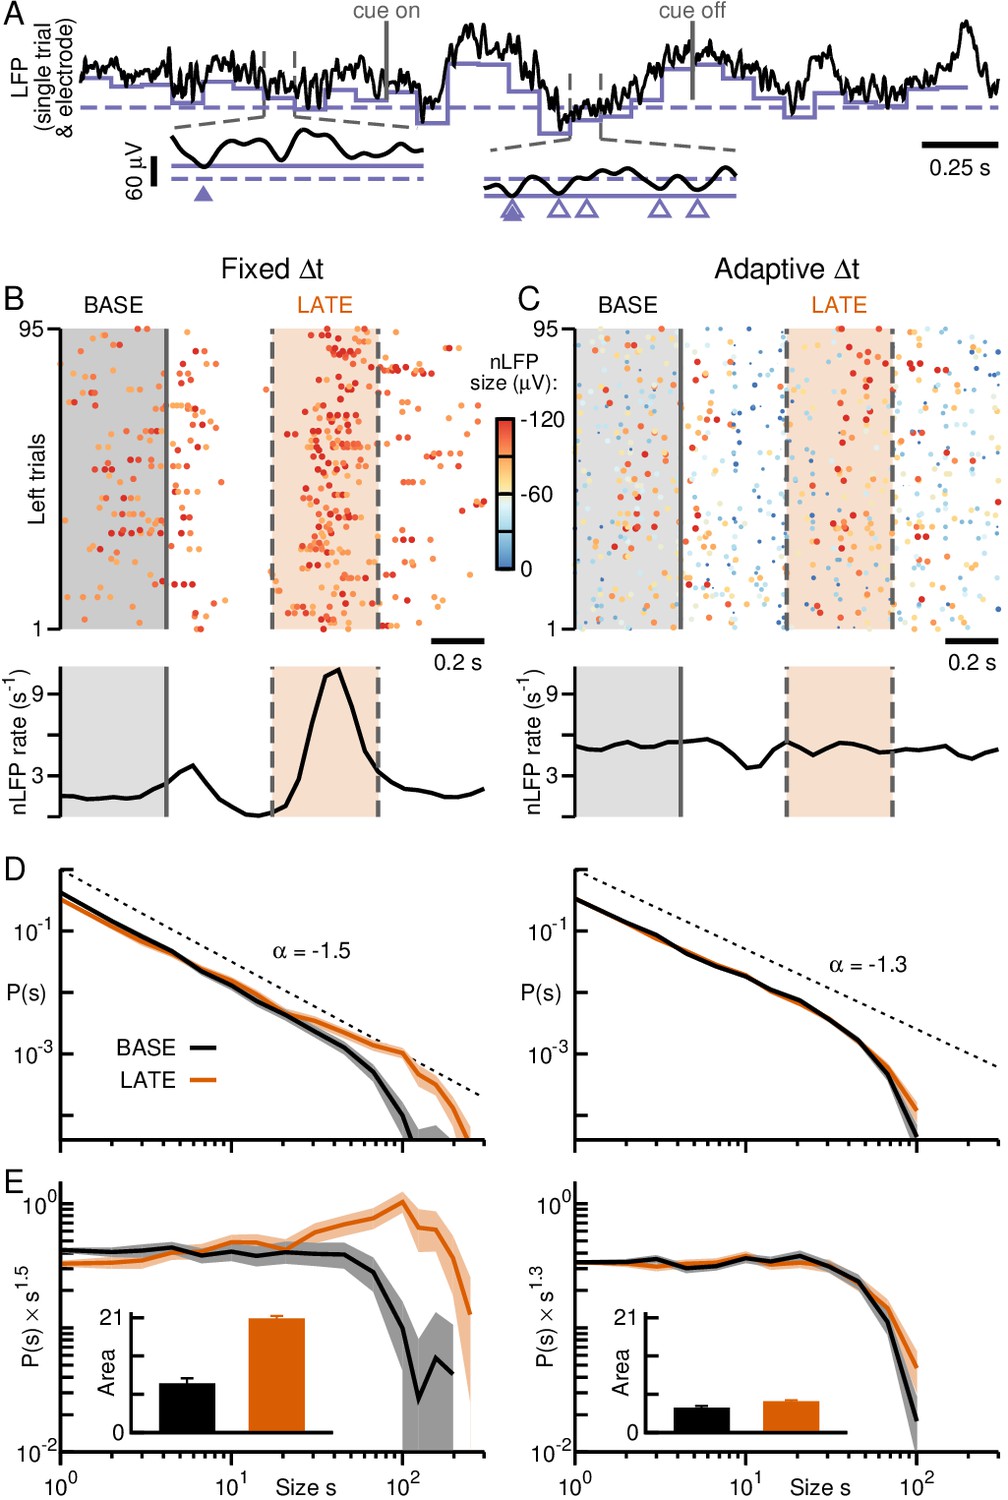
(A) Fixed binning defines clusters (grey area) by successive time bins of constant duration Δt with at least one nLFP (diamonds). The temporal resolution Δt does not change for trials or epochs. Size s is defined as the number of nLFPs per cluster. (B) Large avalanches (red) dominate for left trials during LATE. Avalanche raster with size coded by color and dot size at fixed Δt for left (top) and right (bottom) trials for 2 consecutive recording days. (C) Significant increases (orange) and decreases (purple) in average time course for avalanche rate (top) and size (bottom) for left (black) and right (green) trials. (D) Adaptive binning links Δt for each trial i to the average nLFP rate during epochs resulting in three different temporal resolutions for cluster definition: (cp. A). (E) Same as in B, but for adaptive binning. Note sparseness of very large avalanches (cp. B). (F) Adaptive binning increases avalanche rate significantly during LATE while reducing avalanche size (cp. C).
Figure 3
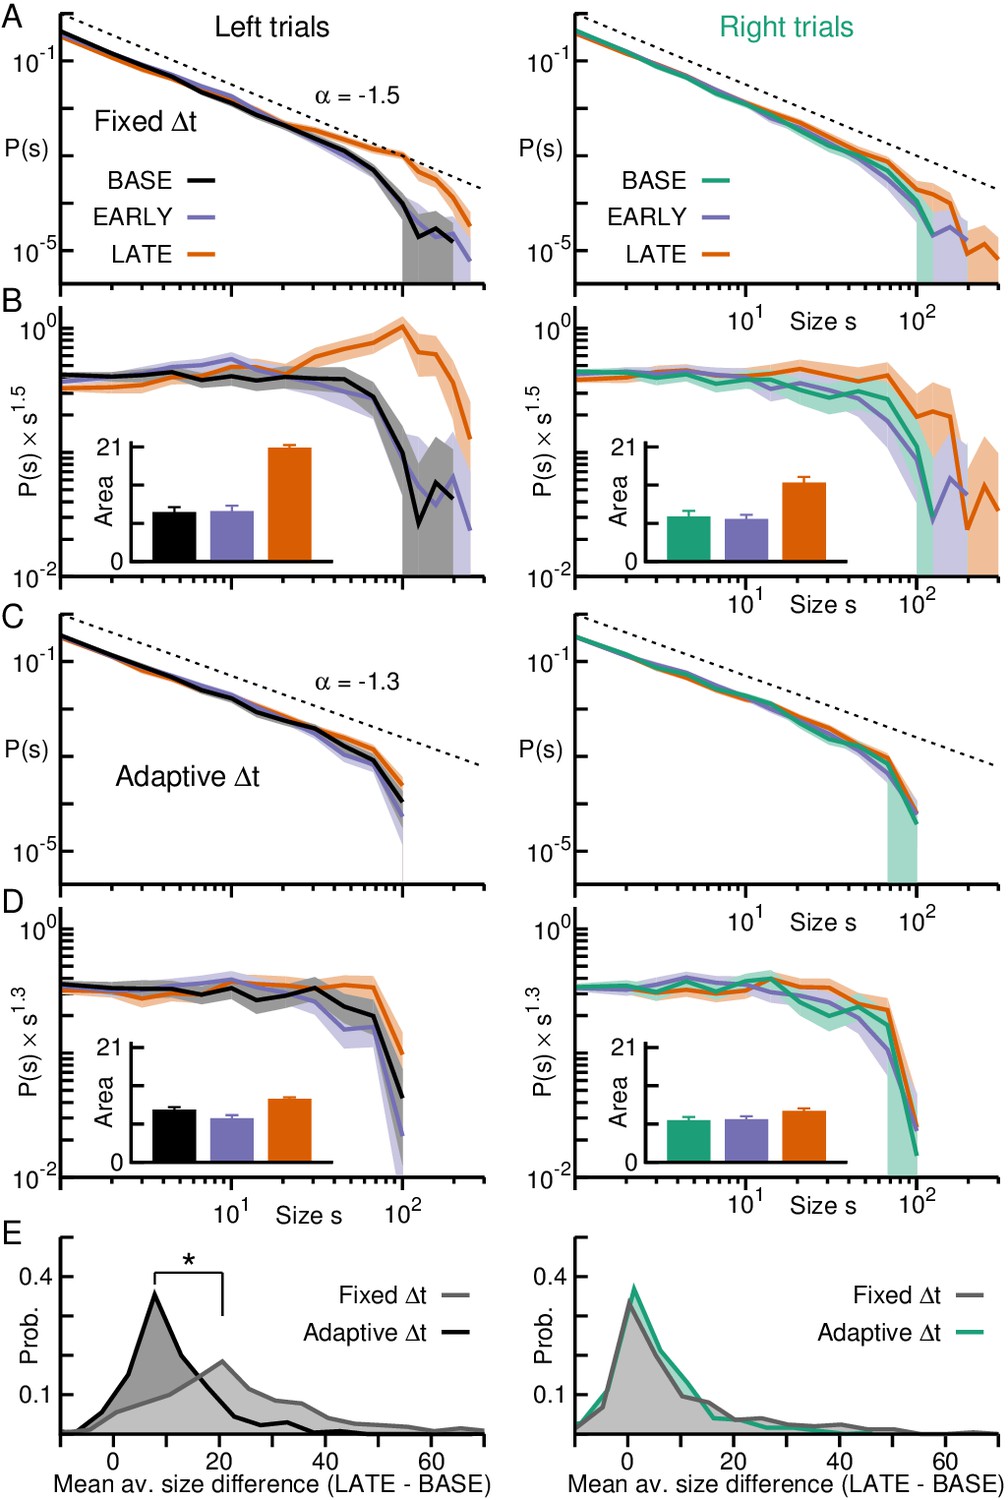
Adaptive binning demonstrates maintained power law organization during transient activity epochs in prefrontal cortex.
(A) Avalanche size probability densities for LATE (orange) significantly deviate from the power law observed during BASE (black/green) and EARLY (purple) for left (left panel), but not right trials (right panel). Area: 95% confidence interval. (B) Size distributions normalized by a power law with exponent −1.5 reveal good agreement with theory (horizontal curve with a sharp cut-off), except during LATE for left trials, where a large deviation can be observed. Inset: Area under the curve of the normalized distributions for avalanches of size > 20 quantify differences between epochs. Error bars: SD from 1000 bootstraps. (C) Same as in A, but for adaptive binning, which collapses size distributions for BASE, EARLY and LATE. (D) Adaptive binning leads to a decrease in the area difference between LATE and the other epochs. (E) Distributions of the difference between the mean avalanche size of LATE and BASE for each trial (positive values indicate avalanches in LATE were larger than those in BASE for a given trial) for fixed (grey) and adaptive binning (black/green). Significant differences between distributions are marked by an asterisk (Kolmogorov-Smirnov test; ). For left trials, LATE is significantly biased toward smaller avalanches for adaptive binning compared to fixed binning.
Figure 4
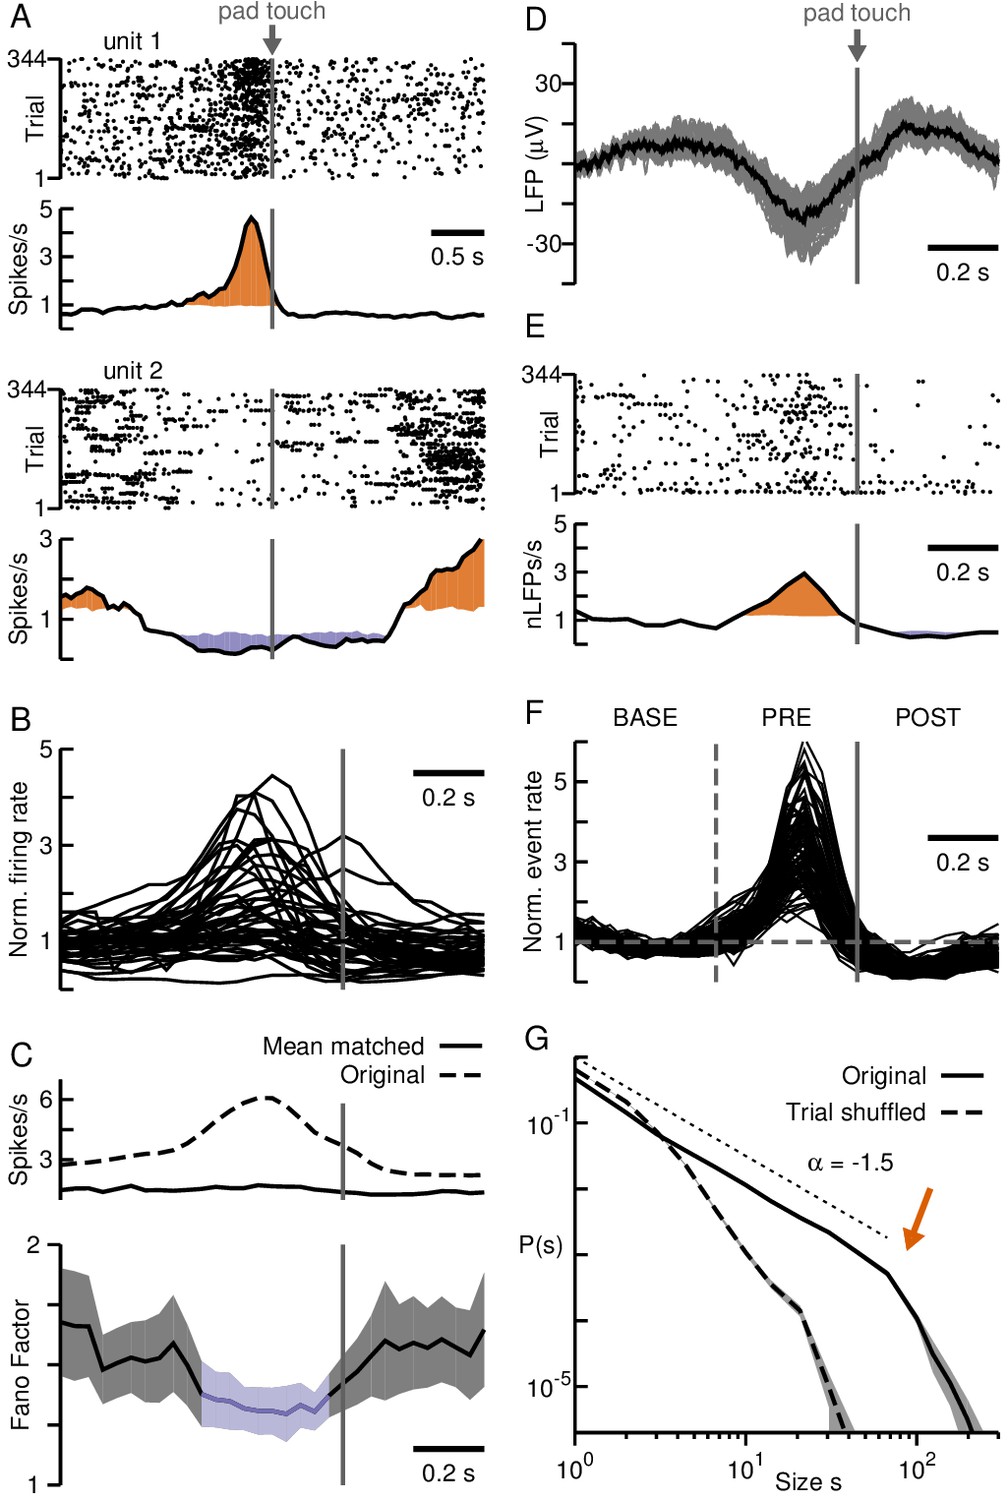
Neuronal avalanches in premotor cortex during self-initiated motor task.
(A) Change in firing rate for two putative single units demonstrate PM region recorded by the array is involved in task performance. Unit one increased whereas unit two decreased firing around the time of self-initiated touch (grey arrow). Unit raster (top) trial-aligned to touch (grey line, arrow) and corresponding average firing rate time course (bottom). Orange/purple area indicate significant increase/decrease from baseline. (B) Most units show transient excitation before touching. Average firing rate change for all putative single units normalized to baseline. (C) Average (top, broken) and mean-matched (top, solid) firing rate across all units and trials. Fano Factor (bottom) decreases significantly (purple) before touching (70% of data survived mean-matching). Shaded area: 95% confidence interval. (D) Negative deflection in the LFP, averaged over trials, prior to touch. Grey: trial average for individual electrodes. Black: average over electrodes. (E) Single electrode nLFP raster and corresponding average nLFP rate. Orange/purple areas indicate significantly high/low periods from baseline. (F) Change in nLFP rate defines baseline (BASE), pre-touch (PRE) and post-touch (POST) epochs (vertical lines). (G) nLFPs on the array when analyzed for full trial periods show avalanche organization. Power law in size probability densities for nLFP clusters (solid; fixed Δt). Arrow: Cut-off at number of electrodes on the array. Broken lines: Corresponding trial-shuffle control. Shaded areas: Corresponding 95% confidence interval based on bootstrapping. Dotted line: Visual guide for exponent of −1.5.
Figure 5
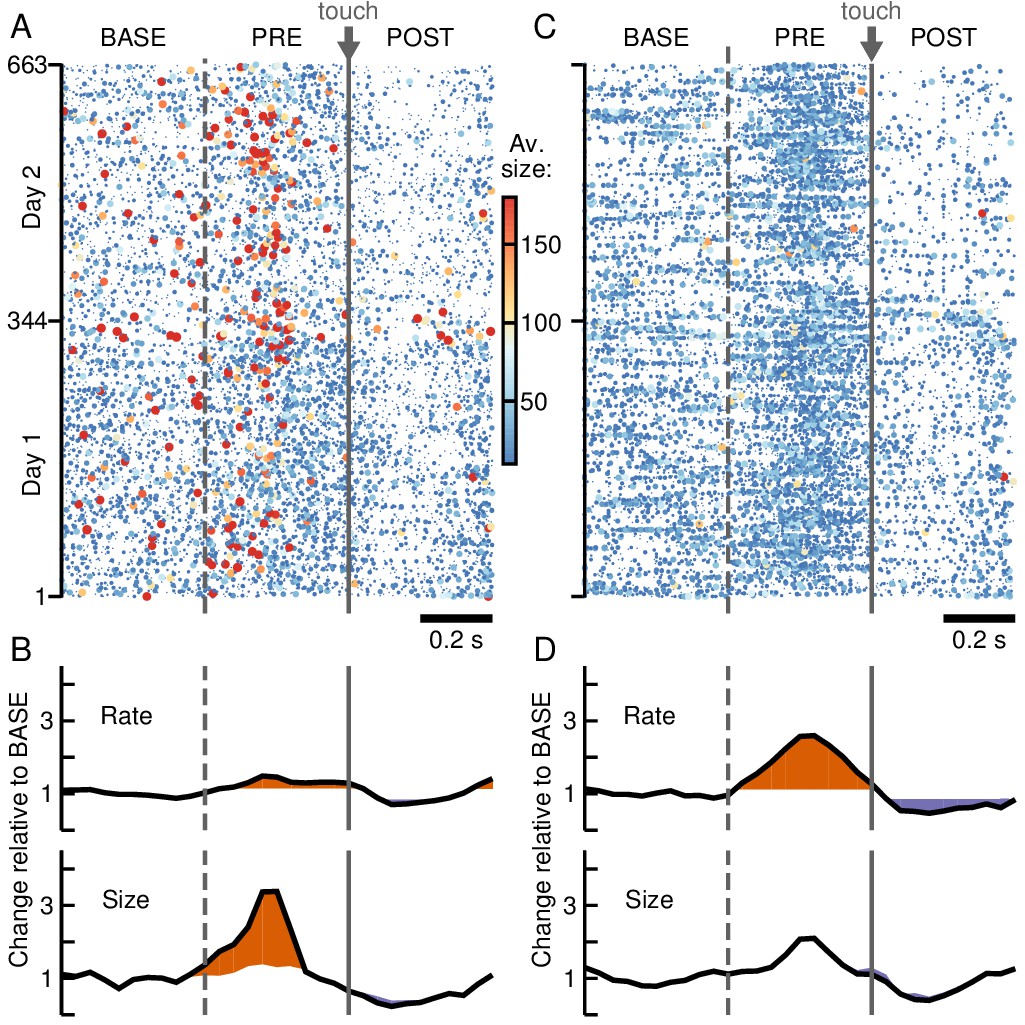
Adaptive binning tracks avalanche organization during self-initiated motor task in premotor cortex.
(A) Avalanche raster with size coded by color and dot size for fixed Δt. Large avalanches (red) emerge during PRE and fewer avalanches are found during POST. (B) Significant increases (orange) and decreases (purple) in average time course for avalanche rate (top) and size (bottom) with respect to BASE. (C) Same as in A, but for adaptive binning. Note absence of very large avalanches during PRE. (D) Adaptive binning reduces avalanche size while increasing avalanche rate (cp. B) during PRE.
Figure 6
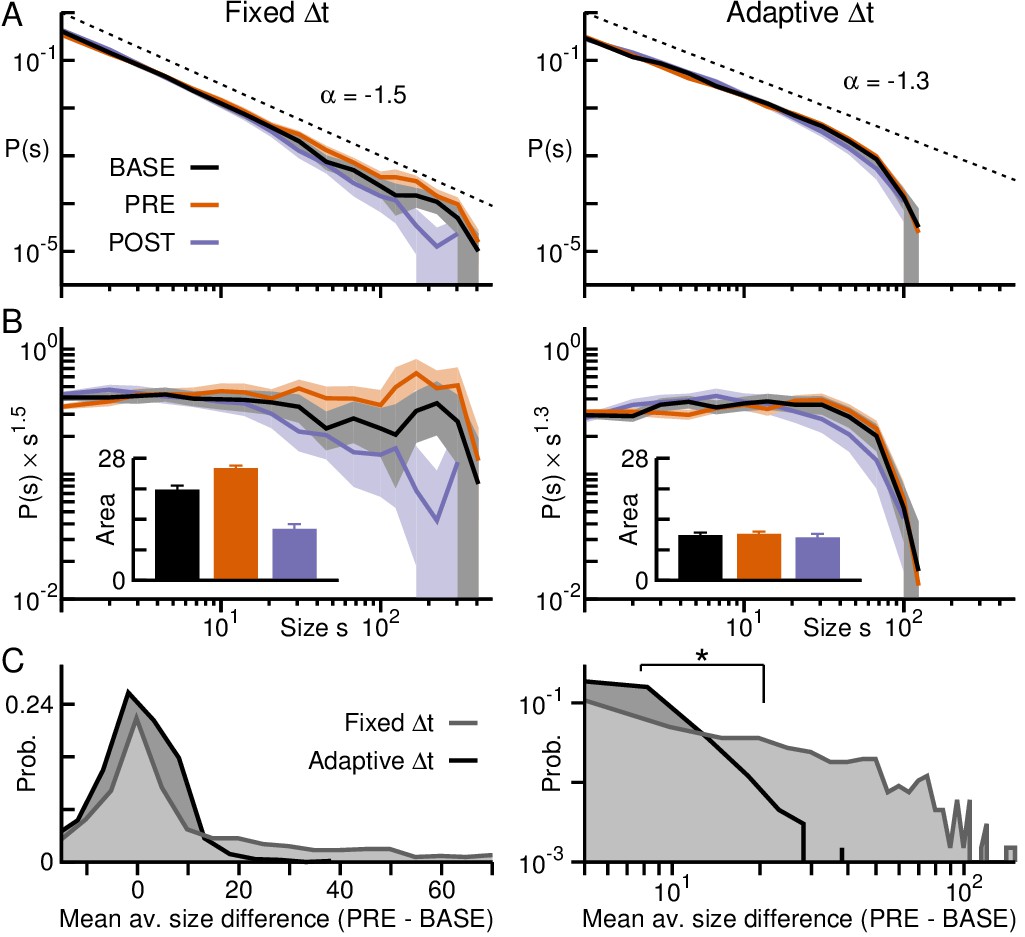
Adaptive binning demonstrates maintained power law organization during transient activity epochs in premotor cortex.
(A) Avalanche size distributions for PRE and POST deviated from the power law observed during BASE when fixed binning was employed (left), but collapse together after adaptive binning (right). Area: 95% confidence interval. (B) Size distributions normalized by a power law (exponent −1.5 for fixed and −1.3 for adaptive binning). Inset: Area under the curve for the normalized distributions, considering avalanches of size > 20, emphasize the bias toward larger (smaller) avalanches during PRE (POST), in line with higher (lower) activity rates observed during that epoch compared to BASE for fixed binning (left). The bias is significantly decreased after adaptive binning (right). Error bars: SD from 1000 bootstraps. (C) Distributions of the difference between the mean avalanche size of PRE and BASE during each trial for fixed (grey) and adaptive binning (black). Large differences occur much more often for fixed binning (left: linear-linear plot; right: log-log plot). Significant differences between distributions are marked by an asterisk (Kolmogorov-Smirnov test; ).
Figure 7
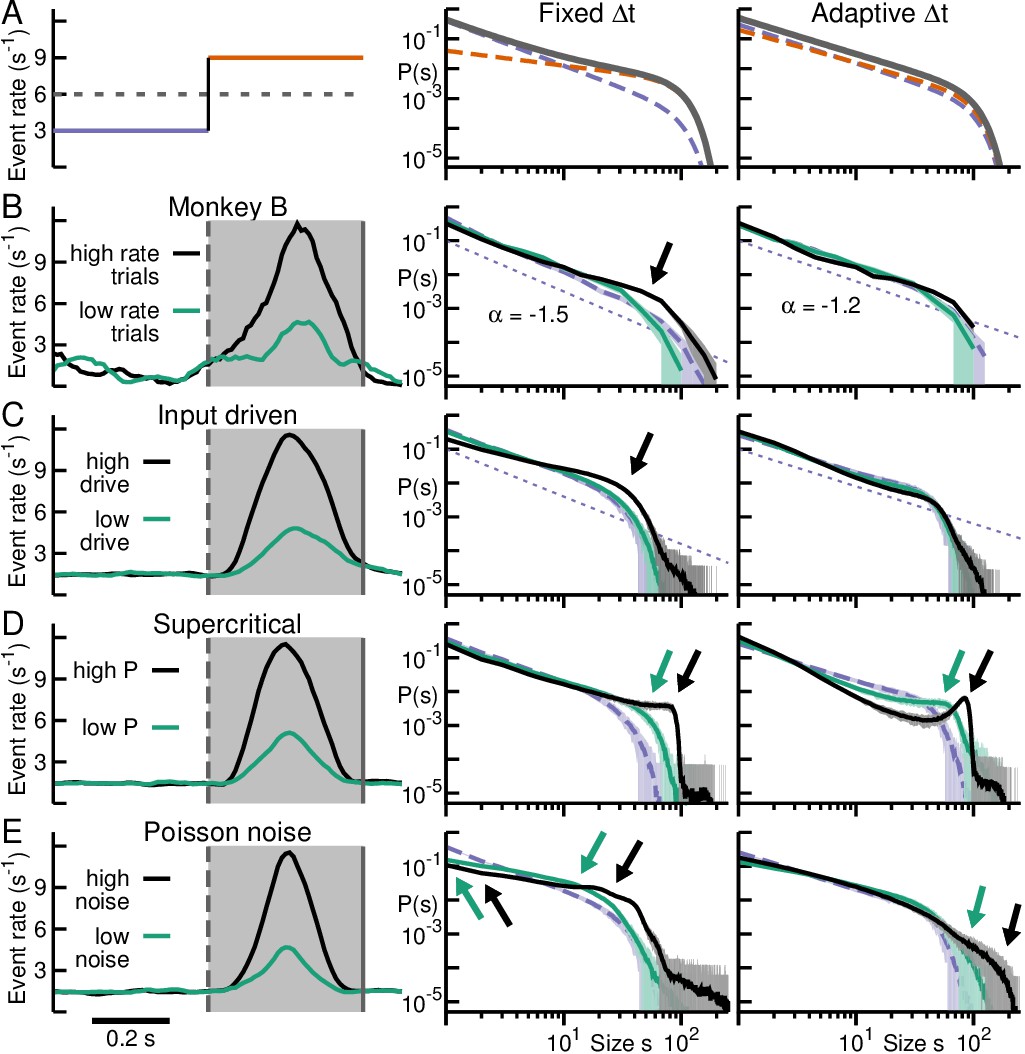
Adaptive binning recovers the power law in the face of consistent rate changes when dynamics remain critical.
(A) Schematic impact of avalanche analysis from non-stationary event rates. Left: A low event rate period (purple) followed by a high event rate period (orange) results in an intermediate Δt (fixed binning) based on the mean event rate (broken line). Middle: The superposition of two power laws with different slopes from their corresponding rate regime (broken lines) results in an avalanche size distribution (grey) that deviates from a power law, with a characteristic up-ward bend at the cross-over point. Right: Adaptive binning steepens/reduces the slope for the high/low rate period respectively resulting in a distribution collapse at an intermediate slope. (B) Left: Average nLFP rate for monkey B with trials separated into high (black) and low (green) nLFP rate during PRE (shaded area). Middle: Corresponding distributions obtained with fixed binning increasingly deviate with rate (arrow) from baseline (broken, purple). Right: Adaptive binning collapses all distributions. (C) Simulations using a transient external Poisson drive match experimental findings (cp. B). (D) In simulations with transiently switching from critical to supercritical dynamics (left), adaptive binning fails to compensate for overabundance of large avalanche sizes from supercritical dynamics (middle/right). (E) Simulations using transient Poisson noise. Distributions obtained with fixed binning do not follow power laws, even in the low-noise regime (middle). Distributions obtained with adaptive binning do not have a clear cut-off (right).
Figure 8
Adaptive thresholding as an alternative means to collapse size distributions during rate changes.
(A) Example LFP on single electrode in monkey A. Solid grey lines: Cue presentation. nLFPs detected at fixed (broken, purple) or adaptive threshold (solid, purple) vary in size and rate accordingly. Triangles: nLFPs obtained with fixed (empty) or adaptive thresholding (filled). (B) nLFP raster (top) and corresponding average nLFP rate (bottom) from A at fixed threshold. Color code: nLFP amplitude in μV. (C) Adaptive thresholding produces a relatively constant event rate (cp. B). (D) Adaptive thresholding (right) successfully collapses avalanche size distributions obtained for fixed thresholding (left; cp. Figure 3A and C, left). (E) Distributions normalized by a power law of −1.5 (fixed thresholding, left) or −1.3 (adaptive thresholding, right) together with area differences are in line with the results from adaptive binning (cp. Figure 3B and D, left). Error bars: SD from 1000 bootstraps.
Additional files
-
Transparent reporting form
- https://doi.org/10.7554/eLife.27119.010
Download links
A two-part list of links to download the article, or parts of the article, in various formats.
Downloads (link to download the article as PDF)
Open citations (links to open the citations from this article in various online reference manager services)
Cite this article (links to download the citations from this article in formats compatible with various reference manager tools)
Maintained avalanche dynamics during task-induced changes of neuronal activity in nonhuman primates
eLife 6:e27119.
https://doi.org/10.7554/eLife.27119


