The H3K4 methyltransferase Setd1b is essential for hematopoietic stem and progenitor cell homeostasis in mice
- Technische Universität Dresden, Germany
- University Hospital Ulm, Germany
- Deep Sequencing Group, DFG - Center for Regenerative Therapies Dresden, Germany
- Hospital of the Universities Giessen and Marburg, Germany
- Friedrich Alexander Universität Erlangen, Germany
Figures
Figure 1 with 1 supplement
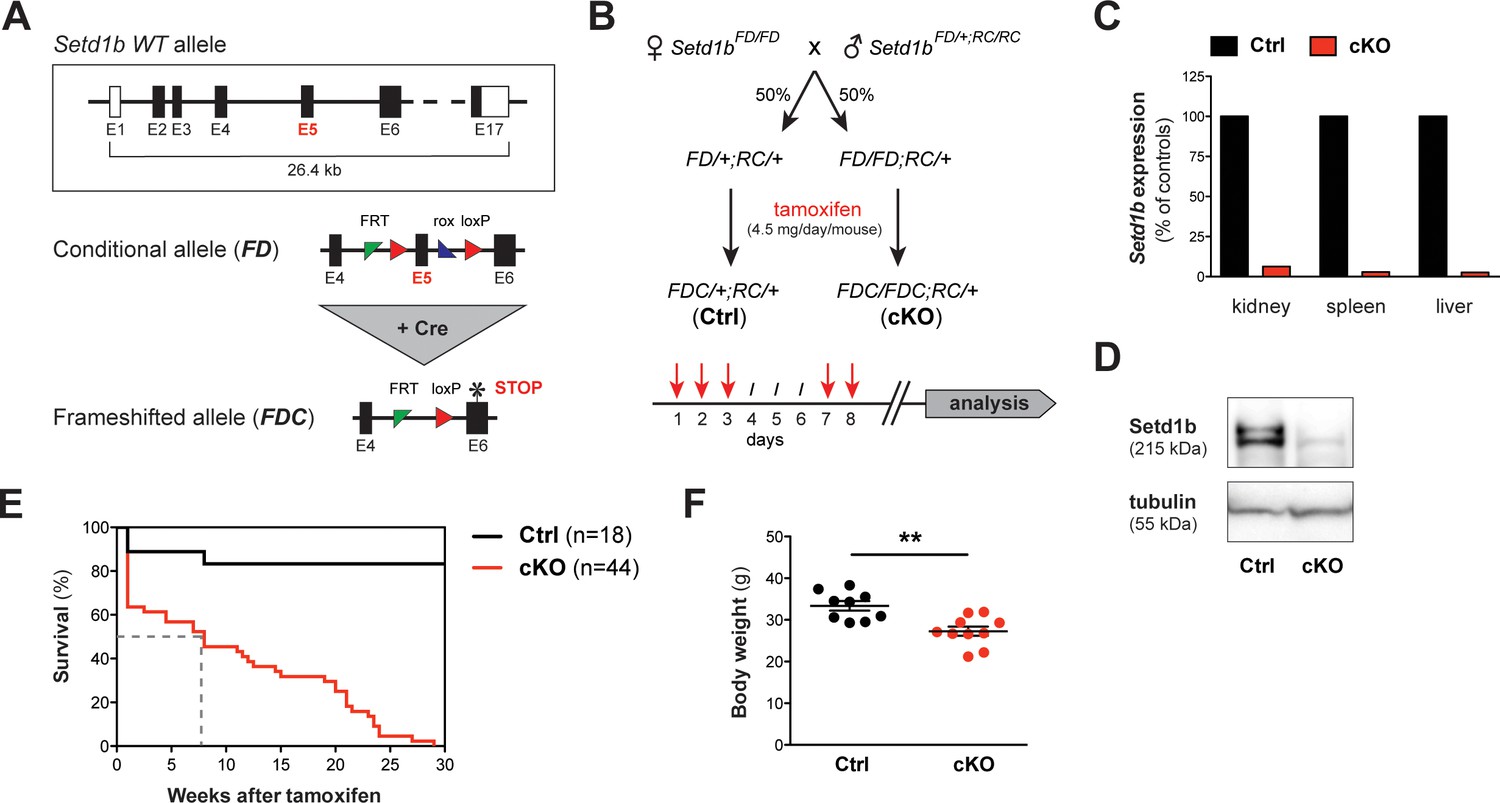
The conditional knockout (cKO) of Setd1b in the adult mouse is lethal.
(A) Setd1b knockout strategy. The conditional allele (FD) carries loxP sites (red triangles) flanking exon 5 (E5) for Cre-mediated recombination. Excision of E5 leads to a frameshift and a premature stop codon in exon 6 (E6) (asterisk). The resulting frameshifted FDC allele corresponds to the null allele. Coding exons of the Setd1b wild type (WT) allele are depicted in black, non-coding exons in white. Single FRT and rox sites are the remnants of previous Flp and Dre recombination. (B) Breeding strategy and experimental setup. Female Setd1bFD/FD mice were mated with Setd1bFD/+ males homozygous for the Rosa26-Cre-ERT2 allele (RC/RC). The resulting offspring was heterozygous for Rosa26-Cre-ERT2 (RC/+) and either heterozygous (FD/+) or homozygous (FD/FD) for the conditional Setd1b allele. To induce Cre recombination, each mouse received five doses of 4.5 mg tamoxifen via gavage over a period of 8 days according to the depicted scheme. (C) qRT-PCR analysis in kidney, spleen, and liver showed absence of Setd1b expression in a homozygous conditional knockout (cKO) mouse compared to a heterozygous control (Ctrl). (D) The loss of Setd1b protein (215 kDa) was validated by western blot analysis in cKO liver. (E) Kaplan-Meier survival curve. While the majority of controls (n = 18) survived, all cKO mice (n = 44) died within 30 weeks after induction with a median survival of 7–8 weeks (dashed line). (F) Male cKO mice between 12 and 26 weeks after induction (Ctrl n = 9, cKO n = 10) had significantly reduced body weights compared to control littermates (p**=0.0043). The graph depicts the mean ± SEM (data derived from five independent tamoxifen inductions).
Figure 1—figure supplement 1

Complete recombination is achieved in almost all tissues after tamoxifen induction.
(A) Genotyping results one week after completion of the tamoxifen induction. In Setd1bFDC/FDC;RC/+ cKO mice, the recombined FDC allele (390 bp) appeared in all analyzed tissues (PCR 2). Conversely, the FD allele (696 bp) was completely lost, indicating successful recombination (PCR 1). Only in brain tissue (asterisks) incomplete recombination was detected. Presence of faint recombined products (FDC) in heterozygous Setd1bFD/+;RC/+ and homozygous Setd1bFD/FD;RC/+ mice before induction indicates a minor degree of leaky recombination. (B) Corresponding primer binding positions and expected amplicon sizes for PCRs 1 and 2 are schematically illustrated. (M = molecular marker, E = exon, bp = base pairs).
Figure 2
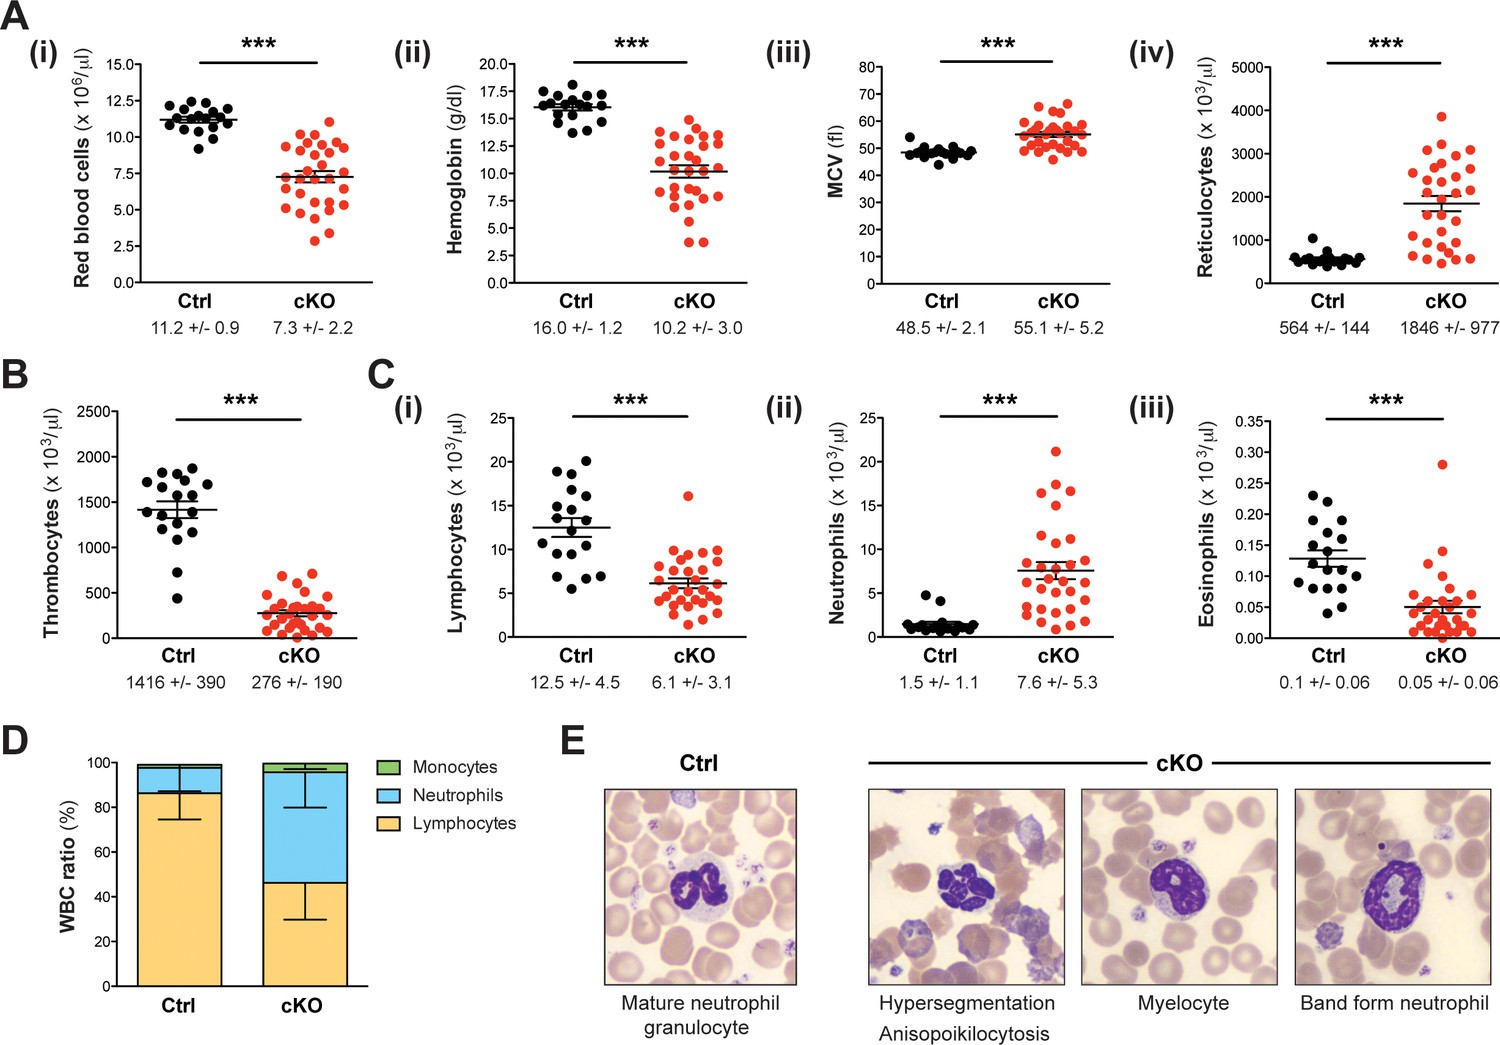
Setd1b cKO mice reveal an abnormal cellular composition in peripheral blood.
(A–C) Peripheral blood counts of mice between 7 and 27 weeks after tamoxifen induction (Ctrl n = 18, cKO n = 30). (A) Red blood cell (RBC) lineage. cKO mice displayed significantly reduced RBC counts (i) and hemoglobin concentration (ii). The mean corpuscular volume (MCV) of RBCs (iii) as well as the number of reticulocytes (iv) was increased, indicating macrocytic anemia. (B) Thrombocyte counts were highly diminished in cKO mice. (C) White blood cell (WBC) lineage. While reduced numbers of lymphocytes (i) and eosinophil granulocytes (iii) were detected, neutrophil granulocytes were on average fivefold increased (ii) in cKO mice. Each graph depicts the mean ± SEM; the mean ± SD is indicated below (p***<0.0001). (D) The quantitative changes were reflected in an altered WBC ratio. The mean ± SD is illustrated. The blood count data in (A–D) are representative of 19 independent measurements. (E) Wright-Giemsa staining of blood smears. Different morphological abnormalities with respect to RBCs (anisopoikilocytosis) and neutrophil granulocytes (hypersegmented nuclei) were detected in blood from cKO mice. Furthermore, an increased presence of immature myeloid forms such as myelocytes and band form neutrophils was noted.
Figure 3 with 2 supplements
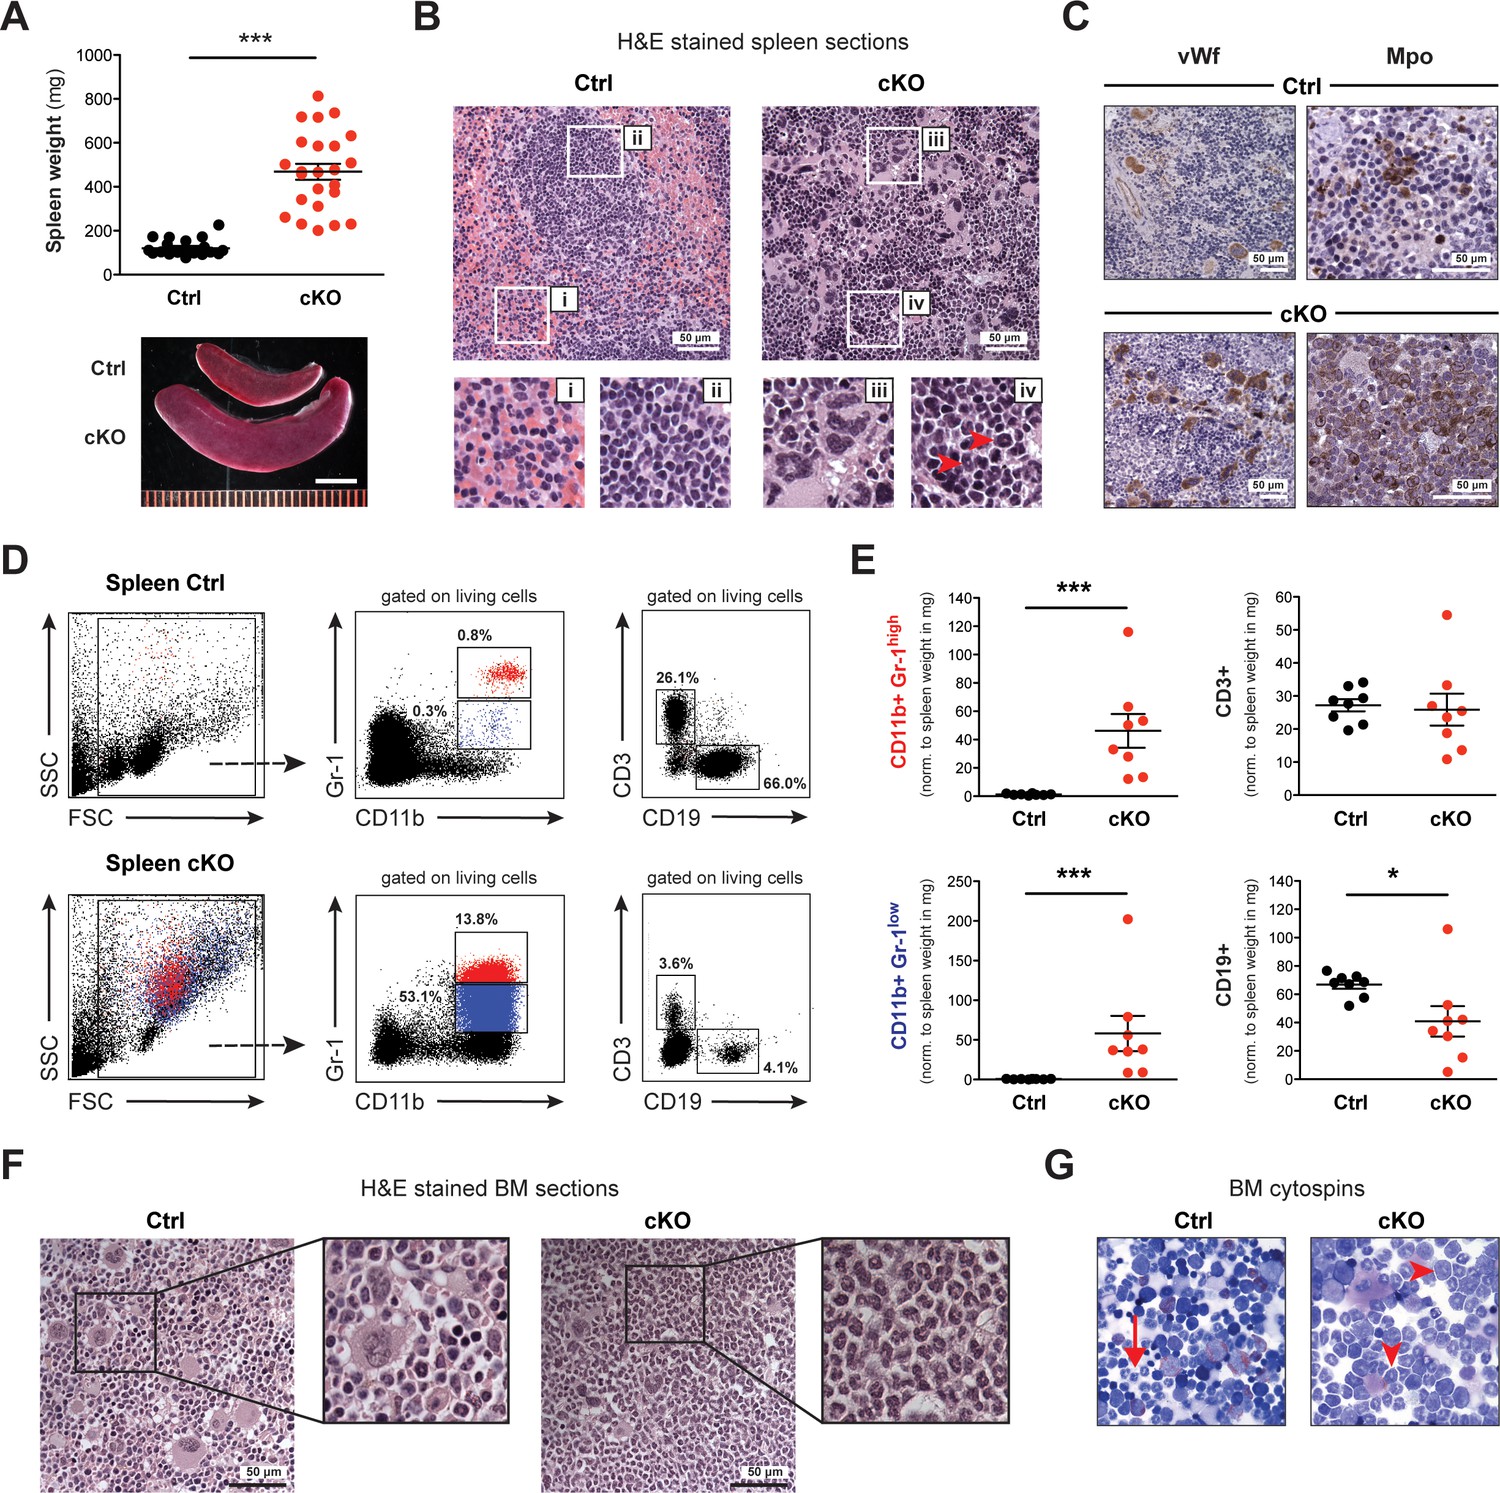
Spleen and BM of cKO mice show extensive accumulation of myeloid cells.
(A) The spleens of cKO mice between 10 and 25 weeks after induction were on average fivefold heavier compared to age-matched controls (both n = 24) (p***<0.0001). Scale bar = 5 mm. The data is representative of 12 independent tamoxifen inductions. (B) H&E staining of spleen sections. Representative areas are outlined in white boxes and enlarged below: red (i) and white pulp (ii) in control spleens, megakaryocyte-like (iii) and myeloid cells (iv) with ring-shaped nuclei (red arrowheads) in cKO spleens. (C) Immunohistochemical staining of spleen sections with antibodies against von Willebrand factor (vWf) and myeloperoxidase (Mpo). Both vWf+ megakaryocytes and Mpo+ myeloid cells were major cell types in cKO spleens. (D) FACS analysis of splenic cell compartments. In cKO spleens, enriched CD11b+ Gr-1high (depicted in red) and CD11b+ Gr-1low (depicted in blue) myeloid cells as well as reduced CD3+ T cells and CD19+ B cells were detected. The given percentages are relative to living cells. (E) Quantification of FACS data normalized to spleen weight (mg) 7–25 weeks after induction (Ctrl n = 8, cKO n = 8). Both mature (Gr-1high) and immature (Gr-1low) myeloid cells were increased (p***<0.001), while B cells (p*=0.015) but not T cells were reduced in cKO tissue. The data is representative of six independent experiments. (F) H&E staining of femoral bone sections. In contrast to controls, cKO bone marrow (BM) revealed an excess of myeloid cells. (G) May-Grünwald-Giemsa staining of BM cytospin preparations. While in controls fully differentiated granulocytes were readily identified (arrow), cKO cytospins were characterized by a higher proportion of myeloid precursors (arrowheads). The graphs in (A) and (E) depict the mean ± SEM. (FSC = forward scatter, SSC = side scatter, norm. = normalized).
Figure 3—figure supplement 1
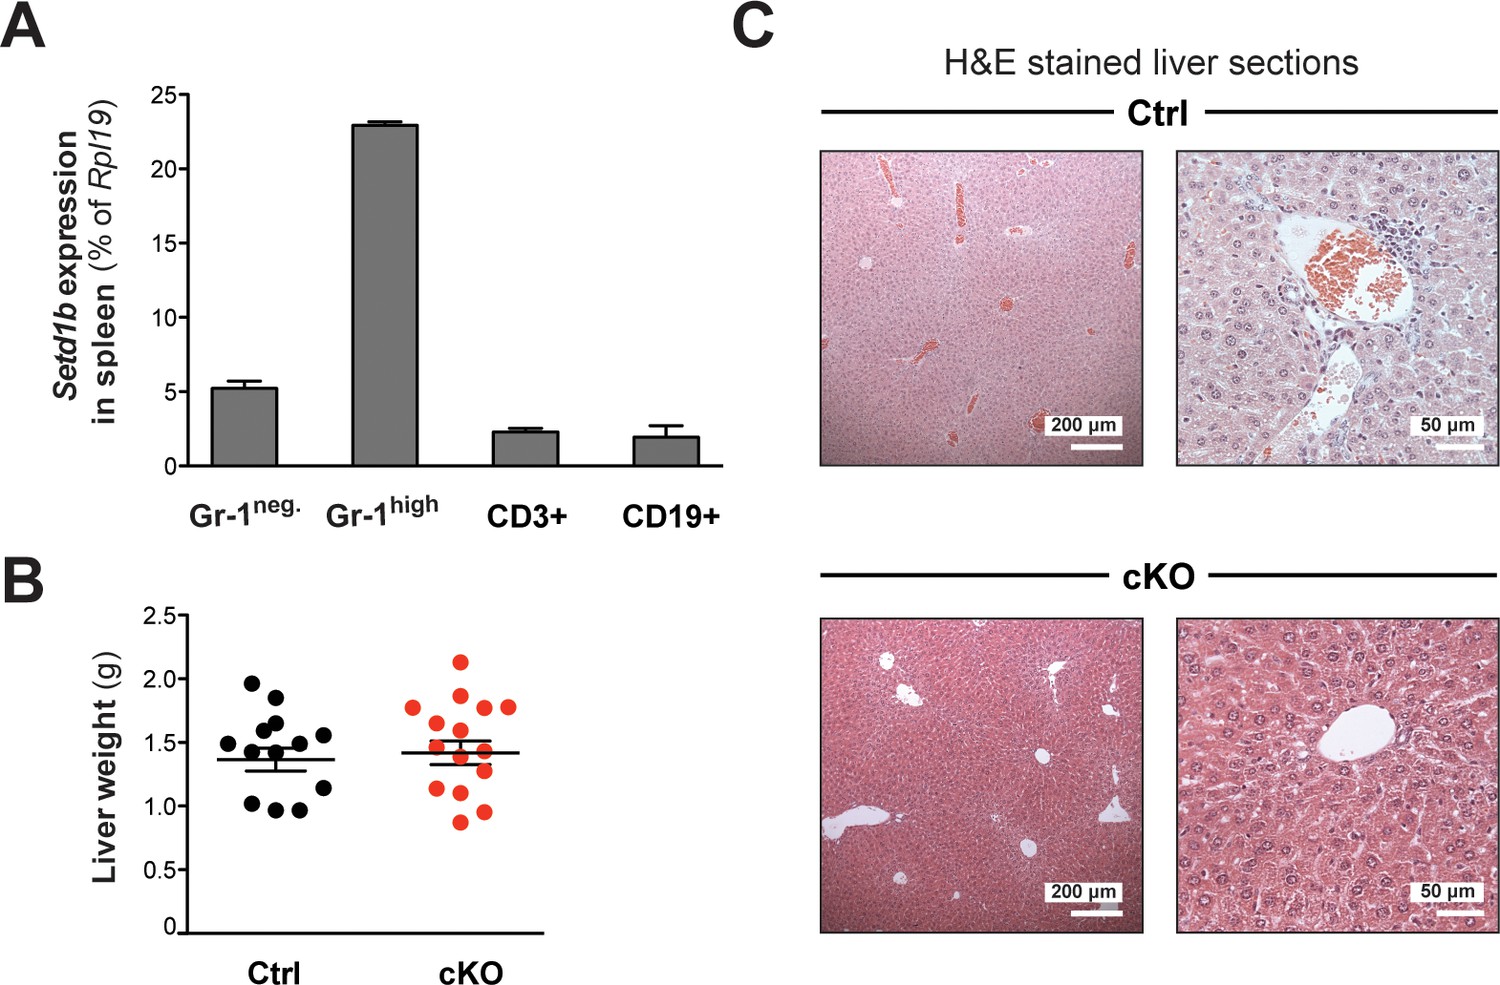
Setd1b expression in differentiated cell types and liver phenotype.
(A) qRT-PCR analysis of Setd1b expression in splenic cell populations. Setd1b mRNA was detected in all FACS-sorted populations from WT mice (n = 3) relative to Rpl19 expression. The mean ± SD is illustrated. (B) The liver weights of cKO and control littermates between 10 and 25 weeks after tamoxifen induction were comparable (Ctrl n = 13, cKO n = 15). The graph depicts the mean ± SEM (data derived from seven independent tamoxifen inductions). (C) H&E staining of liver sections. In cKO mice, the liver architecture was normal without apparent myeloid cell infiltrations. Empty blood vessels indicated an anemic condition.
Figure 3—figure supplement 2

An abnormal cellular composition marks the BM of cKO mice.
(A) The average BM cellularity (x106) in hind limb bones (2x femur, 2x tibia) of cKO mice (n = 22) was comparable to that of age-matched controls (n = 21) (7–25 weeks after induction). Depicted is the mean ± SEM (data derived from 12 independent tamoxifen inductions). The femoral bones in cKO mice appeared anemic (scale bar = 5 mm). (B) Immunohistochemical staining of femoral BM sections. In cKO tissue, vWf+ megakaryocytes appeared frayed and dysplastic compared to controls. Moreover, an increased but overall weak staining of Mpo+ myeloid cells was detected, indicating an excess of immature forms. (C) Quantification of FACS data with respect to total cellularity in both hind limb bones (x106) 16–26 weeks after induction (Ctrl n = 10, cKO n = 10). Both CD11b+ Gr-1low (p*=0.023) and CD11b+ Gr-1neg. (p***=0.001) myeloid cells were increased in cKO mice. Depicted is the mean ± SEM (data derived from three independent tamoxifen inductions).
Figure 4 with 2 supplements

Setd1b-deficiency leads to disturbed HSPC homeostasis in BM and spleen.
(A) FACS analysis of hematopoietic stem and progenitor cell (HSPC) populations in BM. The LSK (Lin- Sca-1+ c-Kit+) compartment (depicted in red) is subdivided into LT-HSCs, MPPs, and LMPPs based on differential expression of CD34 and Flt3. The LK (Lin- Sca-1- c-Kit+) population (depicted in blue) divides into CMPs, GMPs, and MEPs based on differential expression of CD34 and CD16/32. The given percentages are relative to total cells analyzed. (B) HSPC ratios 7–25 weeks after tamoxifen induction (Ctrl n = 9, cKO n = 11). The LSK ratio in cKO BM shifted toward a higher percentage of MPPs at the expense of LMPPs. (C) Quantification of FACS data with respect to total cellularity in both hind limb bones (x106). In cKO BM, the LSK compartment has roughly doubled (p*=0.011). (D) This increase resulted from an enriched pool of MPPs (p**=0.001), while LMPPs were significantly reduced (p**=0.006). Of note, none of the myeloid progenitor populations were majorly affected. Data in (B–D) are representative of six independent experiments. (E) BrdU proliferation assay 6 hr after injection (Ctrl n = 7, cKO n = 7). Only in case of LMPPs (p**=0.038) and MEPs (p**=0.007) minor changes were detected in cKO BM. The data were derived from five independent experiments. (F) qRT-PCR analysis of Setd1b expression. Similar levels of Setd1b mRNA were detected in all FACS-sorted HSPC populations from WT mice (n = 3) relative to Rpl19 expression. (G) FACS analysis of HSPCs in the spleen. Other than in controls, the c-Kit + compartment was highly enriched in cKO spleens, indicating fully active hematopoiesis. The given percentages are relative to total cells analyzed. (H) Quantification of FACS data normalized to spleen weight (mg) 7–25 weeks after induction (Ctrl n = 7, cKO n = 10). Both LSK (p***<0.001) and LK compartments (p**=0.001) were significantly increased in cKO spleens. The data are representative of six independent experiments. The graphs in (B) and (D)-(F) depict the mean ± SD; in (C) and (H) the mean ± SEM is provided.
-
Figure 4—source data 1
Numerical data used to generate Figure 4B,C and D (HSPCs BM RC).
- https://doi.org/10.7554/eLife.27157.011
Figure 4—figure supplement 1

HSPC surface markers and gating strategy.
(A) HSPCs are identified by their ‘LSK’ profile according to the absence of mature lineage markers (Lin-) together with expression of Sca-1 and c-Kit (Spangrude et al., 1988). While CD34- Flt3- long-term (LT) repopulating HSCs reside at the top of the hierarchy able to reconstitute all hematopoietic lineages, CD34+ Flt3- multipotential progenitors (MPPs) (or short-term (ST)-HSCs) have reduced reconstitution capacity and contain early myeloid-restricted progenitors (Osawa et al., 1996; Christensen and Weissman, 2001; Arinobu et al., 2007). The first lymphoid-primed multipotential progenitors (LMPPs) arise from the MPP population along with upregulation of Flt3 (Adolfsson et al., 2001; Luc et al., 2008). While LMPPs combine lymphoid and granulocyte-monocyte (GM) differentiation potentials, MPPs further commit to Lin- Sca-1- c-Kit+ (‘LK’) CD34+ common myeloid progenitors (CMPs) that integrate GM and megakaryocyte-erythroid (MkE) potentials (Adolfsson et al., 2005; Arinobu et al., 2007). This dual propensity is ultimately resolved in megakaryocyte-erythroid (MEP) and granulocyte-monocyte (GMP) progenitors based on differential expression of CD34 and CD16/32 (FcγIII/II) (Akashi et al., 2000). (B) Representative FACS gating strategy of BM using the HSPC staining panel described above. (FSC = forward scatter, SSC = side scatter, A = area, W = width, H = height).
Figure 4—figure supplement 2
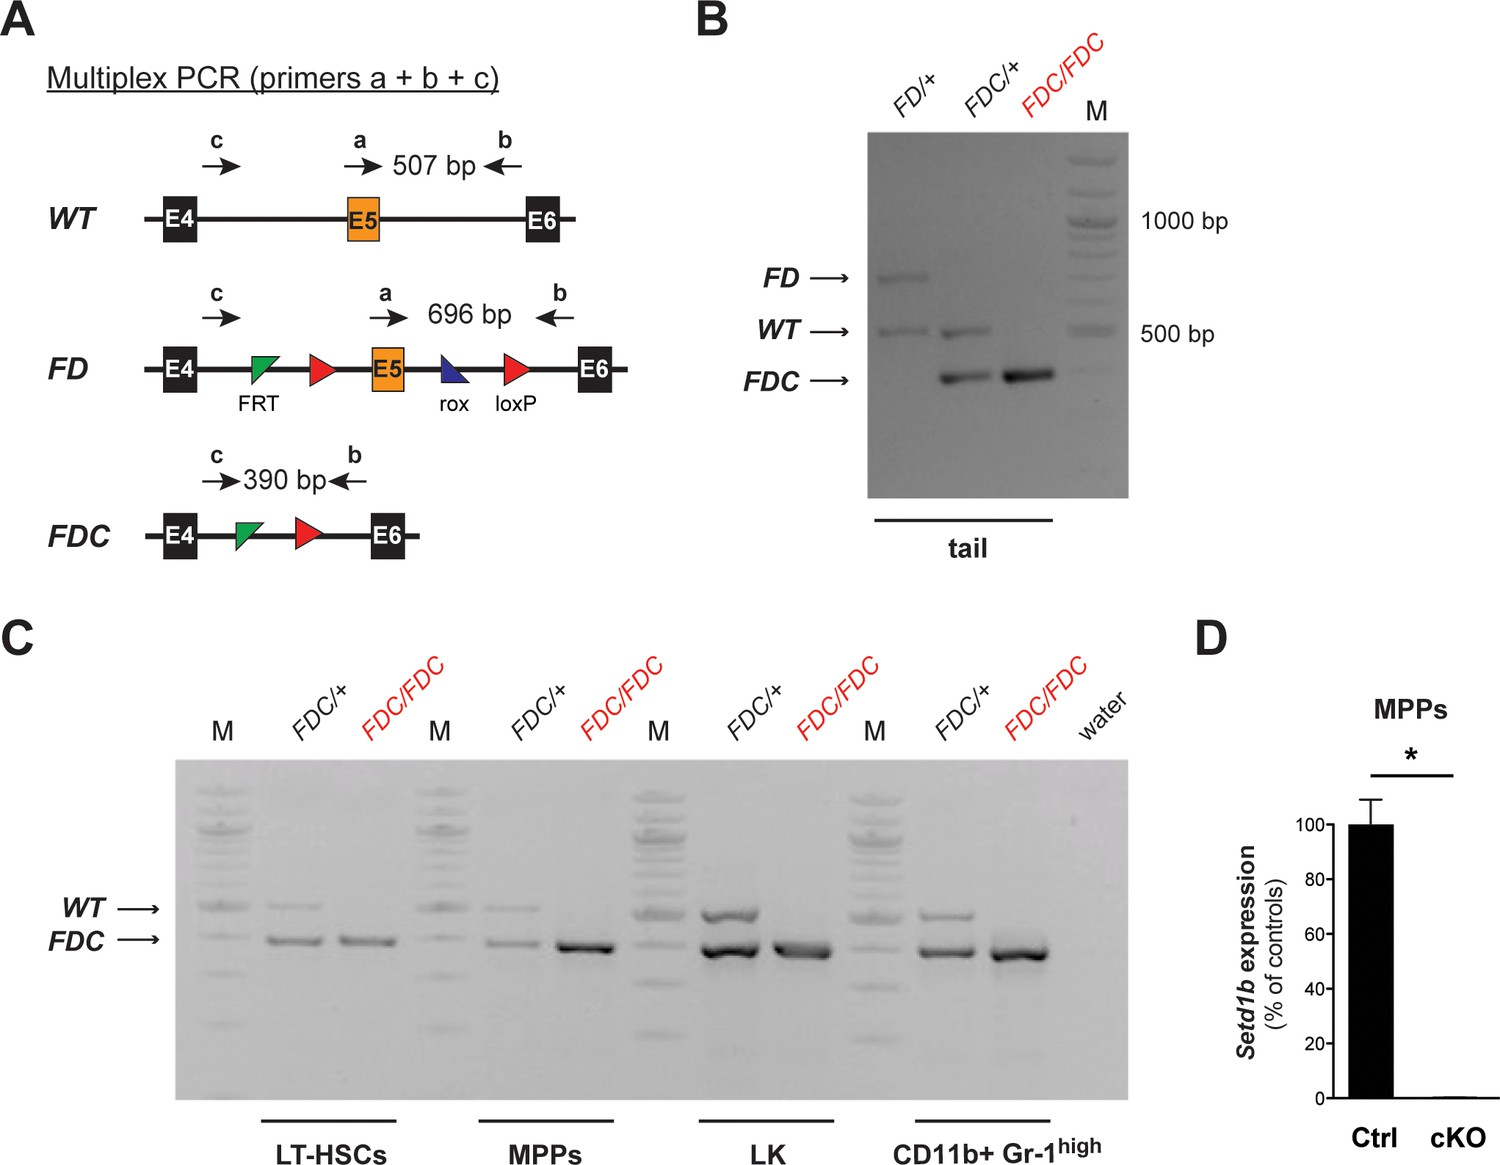
Complete recombination is achieved in FACS-sorted hematopoietic cell populations after tamoxifen induction.
(A) Multiplex PCR strategy allowing for the parallel detection of the FD, WT, and recombined FDC allele of Setd1b. Corresponding primer binding positions and expected amplicon sizes for the PCR are schematically illustrated. (B) Representative genotyping results using genomic tail DNA. In homozygous Setd1bFDC/FDC;RC/+ mice, only the recombined product (FDC) at a size of 390 bp is detectable. (C) Genotyping results in FACS-sorted LT-HSCs, MPPs, LK cells, and CD11b+ Gr-1high granulocytes from BM. Complete recombination was achieved in all analyzed cell populations from Setd1bFDC/+;RC/+ controls (n = 2) and Setd1bFDC/FDC;RC/+ cKO mice (n = 2) 7 weeks after tamoxifen induction. (D) qRT-PCR analysis of Setd1b expression in MPPs 12 weeks after induction. Setd1b mRNA was completely lost in cKO cells (n = 2) compared to controls (n = 2) and relative to Rpl19 expression. The mean ± SD is illustrated (p*=0.041). (M = molecular marker, E = exon, bp = base pairs).
Figure 5 with 1 supplement
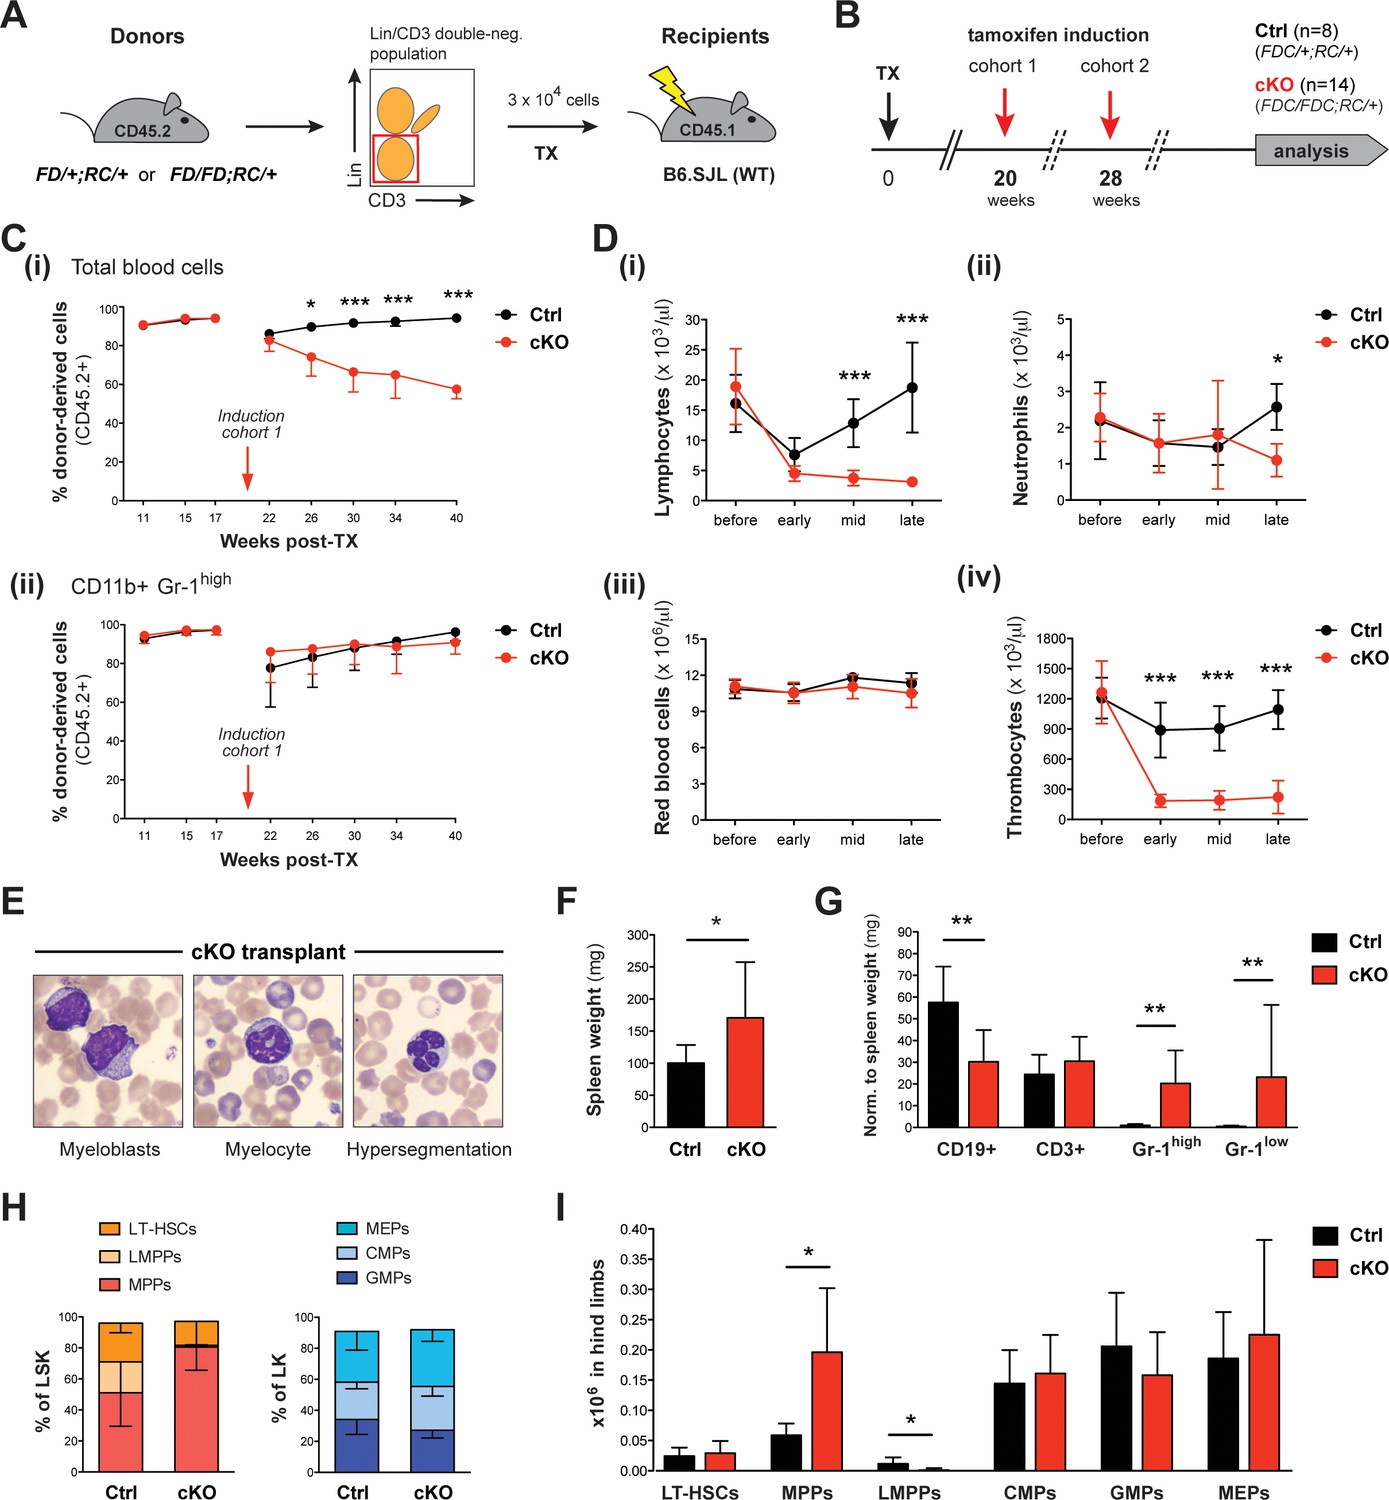
Upon tamoxifen induction, mice with a cKO BM transplant reproduce major characteristics of the cKO phenotype.
(A) Transplantation (TX) setup. The HSC-enriched fraction (Lin- CD3-) of BM from heterozygous Setd1bFD/+;RC/+ or homozygous Setd1bFD/FD;RC/+ donor mice (CD45.2+) was intravenously injected into lethally irradiated B6.SJL recipients (CD45.1+) (3 × 10⁴ cells per TX). (B) Successfully reconstituted mice (Ctrl n = 8, cKO n = 14) were induced with tamoxifen: cohort 1 at 20 weeks, cohort 2 at 28 weeks after TX (each cohort with Ctrl n = 4, cKO n = 7). (C) FACS analysis of the CD45.1/2 chimerism in peripheral blood (cohort 1). (i) Before induction, high percentages (92–95%) of donor-derived CD45.2+ blood cells were reached in all transplanted mice. Immediately after induction, this ratio declined in cKO transplanted mice, whereas it remained high in controls (p*<0.05, p***<0.001). (ii) The contribution of CD45.2+ cells to CD11b+ Gr-1high granulocytes was comparable between cKO transplanted mice and controls. (D) Blood count analysis, including data from both cohorts, before and after induction (early = 4–6 weeks, mid = 11–12 weeks, late = 21–22 weeks). (i) After an initial decline, cKO transplanted mice remained lymphocytopenic. (ii) Neutrophil granulocytes as well as (iii) red blood cells revealed normal levels except for a slight decrease at late stages. (iv) Platelet counts were highly diminished at all stages (p*<0.05, p***<0.001). (E) Wright-Giemsa stained blood smears of cKO transplanted mice 48 weeks after induction. Both immature forms and nuclear dysplasia of myeloid cells were noted. (F) cKO transplanted mice showed mildly increased (p*=0.044) spleen weights (Ctrl n = 8, cKO n = 12; 22 + 48 weeks after induction). (G) FACS analysis of splenic cell compartments. While CD11b+ Gr-1high and CD11b+ Gr-1low myeloid cells were increased (p**=0.003), CD19+ B cells but not CD3+ T cells were decreased (p**=0.002) in cKO transplanted mice. (H) FACS analysis of HSPC populations in the BM. cKO transplanted mice revealed abnormal HSPC ratios within the LSK compartment. (I) While MPPs were enriched (p*=0.019), LMPPs were almost undetectable (p*=0.011). All graphs depict the mean ± SD (data derived from two independent experiments).
Figure 5—figure supplement 1
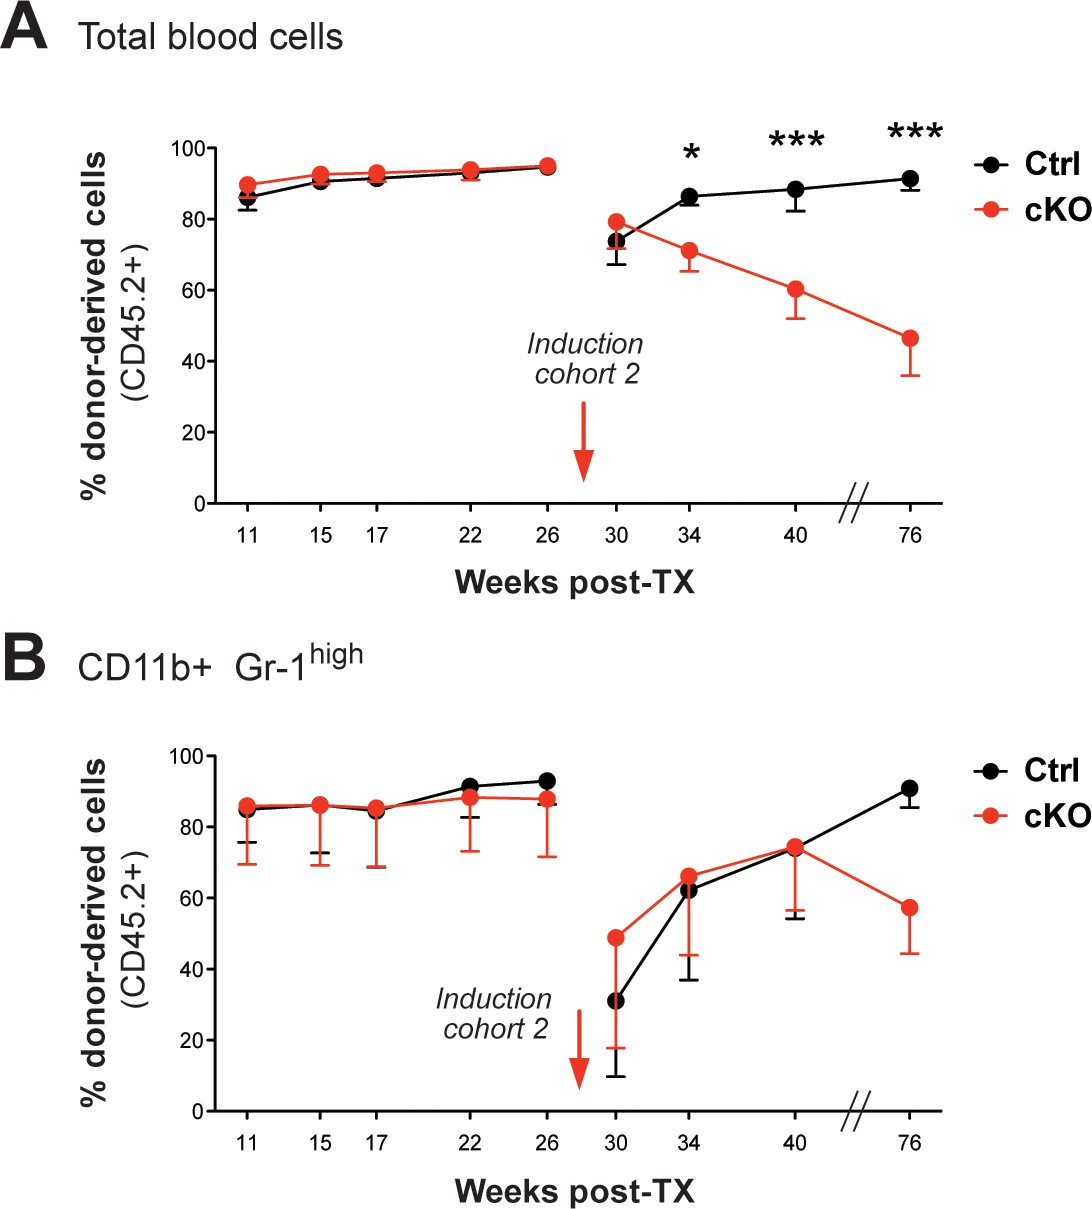
FACS analysis of the CD45.1/2 chimerism in peripheral blood (cohort 2).
(A) Immediately after tamoxifen induction, the initially high percentages of CD45.2
+ donor-derived cells in blood (91–96%) continuously dropped in cKO transplanted mice (p*<0.05, p***<0.001). (B) Despite an obvious decline of CD45.2+ granulocytes (CD11b+ Gr-1high) in all transplant recipients after induction, the levels recovered over time. The graphs depict the mean ± SD.
Figure 6 with 2 supplements
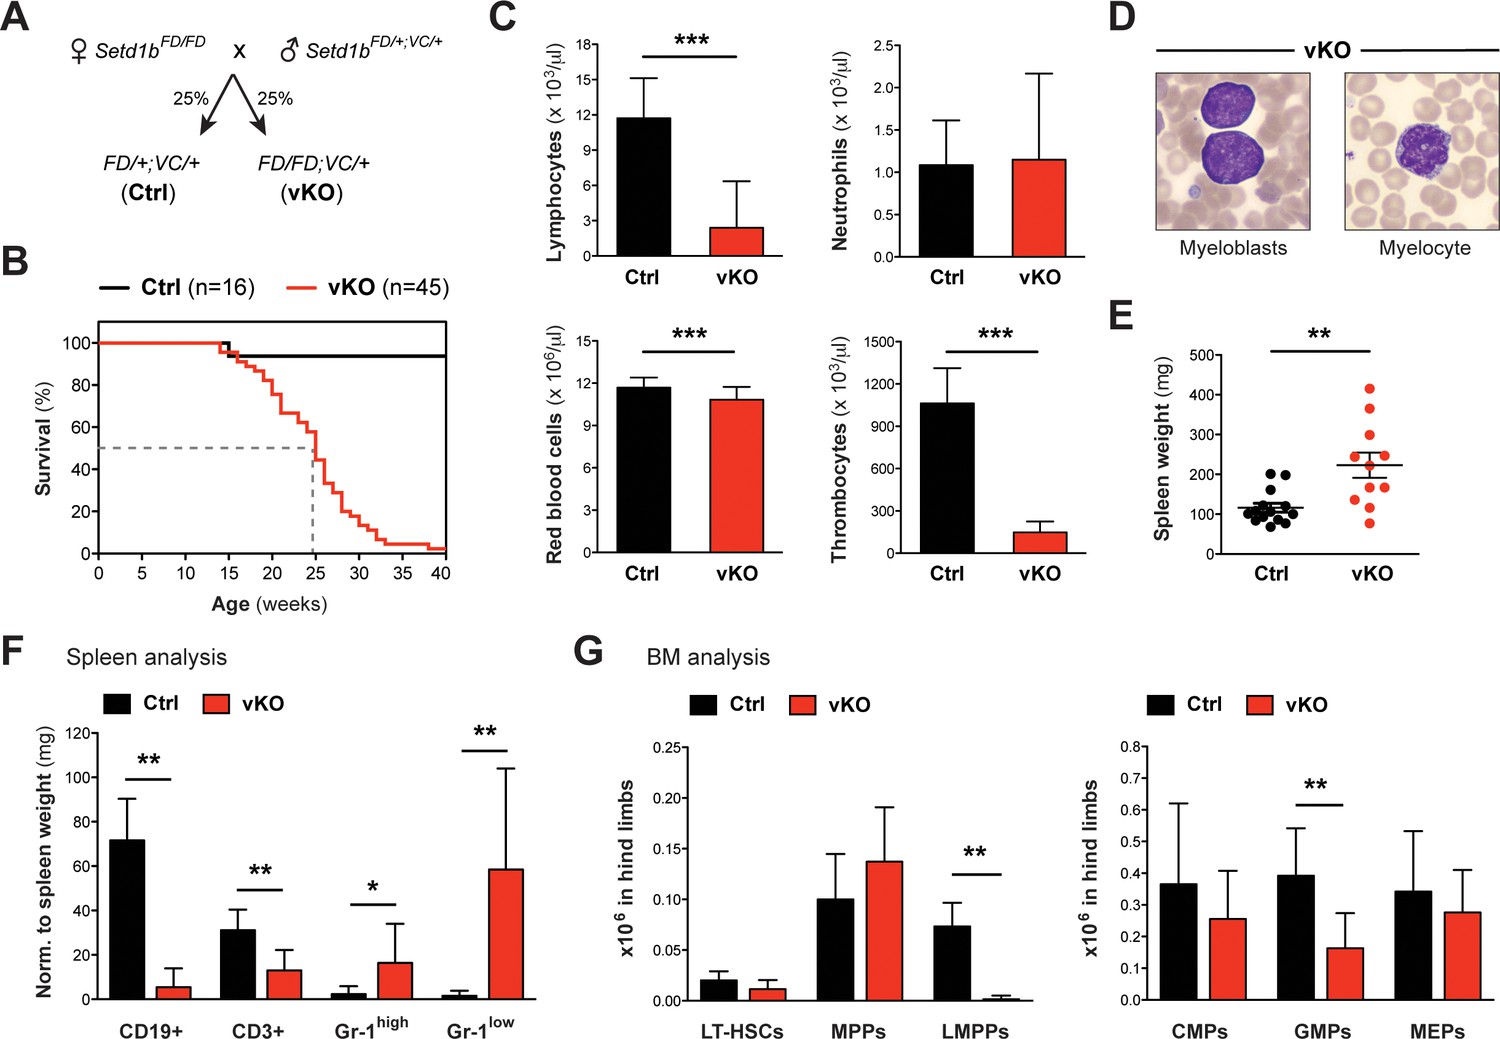
Hematopoietic-specific deletion of Setd1b using Vav-Cre is lethal and impedes production of early progenitors.
(A) Breeding strategy. Mice heterozygous for Vav-Cre (VC/+) and either heterozygous (Ctrl) or homozygous (vKO) for the conditional Setd1b allele were used for analysis. (B) Kaplan-Meier survival curve. All vKO mice died with a median survival of 25 weeks (dashed line). (C) Peripheral blood counts of mice aged between 10 and 32 weeks (Ctrl n = 30, vKO n = 35). Both lymphocyte and thrombocyte counts were severely diminished in vKO blood (p***<0.0001). Furthermore, mice showed mild but significant anemia (p***=0.0002) (data representative of >20 measurements). (D) Wright-Giemsa stained blood smears. Immature myeloid forms, including myeloblasts and myelocytes, were detected in vKO blood. (E) The majority of vKO mice (n = 11) aged between 5 and 31 weeks developed mild splenomegaly as compared to controls (n = 14) (p**=0.004). (F) FACS analysis of splenic cell compartments (Ctrl n = 6, vKO n = 7). In spleens from vKO mice, lymphocytes were highly reduced with respect to spleen weight (mg) (p**<0.008), while CD11b+ Gr-1high (p*=0.035) as well as CD11b+ Gr-1low granulocytes (p**=0.001) were increased. (G) FACS analysis of HSPCs in BM. In vKO mice (n = 7), LMPPs were almost undetectable (p**=0.003) and GMPs were more than twofold decreased (p**=0.005) compared to control littermates (n = 6). The data in (F) and (G) are representative of four independent experiments. The graphs in (C), (F), and (G) depict the mean ± SD; in (E) the mean ± SEM is illustrated.
-
Figure 6—source data 1
Numerical data used to generate Figure 6G (HSPCs BM VC).
- https://doi.org/10.7554/eLife.27157.017
Figure 6—figure supplement 1
Complete recombination is achieved in FACS-sorted hematopoietic cell populations.
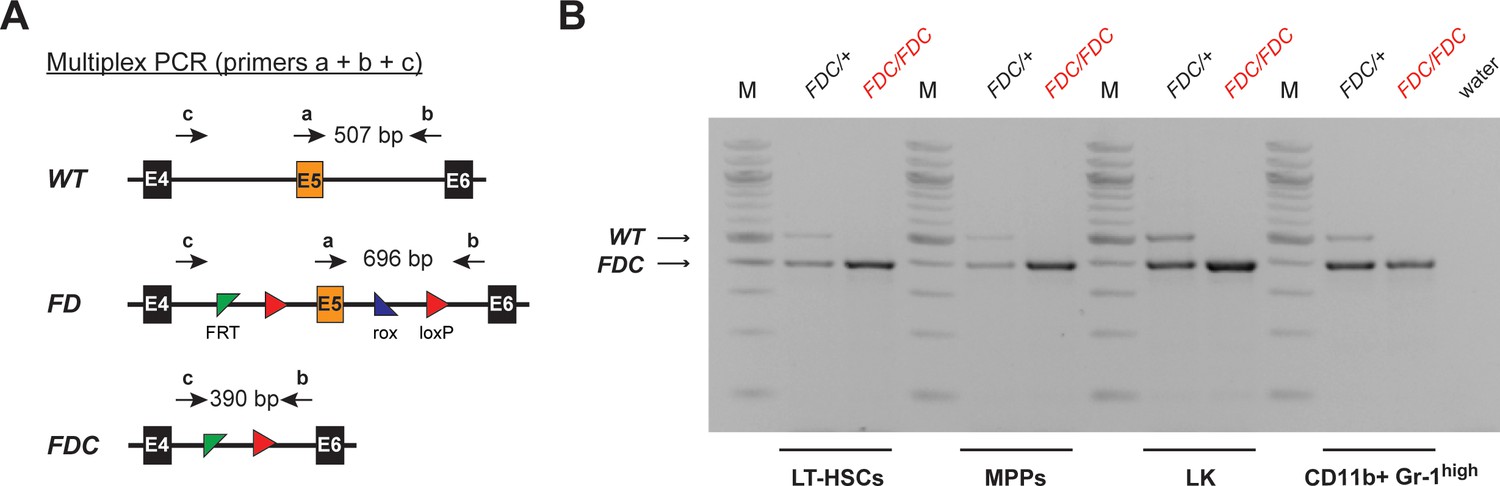
(A) Multiplex PCR strategy allowing for the parallel detection of the FD, WT, and recombined FDC allele of Setd1b. Corresponding primer binding positions and expected amplicon sizes for the PCR are schematically illustrated. (B) Genotyping results in FACS-sorted LT-HSCs, MPPs, LK cells, and CD11b+ Gr-1high granulocytes from BM. Complete recombination was achieved in all analyzed cell populations from 25 weeks old Setd1bFD/FD;VC/+ vKO mice (n = 2) and Setd1bFD/+;VC/+ controls (n = 2). (M = molecular marker, E = exon, bp = base pairs).
Figure 6—figure supplement 2
Setd1b-deficient HSPCs reveal impaired differentiation and proliferation.
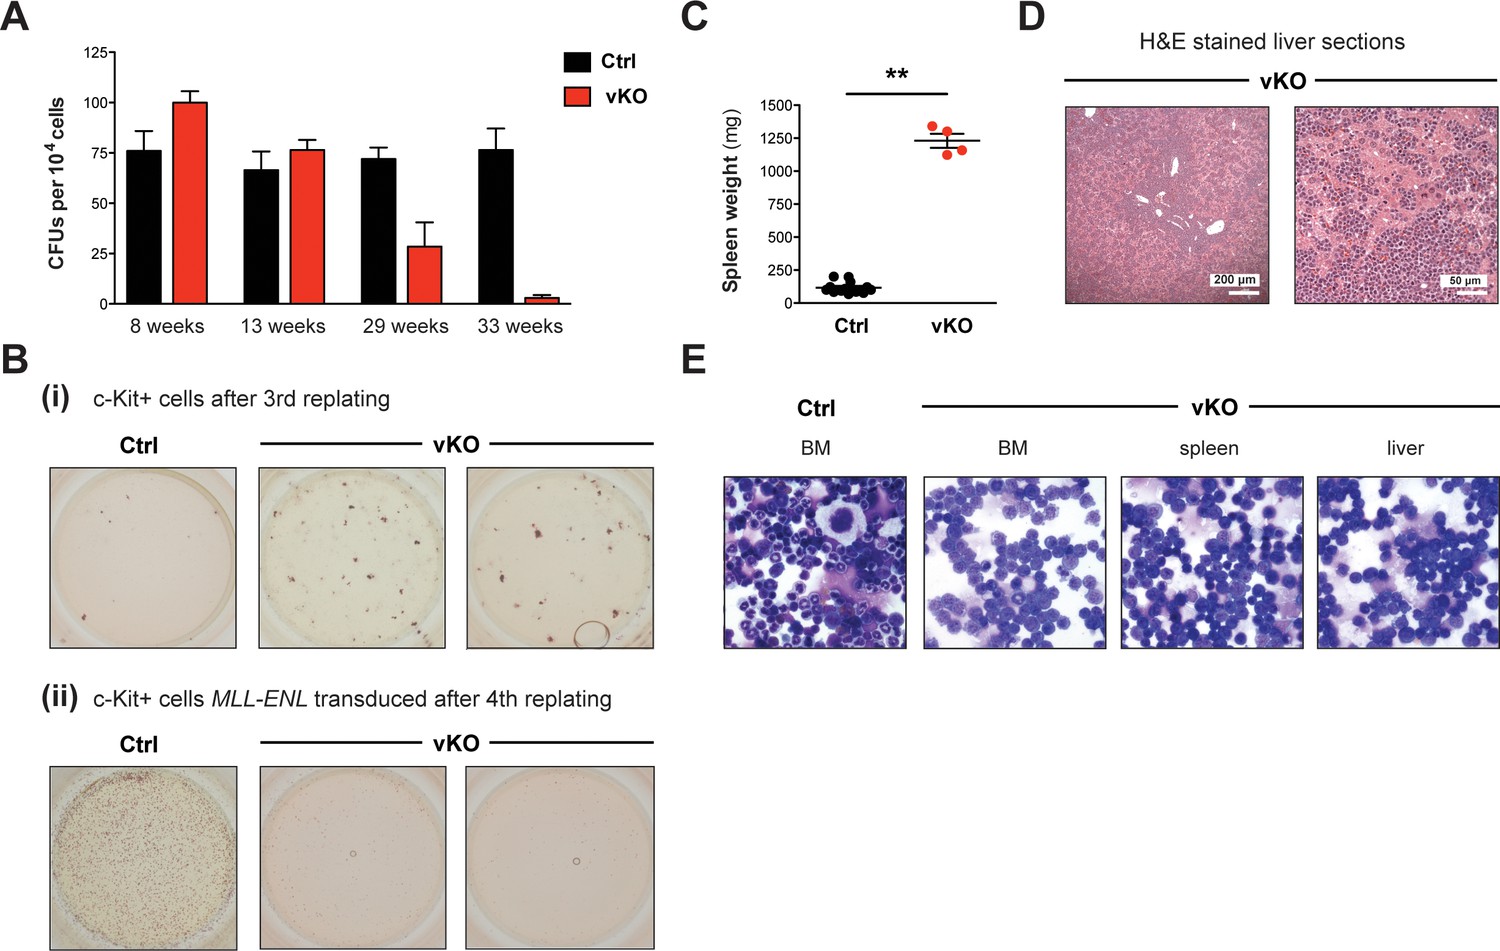
(A) Colony-forming unit (CFU) assay in semi-solid medium supporting myeloid differentiation. 104 cells from total BM of control and vKO mice were plated in duplicates and analyzed 9 days later. CFU numbers gradually decreased in vKO mice with increasing age, indicating progressive stem cell exhaustion. Depicted is the mean ± SD (n = 2 technical replicates per mouse). (B) Replating assays in semi-solid medium supporting myeloid differentiation. (i) 2 × 10⁴ c-Kit+ BM cells were replated for three rounds. After the third replating, no colonies were obtained anymore in controls. However, sustained colony formation was detected in vKO samples, indicating delayed differentiation. (ii) c-Kit+ BM cells were retrovirally transduced with MLL-ENL and 2 × 10⁴ cells were replated for four rounds. After the fourth replating, control cells were immortalized as evident from numerous appearing colonies, while vKO cells had exhausted their proliferative potential. (C) 14% of 24–33 weeks old vKO animals (n = 4) developed massively increased spleen weights (p**=0.004). The graph depicts the mean ± SEM. (D) H&E stained sections of enlarged livers in respective vKO animals showed leukemic infiltrations that destroyed normal tissue architecture. (E) May-Grünwald-Giemsa stained cytospins revealed an almost exclusive presence of myeloid blasts in BM, spleen, and liver of diseased vKO mice.
Figure 7 with 1 supplement
Transplantation of vKO BM recapitulates major characteristics of the vKO phenotype.
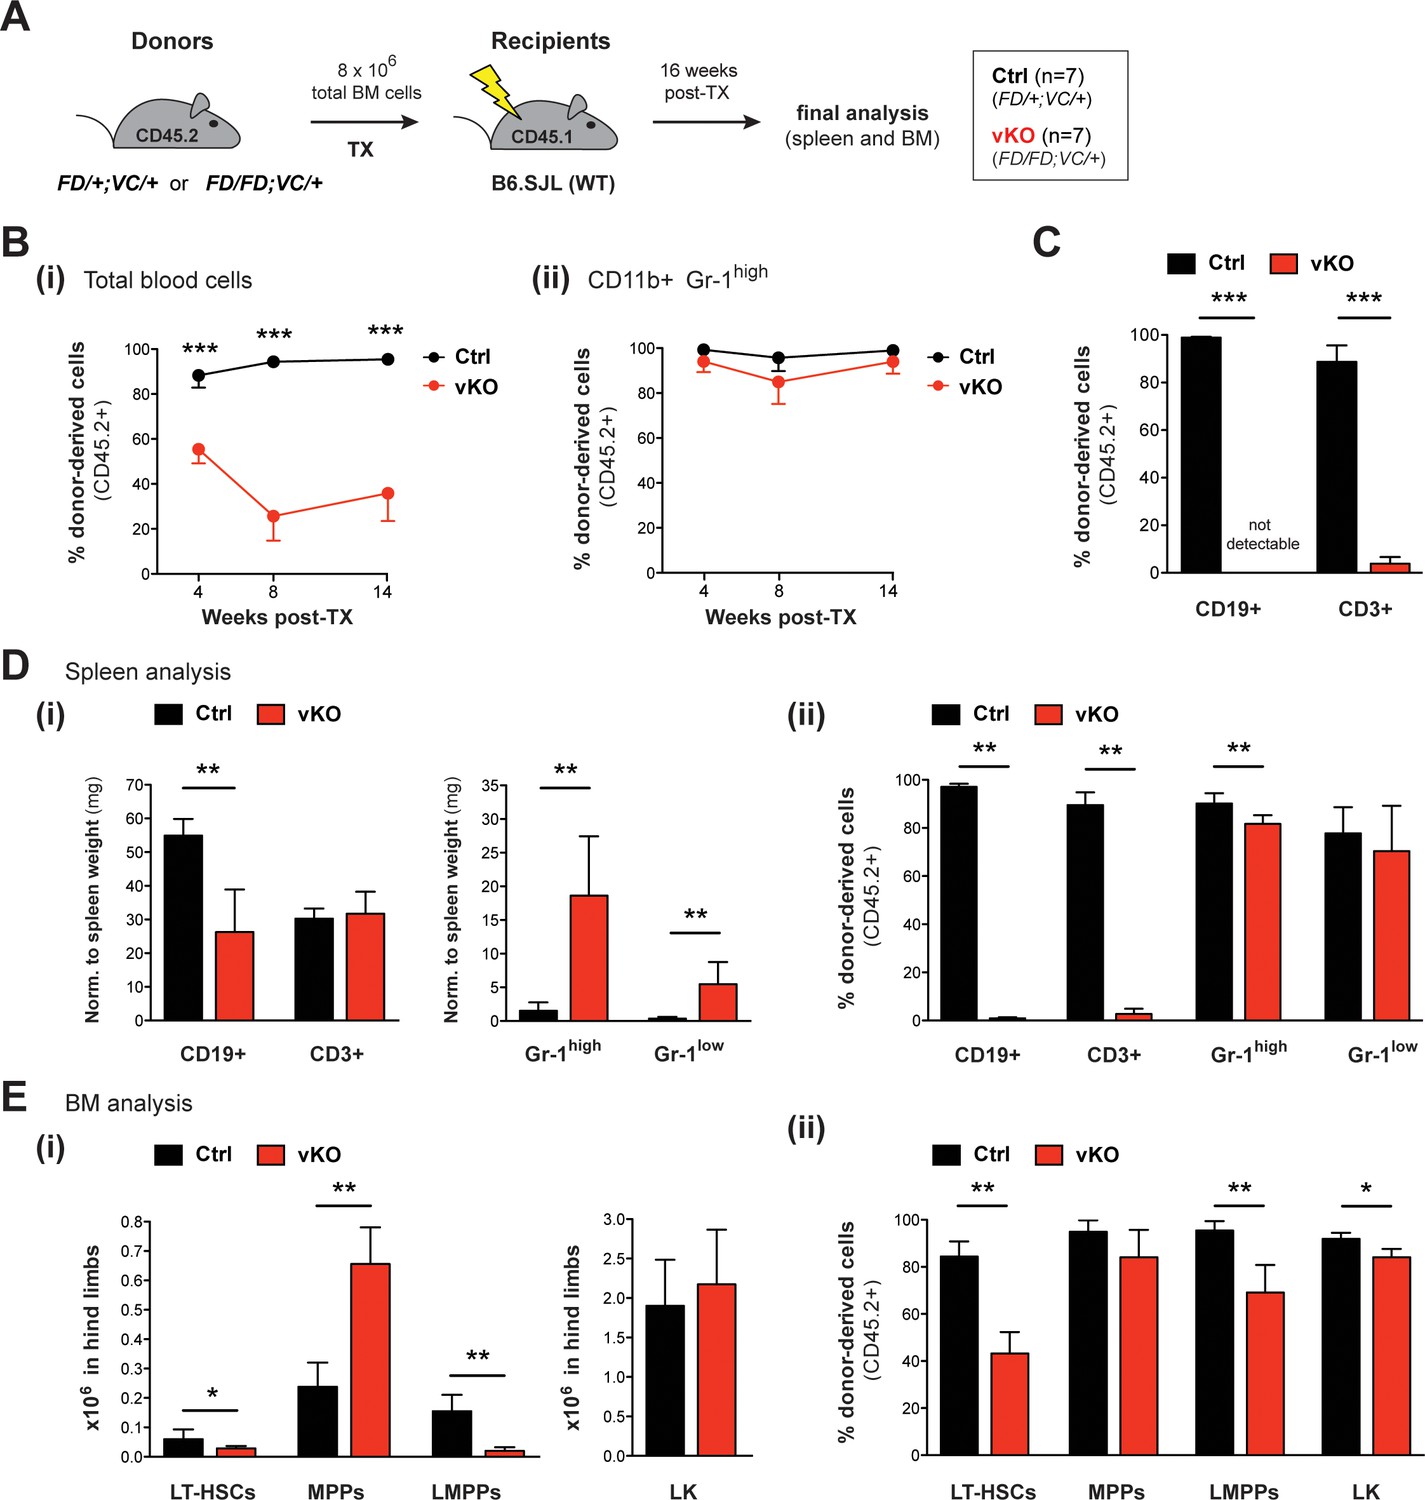
(A) Transplantation (TX) setup. BM cells from heterozygous Setd1bFD/+;VC/+ or homozygous Setd1bFD/FD;VC/+ donor mice (CD45.2+) were intravenously injected into lethally irradiated B6.SJL recipients (CD45.1+) (8 × 10⁶ cells per TX). The mice (Ctrl n = 7, vKO n = 7) were analyzed 16 weeks after TX. (B) FACS analysis of the CD45.1/2 chimerism in peripheral blood over time. (i) The contribution of CD45.2+ donor derived cells severely declined in vKO transplanted mice (p***<0.001). (ii) In CD11b+ Gr-1high granulocytes, the CD45.2+ ratio remained high and was comparable between vKO transplanted mice and controls. (C) FACS analysis of the CD45.1/2 chimerism in peripheral blood lymphocytes 14 weeks after TX. Both CD19+ B cell and CD3+ T cell populations were almost completely devoid of CD45.2+ donor-derived cells in vKO transplanted mice (p***=0.001). (D) FACS analysis of splenic cell compartments (Ctrl n = 6, vKO n = 5) 16 weeks after TX. (i) In spleens from vKO transplanted mice, B cells were significantly reduced (p**=0.004) with respect to spleen weight (mg), while both CD11b+ Gr-1high as well as CD11b+ Gr-1low granulocytes were increased (p**=0.004). (ii) FACS analysis of the CD45.1/2 chimerism in the respective cell compartments. While the contribution of CD45.2+ donor-derived cells in lymphocytes from vKO transplanted mice was almost completely abolished (p**=0.004), it was only slightly reduced in Gr-1high granulocytes (p**=0.004) and unchanged in Gr-1low cells. (E) FACS analysis of HSPCs in BM (Ctrl n = 6, vKO n = 5) 16 weeks after TX. (i) In vKO transplanted mice, significant reductions were noted in both LT-HSCs (p*=0.028) and LMPPs (p**=0.005), while MPPs were increased (p**=0.009) and LK cells were unchanged compared to controls. (ii) FACS analysis of the CD45.1/2 chimerism in the respective cell compartments. Except for MPPs, the contribution of CD45.2+ donor derived cells was significantly reduced in LT-HSCs (p**=0.004), LMPPs (p**=0.004), and LK cells (p*=0.017) in BM from vKO transplanted mice. All graphs depict the mean ± SD (data in (D) and (E) derived from three independent experiments).
Figure 7—figure supplement 1
Blood count analysis and spleen weights in VC/+ transplanted mice.
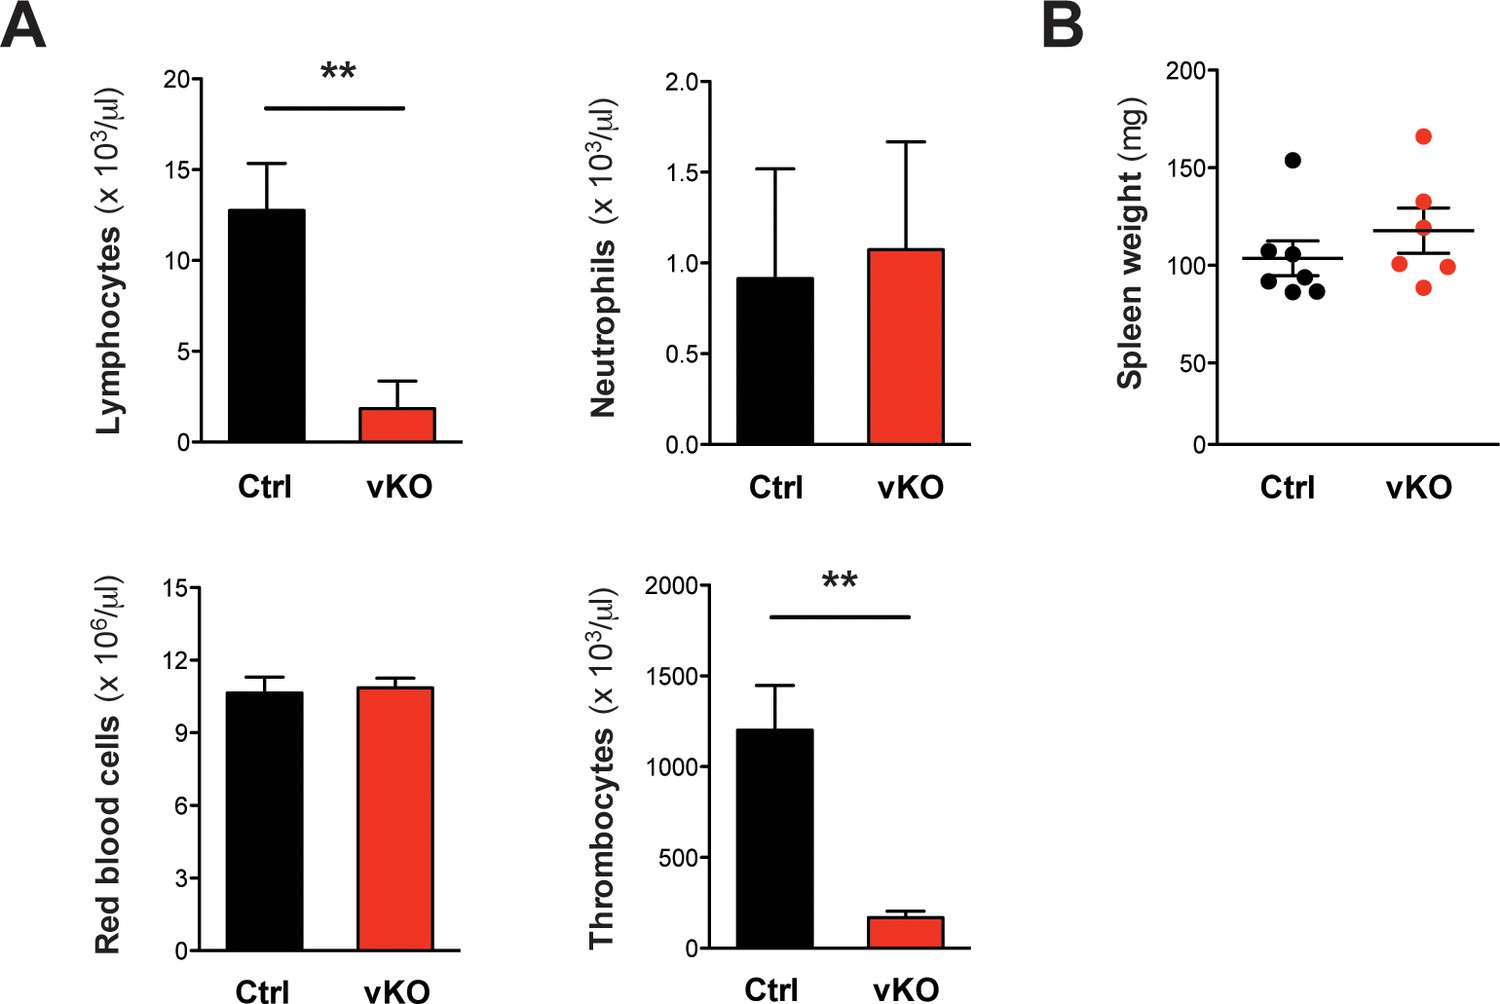
(A) Peripheral blood counts of transplanted mice at the final analysis date 16 weeks after TX (Ctrl n = 6, vKO n = 6). Both lymphocyte and thrombocyte counts were severely diminished in vKO transplanted mice (p**=0.002). (B) Spleen weights were comparable between vKO transplanted mice (n = 7) and controls (n = 6). The graphs in (A) depict the mean ± SD, in (B) the mean ± SEM is shown.
Figure 8
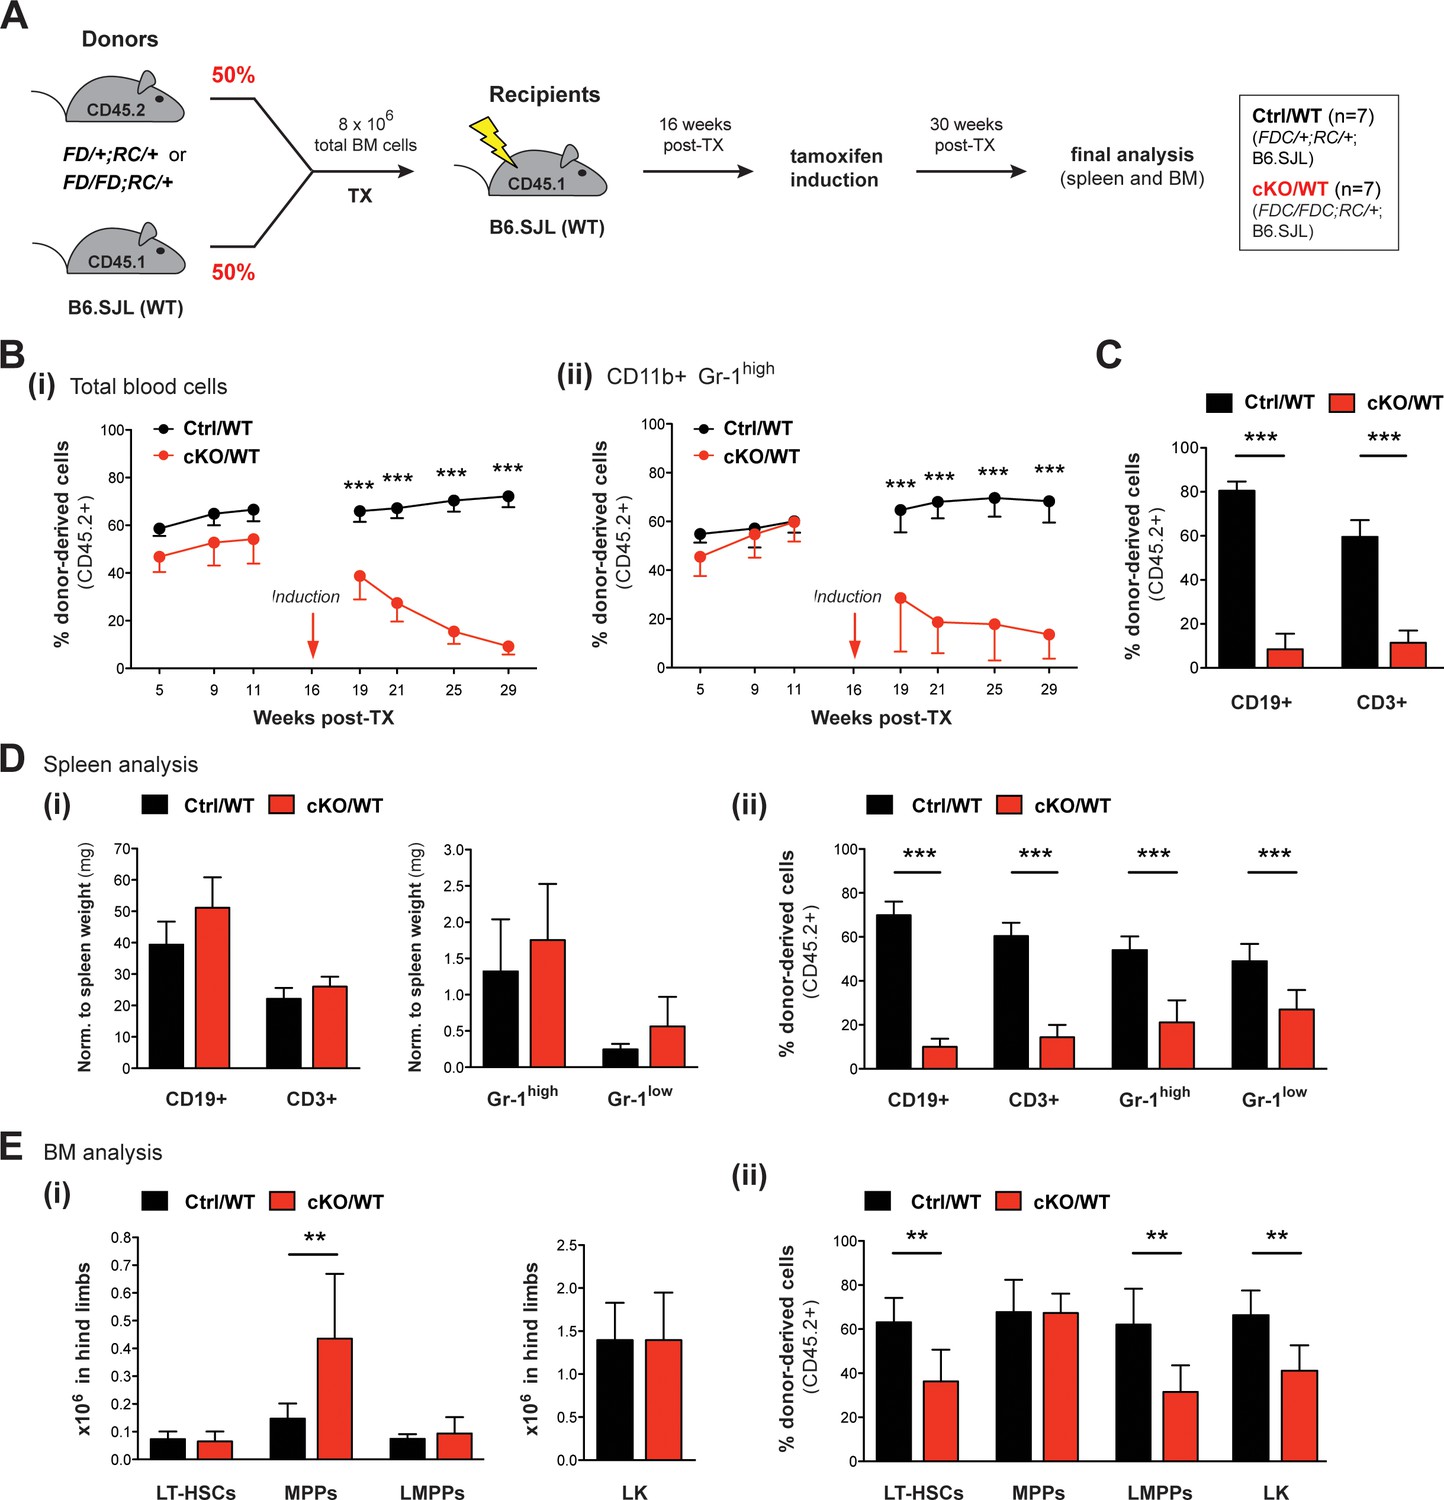
Competitive transplantation experiments reveal crucial requirements of Setd1b in HSPCs as well as myeloid and lymphoid lineages.
(A) Transplantation (TX) setup. BM cells from tamoxifen-inducible heterozygous Setd1bFD/+;RC/+ or homozygous Setd1bFD/FD;RC/+ donor mice (CD45.2+) were intravenously injected together with WT cells (1:1) into lethally irradiated B6.SJL recipients (CD45.1+) (8 × 10⁶ cells per TX). Tamoxifen was applied 16 weeks after TX and the mice (Ctrl/WT n = 7, cKO/WT n = 7) were analyzed 14 weeks later. (B) FACS analysis of the CD45.1/2 chimerism in peripheral blood over time. (i) Immediately after tamoxifen induction, the contribution of CD45.2+ donor-derived cells severely declined in cKO/WT transplanted mice (p***<0.001). (ii) In CD11b+ Gr-1high granulocytes, the CD45.2+ ratio similarly dropped to < 10% (p***<0.001). (C) FACS analysis of the CD45.1/2 chimerism in peripheral blood lymphocytes 13 weeks after induction. In both CD19+ B cell and CD3+ T cell populations, the contribution of CD45.2+ donor-derived cells was significantly reduced in cKO/WT transplanted mice (p***=0.001). (D) FACS analysis of splenic cell compartments (Ctrl/WT n = 7, cKO/WT n = 6) 14 weeks after induction. (i) Absolute cell numbers (with respect to spleen weight) were comparable between cKO/WT transplanted mice and controls. (ii) FACS analysis of the CD45.1/2 chimerism in the respective cell compartments. In cKO/WT transplanted mice, the contribution of CD45.2+ donor-derived cells significantly decreased in all analyzed populations (p***=0.001). (E) FACS analysis of HSPCs in BM (Ctrl/WT n = 7, cKO/WT n = 6) 14 weeks after induction. (i) No major changes in overall HSPC numbers were detected in cKO/WT transplanted mice, except for slightly increased MPPs (p**=0.003). (ii) FACS analysis of the CD45.1/2 chimerism in the respective cell compartments. Except for MPPs, the contribution of CD45.2+ donor-derived cells was significantly reduced in LT-HSCs (p**=0.005), LMPPs (p**=0.008), and LK cells (p**=0.008) in BM from cKO/WT transplanted mice. All graphs depict the mean ± SD.
-
Figure 8—source data 1
Numerical data used to generate Figure 8E (LSK BM competitive TX).
- https://doi.org/10.7554/eLife.27157.021
Figure 9 with 1 supplement
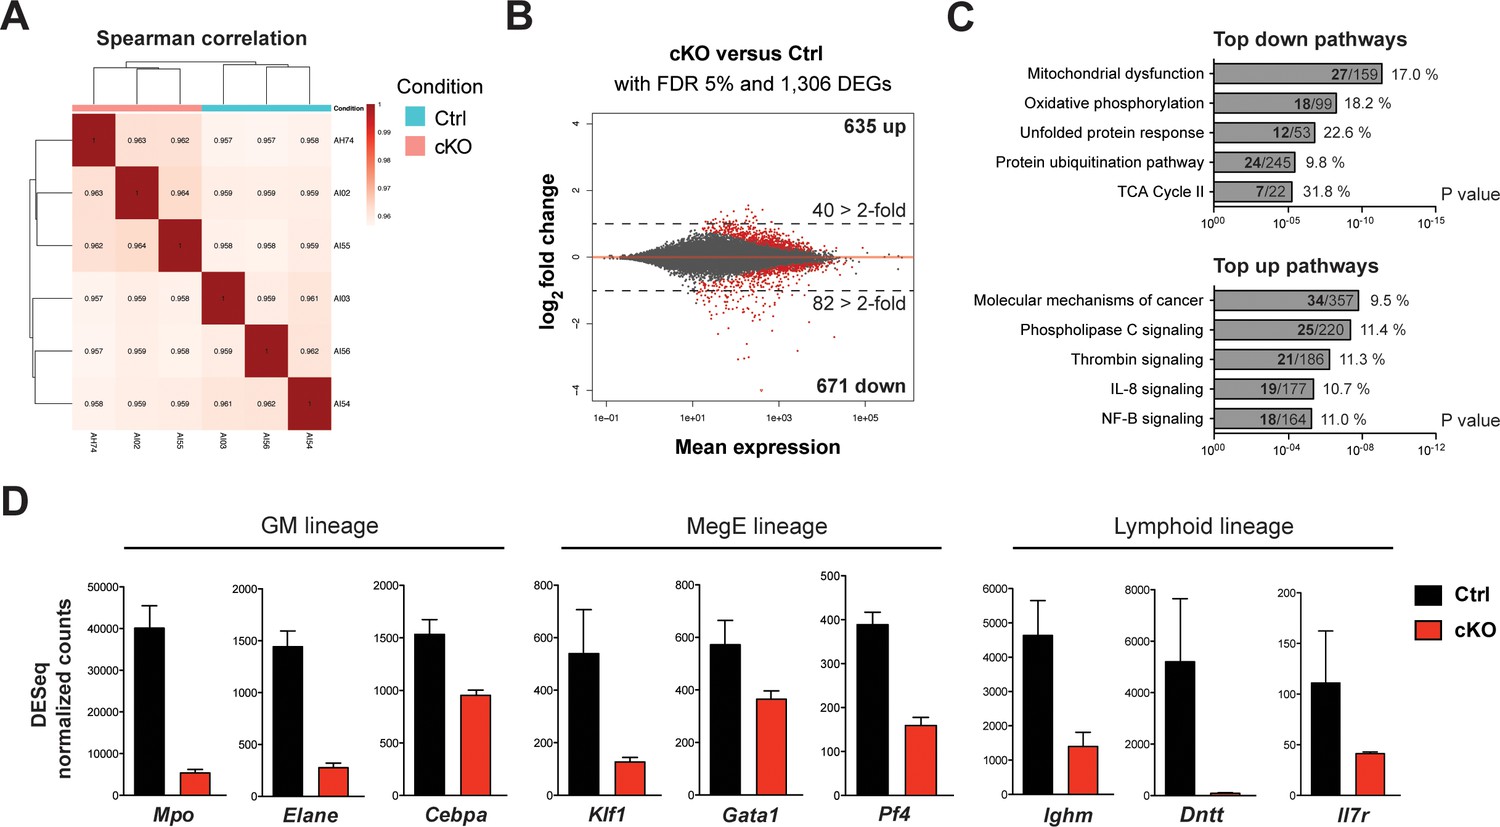
mRNA expression profiling implicates Setd1b as an essential factor for normal proliferation and differentiation of HSPCs.
To reflect the initial changes upon loss of Setd1b, the LSK compartment from control (Setd1bFDC/+;RC/+) and cKO (Setd1bFDC/FDC;RC/+) littermates (n = 3) was isolated 3 days after the tamoxifen induction was completed. mRNA expression profiling yielded on average 35 million reads per sample. (A) Spearman correlation. All biological replicates mapped well together, indicating good reproducibility and data quality. (B) Nearly equal amounts of up- (635) and downregulated (671) differentially expressed genes (DEGs) were detected applying a false discovery rate (FDR) of 5%. However, twice as many DEGs were > 2-fold downregulated (82) than upregulated (40) as indicated by the dashed line at log2 = 1. All red data points refer to significant changes (adjusted p value < 0.05). (C) Pathway analysis using IPA software. In the group of downregulated DEGs, metabolic processes and protein degradation pathways were amongst the most enriched terms, suggesting that cKO cells were metabolically less active. In the category of upregulated DEGs, several signaling pathways relating to cancer and inflammation were enriched. For each pathway the total number of affected DEGs (bold) and percentages are given with respect to total number of genes within one group. (D) DESeq normalized counts of selected genes. Some of the most significantly downregulated genes (>1.6-fold) could be ascribed to transcription factors important for lineage specification and differentiation-specific genes. Each graphs depicts the mean ± SD. (GM = granulocyte/monocyte, MegE = megakaryocyte/erythroid).
-
Figure 9—source data 1
Data used to generate Figure 9B (DEGs > 2-fold).
- https://doi.org/10.7554/eLife.27157.024
-
Figure 9—source data 2
Data used to generate Figure 9C (downregulated DEGs).
- https://doi.org/10.7554/eLife.27157.025
-
Figure 9—source data 3
Data used to generate Figure 9C (upregulated DEGs).
- https://doi.org/10.7554/eLife.27157.026
Figure 9—figure supplement 1

Validation of selected mRNAs by qRT-PCR and additional IPA analysis.
(A) qRT-PCR validation using the LSK input from mRNA expression profiling. The selected genes showed the expected expression levels in LSK cells from cKO mice relative to controls and normalized to Rpl19 expression. Shown is the mean ± SD for (i) downregulated genes (Mpo p***<0.0001, Klf1 p**=0.007, Gata1 p*=0.016, Cebpa p**=0.0075, Pf4 p*=0.019) and (ii) upregulated genes (c-Mpl p*=0.042). (B) Pathway analysis using IPA software. With respect to disease categories the terms ‘organismal injury’ and ‘inflammatory response’ were most significantly enriched. The p value intervals and number of affected molecules are depicted. (C) qRT-PCR analysis in FACS-sorted LT-HSCs, MPPs, and LMPPs from two representative mouse pairs 3 days after the last tamoxifen gavage. In cKO samples, the expression levels of Klf1, Mpo, and Ighm were decreased in LT-HSCs, MPPs, and LMPPs, respectively. Relative quantities of mRNA were normalized against Rpl19. The mean ± SD is depicted (n = 3 technical replicates per mouse).
Author response image 1
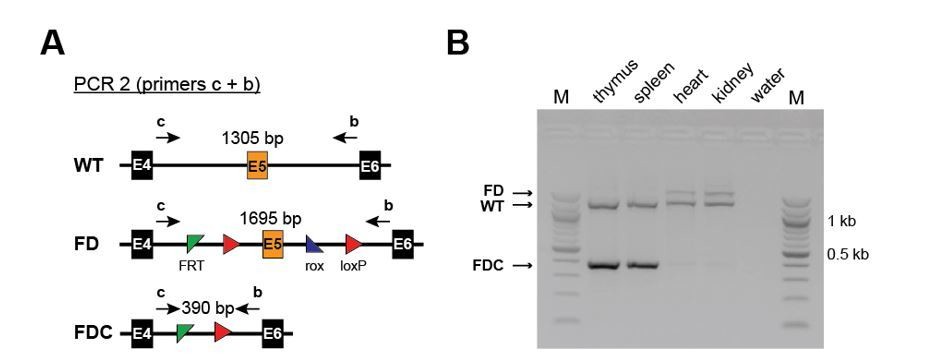
Efficient recombination occurs only in hematopoietic and not in non-hematopoietic organs of Setd1b FD/+;Vav-Cre/+ mice.
(A) PCR strategy to detect the WT, the unrecombined FD and the recombined FDC allele using primers upstream of the 5’ FRT site and downstream of the 3’ loxP site. (B) Efficient recombination as defined by the presence of the FDC band occurs only in thymus and spleen but not in heart and kidney.
Author response image 2
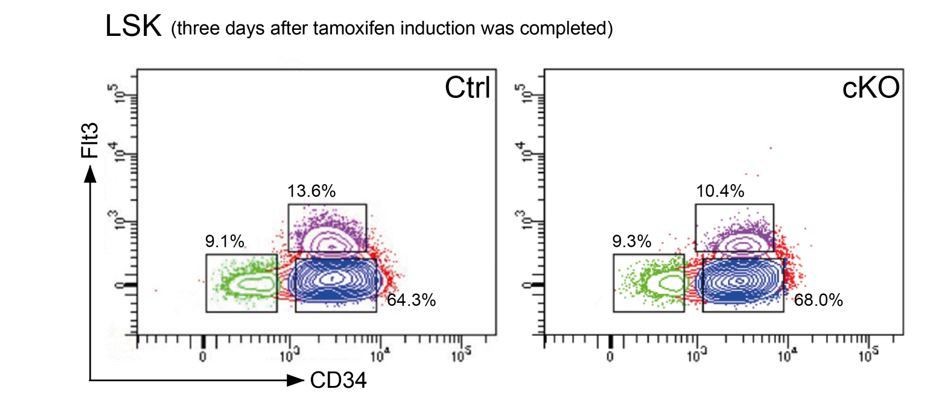
Representative FACS plots 3 days after the last tamoxifen application show that the cellular distribution in the LSK compartment was comparable between controls and cKO mice.
https://doi.org/10.7554/eLife.27157.033Tables
Table 1
Hematopoietic parameters of Setd1b-deficient mouse models
A summary table of (abnormal) hematopoietic parameters in Setd1b-deficient mouse models (cKO and cKO transplant; vKO and vKO transplant) is shown. All depicted changes are based on comparisons with heterozygous controls. (n.d. = not determined).
| Phenotype | cKO | cKO transplant | vKO | vKO transplant | |
|---|---|---|---|---|---|
| BM | LT-HSCs | Unchanged | Unchanged | Unchanged | Low |
| MPPs | High | High | Unchanged | High | |
| LMPPs | Low | Low | Low | Low | |
| LK cells | Unchanged | Unchanged | Low (GMPs) | Unchanged | |
| Spleen | B cells | Low | Low | Low | Low |
| T cells | Unchanged | Unchanged | Low | Unchanged | |
| Granulocytes | High | High | High | High | |
| Extramedullary hematopoiesis | Yes | n.d. | n.d. | n.d. | |
| Splenomegaly | High | Low | Low | no | |
| Blood | Lymphocytes | Low | Low | Low | Low |
| Neutrophils | High | Unchanged | Unchanged | Unchanged | |
| Thrombocytes | Low | Low | Low | Low | |
| Red blood cells | Low | Unchanged | Low | Unchanged | |
| Dysplastic signs | Yes | Yes | n.d. | n.d. | |
| Immature myeloid forms | Yes | Yes | Yes | n.d. |
Key resources table
| Reagent type (species) or resource | Designation | Source or reference | Identifiers | Additional information |
|---|---|---|---|---|
| Gene (Mus musculus) | SET domain containing 1B (Setd1b) | MGI:2652820 | ||
| Mouse strain | Setd1btm1.2Afst/Setd1b+ | Bledau et al., 2014, PMID:24550110, Brici et al., 2017, PMID:28619824 | RRID:MGI:5570296 | |
| Mouse strain | C57BL/6-Gt(ROSA) 26Sortm9(Cre/ESR1)Arte | Seibler et al., 2003, PMID:12582257, Taconic | RRID:IMSR_TAC:10471 | |
| Mouse strain | B6.SJL-Ptprca Pepcb/BoyCrl | Charles River | IMSR Cat# CRL:494, RRID:IMSR_CRL:494 | congenic |
| Antibody | anti-hSET1B | Bethyl | Bethyl Cat# A302-281A, RRID:AB_1850180 | 1:500 dilution |
| Antibody | anti-c-Kit | Thermo Fisher Scientific | Thermo Fisher Scientific Cat# 17-1171-82, RRID:AB_469430 | 1:400 dilution |
| Antibody | anti-Sca-1 | Thermo Fisher Scientific | Thermo Fisher Scientific Cat# 12-5981-82, RRID:AB_466086 | 1:800 dilution |
| Antibody | anti-CD34 FITC | Thermo Fisher Scientific | Thermo Fisher Scientific Cat# 11-0341-85, RRID:AB_465022 | 1:25 dilution |
| Antibody | anti-CD16/32 | Thermo Fisher Scientific | Thermo Fisher Scientific Cat# 25-0161-81, RRID:AB_469597 | 1:800 dilution |
| Antibody | anti-Flt3 | Thermo Fisher Scientific | Thermo Fisher Scientific Cat# 46-1351-82, RRID:AB_10733393 | 1:100 dilution |
| Antibody | anti-CD45.1 | Thermo Fisher Scientific | Thermo Fisher Scientific Cat# 25-0453-82, RRID:AB_469629 | 1:200 dilution |
| Antibody | anti-CD45.2 | Thermo Fisher Scientific | Thermo Fisher Scientific Cat# 11-0454-82, RRID:AB_465061 | 1:400 dilution |
| Chemical compound, drug | Tamoxifen | Sigma-Aldrich T5648 | ||
| Software, algorithm | BD FACSDiva Software | BD Biosciences | RRID:SCR_001456 |
Additional files
-
Supplementary file 1
Primers.
(A) All primers used for genotyping are depicted. (B) All primers used for qRT-PCR are depicted. (se = sense, as = antisense, bp = base pairs)
- https://doi.org/10.7554/eLife.27157.028
-
Supplementary file 2
FACS antibodies and staining panels.
(A) All antibodies and staining panels used for flow cytometry are depicted. (B) All antibodies and staining panels used for flow cytometry in transplanted mice are depicted.
- https://doi.org/10.7554/eLife.27157.029
-
Transparent reporting form
- https://doi.org/10.7554/eLife.27157.030
Download links
A two-part list of links to download the article, or parts of the article, in various formats.
Downloads (link to download the article as PDF)
Open citations (links to open the citations from this article in various online reference manager services)
Cite this article (links to download the citations from this article in formats compatible with various reference manager tools)
The H3K4 methyltransferase Setd1b is essential for hematopoietic stem and progenitor cell homeostasis in mice
eLife 7:e27157.
https://doi.org/10.7554/eLife.27157


