Altered paracrine signaling from the injured knee joint impairs postnatal long bone growth
- Sloan Kettering Institute, United States
- Weill Cornell Graduate Schoolof Medical Sciences, United States
Figures
Figure 1 with 1 supplement
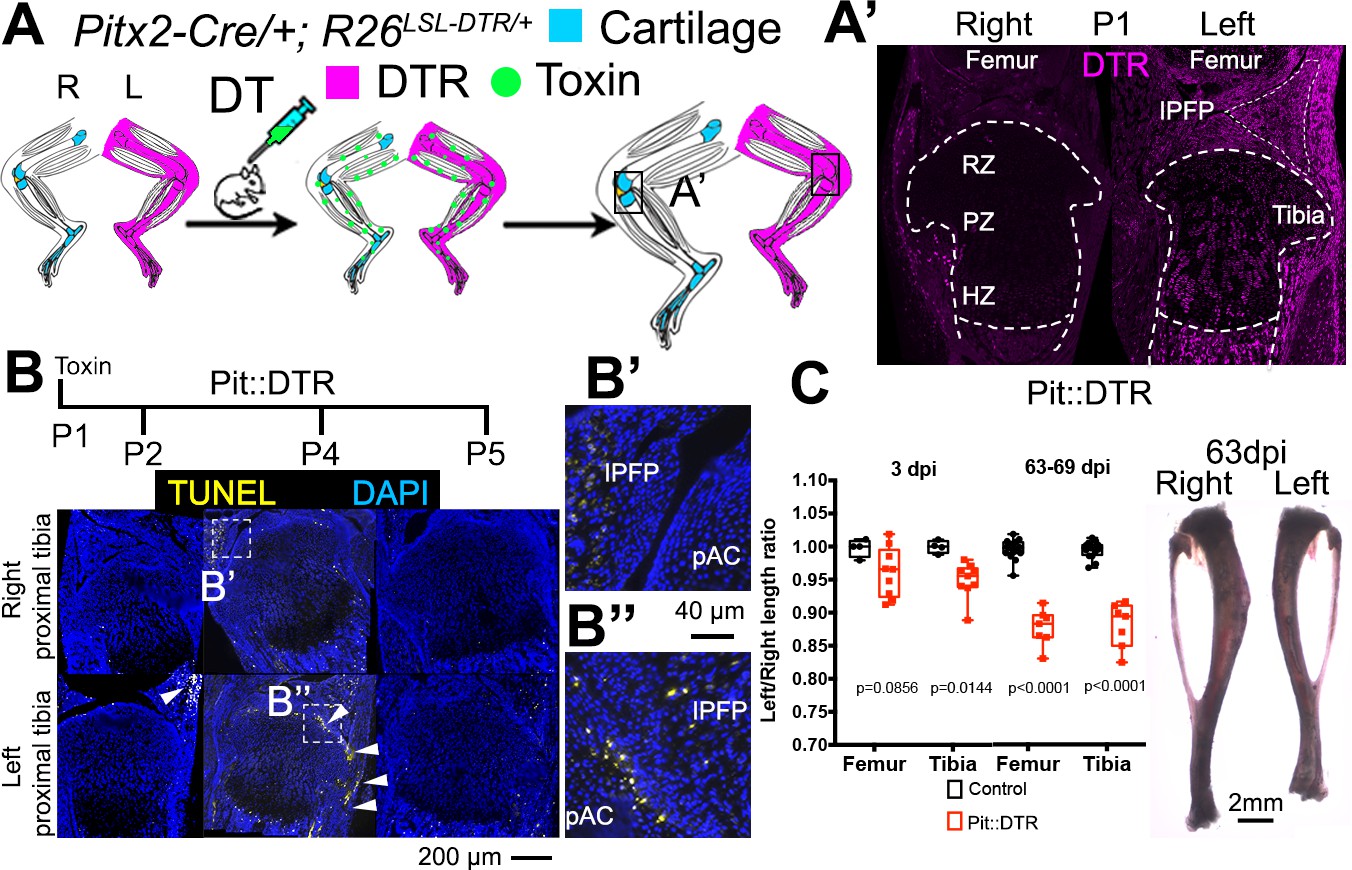
Postnatal growth of the left long bones is impaired following transient left-specific cell death in the adjacent mesenchyme.
(A) Pit::DTR model for the induction of transient unilateral cell death in the limb mesenchyme. See Figure 1—figure supplement 1 for a characterization of the Pitx2-Cre lineage. LSL= loxSTOPlox. (A’) Sagittal sections of Pit::DTR knees immunostained for DTR (approximate region indicated by the boxes in (A). RZ, PZ, HZ= resting, proliferative, hypertrophic zone. IPFP= infrapatellar fat pad. (B–B’’) Time course of cell death induction (TUNEL, arrowheads) after DT injection at P1. Insets show details at the knee joint (pAC= prospective articular cartilage). The cytoplasmic signal in (B’) is unspecific background. (C) Skeletal preparation (P1-Pit::DTR tibiae) and plot of left/right length ratio for P1-Pit::DTR or control femur and tibia from mice collected as indicated. Analysis was done by 2-way ANOVA (alpha = 0.05, Bone Identity and Genotype as variables, p-value for Genotype was 0.0177 at 3dpi, < 0.0001 at 63-69dpi) followed by Sidak’s posthoc multiple comparisons test (p-values shown in Figure).
Figure 1—figure supplement 1
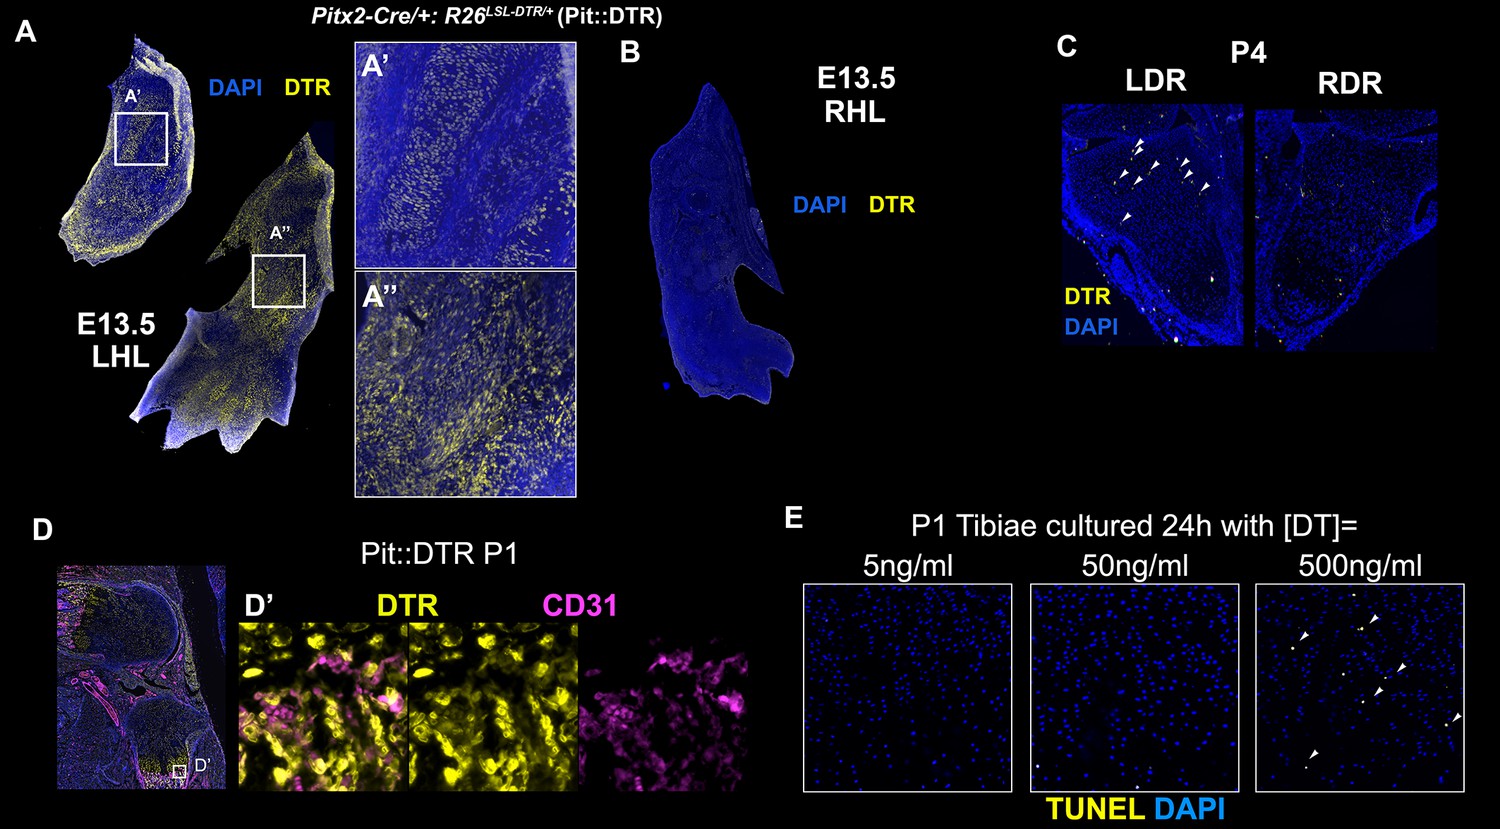
Characterization of the Pitx2-Cre derived cell lineage.
(A–C) Immunohistochemical detection of DTR in left (A) and right (B) hindlimbs (LHL and RHL) of Pitx2-Cre/+; R26LSL-DTR/+ (Pit::DTR) mice at E13.5 and in distal radii (LDR and RDR) at P4 (C). Note that DTR expression in the forelimb (arrowheads) is much more sparse than in the hindlimbs. n = 2 for each stage. (D, D’) CD31 and DTR double staining in the knee area at P1 reveals that blood vessels and pericytes do not express DTR [n = 3, inset in (D) is magnified and channel-split in (D’) ]. (E) Histochemical analysis of cell death (TUNEL) in frontal sections of P1-Pit::DTR tibiae cultured 24 hr with the indicated concentrations of DT (n = 3 for each concentration). Arrowheads= apoptotic chondrocytes in the core of the GP.
Figure 2 with 1 supplement

Reduced chondrocyte proliferation and maturation underlie the growth defect of the left bones of P1-Pit::DTR mice.
(A) The fraction of EdU+ nuclei in the PZ was calculated for left and right proximal tibia GPs 2dpi and represented as L/R ratio (mean ± SD). p-value for unpaired two-tailed Mann-Whitney test between control and experimental ratios is shown. (B, D) The PZ and HZ of left and right GPs were measured on hematoxylin and eosin-stained sections of P1-Pit::DTR proximal tibia GPs, 4dpi (D), and represented as L/R ratios (B) 3–4 sections per GP, n = 4 mice, mean ± SD are shown). 2-way ANOVA (variables: Genotype and GP region, alpha = 0.05, p-value=0.0118 for Genotype) followed by Sidak’s posthoc multiple comparisons test (p-values shown) was used. Insets in (D) show magnifications of the boxed regions. (C) RNA in situ hybridization for Col10a1 in the proximal tibia GP at 3dpi. (E, F) The secondary ossification centers (SOCs, arrowheads in E) appear later and their subsequent area (quantified in F) is reduced in the left P1-Pit::DTR skeletal elements. Analysis was done by 2-way ANOVA (variables: SOC location and Side, alpha = 0.05, p-value=0.0003 for Side) followed by Sidak’s posthoc multiple comparisons test (p-values shown in Figure). Asterisk= reduced expression. See also associated Figure 2—figure supplement 1.
Figure 2—figure supplement 1
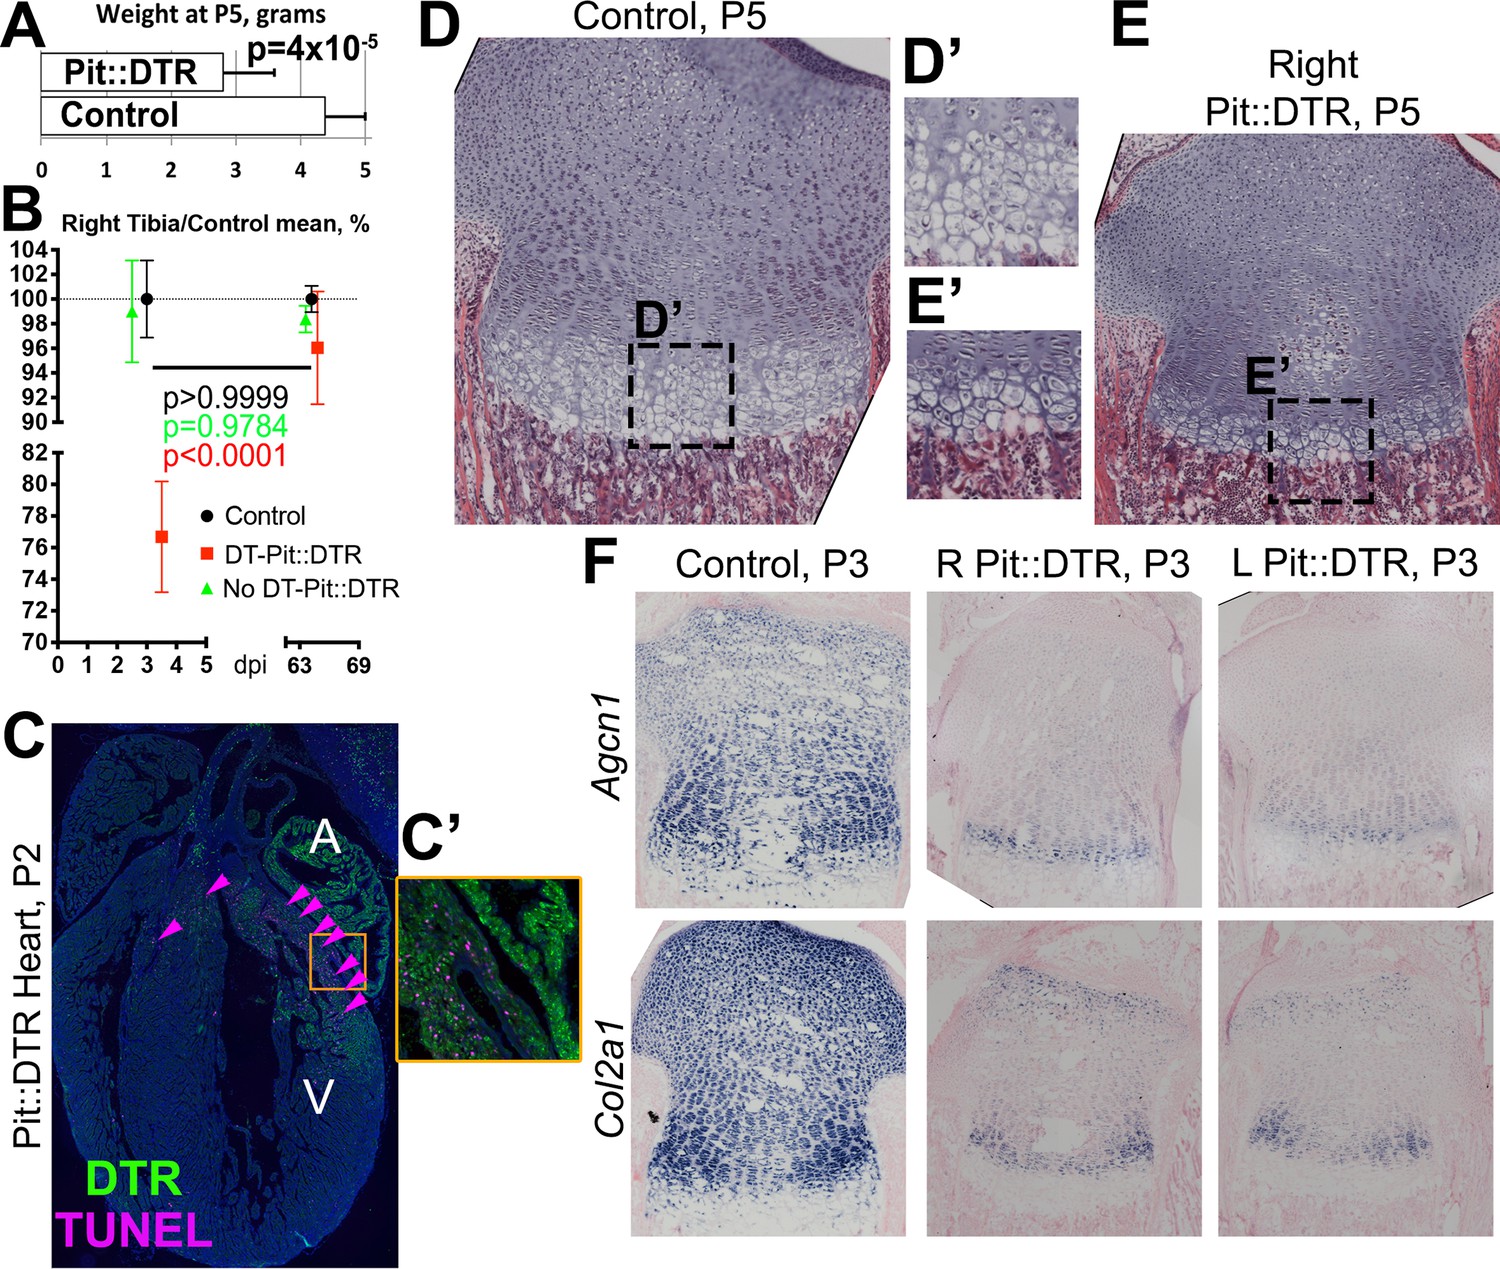
Bone growth impairment in Pit::DTR animals takes place on top of a systemic growth delay likely caused by injury-induced hypophagia.
(A) Comparison of body weight (mean ± SD) between control and P1-Pit::DTR pups at P5 (n = 18 controls, five experimental). (B) Relative length of the right tibia from control (black), DT-injected (red) and PBS-injected (green) Pit::DTR animals (mean ± SD, n = 4, 2 and 7, respectively, at early stages; 9, 7 and 6 long-term), normalized against the average length of the right tibia in control animals. (C and C’) DTR expression and TUNEL staining (arrowheads) in a heart section of a P1-Pit::DTR pup, 1dpi (n = 3). A, V= atrium, ventricle. Inset (C’) shows magnification of the boxed area in (C). (D–E’) Hematoxylin and eosin staining of the right GPs (internal control) from control and experimental animals at P5 (n = 4 control and four experimental mice). Note the striking difference in size, including the HZ (D’ and E’). (F) In situ hybridization for the indicated ECM components in control and experimental animals (n = 2 animals for each marker and genotype), showing the systemic delay affects ECM synthesis equally in left and right proximal tibia GPs of experimental animals.
Figure 3 with 2 supplements
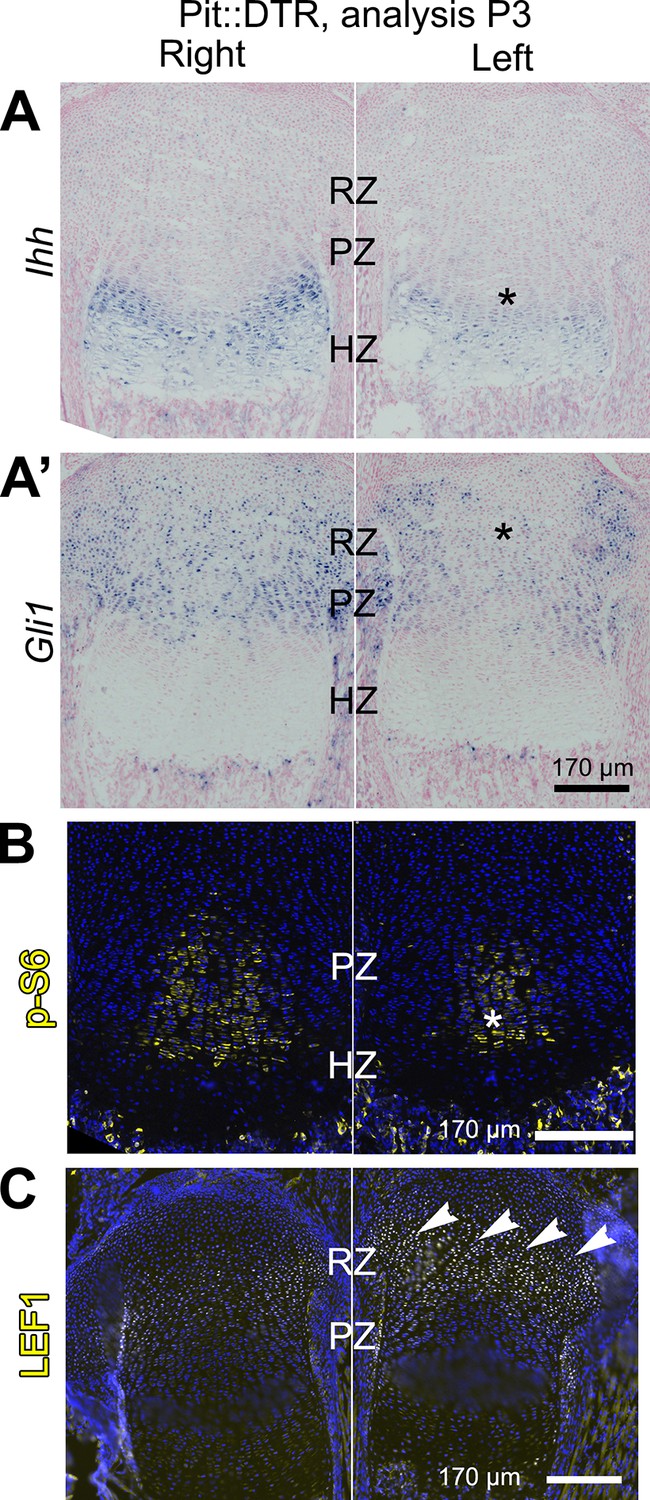
Multiple signaling pathways related to chondrocyte proliferation and maturation are altered in distinct regions of the left P1-Pit::DTR growth plate.
(A–A’) In situ hybridization for Ihh and the HH target Gli1, in the left and right proximal tibia of Pit::DTR mice, 2dpi. (B, C) Immunohistochemical staining for phosphorylated ribosomal protein S6 [(B), readout of mTORC1 activity] or for the canonical WNT target LEF1 (C), in the left and right proximal tibia of Pit::DTR mice, 2dpi. Note left-specific downregulation of p-S6 in the same region where Ihh is reduced. Arrowheads= ectopic expression, asterisks= reduced expression. See also associated Figure 3—figure supplements 1 and 2.
-
Figure 3—source data 1
Cortical bone parameters measured by µCT in P5 femora from Osx::DTR mice injected with PBS (Ctl) or DT (Exp) at P1.
- https://doi.org/10.7554/eLife.27210.008
Figure 3—figure supplement 1
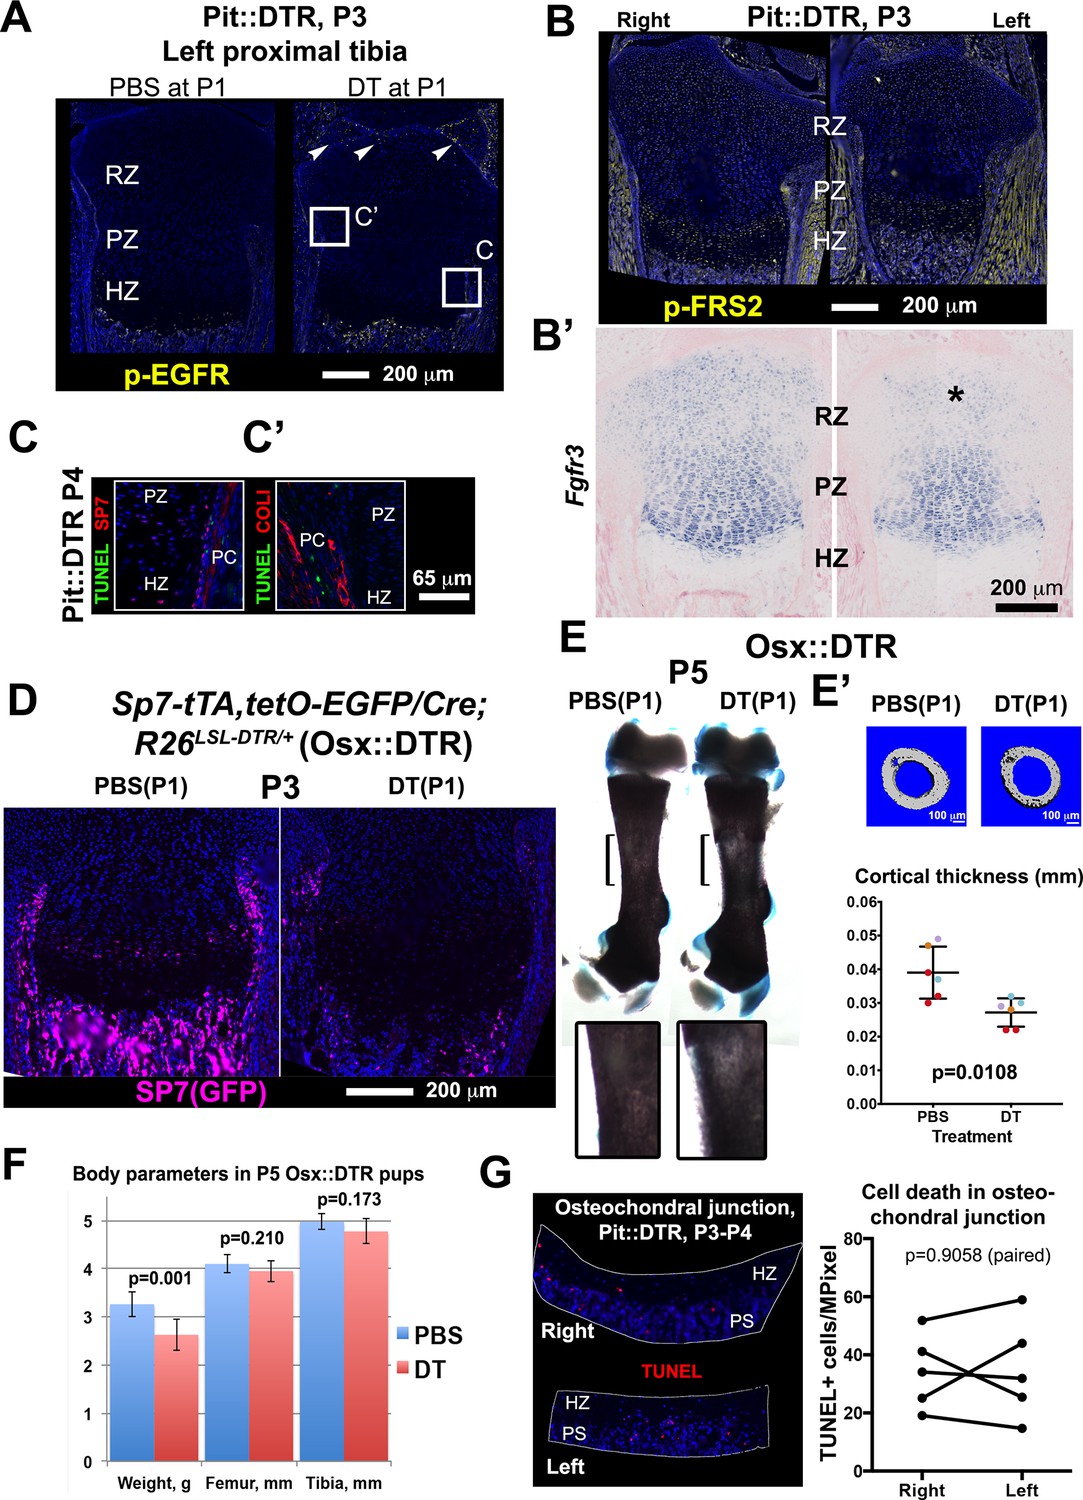
Bone growth impairment in P1-Pit::DTR animals is not caused by increased FGF or EGF signaling in the HZ, nor by ablation of osteoprogenitors in the perichondrium or increased cell death in the osteochondral junction.
(A) Immunohistochemistry for p-EGFR did not reveal increased EGF signaling in the HZ at P3 (n = 3 PBS- and 3 DT-injected mice). Arrowheads= sparse activation of EGF signaling in the left articular cartilage. (B, B’) Immunohistochemistry for the FGF-signal transducer FRS2 and in situ hybridization for Fgfr3 did not reveal increased FGF signaling in the left HZ (n = 8, 1, and two for P3, P4 and P5). (C) Co-staining for the osteoblast lineage markers COLI or SP7 (OSX) (Maes et al., 2010) and TUNEL were done to determine whether cell death is increased in osteoprogenitors of Pit::DTR long bones. DT-mediated ablation of osteoprogenitors (also derived from the lateral plate mesoderm) could contribute to the Pit::DTR bone growth defect by impairing the generation of new bone, but no increase in osteoblast death was detected. The approximate regions of (C) are indicated in (A) as a reference. (D–F) To further rule out a possible contribution of early osteoblast precursor ablation to the phenotype, we crossed Sp7-tTA,tetO-EGFP/Cre mice (Rodda and McMahon, 2006) with R26LSL-DTR animals to generate Sp7-tTA,tetO-EGFP/Cre; R26LSL-DTR mice (Osx::DTR). These animals were injected with either DT or PBS at P1. DT-injected Osx::DTR mice showed an almost complete depletion of osteoprogenitors 2dpi (D) and reduced thickness of the cortical bone as compared to PBS-injected animals (E, insets show a 2.5x magnification of the bracketed area; E’ shows µCT images and cortical thickness quantification of the midshaft femoral region, color-coded by litter of origin, n = 6 PBS-treated and 6 DT-treated mice, p-value for unpaired Mann Whitney test is shown. See associated Source Data 1). However, no consistent reduction of bone length was observed at P5 (F n = 8 PBS- and 7 DT-injected pups), ruling out a major contribution of osteoprogenitor ablation to the Pit::DTR phenotype. Note that although DT-injected mice weighed significantly less than PBS-injected ones, their bones were not significantly shorter. (G) Quantification of the density of apoptotic cells at the osteochondral junction of Pit::DTR pups 2-3dpi. The aim of the experiment was to test whether an increase in cell death at the osteochondral junction (where hypertrophic chondrocytes die by apoptosis and the cartilage is replaced by bone) could contribute to the observed reduction in the height of the HZ due to chondrocytes were being eliminated faster than produced. Note, no significant differences were detected between left and right GPs (n = 5 pups, 2–3 sections per limb). PS= primary spongiosa. The graph shows left and right paired data (TUNEL+ cells per area) for each animal, which were compared by a ratio paired t-test.
Figure 3—figure supplement 2
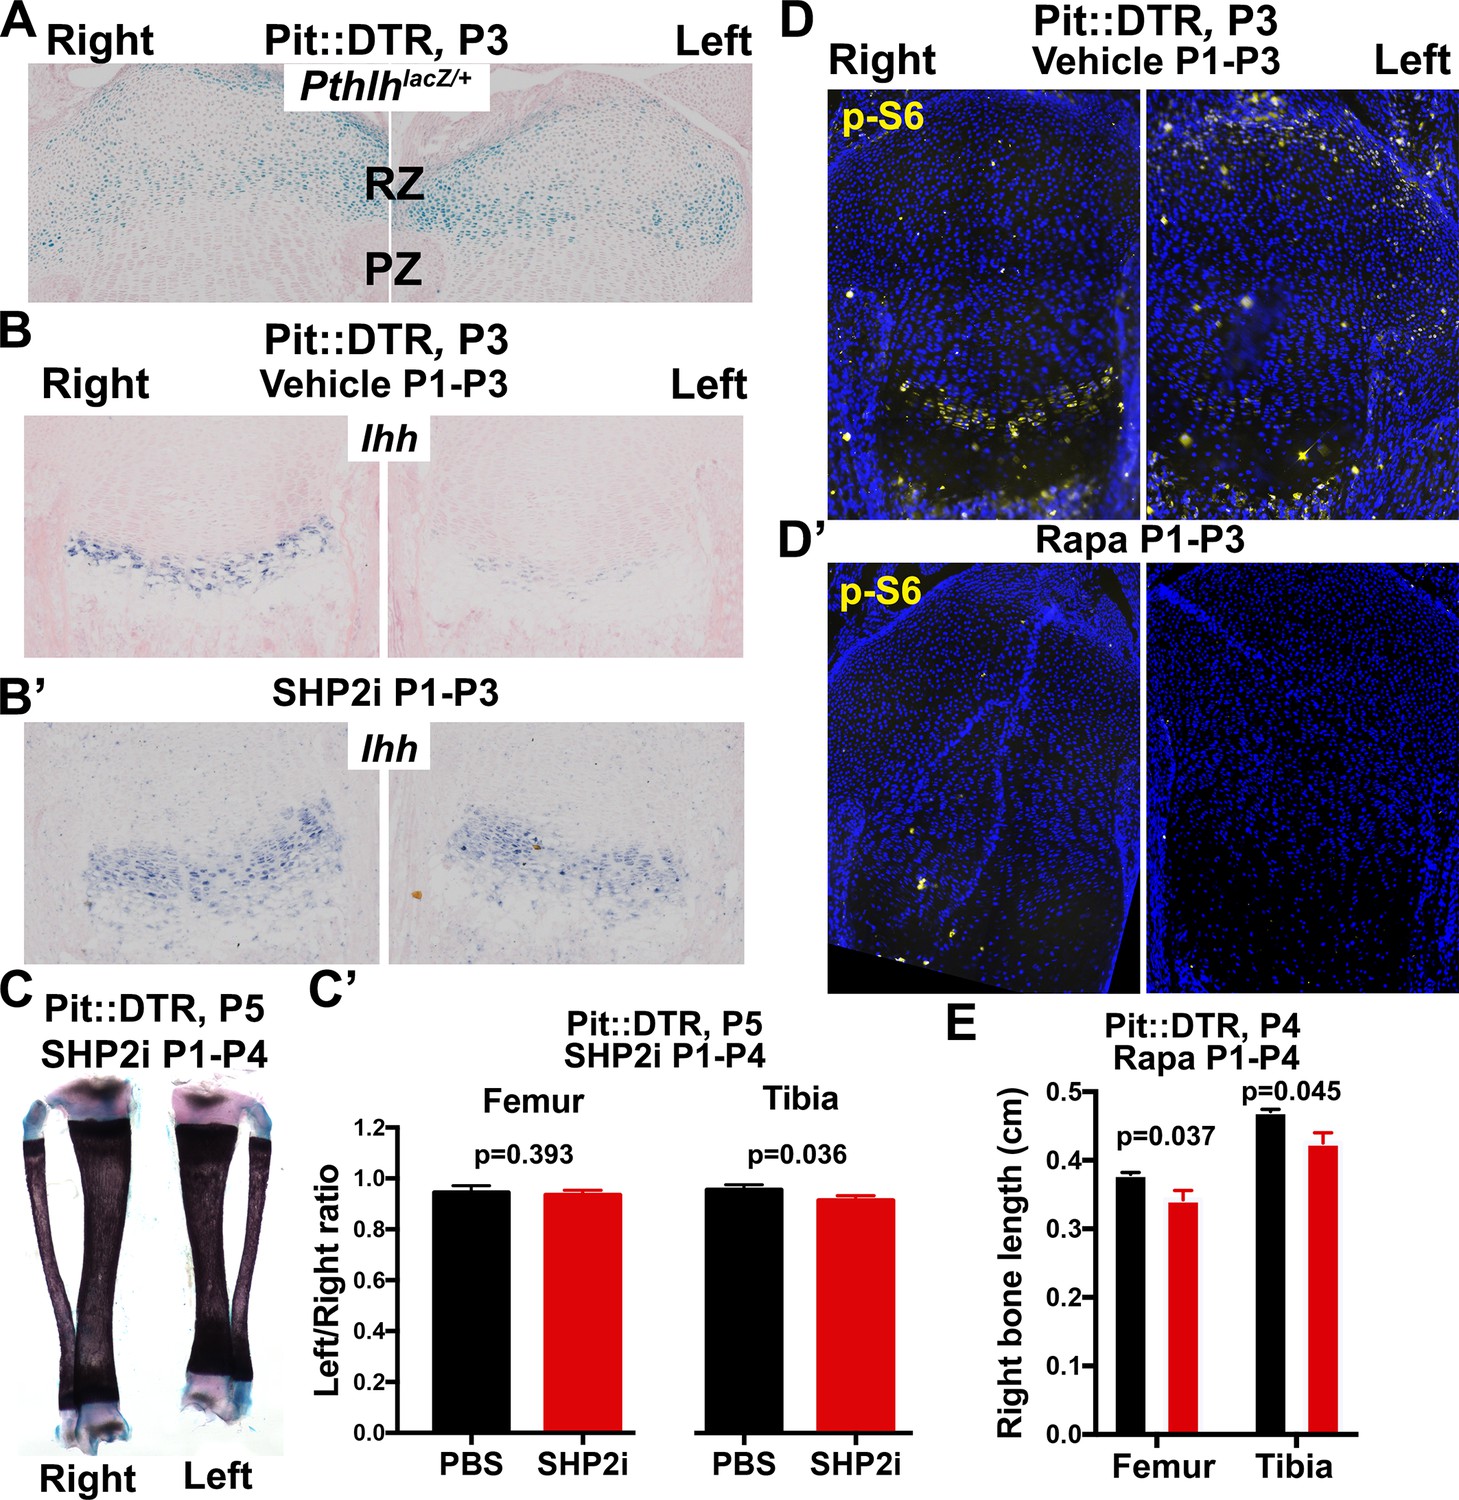
Characterization of the role of IHH and mTOR in the signaling and growth defects of P1-Pit::DTR mice.
(A) X-gal staining to detect Pthlh expression, in the left and right proximal tibia of Pit::DTR; PthlhlacZ/+ mice (Chen et al., 2006), 2dpi (n = 3 at P3 and 2 at P4). (B–C’) Treatment of P1-Pit::DTR pups with the SHP2 inhibitor NSC-87877 (5 mg/kg s.c. daily from P1) was found to rescue Ihh expression in the left GP at P3 (B and B’, n = 2 and 6 with partial and full rescue, respectively) but it did not rescue bone growth by P5 (C, frontal view of the tibiae, and C’, n = 5 control and three experimental animals). p-values for unpaired Mann Whitney test (SHP2i vs. vehicle for each bone) are shown. (D, D’) p-S6 expression in proximal tibiae from vehicle-treated (D) or rapamycin-treated (D’) P1-Pit::DTR pups, showing dependence on mTORC1 activity. n = 2 at P3, two at P4. (E) Length of the right (control) bones of P4 Pit::DTR pups, treated with vehicle (n = 3) or rapamycin (n = 3) from P1 to P4. Analysis was done by 2-way ANOVA (alpha = 0.05, Treatment and Bone as variables, p=0.0079 for Treatment) followed by Sidak’s posthoc multiple comparisons test (p-values shown in Figure).
Figure 4 with 3 supplements
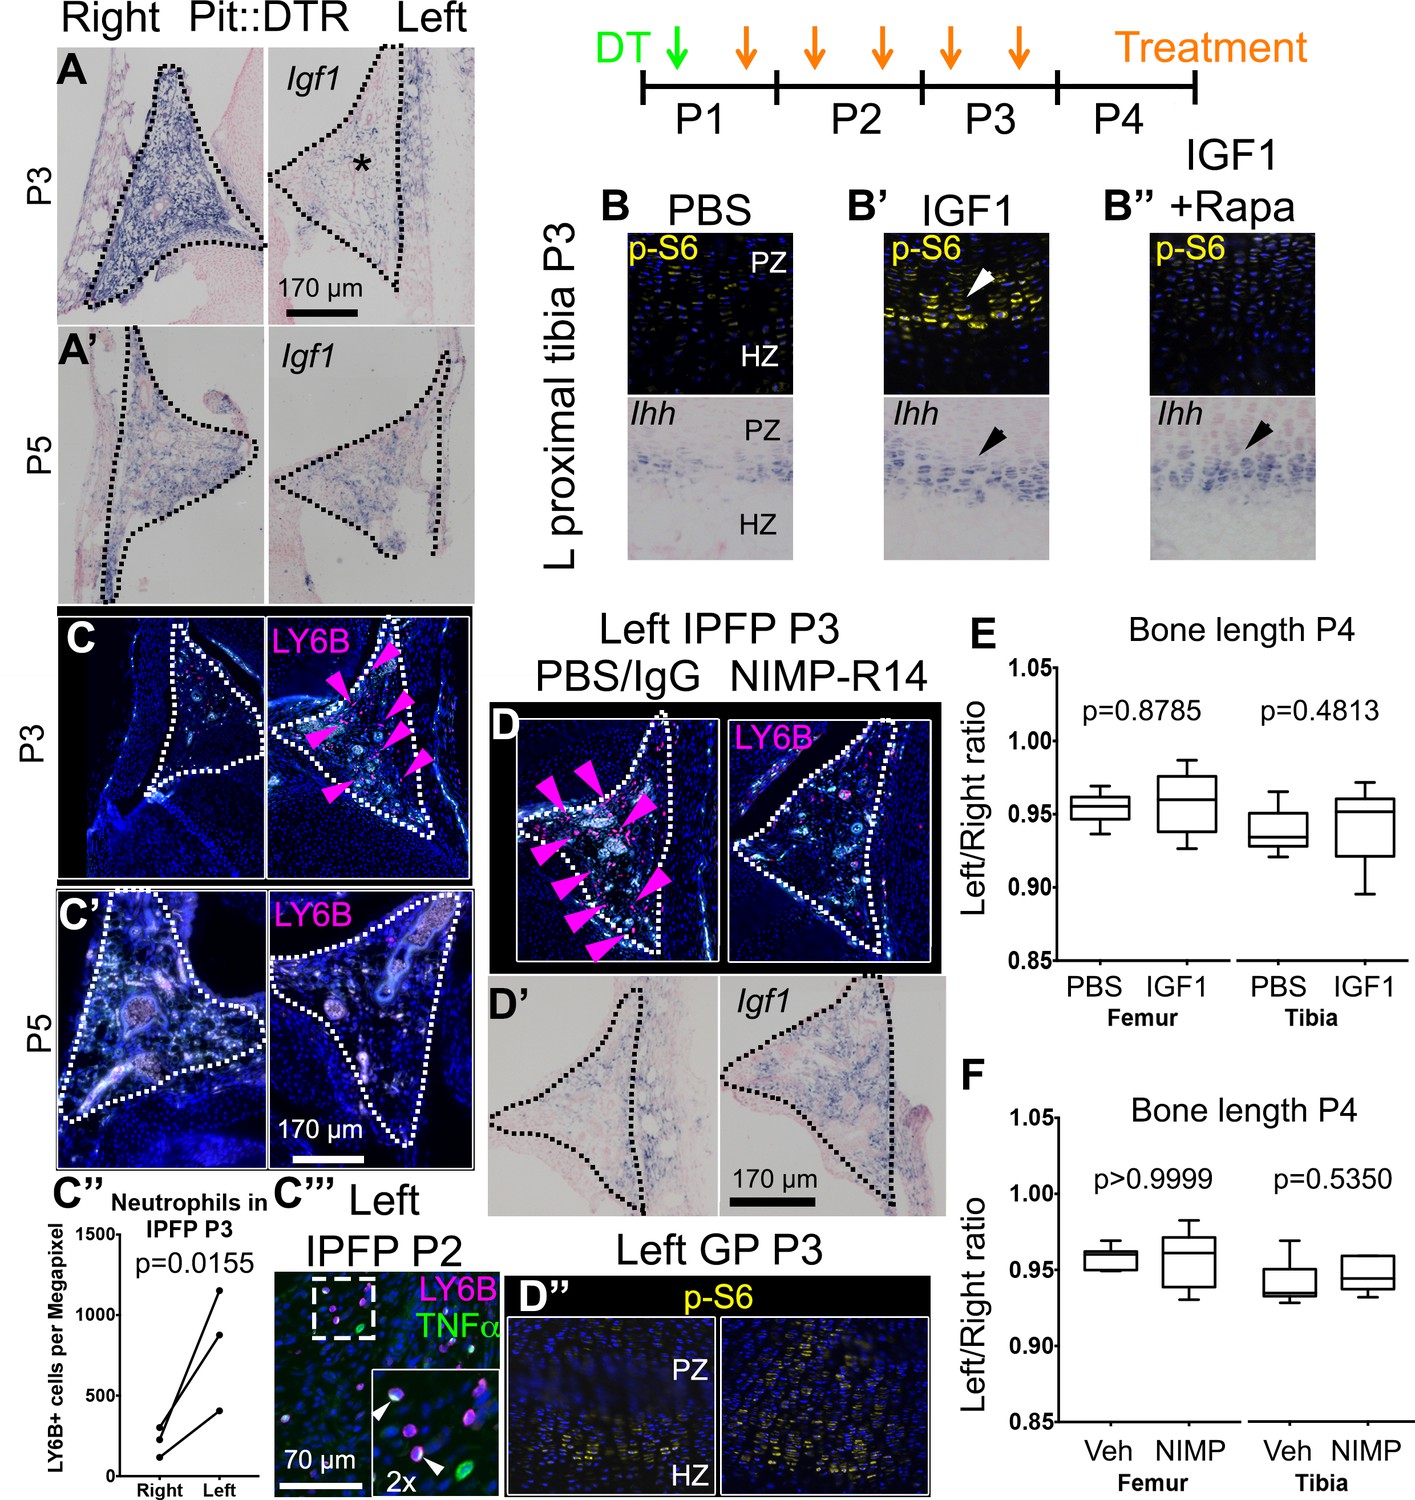
Injury-induced inflammation in the left infrapatellar fat pad reduces local Igf1 expression in the DT-impaired growth plate.
(A, A’) In situ hybridization for Igf1 in the infrapatellar fat pad (IPFP, dotted lines) of left and right P1-Pit::DTR knees, at P3 (A) and P5 (A’). (B–B’’) Immunohistochemistry for the mTORC1 readout p-S6 (top), and RNA in situ hybridization for Ihh (bottom) in left P1-Pit::DTR GPs at P3, following intraarticular injection of PBS (B), IGF1 (B’) or IGF1 combined with i.p. injection of the mTORC1 inhibitor rapamycin (B’’). (C–C’’’) Immunohistochemistry for the neutrophil marker LY6B in the IPFP (dotted lines) of left and right P1-Pit::DTR knees, at P3 (C), P5 (C’) and P2 (C’’’). The inset in (C’’’) is a 2x magnification showing that some neutrophils express TNFα in a cellular compartment. Turquoise signal= autofluorescent cells. The graph in (C’’) represents the density of LY6B+ cells in left and right P1-Pit::DTR IPFP at P3 (n = 3 mice, 3–4 sections per animal). A ratio paired t-test was used to offset the variability between absolute measurements. (D–D’’) Immunoblockade of neutrophil infiltration with NIMP-R14 antibody after DT injection (D) rescues Igf1 expression in the left IPFP (D’), as well as mTORC1 signaling in the GP, 2dpi (D’’). (E, F) Quantification of bone length at P4, expressed as Left/Right ratio, for vehicle (Veh, either PBS or IgG)-treated and IGF1- (E) or NIMP-R14-treated (F) mice (unpaired two-tailed Mann-Whitney test). See also associated Figure 4—figure supplement 1–3.
Figure 4—figure supplement 1
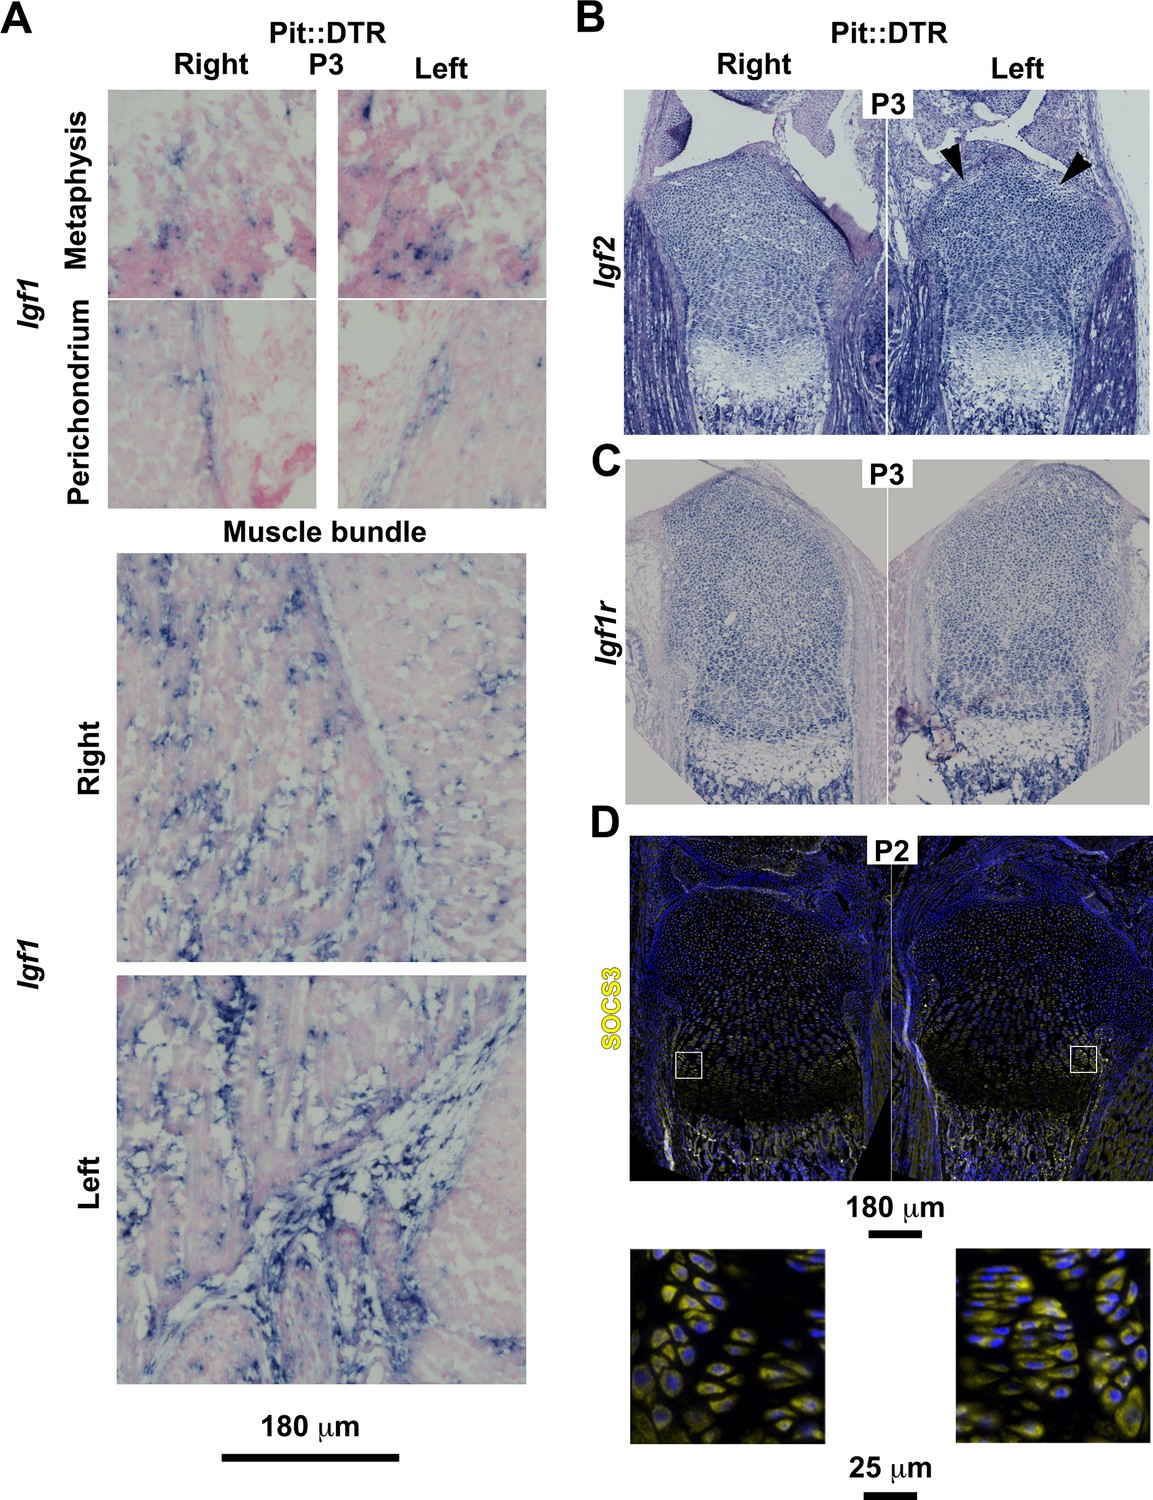
Characterization of the IGF signaling axis in P1-Pit::DTR mice.
(A) In situ hybridization for Igf1 in the indicated tissues of P1-Pit::DTR mice, 2dpi (metaphysis from femora, rest from tibiae). To properly compare expression domains that depend on the section level, whole slide imaging was performed on sections from five animals with a slide scanner, and representative images are shown. (B–C) Representative examples of Igf2 (B, n = 3, tibiae are shown) and Igf1r expression (C, n = 4, femora are shown) in left and right GPs and surrounding tissues of P1-Pit::DTR mice. Arrowheads in (B) point to damaged regions of the left prospective articular cartilage where Igf2 expression was somewhat diminished. (D) Immunohistochemistry for SOCS3 in the GPs and surrounding tissues of P1-Pit::DTR mice (n = 4 at P2, three at P3, tibiae are shown). Magnified views of the boxed regions are shown below the overviews.
Figure 4—figure supplement 2
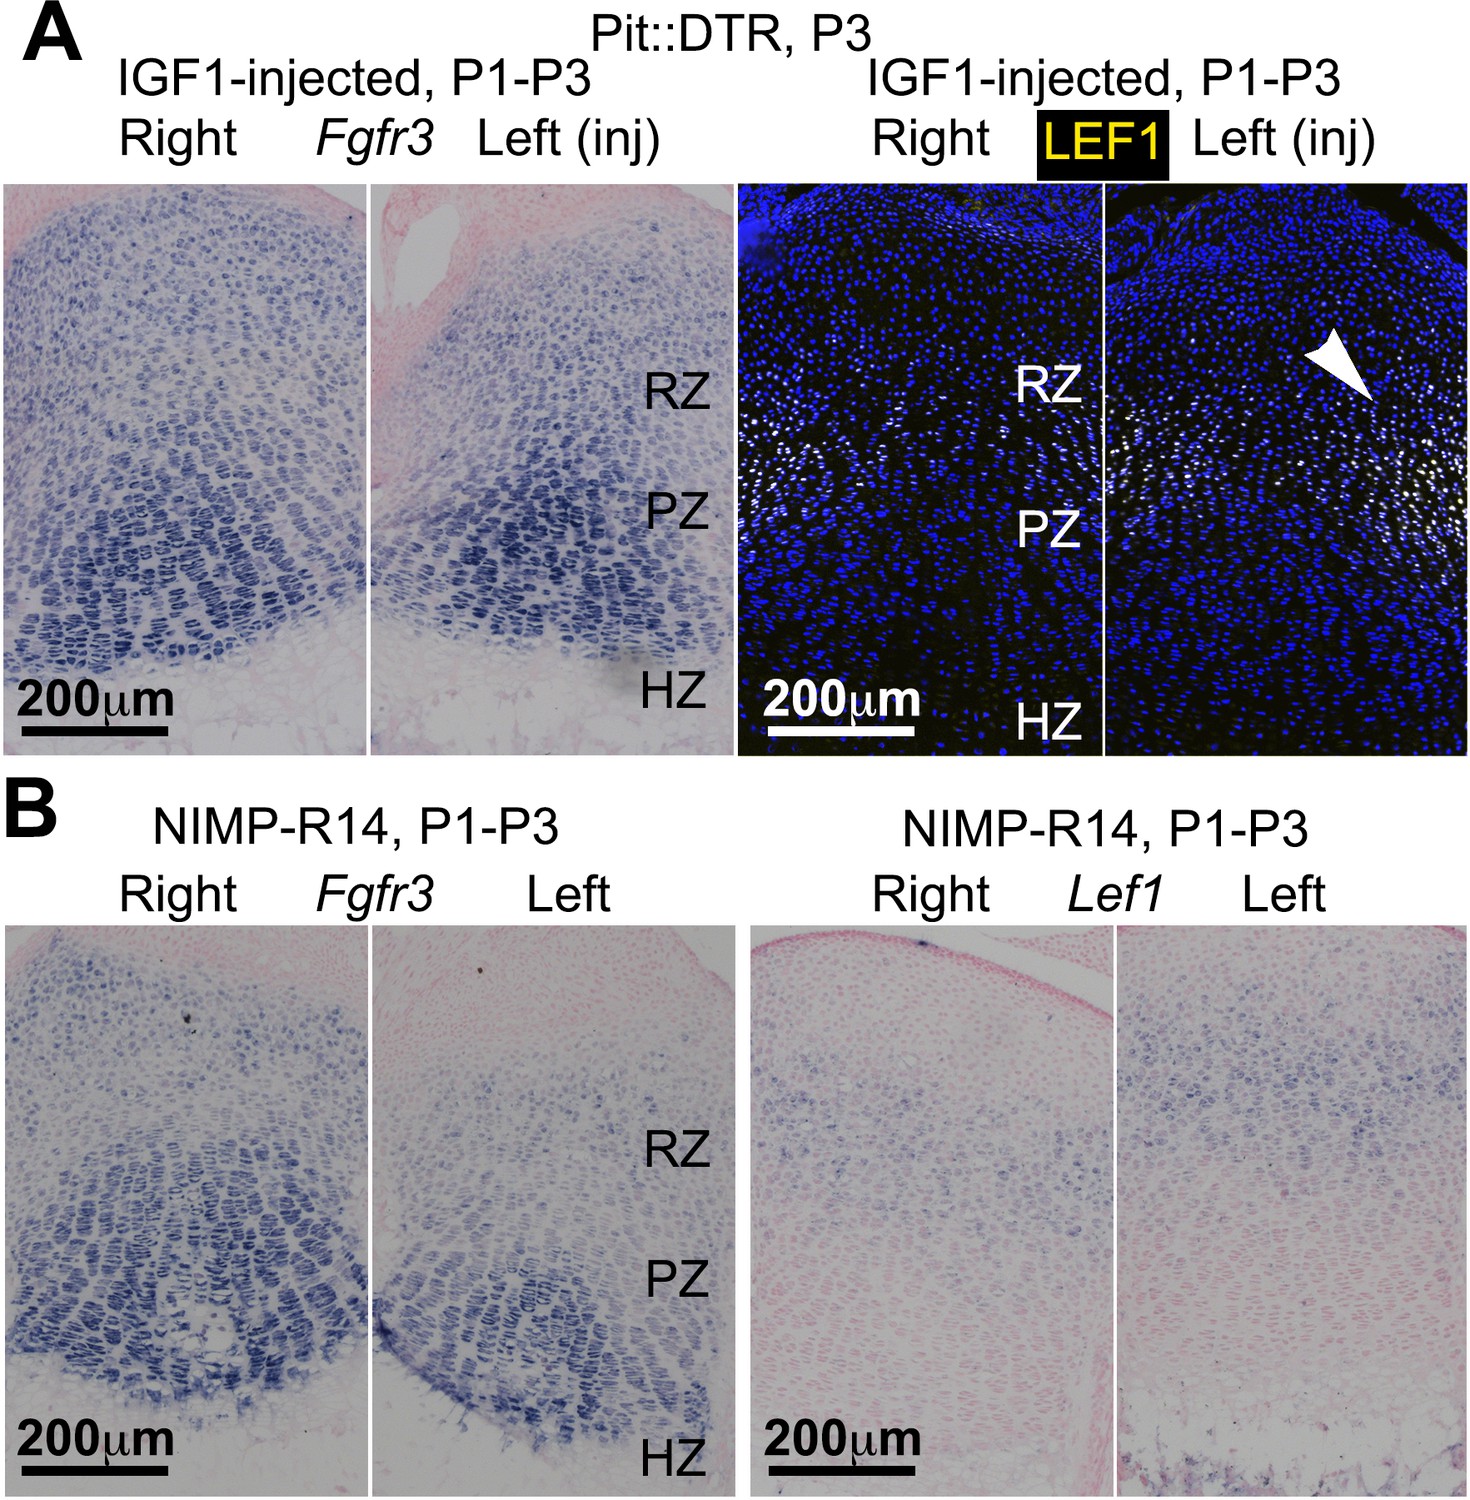
IGF1 supplementation or neutrophil immunoblockade do not rescue all the signaling changes in the left RZ of P1-Pit::DTR mice.
(A, B) In situ hybridization for Fgfr3 and Lef1 in left and right P1-Pit::DTR tibiae from P3 mice treated either with IGF1 (A, n = 3) or an anti-neutrophil antibody (B, n = 4). Note that only Lef1 expression in the left GP remains consistently increased in both conditions.
Figure 4—figure supplement 3

Multiple immune cells are recruited to the infrapatellar fat pad of Pit::DTR mice, which correlates with local Igf1 downregulation.
(A–B) IHC for general macrophage markers in the IPFP of Pit::DTR mice at P4. Quantifications are shown in (A’), a ratio paired t-test was used to compare left and right macrophage density in the IPFP of Pit::DTR mice. (C) Immunostaining for the neutrophil marker LY6B and in situ hybridization for Igf1 in the IPFP of LPS-injected (left knee) WT mice. (D) Immunostaining for the neutrophil marker LY6B and in situ cell death detection (TUNEL) in the IPFP of LPS-injected (left knee) WT mice.
Figure 5 with 1 supplement
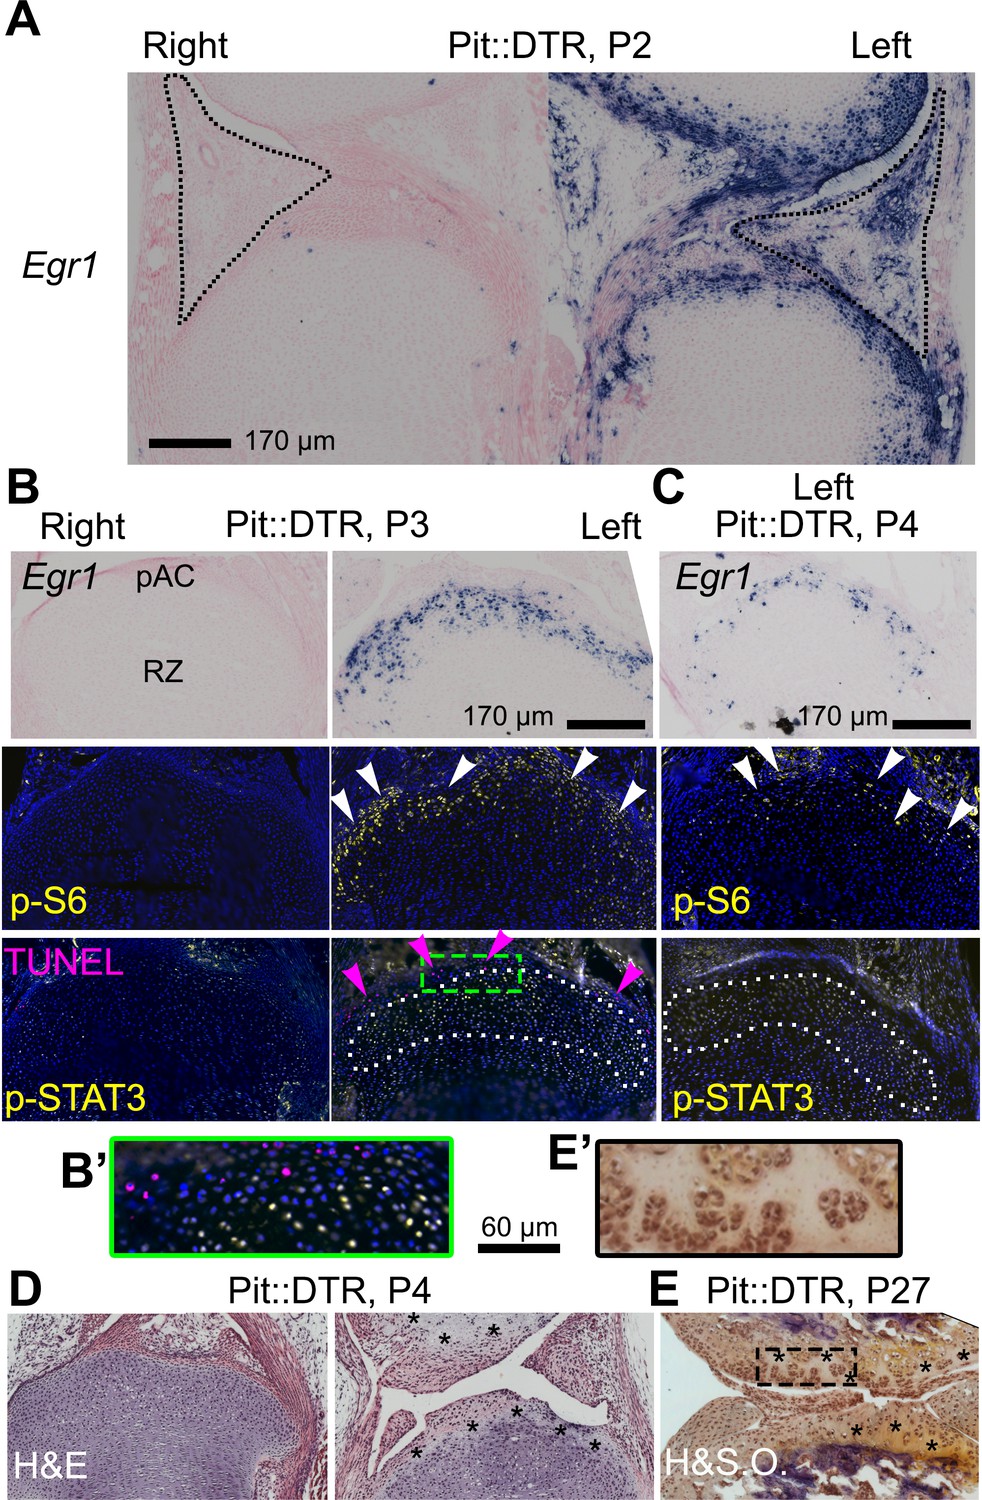
The injury response in the articular cartilage of P1-Pit::DTR mice correlates with signaling changes in the resting zone and impaired bone growth.
(A) Expression of the immediate-early marker Egr1 1dpi. Dotted area= IPFP. (B, C) Expression of Egr1 and the indicated signaling effectors (white arrows) and cell death (pink arrows) in the prospective articular cartilage (pAC), two (B) and three dpi (C). Dotted area= extent of p-STAT3 signal. (D, E) Hematoxylin and eosin (H&E) and hematoxylin and safranin O (H&SO) analysis of the pAC/AC, showing extensive damage at P4 (D), persistent at P27 (E). Magnifications of the boxes in (B) and (E) are shown in (B’) and (E’), respectively. See also associated Figure 5—figure supplement 1.
Figure 5—figure supplement 1
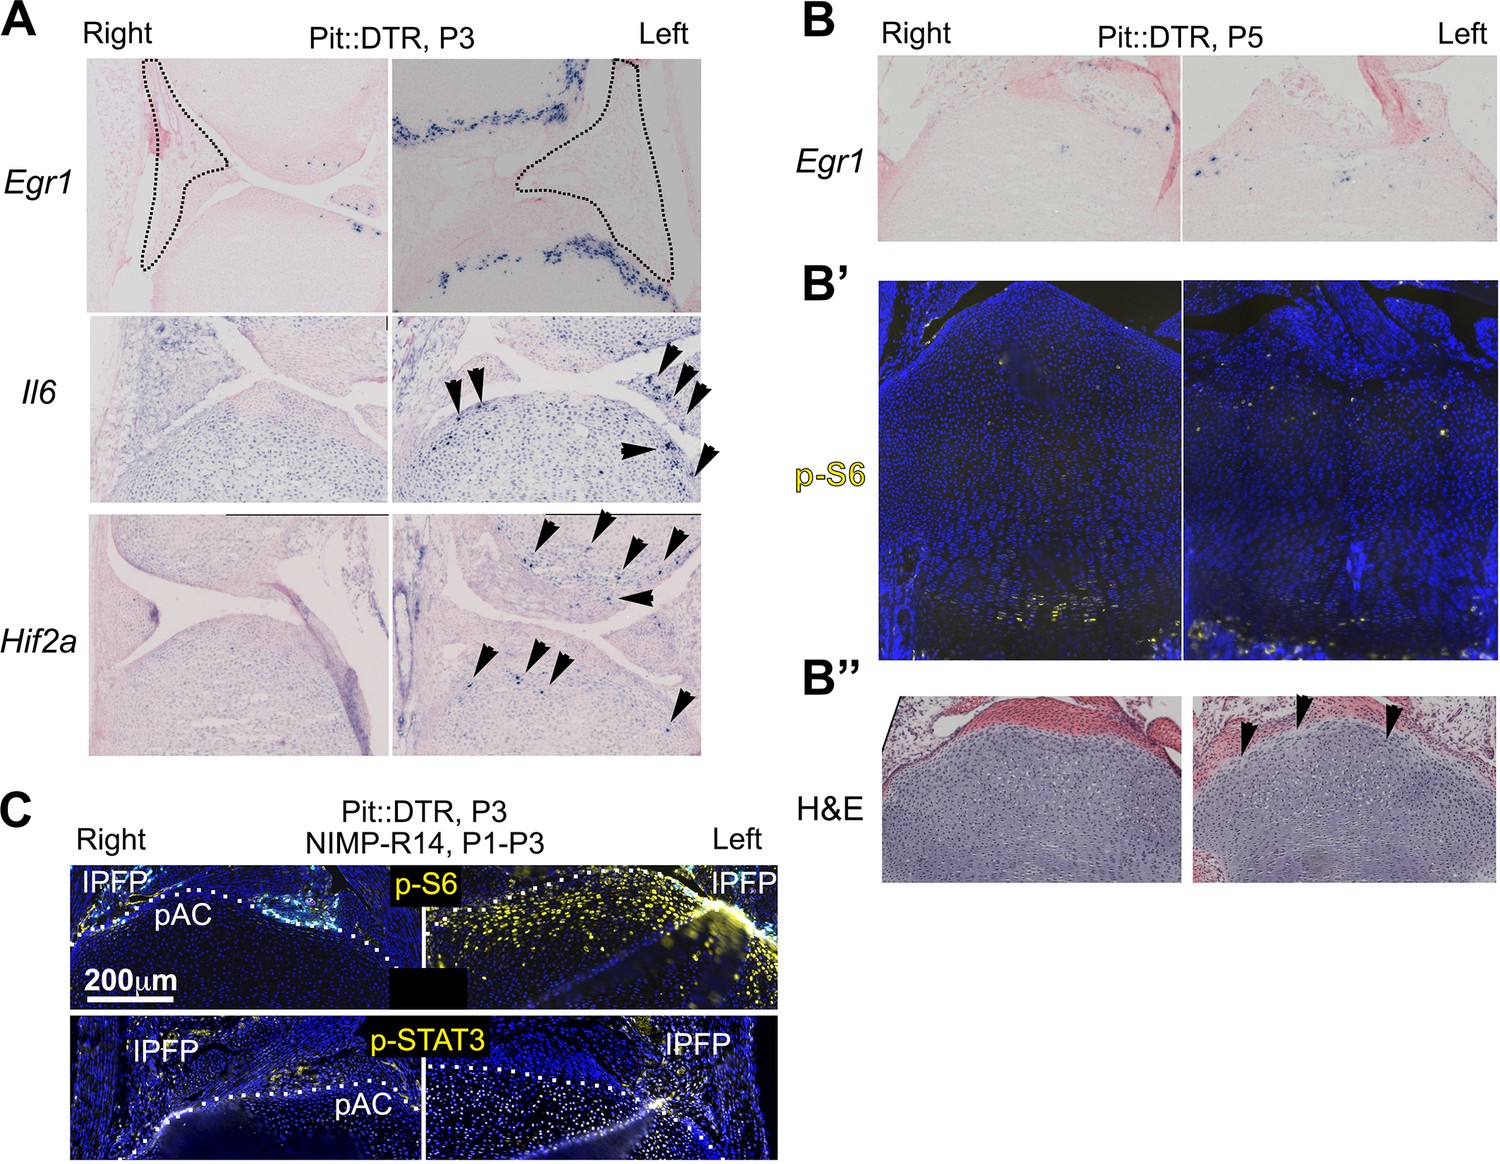
Characterization of the injury response in P1-Pit::DTR mice.
(A–B’’) Features of the injury response in P1-Pit::DTR knee joints and proximal tibiae at P3 (A) in situ hybridization) and P5 (B, in situ hybridization, B’, immunohistochemistry, B’’, hematoxylin and eosin). n = 2, 6, 2, two at P2, P3, P4, P5. (C) Immunohistochemical staining for p-S6 and p-STAT3 in left and right P1-Pit::DTR tibiae from P3 mice treated with NIMP-R14. Dotted lines delimit the prospective articular cartilage (pAC). IPFP= infrapatellar fat pad.
Figure 6 with 1 supplement

Combined inhibition of the injury response cascade and intraarticular IGF1 injection rescues DT-impaired femur growth.
(A, B) Representative femur preparations (A) and quantification of left/right length ratio of P1-Pit::DTR bones at P4 (B) after in vivo treatment with the indicated substances (n = 8, 7, 5, 11 for PBS, IGF1, Ruxo, IGF1+Ruxo, respectively). The parallel treatments were compared by two-way ANOVA with Bone and Treatment as variables (alpha = 0.05, p=0.0066 for Treatment, 0.0678 for Bone), followed by Sidak’s posthoc multiple comparisons test (only the p-values lower or close to 0.05 are shown in the Figure). (C, D) Summary of signaling changes in the IPFP and pAC after mesenchymal cell death outside the GP, and their interaction with GP signaling and bone growth. In (D), the postnatal stages at which each pathway operates are indicated. (E) Speculative model for the regulation of Lef1 and Ihh in the experimental GP. Green/Red lettering indicates, respectively, pathways up/downregulated following inflammation and injury response. See also associated Figure 6—figure supplement 1.
Figure 6—figure supplement 1
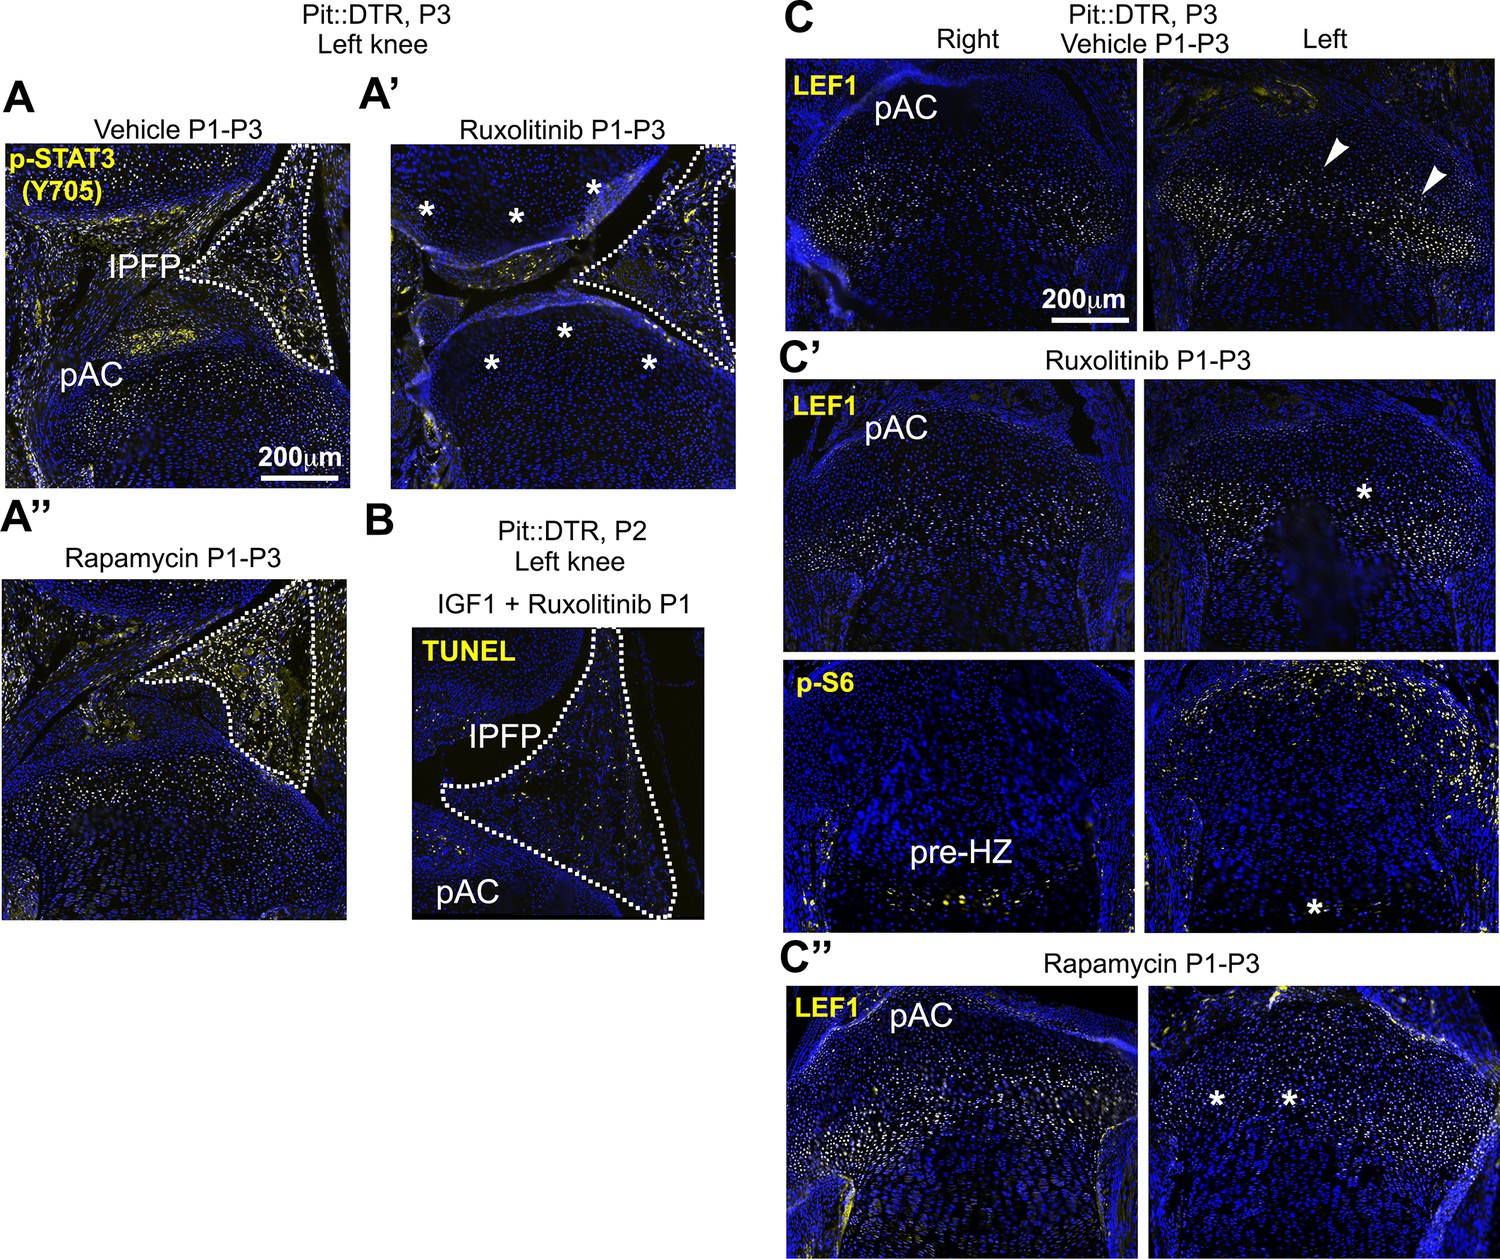
Inhibition of JAK1/2 or mTORC1 activity prevents the upregulation of LEF1 in P1-Pit::DTR mice.
(A–A’’) STAT3 signaling in the AC/RZ of P1-Pit::DTR tibiae (A) is inhibited in mice treated with the JAK1/2 inhibitor ruxolitinib (A’) but not in mice treated with the mTORC1 inhibitor rapamycin (A’’). n = 2 vehicle-treated, two ruxolitinib-treated and three rapamycin-treated Pit::DTR pups. Dotted lines= IPFP. (B) TUNEL staining is not rescued in the left IPFP (dotted lines) of IGF1- and ruxolitinib-injected P1-Pit::DTR pups (n = 3 at P2). (C–C’’) LEF1 but not p-S6 levels are normalized in the left RZ of ruxolitinib-treated P1-Pit::DTR pups (C’, n = 2), as compared to the vehicle-treated animals (C, n = 2). Similarly, LEF1 levels are not elevated in the left RZ of rapamycin-treated P1-Pit::DTR pups (C’’, n = 3). Arrowheads= regions of elevated LEF1 levels. Asterisks= loss of expression as compared with vehicle-treated.
Figure 7 with 1 supplement
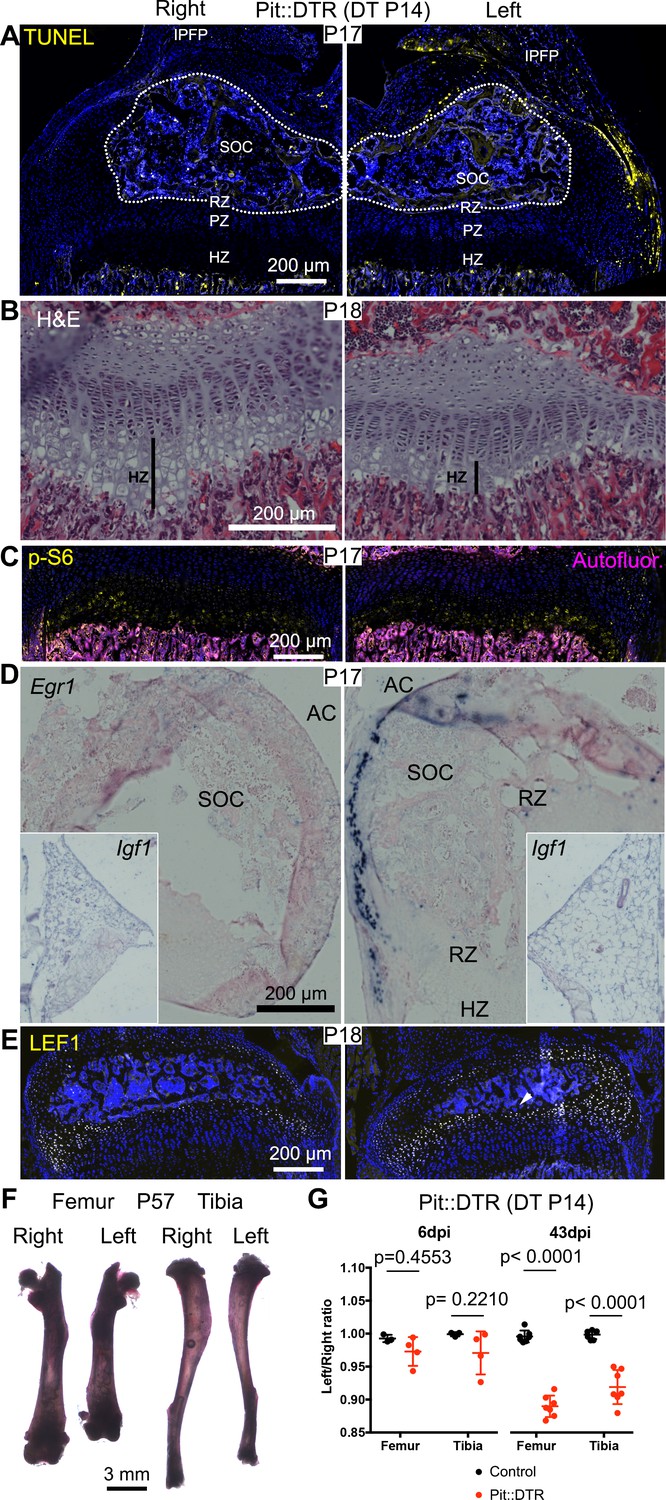
Induction of soft-tissue cell death at P14 also impairs bone growth.
(A) TUNEL staining (arrowheads) in sagittal section of P17 proximal tibia from Pit::DTR mice injected DT at P14 (P14-Pit::DTR). SOC= secondary ossification center (outlined). (B) Hematoxylin and eosin-stained sagittal sections of P18 distal femur from P14-Pit::DTR mice. Vertical bars indicate the length of the HZ. (C) Immunostaining for p-S6 in the GP of P14-Pit::DTR mice at P17. (D, E) In situ hybridization for Egr1 (D) and Igf1 (D, insets) and LEF1 immunostaining (E) in knees from P14-Pit::DTR mice. (F) Alizarin red staining of the skeletal elements from a representative P14-Pit::DTR mouse at P57. (G) Quantification of the left/right length ratio for femora and tibiae of P20 and P57 Control and P14-Pit::DTR mice. Analysis was done by 2-way ANOVA (alpha = 0.05, Bone Identity and Genotype as variables, p-value for Genotype was 0.1970 at P20 and < 0.0001 at P57) followed by Sidak’s posthoc multiple comparisons test (p-values shown in Figure). Arrowheads denote ectopic expression. AC= articular cartilage. RZ, PZ, HZ= resting, proliferative, hypertrophic zones. IPFP= infrapatellar fat pad. See also associated Figure 7—figure supplement 1.
Figure 7—figure supplement 1
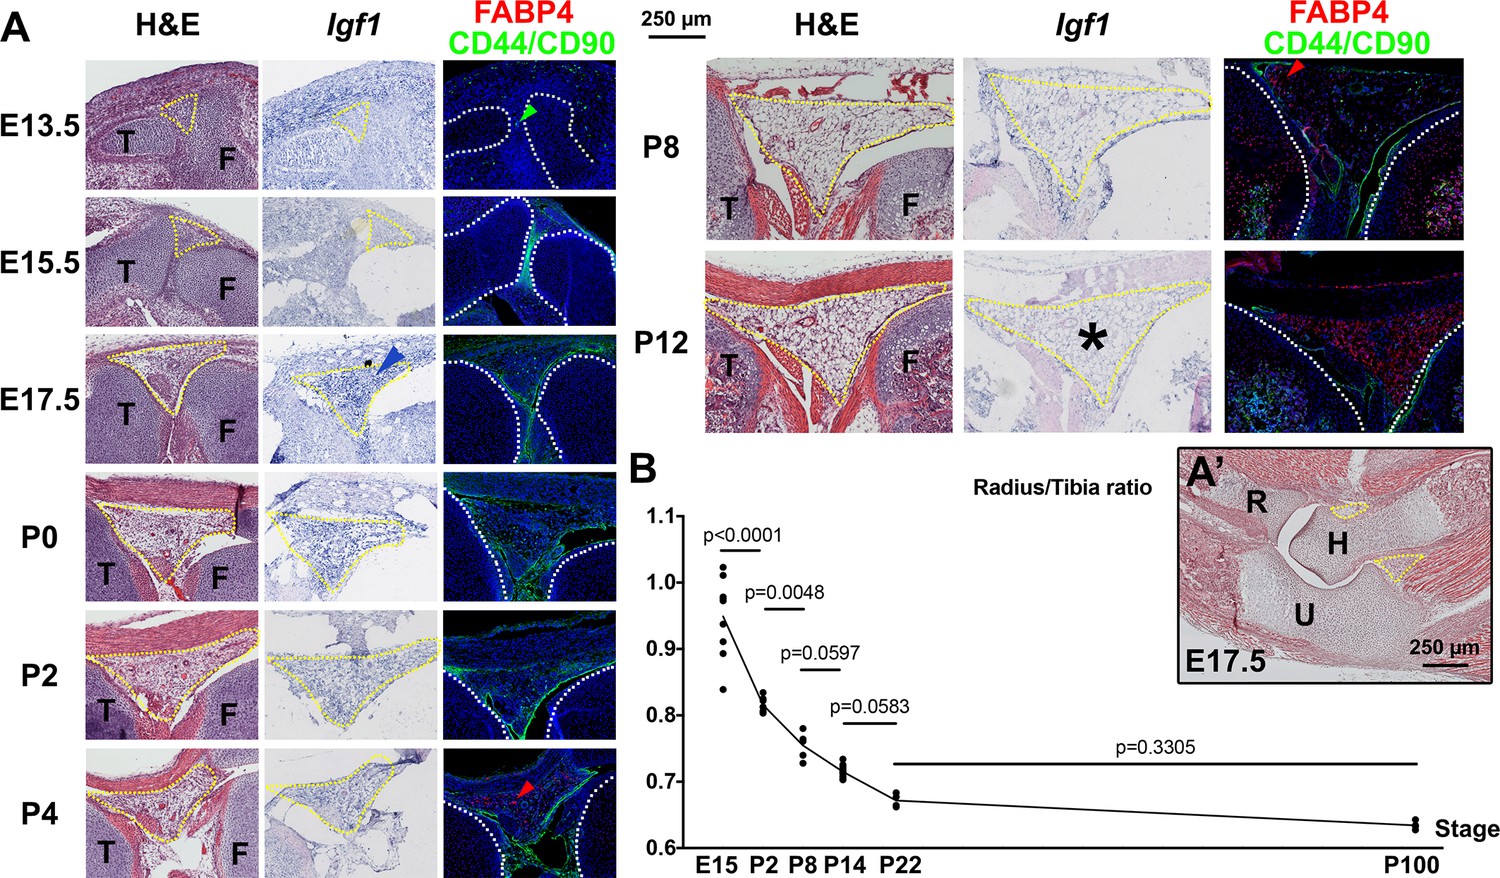
Developmental description of infrapatellar fat pad formation and correlation with limb allometry.
(A–A’) Developmental progression of the knee interzone/infrapatellar fat pad region (A) at the indicated stages, and the elbow region at E17.5 (A’). Hematoxylin and eosin (H&E), Igf1 expression and FABP4 (adipocyte marker) and CD44 plus CD90 (mesenchymal cell markers) immunohistochemistry are shown in (A). At least two specimens per stage and technique were examined. Color-coded arrowheads point to cells expressing the marker of the corresponding color. Yellow and white dotted lines delineate, respectively, the fat pads and the cartilage anlagen. Asterisks denote lack of detectable expression. F, T, H, R, U= femur, tibia, humerus, radius, ulna. (B) Radius/Tibia length ratio in WT mice at the indicated stages (at least four animals per stage). Data were analyzed by one-way ANOVA with Stage as variable (alpha = 0.05, p<0.0001). p-values for Sidak’s multiple comparisons test (comparing each stage with the preceding one) are shown. Note that the ratio stabilizes between P8 and P14, coinciding with the cessation of Igf1 expression in the infrapatellar fat pad.
Author response image 1
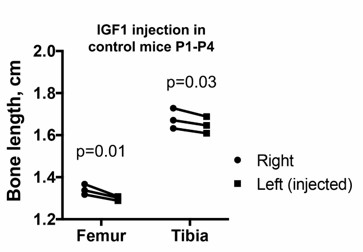
Left and right bone length in P5 PitDTR animals that were not injected with DT, but that were injected with IGF1 in the left knee from P1 to P4, twice daily. p-values for multiple comparisons test after two-way ANOVA are shown.
https://doi.org/10.7554/eLife.27210.022Tables
Table 1
Sequence of the primers used to amplify template for riboprobe synthesis from cDNA.
| Primer name | Sequence |
|---|---|
| Igf1 F SP6 | GCCGATTTAGGTGACACTATAGAAGTGGATGCTCTTCAGTTCGTG |
| Igf1 R T7 | GAAATTAATACGACTCACTATAGGGTGTTTTGCAGGTTGCTCAAG |
| Fgf18 F SP6 | GCCGATTTAGGTGACACTATAGAAGCCGCCTGCACTTGCCTGTG |
| Fgf18 R T7 | GAAATTAATACGACTCACTATAGGGTGGTTTCTCGCAGTTTCCTC |
| Egr1 F | GTCTTTCAGACATGACAGCGAC |
| Egr1 R SP6 | GCGATTTAGGTGACACTATAGGTGTCACACAAAAGGCACCAA |
| Lef1 F | TGAAGCCTCAACACGAACAG |
| Lef1 R SP6 | GCGATTTAGGTGACACTATAGTTTCCGAAACAACCGTTTTC |
| Hif2a F | CACTGAGACACCTGCCACCTC |
| Hif2a R SP6 | CATTTAGGTGACACTATAGGAGGCACCAGCCACCATG |
| Agc1 F | CCAGCCTGACAACTTCTTTG |
| Agc1 R T7 | GTAATACGACTCACTATAGGGGGGCACATTATGGAAGCTC |
| Fgf18 coding F | GCCGAGGAGAATGTGGACTTCCG |
| Fgf18 coding R SP6 | GCGATTTAGGTGACACTATAGCTAGCCGGGGTGAGTGGGG |
| IL6 F | CTCTGGTCTTCTGGAGTACC |
| IL6 R T7 | CGATGTTAATACGACTCACTATAGGGACCATCTGGCTAGGTAACAG |
| Mcp5 F | GCTTACTCTTCATCTGCTGC |
| Mcp5 R T7 | CGATGTTAATACGACTCACTATAGGGCTGGTGAAGTGTTTGCAGG |
Download links
A two-part list of links to download the article, or parts of the article, in various formats.
Downloads (link to download the article as PDF)
Open citations (links to open the citations from this article in various online reference manager services)
Cite this article (links to download the citations from this article in formats compatible with various reference manager tools)
Altered paracrine signaling from the injured knee joint impairs postnatal long bone growth
eLife 6:e27210.
https://doi.org/10.7554/eLife.27210


