Learning and recognition of tactile temporal sequences by mice and humans
- University of Sussex, United Kingdom
- Instituto de Neurociencias, Consejo Superior de Investigaciones Científicas-Universidad Miguel Hernández, Spain
Figures
Figure 1
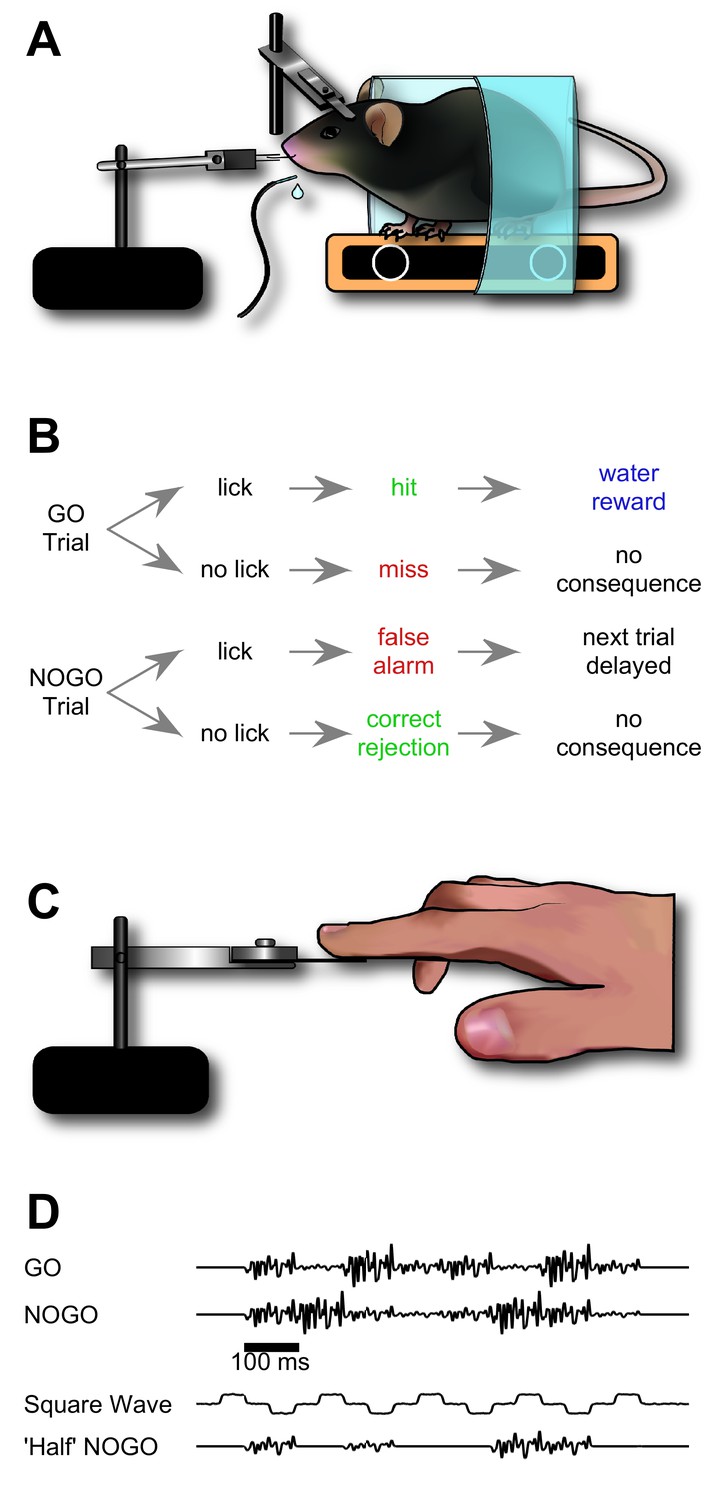
Design of sequence recognition task for mice and humans.
(A) Illustration of the treadmill-based behavioural and stimulus delivery setup for head-fixed mice. (B) Block diagram representing the structure of the GO/NO-GO paradigm. On GO trials, a mouse licking the water spout within the response period (hit) was rewarded with a water droplet. If the mouse licked on a NO-GO trial (false alarm), the next trial was delayed by 2–5 s. (C) Illustration of the stimulus delivery setup for human experiments. (D) Stimulus sequences for GO/NO-GO discrimination and intermediate ‘shaping’ sequences used for training.
Figure 2
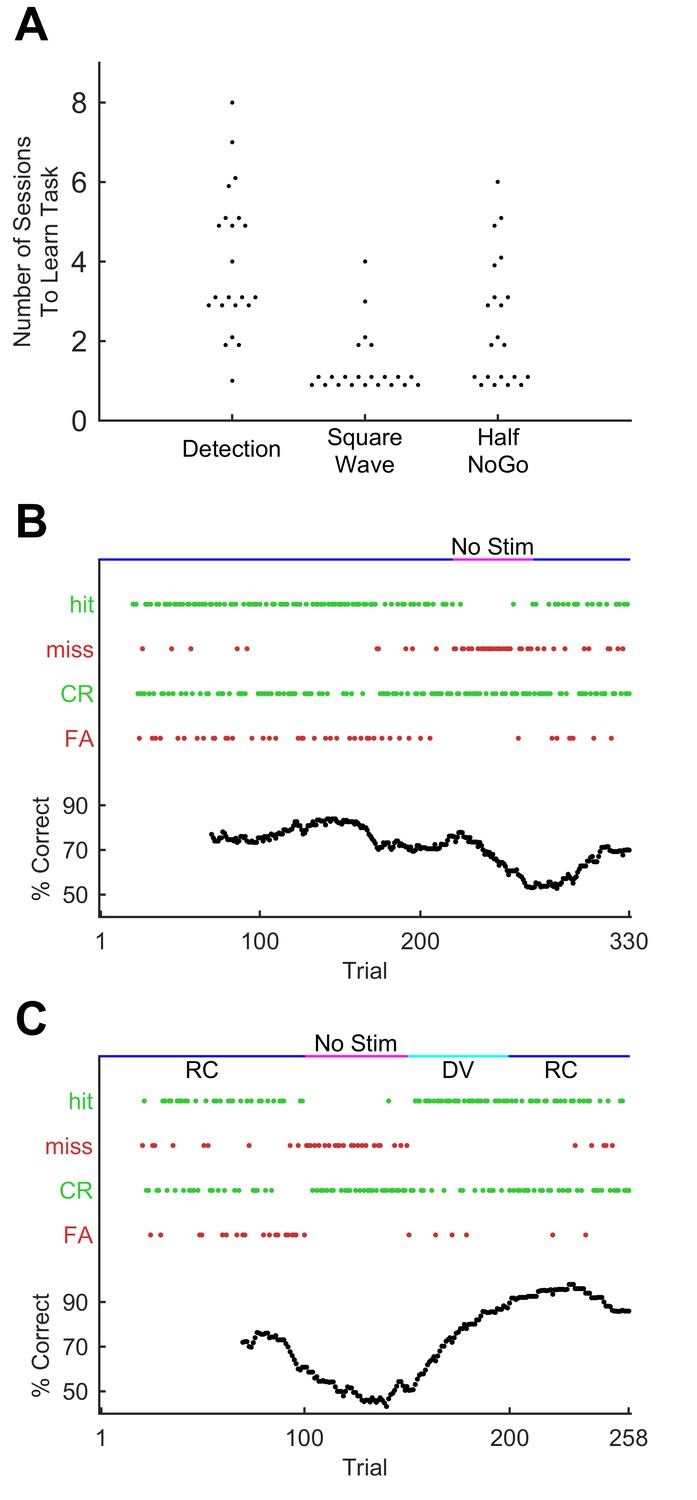
Progression through sequence learning in mice.
(A) Number of training sessions needed to learn different training stages (75% performance criterion). Each dot, one mouse. Dots are jittered for visualisation. (B) Performance metrics for an example training session (discrimination of the GO sequence from square wave). Correct trials are green dots, incorrect are red dots. Performance quantified as % correct over a 50-trial moving window (bottom). Whisker dependency on the task was verified by removing the actuator at trial 220 (fuchsia bar) and reinserting (blue bar) at trial 270. Apparent delay in performance is caused by 50-trial averaging. (C) Performance for an example session with stimulus rotation (GO sequence versus square wave discrimination). Main symbols as for B. Stimuli were delivered, as normal, first in the rostro-caudal axis (RC; blue bar) but following a brief period of stimulator removal (fuchsia bar), in the dorso-ventral (DV; cyan) axis for 50 trials. Stimulation then returned to RC for the remainder of the session.
-
Figure 2—source data 1
This zip archive includes all files used for generating the figure.
Fig2.m is the Matlab script for plotting the data. m099_22-may-2015_alltrialdata_matrix.mat and 2987_22-feb-2016_alltrialdata_matrix.mat contain the trial by trial response outcomes used to construct the performance data in panels B and C. figure2a.mat, figure2b.mat and figure2c.mat contain all other Matlab variables needed for panels A, B and C respectively.
- https://doi.org/10.7554/eLife.27333.004
Figure 3
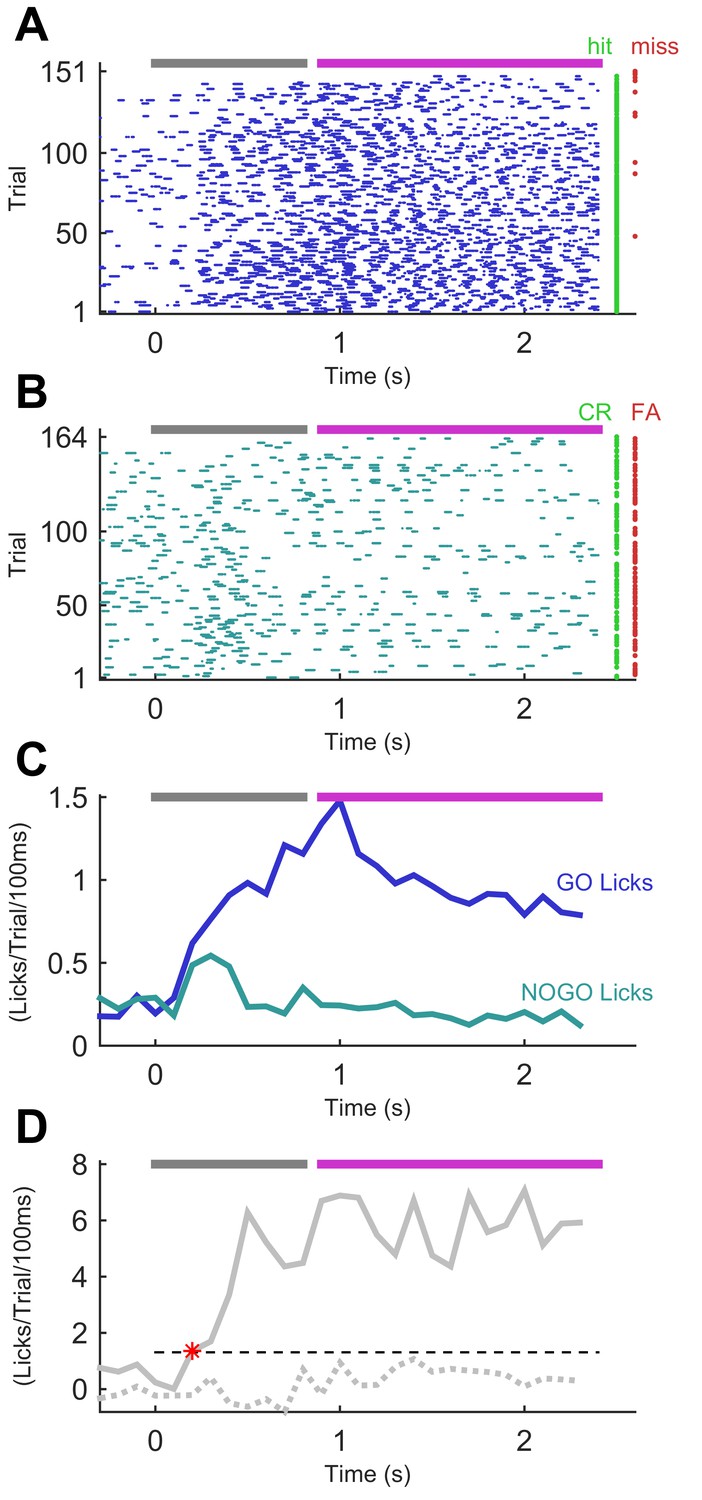
Performance of a trained mouse in a sequence recognition session.
(A) Lick time raster plot for GO trials in an example session on the final stage of training (GO vs ‘full’ NO-GO). Licks are referenced to the start of the sequence, which lasts 800 ms (grey bar at top). The response period (fuchsia bar) opens after the end of stimulation. Water was only available in the response period. Hit and miss trials (rows) marked with green and red dots, respectively. (B) Lick time raster plot for NO-GO trials of same session as A. Green dots denote correct rejection trials, red dots false alarm trials. Other symbols as for A. (C) Smoothed average of lick rate signals per trial from A and B. Dark blue, GO trials. Teal, NO-GO. (D) Difference of lick rate plots. Continuous thick line is true difference between lick rates on GO and NO-GO trials from the best 50-trial moving window from C. Broken line is average of 50 repeats of differences between randomly drawn trials. Dashed threshold line is 95% confidence interval of lick rate values from the 50 repeats. Asterisk denotes the time when the true lick rate difference surpassed the 95% CI, termed discriminative lick latency. This is an upper bound on the animal’s time to discriminate sequence identity.
-
Figure 3—source data 1
This zip archive includes all files used for generating the figure.
Fig3.m is the Matlab script for plotting the data. M058_12-Aug-2014_alltrialdata.mat contains trial by trial data including lick times, used to construct the lick rasters in panel A and B. Matlab script for making the lick rasters and histogram is in lick_rasters.m, and script for computing discrimination lick latency is in latency_analysis.m.
- https://doi.org/10.7554/eLife.27333.006
Figure 4
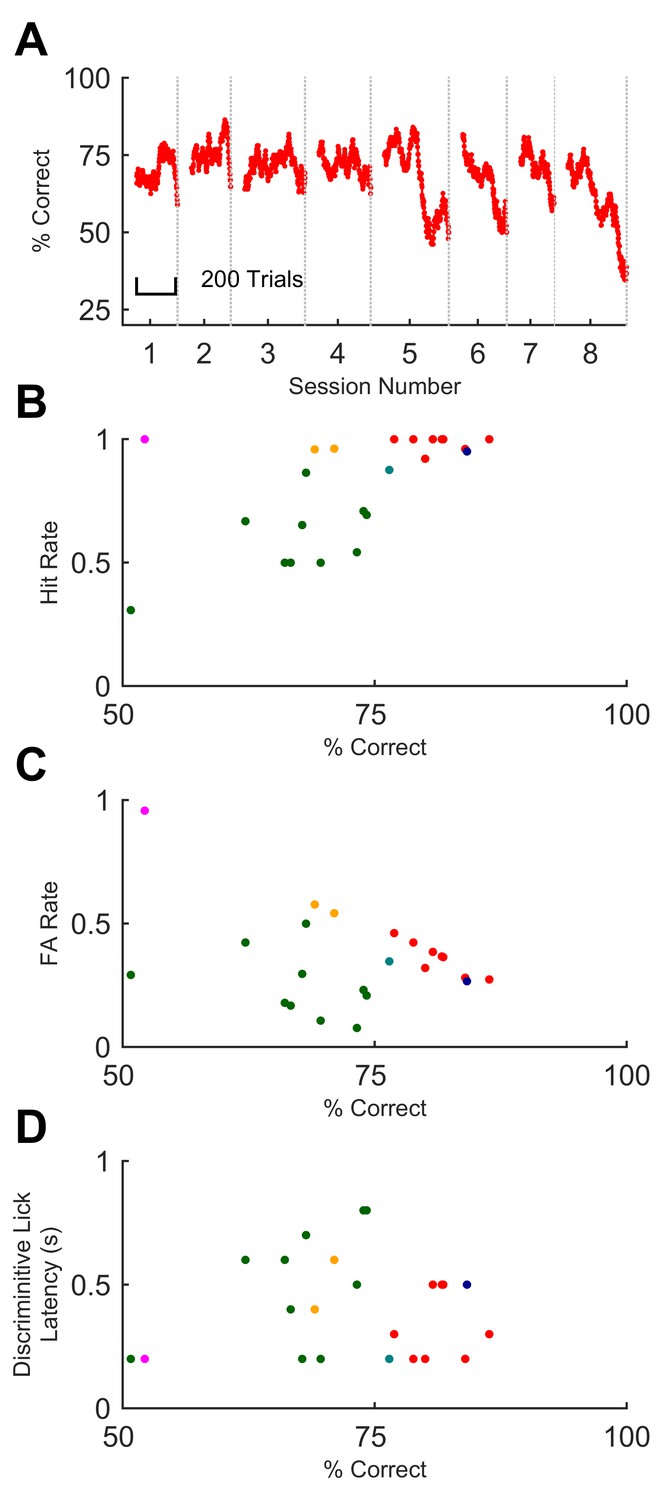
Sequence recognition performance across mice.
(A) Performance on full sequence recognition task across 8 successive behavioural sessions for one mouse. Performance is averaged over a 50-trial moving window. Colour corresponds to colour of same mouse in panels B-D. (B) Hit rate plotted against % correct for all sessions on full task. Each dot, one session on GO vs full NO-GO; each colour depicts a different mouse (n = 6). (C) False alarm rate plotted against % correct. Symbols as for B. (D) Discriminative lick latency plotted against % correct.
-
Figure 4—source data 1
This zip archive includes all files used for generating the figure.
Fig4.m contains the Matlab script for constructing the figure. behaviour_fulltask_database.m contains an associated experiment database used for plotting the data. M058_fulltaskdata.mat is the session by session, trial by trial response outcome data used to calculate performance for the example mouse in panel A. fulltask_data_june.mat contains the performance for all mice used in panels B, C and D. fulltask_latency_data.mat contains the latency data for panel D.
- https://doi.org/10.7554/eLife.27333.008
Figure 5
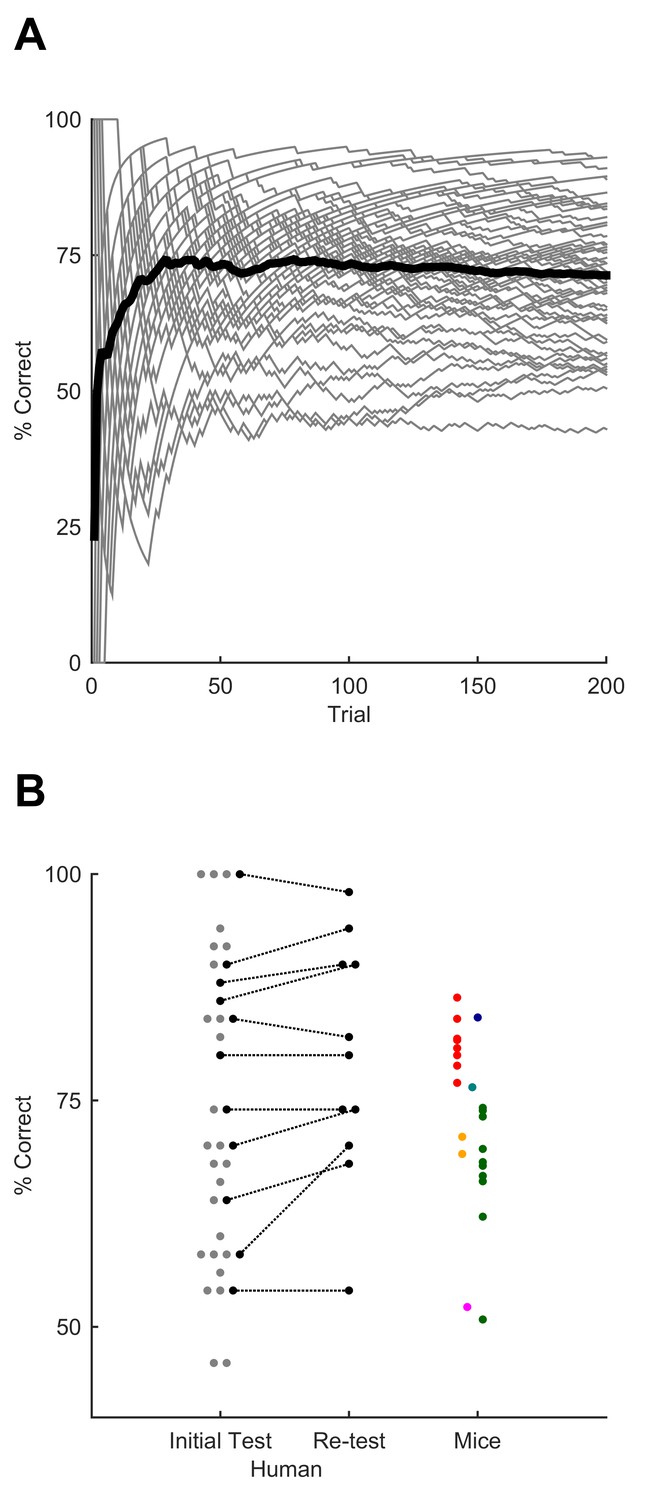
Sequence recognition performance across humans.
(A) Performance over the course of the first training session, measured as % correct averaged over 50-trial moving window. Grey lines, individual participants. Black line, average over participants. (B) Performance for best 50-trial window on initial test session after training and (on a subset of participants) upon retesting after a minimum of one week. Each grey dot, one human participant; black dots, participants tested on both sessions. Coloured dots, performance on individual sessions for mice, replotted from Figure 4 for comparison (each mouse, one colour; colours as for Figure 4). Dots are jittered along x axis for visualisation.
-
Figure 5—source data 1
This zip archive includes all files used for generating the figure.
Fig5.m contains the Matlab script for making the figure. figure5a.mat and figure5b.mat contain the data used for constructing performance values in panels A and B. full_task_data_june.mat (same as for Figure 4—source data 1) contains performance values for all mice in the comparable experiment. colorblind_colormap.mat contains a colorblind appropriate colormap for displaying the mouse data.
- https://doi.org/10.7554/eLife.27333.010
Figure 6
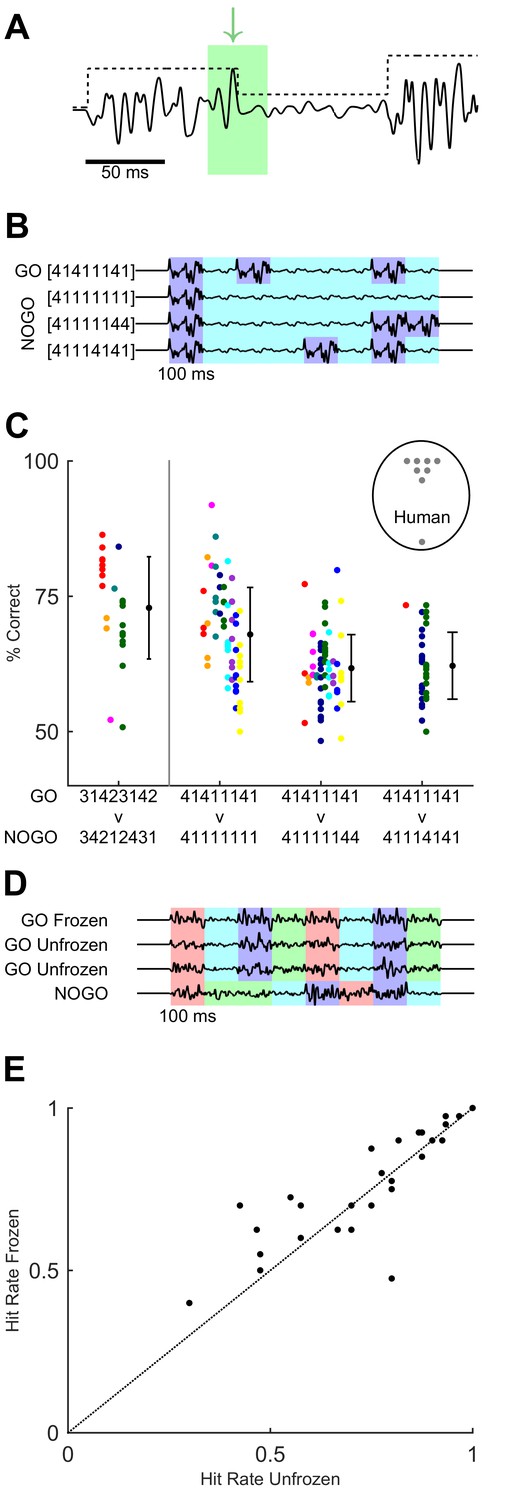
Variants of task design to test for behavioural use of cues.
(A) Cues within the GO sequence (black line) that could allow recognition of sequence identity. An example of a local cue (within green box) is the large isolated transient ‘landmark’ (green arrow) immediately followed by a low amplitude syllable. In contrast, global cues involve changes in integrated stimulus amplitude over time, as reflected in the amplitude modulation envelope (black dotted line). (B) Binary sequences distinguishable based on syllable ordering or the durations of small-amplitude epochs. Different colours indicate epochs of large and small noise amplitude. (C) Performance on task variants using binary sequences, compared to original GO vs full NO-GO design (leftmost data point, replotted from Figure 4 and 5 with same colour assignment). Each colour depicts a mouse. Black dots and error bars, grand average and SD for each task. Grey dots in labelled circle depict performance of individual human participants on [4 1 4 1 1 1 4 1] vs [4 1 1 1 4 1 4 1]. (D) Sequences used to test effect of fixed ‘landmarks’. Frozen GO used an identical waveform across syllables, trials and sessions. Unfrozen GO maintained the same sequence of noise amplitudes (indicated by colour coding) but varied the detailed waveform across syllables, trials and sessions. NO-GO scrambled the order of syllables, i.e. the sequence of noise amplitudes. (E) Hit rate of humans on frozen and unfrozen GO trials. Each dot, one participant and session.
-
Figure 6—source data 1
This zip archive includes all files used for generating the figure.
Fig6.m is the Matlab script for constructing the figure. figure 6a.mat contains stimulus waveform data for making the schematic in panel A. noises_easy_apr16.mat contains the stimulus sequences for the task variants shown in panel B. figure6c_easy.mat contains mouse performance for the task variants in panel C. fulltask_data_june.mat (same as for Figure 4—source data 1) contains mouse performance data for the original task. data_fig6C_human.mat contains human performance data for panel C. figure6d.mat contains the frozen and unfrozen sequence waveforms in panel D. figure 6e.mat contains human hit rates on the task with frozen and unfrozen GO sequences, plotted in panel E.
- https://doi.org/10.7554/eLife.27333.012
Additional files
-
Source code 1
This zip archive includes files used for generating, plotting and loading stimuli and for controlling the behavioural task.
Figure1_sequence_generation.m contains Matlab script for generating GO and NO-GO sequences. sequence.m is the main Matlab script for interfacing with TDT ActiveX to control the behaviour: this loads parameters and reads task parameters at the end of a trial. GUI_sequence_v7.fig and GUI_sequence_v7.m are graphical user interface files for monitoring and changing parameters. plot_sequence_v2_3 .m is the Matlab script for plotting task results during the session. LoadRP2.m contains Matlab/ActiveX script to connect to the TDT RP2.1. Finally, TDT_circuit_file.txt contains the TDT ActiveX circuit for controlling the task, exported to C language.
- https://doi.org/10.7554/eLife.27333.013
Download links
A two-part list of links to download the article, or parts of the article, in various formats.
Downloads (link to download the article as PDF)
Open citations (links to open the citations from this article in various online reference manager services)
Cite this article (links to download the citations from this article in formats compatible with various reference manager tools)
Learning and recognition of tactile temporal sequences by mice and humans
eLife 6:e27333.
https://doi.org/10.7554/eLife.27333


